Research Articles

Influences of agricultural phenology dynamic on land surface biophysical process and climate feedback

  • LIU Fengshan , 1, 2 ,
  • CHEN Ying 2 ,
  • SHI Wenjiao 1, 3 ,
  • ZHANG Shuai 1, 3 ,
  • Tao Fulu , 1, 3, * ,
  • GE Quansheng , 1, 3, *
Expand

*Corresponding author: Tao Fulu, Professor, E-mail:;Ge Quansheng, Professor, E-mail:

Author: Liu Fengshan, PhD, specialized in agricultural meteorology and regional climate change. E-mail:

Received date: 2017-03-05

  Accepted date: 2017-04-13

  Online published: 2017-09-05

Supported by

China Postdoctoral Science Foundation, No.2016M601115

National Natural Science Foundation of China, No.41571088, No.41371002

Copyright

Journal of Geographical Sciences, All Rights Reserved

Abstract

Response and feedback of land surface process to climate change is one of the research priorities in the field of geoscience. The current study paid more attention to the impacts of global change on land surface process, but the feedback of land surface process to climate change has been poorly understood. It is becoming more and more meaningful under the framework of Earth system science to understand systematically the relationships between agricultural phenology dynamic and biophysical process, as well as the feedback on climate. In this paper, we summarized the research progress in this field, including the fact of agricultural phenology change, parameterization of phenology dynamic in land surface progress model, the influence of agricultural phenology dynamic on biophysical process, as well as its feedback on climate. The results showed that the agriculture phenophase, represented by the key phenological phases such as sowing, flowering and maturity, had shifted significantly due to the impacts of climate change and agronomic management. The digital expressions of land surface dynamic process, as well as the biophysical process and atmospheric process, were improved by coupling phenology dynamic in land surface model. The agricultural phenology dynamic had influenced net radiation, latent heat, sensible heat, albedo, temperature, precipitation, circulation, playing an important role in the surface energy partitioning and climate feedback. Considering the importance of agricultural phenology dynamic in land surface biophysical process and climate feedback, the following research priorities should be stressed: (1) the interactions between climate change and land surface phenology dynamic; (2) the relations between agricultural phenology dynamic and land surface reflectivity at different spectrums; (3) the contributions of crop physiology characteristic changes to land surface biophysical process; (4) the regional differences of climate feedbacks from phenology dynamic in different climate zones. This review is helpful to accelerate understanding of the role of agricultural phenology dynamic in land surface process and climate feedback.

Cite this article

LIU Fengshan , CHEN Ying , SHI Wenjiao , ZHANG Shuai , Tao Fulu , GE Quansheng . Influences of agricultural phenology dynamic on land surface biophysical process and climate feedback[J]. Journal of Geographical Sciences, 2017 , 27(9) : 1085 -1099 . DOI: 10.1007/s11442-017-1423-3

1 Introduction

Land surface processes and climate are tightly coupled. The distribution of vegetation and associated land surface characteristics are strongly controlled by the climate, and the climate is modulated by land surface processes through which surface features change the exchange of energy and water in the boundary layer and the chemical composition of the atmosphere (including CO2, CH4, and O3). Previous studies highlight the impacts of global change on land surface processes; however, the feedbacks of land surface processes to climate change are poorly understood (Bright et al., 2015). Affected by global climate change (e.g., increased temperature and precipitation variability) and human management (e.g., land use and land management changes), surface processes have become an important driver of climate change at local, regional, and global scales with elevated variation ranges and intensities (Pielke et al., 2007; Kowalczyk et al., 2016; Liu et al., 2016a; Liu et al., 2016b). Surface process dynamics further regulate the structure and function of an ecosystem via long-term impacts on climate (McGuire et al., 2006) and potentially threaten the food safety and quality of life of human beings. A deep understanding of the influences of land surface dynamics on surface biophysical processes and climate feedbacks is expected to improve studies of the interaction between global change and land surface processes.
Closely related to human life, farmland is one of the ecosystems most frequently disturbed by climate change and human activity. Methods to increase grain production, including increases in farmland area and per unit yield, have greatly changed the surface processes of agricultural ecosystems. Previous studies have shown that land management and land cover changes have impacts of similar magnitude on the surface temperature via surface albedo and roughness mechanisms (Luyssaert et al., 2014) and that specific management measures exert modulations on temperature, precipitation, and the atmospheric environment in a given period primarily via surface energy partitioning mechanisms (Lobell et al., 2006; Zhang et al., 2013; Jeong et al., 2014; Bagley et al., 2015; Mueller et al., 2016). The demand for grain will continue to increase due to population growth and rising living standards in the future. The primary method to protect food production security will be to improve the yield per unit area under the conditions of limited land resources and scarce high-yield farmland. The regulation function and spatial-temporal characteristics regarding the influences of agricultural phenology dynamics on land surface biophysical processes and climate feedbacks are therefore an important subject when mitigating climate change and securing food safety.
Phenology is an important concept in the description and digital expression of an ecological system. Much attention had been paid to the contribution of natural phenology, especially, in forests, to surface biophysical processes and climate feedbacks (Penuelas et al., 2009; Korner and Basler, 2010; Dai et al., 2013). The advanced leaf-out of temperate forests, boreal forest, Mediterranean shrubs and grass control many feedbacks of vegetation to the climate system by influencing the seasonality of albedo, surface roughness length, canopy conductance, and fluxes of water and energy (Richardson et al., 2013). Less effort has been made to discuss the influence of agricultural phenology on surface biophysical processes and climate feedbacks. By defining the critical sowing, seedling, flowering, mature, and harvest periods, agricultural phenophase provide an objective research basis for human controlled ecosystems. In the study of surface biophysical processes, agricultural phenophases are closely tied to surface processes, the heat and water balance, and material exchanges between crop-air boundaries. For example, the interannual dynamics of the agricultural phenophase is closely related to the normalized difference vegetation index (NDVI) and the leaf area index (LAI) (Guillevic et al., 2002). Maize albedo was different in the germination, flowering, and mature stage and influenced by the planting date (Oguntunde and van de Giesen, 2004). The simulation accuracy of the heat, water, and carbon budget in agro-systems depended on simulation errors of the crop phenology in land surface process models (Chen et al., 2015).
Agricultural phenology, by controlling the exchange of materials, heat, and momentum at the air-land boundary, not only provides a basis for studying the history of climate change but also influences the degree and direction of future climate change. Ge et al. (2014) reconstructed the spring phenology index over the past 170 years in East China; this variation provides critical information for the relationship between plant phenology and influence of long-term climate change on surface biophysical processes (Zheng et al., 2015). Coupling static and dynamic phenology in the CanESM2 model shows that a longer growing season causes higher plant productivity and biomass. The dynamic phenology resulted in a warmer spring controlled by the decreased surface albedo in North America and offset the fertilization effect of carbon dioxide via a temperature increase and a rainfall reduction under the RCP8.5 scenario (radiant energy increased by 8.5 W m-2 by 2100) in southeastern America (Garnaud and Sushama, 2015). These study results highlight the importance of dynamic phenology in climate feedbacks via biophysical processes.
This paper reviews the following aspects concerning the agricultural phenology dynamics: the existence of agricultural phenology dynamics, the expression of agricultural phenology in land surface process models, and its influence on surface biophysical processes and climate feedbacks. Four problems are also refined for future studies. This review highlights the importance of surface phenology dynamics in land surface processes and atmospheric circulation models.

2 Existence of agricultural phenology dynamics

Wheat, maize, and soybeans are the most widely planted crops (Leff et al., 2004). According to data on crop production and harvest areas, the world’s five main grain production bases and crops include maize in the Midwestern United States, soybeans in southeastern South America, maize in West Africa, and wheat in Central and East Asia (Bagley et al., 2012). However, studies of the phenological characteristics of these three crops have been concentrated in developed agricultural areas such as China, America, and Europe, and less progress has been made in West Africa and Central Asia (Table 1). The observed data in these regions showed that the phenological phenomenon of wheat, maize, and soybeans had changed significantly over the past half century. For example, the planting dates of maize and soybean advanced by 10 days and 12 days, respectively, from 1981-2005 in America (Sacks and Kucharik, 2011), and the planting dates for European maize and corn were nearly 3 weeks earlier (Chmielewski et al., 2004; Olesen et al., 2012; Oteros et al., 2015). Statistical analyses of the phenology observation data had reached significant levels at China’s agricultural meteorological sites (Tao et al., 2012; 2014; Xiao et al., 2013; 2015; 2016; Wang et al., 2016). The consistent change rule of agricultural phenology includes the advancement of planting dates and the lengthening of the filling period (Sacks and Kucharik, 2011; Olesen et al., 2012; Tao et al., 2014). Prolonged filling period increases the time of accumulation for organic matter, and advanced planting date benefits the extension of the crop growth period and improves the process of dry matter fixation. The variations in magnitudes were different for different regions. However, this does not alter the fact that agricultural phenology change exists, but rather provides a strong motivation to explore its mechanisms.
Table 1 Characteristics of phenological change and controlling factors for staple crops around the world
Country Crop Phenology variation Drivers
China (Tao et al., 2012; Xiao et al., 2013; 2015) Winter wheat Sowing, seedling, and dormant stage delayed by 1.5, 1.7, and 1.5 days/decade, respectively.
Spring green up, flowering, and mature stage advanced by 1.1, 2.7, and 1.4 days/decade, respectively.
Increased temperature reduces the growth period, variety renewal with higher GDD extends the reproductive stage, and reduced day length extends the vegetative period.
China (Tao et al., 2014; Wang et al., 2016; Xiao et al., 2016) Summer maize 36.6% of sites with extended mature stage, and 41.1% of sites with extended growth period.
Reproductive growth period extended by 2.4-3.7 days/decade.
Increased average temperature shortens the growth period.
Variety renewal delays the flowering and mature stages.
Advancement of planting date to adapt to increased temperature.
China (Wang et al., 2016) Maize Advanced planting, jointing, and flowering stages.
Delayed mature stage.
Shortened vegetative period.
Prolonged reproductive period.
Global warming speeds up the development of maize and shortens the growth period.
Precipitation reduces growth period to a certain extent.
Variety renewal extends growth period.
America (Sacks and Kucharik, 2011) Maize Sowing stage advanced by 4.2 days/decade.
Duration from sowing to harvest increased by 5 days/decade.
Duration from mature to harvest shorted by 3 days/decade.
GDD increased by 14% in the reproductive stage.
Maize variety with longer growth period.
Interaction with more irrigation, added fertilizer, and variety renewal.
America (Sacks and Kucharik 2011) Soybeans Sowing stage advanced by 4.9 days/decade.
Harvest stage advanced by 4.9 days/decade.
Higher temperature in favor of sowing advancement and long duration of maturity.
Variety renewal with longer reproductive period.
Northern and Central Europe (Olesen et al., 2012) Gramineae (wheat, oats, and maize) Sowing stage advanced by 1-3 weeks.
Flowering and mature stages advanced by 1-3 weeks.
Model parameter setting based on 1500 site records: development from sowing to flowering stage depends on temperature and day length for oat and wheat and on temperature for maize and development from flowering to mature stage depends on temperature.
Spain (Oteros et al., 2015) Cereal crops (oats, wheat, rye, barley, and maize) Phenology in spring advanced for winter wheat.
Flag leaf sheath swelling advanced by 30 days/decade.
Flowering stage advanced by 10 days/decade.
Temperature prior to certain phenology was the main factor.
Human intervention mitigates the impact of phenology change on yield.
Germany (Chmielewski et al., 2004) Maize Sowing, seedling, and initial harvest stages advanced by 1.7, 3.3, and 1.3 days/decade, respectively.
Duration from sowing to seedling reduced by 1.6 days/decade.
Duration from seedling to harvest increased by 2.1 days/decade.
Increased spring temperatures make sowing in advance possible.
Strong warming in May accelerates plant growth and imposes serious effects on the seedling stage.
Kazakhstan (de Beurs and Henebry, 2004) Wheat NDVI peak 4-7 days in advance. Increased GDD.
Collapse of the Soviet Union.
The main reasons of agricultural phenology dynamics include global climate change represented by temperature increases and artificial management measures represented by variety renewal (Mirschel et al., 2005; Eyshi Rezaei et al., 2017). The raising temperature has made it possible to advance the planting date in spring and delay the harvest in autumn. However, the development rates of crops and the accumulation of the growing degree day (GDD) have also been sped up, which shortens the duration between sowing and maturity and potentially threatens the yield output with increasing temperatures. Purposefully selecting crop variety with longer growth periods and higher demand for the GDD will effectively extend the growth season and make full use of the increasing agricultural climate resources (Zhou, 2015). For the purpose of yield improvement, the extension of the reproductive stage, matched with proper management measures such as fertilization, irrigation, and plant density, is a pronounced characteristic of agricultural phenology. The raising temperature dominates the agricultural phenology fluctuation in areas with less human intervention (e.g., Kazakhstan (de Beurs and Henebry, 2004)), whereas human activities offset or even reverse the negative effects of climate and gain in yield by prolonging specific key development stages in agriculture-advanced regions. The phenology of winter wheat and summer maize are simultaneously influenced by the rotation system in China, which means that winter wheat can only be sowed after the harvest of summer maize in the late autumn and summer maize can only be seeded after winter wheat is reaped in the late spring. Therefore, the agricultural phenophase is influenced by the previous cereal.

3 Monitoring of agricultural phenology dynamics and its digital expression in land surface process models

The monitoring methods of agricultural phenology dynamics primarily include ground observation method, remote sensing monitoring method, and model simulation method (Fan et al., 2016). Ground observation method, which has the advantages of high time precision and easy operation and the disadvantage of spatial-temporal limitations, is the basic methodology of phenology studies, which uses artificial survey approach to record the crop growth rhythm at individual and small area scales (Schwartz et al., 2006). Remote sensing monitoring method is rooted in the nature of the emission, reflection, and absorption of electromagnetic waves for all target objects. The surface spectrum information of crop population characteristics can be perceived by sensors. This method needs to be combined with ground observation data for localization and contains certain errors (Chen and Wang, 2009; Ge et al., 2010). Model simulation method refers to the physiological mechanisms of plant growth rhythms at the individual and population level and the establishment of a phonological model to study the spatial-temporal variation of plant phenology. The parameterization and digitalization of agricultural phenology provides a convenient pathway to examine the interactions between the environment and phenology and is helpful to uncover the mechanisms of crop growth. Errors are the main obstacle in models simulating surface phenology dynamics (Morin et al., 2009).
The data and processes obtained from ground observation and remote sensing monitoring methods are affected by external environmental factors, and the resulting uncertainty makes it difficult to verify the role of phenology in surface biophysical processes and climate feedbacks. Model simulation method is commonly used in land surface process and climate change studies, which has an obvious advantage for the digital expression of crop growth (Gervois et al., 2004; Chen et al., 2015). At the spatial scale, model simulation method can meet the requirements of various scales from micro, local, and regional to the global scales used in atmospheric studies and provides matter and energy fluxes in the boundary layer inside and outside the research area due to lateral exchanges. At the temporal scale, not only can the contribution of historical phenology changes be analyzed but also guidance can be provided for the direction of crop planting and the regulation of climate change trends in the future.
Environmental and artificial control schemes are the two primary methods to express agricultural phenology dynamics in land surface process models. Environmental control schemes are based on the relationship between environmental variables (especially, the meteorological environment) and phenology; a specific phenophase will occur when the environmental variables reach a certain threshold. GDD and day length are the key factors for controlling crop growth. In the CLM3.5-CornSoy model, the development from the seedling, leaf-out, to filling stages of maize and soybeans is controlled by GDD, whereas the harvest is controlled by the day length (Chen et al., 2015). The development of winter wheat is subject to temperature, jarovization, and the light cycle (Wang and Engel, 1998). The crop’s germination and subsequent progress is set by the GDD and the planting date in the SiBcrop model (Lokupitiya et al., 2009; Lei et al., 2010). Artificial control schemes refer to parameters which stay constant under external environmental conditions but are determined by the model developer and user. For example, the threshold value of the GDD for specific phenophases is different and is set according to the actual situation or research objective (Chen et al., 2015). The parameters, including the optimum and extreme temperatures used in the GDD calculation and the conversion criteria of agricultural phenology, have subjectively settled attributes and values according to the region (Tsarouchi et al., 2014).
The existing simulation model of agricultural phenology and growth usually has a detailed algorithm for the phenological characteristics and physiological processes. Examples include the CROPGRO and CERES crop models, with detailed physiology and phenological characteristics, which can be used to estimate the photosynthesis, dry matter distribution, and heat and water fluxes driven by weather, soil, and management data (Shi et al., 2012). Gervois et al. (2004) and de Noblet-Ducoudr´e et al. (2004) coupled a crop model (STICS) with a global dynamic vegetation model (ORCHIDEE), the simulation accuracy of the carbon and water exchange was improved by outputting more reliable growth processes of maize, wheat, and soybeans. The development of crop models provides a convenient method for the digital expression of the phenology and quantitative feedbacks to the environment.

4 Impacts of agricultural phenology dynamics on surface biophysical processes

The impacts of coupling surface phenology processes with land surface models are multifaceted. First, the phenology forms the basis parameters of the crop growth. Coupled crop models express the growth and development processes of crops, which involve the development of phenophases and morphology. Phenophase development refers to the changes in the growth stages and biomass distribution patterns. Morphology development refers to the beginning and ending of various organs in the life cycle of a crop and provides information concerning leaves, tiller, and grain (Chen and Xie, 2011). Second, phenology dynamics result in changes in the surface processes. The partitioning of photosynthetic carbon into parts of a crop is closely associated with the seasonal development stages in models (Lei et al., 2010), where partitioning into roots changes the processes of the soil water supply; partitioning into leaves changes the LAI and canopy structure; partitioning into the stem changes the plant height; and partitioning into fruits constrains the changes of other organs and surface characteristics. Phenology, by controlling the crop LAI and structure, is therefore an important factor in surface morphological processes. Third, physiological characteristics are also affected by the phenology. In particular, the canopy conductance and Rubisco activity are major mechanisms for photosynthesis, respiration, and evaporation in models (Lokupitiya et al., 2009; Tsarouchi et al., 2014). Therefore, agricultural phenology dynamics exert a large impact on both morphological and physiological parameters and provide a computational basis for LAI, surface albedo, radiation budget, and moisture movement at a certain precision in land surface process models.
Responses of surface biophysical processes to agricultural phenology dynamics have the following basic characteristics. Early in phenology, the components of surface biophysical processes (such as surface albedo, net radiation, and latent heat flux) are mostly controlled by the soil, which is less covered by leaves; however, the contribution from crop increases sharply with fast crop growth. The crop height and canopy structure are simple, the surface roughness length and zero plane displacement stay lower, and the momentum exchange process is relatively stable. In the full grown stage of phenology, the optimal status of crop height and canopy, surface roughness length, zero plane displacement, net radiation, and latent heat flux reaches a peak and the surface albedo and the sensible and ground heat fluxes are maintained at lower levels for longer times. At the end of phenology, crop physiological processes decrease significantly, which causes net radiation mainly allocated into sensible heat flux. The abscission and removal of the crop in the harvest stage sharply changes the surface biophysical processes and significantly reduces the variables of surface roughness length, zero plane displacement, and albedo, and the crop residue has a certain protective effect on the soil moisture and evaporation. The observation data of surface heat and water fluxes in winter wheat at Weishan station, Shandong province, reveal that wintering stage < heading and jointing stage < filling and mature stage for net radiation and latent heat, and that heading and jointing stage < filling and mature stage < wintering stage for sensible heat (Yuan et al., 2010). The small latent heat reflected in the winter wheat primarily allocates the net radiation into sensible heat in the winter. The more complex canopy structure and LAI seen in the filling and mature stage as opposed to the heading and jointing stage is good for the capture of solar irradiation and transpiration.
Many crop models or agricultural phenology algorithms have been coupled to land surface process models in studies of surface processes at site and regional scales. According to the collected data (Table 2), there were seven crop growth models and five agricultural phenology algorithms coupled with nine land surface process models to provide the surface dynamics of agro-ecosystems. Revised land process models have realized simulations of a variety of farming systems (e.g., monoculture, crop rotation, and fallow), za model to an agro-ecosystem is enhanced, as is the digital expression ability of the heat and water balance in different agricultural surfaces. For example, the SiBcrop model improved its simulation precision of the American wheat, soybean, and maize ecosystems and the Chinese winter wheat-summer maize rotation system (Lokupitiya et al., 2009; Lei et al., 2010).
The influence of historical phenology dynamics on surface heat and water balances can possibly be realized in land surface model simulations by including a surface phenology algorithm that provides additional details of the surface biophysical processes. Earlier planting date increased (decreased) the latent (sensible) heat flux in June and reduced the interval time from maturity to harvest by enhancing the net radiation in October in American maize fields (Sacks and Kucharik, 2011). Prolonged phenology imposed little impact on surface biophysical processes overall; however, the maximum magnitude of the change can reach 45 W m-2, -20 W m-2, and -25 W m-2 for latent, sensible, and soil heat fluxes, respectively, when the NDVI is increased by 0.1 in the Agro-IBIS model (Bagley et al., 2015). This phenomenon is due to the low proportion of phenologically changed periods in the total growth period, and the variation of the surface biophysical processes primarily occur during times of phenological fluctuation. Phenology dynamic also impacts the surface albedo. Prolonged phenology, by multiple reflections in a canopy with enhanced LAI and canopy height (Hammerle et al., 2008), decreases the surface albedo. The exposure of soil after harvest enlarges the contribution of soil reflection to the total albedo, which decreases (increases) if the soil reflection is lower (higher) (Erb et al., 2016).
Impacts of phenology dynamics on the surface energy balance via coupling with the crop model in land surface process models become an important part of climate feedbacks from surface processes. However, previous studies have focused on the influence of surface morphological changes (e.g., LAI and NDVI) on the surface albedo and heat and water balances. The dynamics of physiological characteristics and controlled energy partitioning have always been ignored, and much less attention has been given to the interaction of meteorological data and phenological changes. Under the background of climate change, changes in crop physiological characteristics are guaranteed to improve the photosynthetic efficiency at a specific phenology and production (Balota et al., 2008; Sharma and Pannu, 2008; Xiao et al., 2012; Aisawi et al., 2015; Koester et al., 2016). Changes in the stomatal characteristics, especially, at the reproductive stage via controlling the exchange of water and CO2 in the atmosphere, will certainly alter the canopy conductance and the latent ratio with the influence of meteorological conditions. A systematic study on the responses of surface biophysical processes to crop morphological and physiological changes under specific meteorological conditions will be helpful to correctly evaluate the contributions of agricultural phenology dynamics to climate change.
Table 2 Contribution of land surface and crop model coupling to understanding surface energy and water balance
Modela Crop type Result Reason
Agro-IBIS
Dynamic crop growth model(Sacks and Kucharik, 2011)
Maize and soybean in America Agricultural phenology dynamic changed the surface heat and water balance;
Earlier planting increased latent heat in June, reduced maturity-harvest duration, and increased net radiation in October.
Using GDD to express phenology change
BATS
CERES3.0 (Chen and Xie, 2011)
Farmland in China Canopy interception, transpiration, evaporation, latent and sensible heat fluxes had significantly impacted;
Decrease the systematic error of LAI and surface moisture;
Increase the simulation accuracy of surface flux.
Addition of the process of crop development and growth
BATS
CERES-Maize (Tsvetsinskaya et al., 2001)
Maize in America Latent heat changed by 30%-45%, sensible heat changed by 20%-35% with LAI changed from 5 to 1;
The contribution of evaporation and transpiration to latent was influenced by LAI.
Phenophase and organic matter accumulation and allocation process based on physiology
CLASS
Carbon and nitrogen model (Chang et al., 2014)
Farmland in Canada Increase the determination coefficient between simulated and observed data of NEP;
More rational distribution process of organic matter.
Addition of the agricultural phenological scheme and management measure
CLM
CornSoy (Chen et al., 2015)
Maize and soybean in America Closely connection between carbon flux and phenology in simulation;
Better correlation between simulated and observed data for LAI, energy and CO2 flux.
The expression of emergence-filling stage and filling-harvest stage using GDD;
Remove the restriction to maximum LAI.
CLM
Agricultural phenology model (Levis et al., 2012)
Maize, soybean and cereals in North America More real LAI, spring planting, autumn harvest in simulation;
Better representation of latent heat in lower LAI period
The seasonal dynamics of agricultural phenology and carbon allocation driven by temperature.
ISAM
Dynamic crop growth model (Song et al., 2013)
Maize-soybean rotation system America Dynamic growth model improves simulation of seasonal change of LAI, canopy height, root depth, soil moisture absorption and evaporation, fluxes of energy, water and carbon. The containment of the stress of light, water and nutrient on crop
dynamic;
Increased simulation accuracy of LAI seasonal dynamic;
Better simulation of soil moisture absorption and transpiration.
JULES
InfoCrop (Tsarouchi et al., 2014)
Farmland in India Simulation error of evapotranspiration decreased from 7.5-24.4 to 5.4-11.6 mm month-1 in wet season and from 10-17 to 2.2-3.4 mm month-1 in dry season Addition of the crop growth model
JULES
SUCROS (Van den Hoof et al., 2011)
Farmland in Europe Significantly increased correlation between simulated and measured data in farmland;
Better expression in the spatial-temporal characteristics of crop growth;
The importance of crop structure and phenology to land-air interaction.
Dynamic crop growth;
The expression of phenology from planting to harvest.
LPJ
DGVMs (Bondeau et al., 2007)
Global farmland Better expression in planting date, canopy seasonal dynamic of crop in temperate zone;
Farmland expansion decreased transpiration by 5%, and increased evaporation by 40%.
Parameterization of phenology and its connection with LAI.
ORCHIDEE
STICS (Gervois et al., 2004)
Winter wheat and maize in France and America Better simulation of evapotranspiration, biomass accumulation process in different climatic zones. Added simulation of LAI, nutrition stress, and plant height;
Improved simulation of organic matter distribution, water stress, and carboxylation.
SiB2
Agricultural phenology model (Lokupitiya et al., 2009)
Wheat, soybean, maize in America Better simulation of the beginning and ending of growth season, harvest, seasonal dynamic of
rotation system;
Increased LAI and carbon flux.
Phenological scheme and corresponding physiological
parameters for specific crop.
SiB2
Agricultural phenology model (Lei et al., 2010)
Winter wheat-summer maize rotation system in North China Plain Precisely simulation of LAI,
carbon flux, latent flux, soil water content and yield
Phenological scheme and
corresponding physiological parameters for specific crop.

Note: Land surface process model in front, crop model behind

5 Climate feedback of agricultural phenology dynamic by adjusting
surface biophysical process

Temperature-phenology response function (Kumudini et al., 2014) is usually applied to study the impacts of climate on agricultural phenology in general circulation model, such as GDD10,30, the temperature in the range of 10-30℃ is cumulated, with 10℃ subtracted, thus effective accumulative temperature is obtained as the predictive index (Gilmore and Rogers, 1958). APSIM model applies the multilinear function of temperature-phenology in the range of 0-44℃ to express the dynamic condition of corn’s phenology (Wilson et al., 1995). Parent and Tardieu (2012) established enzyme catalysis formula to express the impacts of corn genotype on temperature at high, middle and low latitudes. Although different response function and model structure have different digital results on agricultural phenology (Asseng et al., 2013; Kumudini et al., 2014), impacts of climate change on agricultural phenology have drawn academic attentions and become important interests of crop adaptation and yield prediction.
The coupling of the agricultural phenology model enhances the simulation accuracy of material exchange among earth-atmosphere boundary in the surface process model and the general circulation model and strengthens the cognition and understandings on the climatic effects of agricultural ecosystem (Betts, 2005). For instance, through vegetation transpiration effects, advanced growth of spring crop showed high inhibiting effects on the temperature rising of the East Asia (Jeong et al., 2009). Based on site and local scale data (Luyssaert et al., 2014) and model simulation results (Bagley et al., 2015), the biophysical process of the agricultural phenology period extension in temperate regions generally presents that the transpiration-cooling effects are greater than albedo-warming effects, making the temperature reduction dominated in phenology extended period. Comparing the monoculture and rotation system in the North China Plain, June is rotation’s harvest time and monoculture’s full-grown time, the differences in the two agricultural ecological systems encourage striking changes in latent heat flux, air temperature, precipitation and regional circulation (Jeong et al., 2014). The advancement of phenology changed crop’s process like transpiration effects and soil water circulation, and influenced the interannual variation of tornado by providing the atmosphere with more moisture (Raddatz and Cummine, 2003); and became the impact factor of floods through runoff process (Jackson et al., 2008). Therefore, research results prone to prove surface energy partitioning is the main impact process of agricultural phenology dynamic, and the primary mechanism of temperature, moisture and circulation variation.
Coupling the agricultural phenology model into the general circulation model not only provides more accurate data for the heat and water flux exchange in the atmosphere boundary layer, but the possibility of studying the interaction between climate and crop. The climate’s variation in seasonal, interannual and interdecadal scale influences the dynamic of land surface process, which in turn exerts feedback effects on atmosphere through boundary layer variation, and this interactive climate-phenology model reflects the correlation between climate and agricultural ecosystem in a more real manner (Betts, 2005; Song et al., 2013). Simulation results of ECHAM5 and JSBACH coupling model had showed that phenology attributed more to precipitation than soil moisture in many regions (Bali and Collins, 2015). Osborne et al. (2007) added an annual crop subroutine into the MOSES land surface process model, the atmosphere conditions and crop growth have interactive effects in this coupling model, the crop influences climate by influencing the lower atmospheric conditions, and the changed climate alters the growth and development of crop simultaneously. This model authentically simulated the impacts of climate on seasonal growth of annual crop, and presented the measured relationship between precipitation and crop yield.

6 Prospects

The framework chart of this paper is as shown in Figure 1. Influenced by global warming and management measures, the agricultural phenology had changed noticeably. The planting and filling dates advanced in respond to climate warming in spring, the reproductive period prolonged in respond to yield increase and other phenology periods changed accordingly as well. The fluctuation range of agricultural phenology can reach up to one month, so it exerts noteworthy influences on the land surface process, biophysical process and climate feedback. Coupling crop model in land surface process model and general circulation model is an important method to study the impacts of phenology variation on surface energy and water balance and boundary layer characteristics. Detailed growth and development algorithm in crop model provides accurate dynamic of agricultural phenological and physiological process, improves the expressions of the land surface dynamic process in land surface process model and general circulation model, and thereby strengthen the simulations on the biophysical processes like surface albedo, net radiation, latent heat and sensible heat and the atmospheric processes like temperature, precipitation and circulation. The quantitative research on the impacts of surface phenology dynamic on biophysical process and the interactive relationship between phenology and climate is realized.
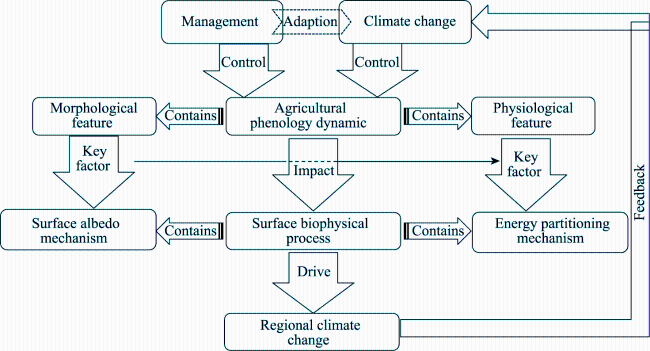
Figure 1 Flowchart of the influences of agricultural phenology dynamic on biophysical process and climate feedback
Researches performed in temperate region had showed that phenology dynamic exerted striking influences on surface energy and water balance in special times at regional scale, surface energy partitioning mechanism outweighed the albedo mechanism, and dominated the feedback effects of phenology on climate feedback. In future, the climate change in croplands calls for attentions on agricultural ecosystem’s dynamic and its climatic effects
in surface biophysical ways. The following works need to be done:
1) Optimizing land surface process model by coupling crop model and strengthening the comprehensive research on the interactive action between global change and agricultural phenology dynamic. Because of the complexity of agricultural ecosystem, the existing land surface process models are not accurate in simulating agricultural ecosystem. The development of land surface process model calls for the coupling of crop model by combining surface phenology and observation data of heat and water flux.
2) Influenced by the direct proportion of near-infrared reflectivity to LAI, surface albedo often presents positive relation with LAI in field observation (Hammerle et al., 2008). However, this kind of relationship is rarely mimiced or analyzed in model simulation results. More emphasis on the relationship between crop dynamic and surface reflectivity at different spectral bands is helpful to optimize model parameters and more accurately describe the radiation budget dynamic before and after phenology variation.
3) Phenology variation changes both morphological characteristics and physiological features of crop (Balota et al., 2008; Sharma and Pannu, 2008; Xiao et al., 2012; Aisawi et al., 2015; Koester et al., 2016). Since physiological parameters are hard to be quantized, model researches are inclined to study the influential rule of morphology. However, physiological features are the main mechanism in controlling surface energy partitioning. In the past several decades, the physiological variation caused by crop renewal and its impacts on surface energy and water balance and climatic effects are an important mechanism of biophysical process.
4) Emphasis also should be laid on the differences of climatic feedback effects from agricultural phenology dynamic in different climatic regions. For example, does surface albedo mechanism surpass energy partitioning mechanism in ice and snow covered region when studying the biophysical impacts of planting advancement. In dry and wet regions, what are the differences of climatic effects with crops phenology extension? Based on their performance, different phenology management tactics should be adopted to tackle the issue of regional warming.

The authors have declared that no competing interests exist.

[1]
Aisawi K A B, Reynolds M P, Singh R Pet al., 2015. The physiological basis of the genetic progress in yield potential of CIMMYT spring wheat cultivars from 1966 to 2009.Crop Science, 55(4): 1749-1764.Abstract Our objective was to investigate the physiological basis of genetic progress in grain yield in CIMMYT spring wheat (Triticum aestivum L.) cultivars developed from 1966 to 2009 in irrigated, high-potential conditions. Field experiments were conducted during three growing seasons in northwest Mexico (2008–2009, 2009–2010, and 2010–2011) examining 12 historic CIMMYT semidwarf spring wheat cultivars released from 1966 to 2009. The linear rate of genetic gain in grain yield was 30 kg ha611 yr611 (0.59% yr611; R2 = 0.58, P = 0.01). Grain yield progress was associated with increased aboveground dry matter (AGDM) at harvest (R2 = 0.80, P < 0.001) and heavier grain weight (R2 = 0.46, P < 0.05). There was a positive linear association between AGDM and plant height (R2 = 0.43, P < 0.05) and between grain weight and the date of complete canopy senescence (CCS) among the 12 cultivars (R2 = 0.36, P < 0.05). There was no change in grains per square meter or harvest index (HI) with year of release (YoR). Grain weight was positively associated with potential grain weight (PGW), and PGW, in turn, was positively associated with rachis length per spikelet among the cultivars. Overall spike dry matter (DM) per square meter at anthesis (GS61) +7 d did not change with YoR. There was a trend for a linear increase in AGDM of fertile shoots (expressed as g m612) at GS61 +7 d with YoR, but this was counteracted by spike partitioning decreasing overall during the 43-yr period from 0.25 to 0.23. There was a linear increase in preanthesis flag-leaf stomatal conductance with YoR (P < 0.05). There was no change in grain growth response to a degraining treatment imposed at GS61 +14 d (mean grain weight response +5.5%) indicating that the degree of source limitation to grain growth appeared to be small and unchanged in the older and modern cultivars. Generally, these results indicated that the rate of genetic progress in CIMMYT spring wheat has slowed but has not plateaued in recent decades, while genetic gains were associated with increase in both potential and final grain weight.

DOI

[2]
Asseng S, Ewert F, Rosenzweig Cet al., 2013. Uncertainty in simulating wheat yields under climate change.Nature Climate Change, 3(9): 827-832.Projections of climate change impacts on crop yields are inherently uncertain(1). Uncertainty is often quantified when projecting future greenhouse gas emissions and their influence on climate(2). However, multi-model uncertainty analysis of crop responses to climate change is rare because systematic and objective comparisons among process-based crop simulation models(1,3) are difficult(4). Here we present the largest standardized model intercomparison for climate change impacts so far. We found that individual crop models are able to simulate measured wheat grain yields accurately under a range of environments, particularly if the input information is sufficient. However, simulated climate change impacts vary across models owing to differences in model structures and parameter values. A greater proportion of the uncertainty in climate change impact projections was due to variations among crop models than to variations among downscaled general circulation models. Uncertainties in simulated impacts increased with CO2 concentrations and associated warming. These impact uncertainties can be reduced by improving temperature and CO2 relationships in models and better quantified through use of multi-model ensembles. Less uncertainty in describing how climate change may affect agricultural productivity will aid adaptation strategy development and policymaking.

DOI

[3]
Bagley J E, Desai A R, Dirmeyer P Aet al., 2012. Effects of land cover change on moisture availability and potential crop yield in the world’s breadbaskets.Environmental Research Letters, 7(1): 014009. doi: 10.1088/1748-9326/1087/1081/014009.The majority of the world’s food production capability is inextricably tied to global precipitation patterns. Changes in moisture availability—whether from changes in climate from anthropogenic greenhouse gas emissions or those induced by land cover change (LCC)—can have profound impacts on food production. In this study, we examined the patterns of evaporative sources that contribute to moisture availability over five major global food producing regions (breadbaskets), and the potential for land cover change to influence these moisture sources by altering surface evapotranspiration. For a range of LCC scenarios we estimated the impact of altered surface fluxes on crop moisture availability and potential yield using a simplified linear hydrologic model and a state-of-the-art ecosystem and crop model. All the breadbasket regions were found to be susceptible to reductions in moisture owing to perturbations in evaporative source (ES) from LCC, with reductions in moisture availability ranging from 7 to 17% leading to potential crop yield reductions of 1–17%, which are magnitudes comparable to the changes anticipated with greenhouse warming. The sensitivity of these reductions in potential crop yield to varying magnitudes of LCC was not consistent among regions. Two variables explained most of these differences: the first was the magnitude of the potential moisture availability change, with regions exhibiting greater reductions in moisture availability also tending to exhibit greater changes in potential yield; the second was the soil moisture within crop root zones. Regions with mean growing season soil moisture fractions of saturation >0.5 typically had reduced impacts on potential crop yield. Our results indicate the existence of LCC thresholds that have the capability to create moisture shortages adversely affecting crop yields in major food producing regions, which could lead to future food supply disruptions in the absence of increased irrigation or other forms of water management. (letter)

DOI

[4]
Bagley J E, Miller J, Bernacchi C J, 2015. Biophysical impacts of climate-smart agriculture in the Midwest United States.Plant Cell and Environment, 38(9): 1913-1930.Abstract The potential impacts of climate change in the Midwest United States present unprecedented challenges to regional agriculture. In response to these challenges, a variety of climate-smart agricultural methodologies have been proposed to retain or improve crop yields, reduce agricultural greenhouse gas emissions, retain soil quality and increase climate resilience of agricultural systems. One component that is commonly neglected when assessing the environmental impacts of climate-smart agriculture is the biophysical impacts, where changes in ecosystem fluxes and storage of moisture and energy lead to perturbations in local climate and water availability. Using a combination of observational data and an agroecosystem model, a series of climate-smart agricultural scenarios were assessed to determine the biophysical impacts these techniques have in the Midwest United States. The first scenario extended the growing season for existing crops using future temperature and CO2 concentrations. The second scenario examined the biophysical impacts of no-till agriculture and the impacts of annually retaining crop debris. Finally, the third scenario evaluated the potential impacts that the adoption of perennial cultivars had on biophysical quantities. Each of these scenarios was found to have significant biophysical impacts. However, the timing and magnitude of the biophysical impacts differed between scenarios.

DOI PMID

[5]
Bali M, Collins D, 2015. Contribution of phenology and soil moisture to atmospheric variability in ECHAM5/JSBACH model.Climate Dynamics, 45(9): 2329-2336.Soil moisture and phenology are seasonally varying modes of the land system. Due to their seasonal persistence, they have the ability to predictably influence seasonal weather. Hence, their use in seasonal forecasts can potentially improve the skill of the forecasts. However a complete measure of their influence in geographical locations and in different seasons is not known. As a result, modern seasonal forecasting techniques have not been able to fully exploit their persistence in improving skill of seasonal forecasts. By measuring similarity between model ensemble members that are forced by soil moisture and phenology respectively, in this study, we identify global hot spots where soil moisture and phenology impact key atmospheric variables in spring and summer seasons. Results indicate that over South East Asia (SEA) and the Sahel the phenology and soil moisture impact precipitation to an equal extent. Results show that 5-7 % of the variance in Indian summer monsoon precipitation is caused by soil moisture and phenology anomalies. Prior to the monsoon they influence predictors of the SEA monsoon. Hence, their persistence can be used to improve skill of seasonal forecasts, particularly of mesoscale systems like the SEA monsoon.

DOI

[6]
Balota M, William A P, Evett S Ret al., 2008. Morphological and physiological traits associated with canopy temperature depression in three closely related wheat lines.Crop Science, 48(5): 1897-1910.Wheat (Triticum aestivum L.) cultivars with high canopy temperature depression (CTD) tend to have higher grain yield under dry, hot conditions. Therefore, CTD has been used as a selection criterion to improve adaptation to drought and heat. The CTD is a result of the leaf's energy balance, which includes terms determined by environment and physiological traits. We hypothesized that one or more of several physiological traits contributed to consistent CTD differences among three closely-related winter wheat lines grown under dryland conditions. For three years we measured several leaf traits, including CTD, leaf dimension, gas exchange rates, and carbon-13 isotope discrimination (). Soil water content was also monitored. Data showed that daytime CTD was related to the leaf size in these wheat lines. The most drought-tolerant line, TX86A8072, had consistently smaller and narrower leaves than TX86A5606, the least drought tolerant. For TX86A8072, dryland and irrigated average noon CTD was -0.8掳C, and average flag leaf area (LA) 11 cm2, for TX86A5606, values were -1.7掳C and 12.5 cm2, respectively. However, TX86A8072 also had higher CTD (i.e., lower temperatures) than TX86A5606 at night, despite a theoretically greater sensible heat transfer coefficient, suggesting greater nighttime transpiration (T). Implications of these traits on nighttime leaf energy balance and possible adaptive roles of nighttime T are discussed.

DOI

[7]
Betts R A, 2005. Integrated approaches to climate-crop modelling: Needs and challenges. Philosophical Transactions of the Royal Society B: Biological Sciences, 360(1463): 2049-2065.

[8]
Bondeau A, Smith P C, Zaehle Set al., 2007. Modelling the role of agriculture for the 20th century global terrestrial carbon balance.Global Change Biology, 13(3): 679-706.In order to better assess the role of agriculture within the global climate-vegetation system, we present a model of the managed planetary land surface, Lund-Potsdam-Jena managed Land (LPJmL), which simulates biophysical and biogeochemical processes as well as productivity and yield of the most important crops worldwide, using a concept of crop functional types (CFTs). Based on the LPJ-Dynamic Global Vegetation Model, LPJmL simulates the transient changes in carbon and water cycles due to land use, the specific phenology and seasonal CO2 fluxes of agricultural-dominated areas, and the production of crops and grazing land. It uses 13 CFTs (11 arable crops and two managed grass types), with specific parameterizations of phenology connected to leaf area development. Carbon is allocated daily towards four carbon pools, one being the yield-bearing storage organs. Management (irrigation, treatment of residues, intercropping) can be considered in order to capture their effect on productivity, on soil organic carbon and on carbon extracted from the ecosystem. For transient simulations for the 20th century, a global historical land use data set was developed, providing the annual cover fraction of the 13 CFTs, rain-fed and/or irrigated, within 0.5 degrees grid cells for the period 1901-2000, using published data on land use, crop distributions and irrigated areas. Several key results are compared with observations. The simulated spatial distribution of sowing dates for temperate cereals is comparable with the reported crop calendars. The simulated seasonal canopy development agrees better with satellite observations when actual cropland distribution is taken into account. Simulated yields for temperate cereals and maize compare well with FAO statistics. Monthly carbon fluxes measured at three agricultural sites also compare well with simulations. Global simulations indicate a similar to 24% (respectively similar to 10%) reduction in global vegetation (respectively soil) carb

DOI

[9]
Bright R M, Zhao K, Jackson R Bet al., 2015. Quantifying surface albedo and other direct biogeophysical climate forcings of forestry activities.Global Change Biology, 21(9): 3246-3266.Abstract By altering fluxes of heat, momentum, and moisture exchanges between the land surface and atmosphere, forestry and other land-use activities affect climate. Although long recognized scientifically as being important, these so-called biogeophysical forcings are rarely included in climate policies for forestry and other land management projects due to the many challenges associated with their quantification. Here, we review the scientific literature in the fields of atmospheric science and terrestrial ecology in light of three main objectives: (i) to elucidate the challenges associated with quantifying biogeophysical climate forcings connected to land use and land management, with a focus on the forestry sector; (ii) to identify and describe scientific approaches and/or metrics facilitating the quantification and interpretation of direct biogeophysical climate forcings; and (iii) to identify and recommend research priorities that can help overcome the challenges of their attribution to specific land-use activities, bridging the knowledge gap between the climate modeling, forest ecology, and resource management communities. We find that ignoring surface biogeophysics may mislead climate mitigation policies, yet existing metrics are unlikely to be sufficient. Successful metrics ought to (i) include both radiative and nonradiative climate forcings; (ii) reconcile disparities between biogeophysical and biogeochemical forcings, and (iii) acknowledge trade-offs between global and local climate benefits. We call for more coordinated research among terrestrial ecologists, resource managers, and coupled climate modelers to harmonize datasets, refine analytical techniques, and corroborate and validate metrics that are more amenable to analyses at the scale of an individual site or region.

DOI PMID

[10]
Chang K H, Warland J S, Bartlett P Aet al., 2014. A simple crop phenology algorithm in the land surface model CN-CLASS.Agronomy Journal, 106(1): 297-308.Land surface models are useful tools for estimating the contribution and response to climate change of C dynamics in various terrestrial ecosystems. In many land surface models, plant phenological algorithms are incorporated based on field studies in forests. However, to simulate adequately the C cycle over a large area, there is a need to include and validate algorithms for other ecosystems. The Carbon and Nitrogen-coupled Canadian Land Surface Scheme (CN-CLASS) is a land surface model that has been applied successfully to the study of C stocks in forest ecosystems. The objective of this study is to incorporate a simple crop phenology algorithm into CN-CLASS and validate its ability to simulate C cycles at an agricultural site in southern Ontario, Canada. The model was validated on a corn crop (Zea mays L.) in 2005 and 2008 based on measurements of aboveground biomass and net ecosystem productivity (NEP), as well as a well-tested agricultural model, DayCENT (the daily time-step version of the CENTURY model). The modified CN-CLASS showed similar dynamics of biomass allocation compared with field measurements and DayCENT simulations. Regression analysis indicated that the modifications improved the NEP simulation for a corn field, with the coefficient of determination (R-2) relating simulated and observed NEP increasing from 0.51 in the original CN-CLASS to 0.78 in the modified model. Other crop species could be further validated to expand the model application to crop rotation studies and large areas covered by forests and crop fields in consideration of land management practices.

DOI

[11]
Chen F, Xie Z, 2011. Effects of crop growth and development on land surface fluxes.Advances in Atmospheric Sciences, 28(4): 927-944.In this study, the Crop Estimation through Resource and Environment Synthesis model (CERES3.0) was coupled into the Biosphere-Atmosphere Transfer Scheme (BATS), which is called BATS CERES, to represent interactions between the land surface and crop growth processes. The effects of crop growth and development on land surface processes were then studied based on numerical simulations using the land surface models. Six sensitivity experiments by BATS show that the land surface fluxes underwent substantial changes when the leaf area index was changed from 0 to 6 m2 m −2. Numerical experiments for Yucheng and Taoyuan stations reveal that the coupled model could capture not only the responses of crop growth and development to environmental conditions, but also the feedbacks to land surface processes. For quantitative evaluation of the effects of crop growth and development on surface fluxes in China, two numerical experiments were conducted over continental China: one by BATS CERES and one by the original BATS. Comparison of the two runs shows decreases of leaf area index and fractional vegetation cover when incorporating dynamic crops in land surface simulation, which lead to less canopy interception, vegetation transpiration, total evapotranspiration, top soil moisture, and more soil evaporation, surface runoff, and root zone soil moisture. These changes are accompanied by decreasing latent heat flux and increasing sensible heat flux in the cropland region. In addition, the comparison between the simulations and observations proved that incorporating the crop growth and development process into the land surface model could reduce the systematic biases of the simulated leaf area index and top soil moisture, hence improve the simulation of land surface fluxes.

DOI

[12]
Chen M, Griffis T J, Baker Jet al., 2015. Simulating crop phenology in the Community Land Model and its impact on energy and carbon fluxes. Journal of Geophysical Research:Biogeosciences, 120(2): 310-325.

[13]
Chen Xiaoqiu, Wang Linhai, 2009. Progress in remote sensing phenological research.Progress in Geography, 28(1): 33-40. (in Chinese)Plant phenological phenomena are the most salient and sensitive bio-indicators of the environmental change at seasonal and interannual scales. Timings of plant phenological phenomena can indicate the rapid response of terrestrial ecosystems to climate change. Since the remote sensed phenology observation is characterized by multi-temporal, broad coverage, spatial continuality, and relatively long time series, recently, it has been an important means for detecting responses and feedbacks of vegetation dynamics to global climate change. On the basis of introducing remote sensing data sets and processing methods for monitoring plant phenology, we systematically reviewed important progresses in remote sensing phenology during the last five years worldwide focusing on identification of the phenological growing season, plant phenology and climate change, plant phenology and net primary production, plant phenology and land cover, and plant phenology and crop yield estimate, and so on. Then, we pointed out some existing problems in the current research, and tried to propose some main research aspects in the near future as follows: (1) developing a kind of more general technique for identifying the phenological growing season using remote sensing data; (2) unifying surface observed and satellite derived spatial information by carrying out plant community phenology observations and selecting appropriate scale transition methods; (3) analyzing quantitatively response mechanisms of plant phenology to human activities; (4) implementing amalgamation of remote sensing data with different spatial resolutions using suitable mathematical methods and models; and (5) estimating possible responses of plant phenology to future climate change by dynamic simulations.

DOI

[14]
Chmielewski F M, Müller A, Bruns E, 2004. Climate changes and trends in phenology of fruit trees and field crops in Germany, 1961-2000.Agricultural and Forest Meteorology, 121(1/2): 69-78.Distinct changes in air temperature since the end of the 1980s have led to clear responses in plant phenology in many parts of the world. In Germany phenological phases of the natural vegetation as well as of fruit trees and field crops have advanced clearly in the last decade of the 20th century. The strongest shift in plant development occurred for the very early spring phases. The late spring phases and summer phases reacted also to the increased temperatures, but they usually show lower trends. Until now the changes in plant development are still moderate, so that no strong impacts on yield formation processes were observed. But further climate changes will probably increase the effect on plants, so that in the future stronger impacts on crop yields are likely.

DOI

[15]
Dai Junhu, Wang Huanjiong, Ge Quansheng, 2013. Changes of spring frost risks during the flowering period of woody plants in temperate monsoon area of China over the past 50 years.Acta Geographica Sinica, 68(5): 593-601. (in Chinese)The temperate monsoon area of China is an important agricultural region but late spring frosts have frequently caused great damage to plants there. Based on phenological data derived from the Chinese Phenological Observation Network (CPON), corresponding meteorological data from 12 study sites and phenological modeling, changes in flowering times of multiple woody plants and the frequency of frost occurrence were analyzed. Through these analyses, frost risk during the flowering period at each site was estimated. Results of these estimates suggested that first flowering dates (FFD) in the study area advanced significantly from 1963 to 2009 at average rates of-1.52 days decade-1 in Northeast China (P &lt; 0.01) and-2.22 days decade-1 (P &lt; 0.01) in North China. During this same period, the number of frost days in spring decreased and the last frost days (LFD) advanced across the study area. Considering both flowering phenology and occurrence of frost, the frost risk index, which measures the percentage of species exposed to frost during the flowering period in spring, showed a decreasing trend of-0.37% decade-1 (insignificant) in Northeast China and-1.80% decade-1 (P &lt; 0.01) in North China. The results indicated the frost risk in the study region decreased over the past half century, and showed remarkable regional difference. These conclusions provide important information for agriculture and forestry managers in devising frost protection schemes.

DOI

[16]
de Beurs K M, Henebry G M, 2004. Land surface phenology, climatic variation, and institutional change: Analyzing agricultural land cover change in Kazakhstan.Remote Sensing of Environment, 89(4): 497-509.Kazakhstan is the second largest country to emerge from the collapse of the Soviet Union. Consequent to the abrupt institutional changes surrounding the disintegration of the Soviet Union in the early 1990s, Kazakhstan has reportedly undergone extensive land cover/land use change. Were the institutional changes sufficiently great to affect land surface phenology at spatial resolutions and extents relevant to mesoscale meteorological models? To explore this question, we used the NDVI time series (1985–1988 and 1995–1999) from the Pathfinder Advanced Very High Resolution Radiometer (AVHRR) Land (PAL) dataset, which consists of 10 days maximum NDVI composites at a spatial resolution of 8 km. Daily minimum and maximum temperatures were extracted from the NCEP Reanalysis Project and 10 days composites of accumulated growing degree-days (AGDD) were produced. We selected for intensive study seven agricultural areas ranging from regions with rain-fed spring wheat cultivation in the north to regions of irrigated cotton and rice in the south. We applied three distinct but complementary statistical analyses: (1) nonparametric testing of sample distributions; (2) simple time series analysis to evaluate trends and seasonality; and (3) simple regression models describing NDVI as a quadratic function of AGDD. The irrigated areas displayed different temporal developments of NDVI between 1985–1988 and 1995–1999. As the temperature regime between the two periods was not significantly different, we conclude that observed differences in the temporal development of NDVI resulted from changes in agricultural practices. In the north, the temperature regime was also comparable for both periods. Based on extant socioeconomic studies and our model analyses, we conclude that the changes in the observed land surface phenology in the northern regions are caused by large increases in fallow land dominated by weedy species and by grasslands under reduced grazing pressure. Using multiple lines of evidence allowed us to build a case of whether differences in land surface phenology were mostly the result of anthropogenic influences or interannual climatic fluctuations.

DOI

[17]
de Noblet-Ducoudre N, Gervois S, Ciais Pet al., 2004. Coupling the Soil-Vegetation-Atmosphere-Transfer Scheme ORCHIDEE to the agronomy model STICS to study the influence of croplands on the European carbon and water budgets.Agronomie, 24(6/7): 397-407.Agriculture is still accounted for in a very simplistic way in the land-surface models which are coupled to climate models, while the area it occupies will significantly increase in the next century according to future scenarios. In order to improve the representation of croplands in a Dynamic Global Vegetation Model named ORCHIDEE (which can be coupled to the IPSL1 climate model), we have (1) developed a procedure which assimilates some of the variables simulated by a detailed crop model, STICS, and (2) modified some parameterisations to avoid inconsistencies between assimilated and computed variables in ORCHIDEE. Site simulations show that the seasonality of the cropland-atmosphere fluxes of water, energy and CO2 is strongly modified when more realistic crop parameterisations are introduced in ORCHIDEE. A more realistic representation of wheat and corn croplands over Western Europe leads to a drying out of the atmosphere at the end of summer and during autumn, while the soils remain wetter, specially at the time when winter crops are sowed. The seasonality of net CO2 uptake fluxes is also enhanced and shortened.

DOI PMID

[18]
Erb K H, Luyssaert S, Meyfroidt Pet al., 2016. Land management: Data availability and process understanding for global change studies.Global Change Biology, 23(2): 512-533.In the light of daunting global sustainability challenges such as climate change, biodiversity loss and food security, improving our understanding of the complex dynamics of the Earth system is crucial. However, large knowledge gaps related to the effects of land management persist, in particular those human-induced changes in terrestrial ecosystems that do not result in land-cover conversions. Here, we review the current state of knowledge of ten common land management activities for their biogeochemical and biophysical impacts, the level of process understanding and data availability. Our review shows that ca. one-tenth of the ice-free land surface is under intense human management, half under medium and one-fifth under extensive management. Based on our review, we cluster these ten management activities into three groups: (i) management activities for which data sets are available, and for which a good knowledge base exists (cropland harvest and irrigation); (ii) management activities for which sufficient knowledge on biogeochemical and biophysical effects exists but robust global data sets are lacking (forest harvest, tree species selection, grazing and mowing harvest, N fertilization); and (iii) land management practices with severe data gaps concomitant with an unsatisfactory level of process understanding (crop species selection, artificial wetland drainage, tillage and fire management and crop residue management, an element of crop harvest). Although we identify multiple impediments to progress, we conclude that the current status of process understanding and data availability is sufficient to advance with incorporating management in, for example, Earth system or dynamic vegetation models in order to provide a systematic assessment of their role in the Earth system. This review contributes to a strategic prioritization of research efforts across multiple disciplines, including land system research, ecological research and Earth system modelling.

DOI PMID

[19]
Eyshi Rezaei E, Siebert S, Ewert F, 2017. Climate and management interaction cause diverse crop phenology trends.Agricultural and Forest Meteorology, 233: 55-70.Growing evidence suggests that the warming trend observed in many parts of the world has considerably modified crop phenology during the last decades but little is known about the impact of changes in crop management on crop phenology and possible interactions with temperature increase, and whether responses can be generalized across crop types. Here we evaluate the effects of climate and management on crop phenology by using observations for winter rapeseed and winter rye obtained in Germany for the period 1960–2013 by using piecewise linear regressions of temperature and phenology data on year. We show that long-term trends in crop phenology are crop-specific. The length of the vegetative phase of winter rapeseed declined by 4.802days per decade in the period 1979–2013. However, the corresponding decline for winter rye was only 1.302days per decade in the period 1978–2013 with the difference caused by change in management practices such as the introduction of early flowering cultivars of winter rapeseed or changes in sowing date of winter rapeseed and winter rye during the last decades in Germany. The length of the reproductive phase of winter rye declined by 0.902days per decade between 1976 and 2013 in response to the warming trend in that period. In contrast, the extended use of late maturing cultivars with a longer grain filling period and changed planting densities over-compensated for the effect of increasing temperature on the length of the reproductive phase of winter rapeseed and caused an increasing trend of 2.002days per decade between 1992 and 2013. The sowing date of winter rye advanced by 1.302days per decade in the period 1972–2013. The length of the phase between maturity and harvest increased considerably for both crops and compensated partly for the effect of increasing temperature to shorten the preceding phenological phases. We conclude that it is essential to account for interactions between climate and crop management in climate change impact analysis and assessment studies and that differences among crops need to be considered.

DOI

[20]
Fan Deqin, Zhao Xuesheng, Zhu Wenquanet al., 2016. Review of influencing factors of accuracy of plant phenology monitoring based on remote sensing data.Progress in Geography, 35(3): 304-319. (in Chinese)Monitoring plant phenology with remote sensing data has important scientific value for studying the response of vegetation to climate change. A comprehensive analysis on the influencing factors of accuracy of plant phenology estimation based on principles and general technical processes of remote sensing application in vegetation monitoring was carried out by taking into account the following four aspects: the specific vegetation type and its geographical conditions; remote sensing data and pre-processing; techniques used to identify plant phenometrics; and evaluation of satellite-derived plant phenometrics. Potential methods for improving the accuracy of plant phenology monitoring are thoroughly discussed. These include: building high-resolution near-surface sensor-derived phenology observation and sharing network; developing universally applicable methods for noise removal of satellite remote sensing time-series data and reconstruction of vegetation index curves; searching more stable methods to estimate plant phenology; and exploring the possibility of synthesizing ground-based observation, remote sensing monitoring, and model simulation to achieve the spatial scaling-up of phenometrics.

[21]
Garnaud C, Sushama L, 2015. Biosphere-climate interactions in a changing climate over North America. Journal of Geophysical Research:Atmospheres, 120(3): 1091-1108.

[22]
Ge Q S, Wang H J, Zheng J Yet al., 2014. A 170 year spring phenology index of plants in eastern China. Journal of Geophysical Research:Biogeosciences, 119(3): 301-311.

[23]
Ge Quanshen, Dai Junhu, Zheng Jingyun, 2010. The Progress of phenology studies and challenges to modern phenology research in China.Bulletin of Chinese Academy of Sciences, 25(3): 310-316. (in Chinese)The establishment and development process of modern phenology in China are reviewed in this paper,and an overview of the up-to-date research progress in modern phenology is also given.Modern phenology is playing a very important role in global warming research;phenology becomes a new clue in researches of global ecology and terrestrial ecosystem carbon cycle;new technology plays important roles in modern phenology research,especially the adapting of automatic monitoring technology has resulted in great progress in the data acquiring methods;the traditional phenology observation is still of much concern,but research objects are more fine,gradually developing towards microscopic direction.As compared with the rapid developing of international phenology,the phenology researches in China are encountering unprecedented challenges.Thus,Chinese researchers in phenology will shoulder heavy responsibilities in the future,and many fundamental researches remain to be deeply conducted.

[24]
Gervois S, de Noblet-Ducoudre N, Viovy Net al., 2004. Including croplands in a global biosphere model: Methodology and evaluation at specific sites. Earth Interactions, 18: GB1009. doi: 10.1029/2003GB002108.ABSTRACT There is a strong international demand for quantitative estimates of both carbon sources/sinks, and water availability at the land surface at various spatial scales (regional to global). These estimates can be derived (and usually are) from global biosphere models, which simulate physiological, biogeochemical, and biophysical processes, using a variety of plant functional types. Now, the representation of the large area covered with managed land (e.g., croplands, grasslands) is still rather basic in these models, which were first designed to simulate natural ecosystems, while more and more

DOI

[25]
Gilmore E C, Rogers J S, 1958. Heat units as a method of measuring maturity in corn.Agronomy Journal, 50(10): 611-615.

[26]
Guillevic P, Koster R D, Suarez M Jet al., 2002. Influence of the interannual variability of vegetation on the surface energy balance: A global sensitivity study.Journal of Hydrometeorology, 3(6): 617-629.Abstract The degree to which the interannual variability of vegetation phenology affects hydrological fluxes over land is investigated through a series of simulations with the Mosaic land surface model, run both offline and coupled to the NASA Seasonal-to-Interannual Prediction Project (NSIPP) atmospheric general circulation model (GCM). Over a 9-yr period, from 1982 to 1990, interannual variations of global biophysical land surface parameters (i.e., vegetation density and greenness fraction) are derived from Normalized Difference Vegetation Index (NDVI) data collected by the Advanced Very High Resolution Radiometers (AVHRRs). First the sensitivity of evapo-transpiration to interannual variations in vegetation properties is evaluated through offline simulations that ignore feedbacks between the land surface and the atmospheric models, and interannual precipitation variations. Evapo-transpiration is shown to be highly sensitive to variations in vegetation over wet continental surfaces that are not densely vegetated. The sensitivity is reduced by a saturation effect over dense vegetation covers and physiological control due to environmental stress over arid and semiarid regions. Correlations between evapotranspiration and vegetation anomalies are reduced markedly in offline runs that impose interannual variations in both vegetation and precipitation. They are also strongly reduced in the coupled simulations. Although interannual variations in vegetation properties still influence transpiration and interception loss at the global scale in these runs, their impact on large-scale regional climate is much weaker, apparently because the impact is drowned out by atmospheric variability.

DOI

[27]
Hammerle A, Haslwanter A, Tappeiner Uet al., 2008. Leaf area controls on energy partitioning of a temperate mountain grassland.Biogeosciences, 5(2): 421-431.Using a six year data set of eddy covariance flux measurements of sensible and latent heat, soil heat flux, net radiation, above-ground phytomass and meteorological driving forces energy partitioning was investigated at a temperate mountain grassland managed as a hay meadow in the Stubai Valley (Austria). The main findings of the study were: (i) Energy partitioning was dominated by latent heat, followed by sensible heat and the soil heat flux; (ii) When compared to standard environmental forcings, the amount of green plant matter, which due to three cuts varied considerably during the vegetation period, explained similar, and partially larger, fractions of the variability in energy partitioning; (iii) There were little, if any, indications of water stress effects on energy partitioning, despite reductions in soil water availability in combination with high evaporative demand, e.g. during the summer drought of 2003.

DOI PMID

[28]
Jackson B M, Wheater H S, Mcintyre N Ret al., 2008. The impact of upland land management on flooding: Insights from a multiscale experimental and modelling programme.Journal of Flood Risk Management, 1(2): 71-80.Abstract A programme of field experiments at the Pontbren catchment in Wales has, since autumn 2004, been examining the effects of land use change on flooding. The Pontbren catchment possesses a long history of artificial drainage of its clay soils and intensification of sheep farming. Increased flood runoff has been noted within the last decades, as has the mitigating effect of trees at field scale. To examine the local and catchment-scale effects of land management within the catchment, including the potential advantages of planting additional trees, a multidimensional physically based model has been developed and conditioned on data from an intensely instrumented hillslope. The model is used to examine the effects of planting a small strip of trees within a hillslope. Results demonstrate that careful placement of such interventions can reduce magnitudes of flood peaks by 40% at the field scale. The challenges associated with upscaling these results to the Pontbren and Upper Severn catchments are discussed.

DOI

[29]
Jeong S J, Ho C H, Jeong J H, 2009. Increase in vegetation greenness and decrease in springtime warming over east Asia.Geophysical Research Letters, 36(2): L02710. doi: 10.1029/2008GL036583.This study investigates the impact of increased vegetation greening on the springtime temperature over east Asia for 1982-2000. An analysis of station-based temperature records and satellite-measure normalized difference vegetation index (NDVI) indicates that slight warming (<0.4掳C 10-yr) occurred over regions that experienced large increase in NDVI (>=0.08 10-yr). On the contrary, strong warming (>=0.8掳C 10-yr) occurred over regions that exhibited minor changes in NDVI (<0.04 10-yr). For the most part, this inverse NDVI-temperature relationship observed with the daily maximum temperature. Thus, it is suggested that the decrease in warming was mostly attributable to the increase in evapotranspiration associated with increased vegetation greening. Earlier vegetation growth may have further strengthened the effect of this vegetation-evaporation on spring temperature.

DOI

[30]
Jeong S J, Ho C H, Piao Set al., 2014. Effects of double cropping on summer climate of the North China Plain and neighbouring regions.Nature Clim. Change, 4(7): 615-619.To meet growing food demands without expanding cropland area, much of the North China Plain has moved from single to double annual cropping. Now, research shows that this change in agricultural management alters biophysical feedbacks to the climate in such a way that they can amplify summertime climate changes over East Asia.

DOI

[31]
Koester R P, Nohl B M, Diers B Wet al., 2016. Has photosynthetic capacity increased with 80 years of soybean breeding? An examination of historical soybean cultivars.Plant Cell and Environment, 39(5): 1058-1067.Abstract Crop biomass production is a function of the efficiencies with which sunlight can be intercepted by the canopy and then converted into biomass. Conversion efficiency has been identified as a target for improvement to enhance crop biomass and yield. Greater conversion efficiency in modern soybean [ Glycine max (L.) Merr.] cultivars was documented in recent field trials, and this study explored the physiological basis for this observation. In replicated field trials conducted over three successive years, diurnal leaf gas exchange and photosynthetic CO2 response curves were measured in 24 soybean cultivars with year of release dates (YOR) from 1923 to 2007. Maximum photosynthetic capacity, mesophyll conductance and nighttime respiration have not changed consistently with cultivar release date. However, daily carbon gain was periodically greater in more recently released cultivars compared with older cultivars. Our analysis suggests that this difference in daily carbon gain primarily occurred when stomatal conductance and soil water content were high. There was also evidence for greater chlorophyll content and greater sink capacity late in the growing season in more recently released soybean varieties. Better understanding of the mechanisms that have improved conversion efficiency in the past may help identify new, promising targets for the future.

DOI PMID

[32]
Korner C, Basler D, 2010. Phenology under global warming.Science, 327(5972): 1461-1462.

[33]
Kowalczyk E A, Stevens L E, Law R Met al., 2016. The impact of changing the land surface scheme in ACCESS(v1.0/1.1) on the surface climatology.Geoscientific Model Development, 9(8): 2771-2791.The Community Atmosphere Biosphere Land Exchange (CABLE) model has been coupled to the UK Met Office Unified Model (UM) within the existing framework of the Australian Community Climate and Earth System Simulator (ACCESS), replacing the Met Office Surface Exchange Scheme (MOSES). Here we investigate how features of the CABLE model impact on present-day surface climate using ACCESS atmosphere-only simulations. The main differences attributed to CABLE include a warmer winter and a cooler summer in the Northern Hemisphere (NH), earlier NH spring runoff from snowmelt, and smaller seasonal and diurnal temperature ranges. The cooler NH summer temperatures in canopy-covered regions are more consistent with observations and are attributed to two factors. Firstly, CABLE accounts for aerodynamic and radiative interactions between the canopy and the ground below; this placement of the canopy above the ground eliminates the need for a separate bare ground tile in canopy-covered areas. Secondly, CABLE simulates larger evapotranspiration fluxes and a slightly larger daytime cloud cover fraction. Warmer NH winter temperatures result from the parameterization of cold climate processes in CABLE in snow-covered areas. In particular, prognostic snow density increases through the winter and lowers the diurnally resolved snow albedo; variable snow thermal conductivity prevents early winter heat loss but allows more heat to enter the ground as the snow season progresses; liquid precipitation freezing within the snowpack delays the building of the snowpack in autumn and accelerates snow melting in spring. Overall we find that the ACCESS simulation of surface air temperature benefits from the specific representation of the turbulent transport within and just above the canopy in the roughness sublayer as well as the more complex snow scheme in CABLE relative to MOSES.

DOI

[34]
Kumudini S, Andrade F H, Boote K Jet al., 2014. Predicting maize phenology: Intercomparison of functions for developmental response to temperature.Agronomy Journal, 106(6): 2087-2097.Accurate prediction of phenological development in maize (Zea mays L.) is fundamental to determining crop adaptation and yield potential. A number of thermal functions are used in crop models, but their relative precision in predicting maize development has not been quantified. The objectives of this study were (i) to evaluate the precision of eight thermal functions, (ii) to assess the effects of source data on the ability to differentiate among thermal functions, and (iii) to attribute the precision of thermal functions to their response across various temperature ranges. Data sets used in this study represent >1000 distinct maize hybrids, >50 geographic locations, and multiple planting dates and years. Thermal functions and calendar days were evaluated and grouped based on their temperature response and derivation as empirical linear, empirical nonlinear, and process-based functions. Precision in predicting phase durations from planting to anthesis or silking and from silking to physiological maturity was evaluated. Large data sets enabled increased differentiation of thermal functions, even when smaller data sets contained orthogonal, multi-location and -year data. At the highest level of differentiation, precision of thermal functions was in the order calendar days < empirical linear < process based < empirical nonlinear. Precision was associated with relatively low temperature sensitivity across the 10 to 26 degrees C range. In contrast to other thermal functions, process-based functions were derived using supra-optimal temperatures, and consequently, they may better represent the developmental response of maize to supra-optimal temperatures. Supra-optimal temperatures could be more prevalent under future climate-change scenarios, but data sets in this study contained few data in that range.

DOI

[35]
Leff B, Ramankutty N, Foley J A, 2004. Geographic distribution of major crops across the world. Global Biogeochemical Cycles, 18(1): GB1009. doi: 10.1029/2003GB002108Humans have transformed the surface of the planet through agricultural activities, and today, 藴12% of the land surface is used for cultivation and another 22% is used for pastures and rangelands. In this paper, we have synthesized satellite-derived land cover data and agricultural census data to produce global data sets of the distribution of 18 major crops across the world. The resulting data are representative of the early 1990s, have a spatial resolution of 5 min. (藴10 km), and describe the fraction of a grid cell occupied by each of the 18 crops. The global crop data are consistent with our knowledge of agricultural geography, and compares favorably to another existing data set that partially overlaps with our product. We have also analyzed how different crops are grown in combination to form major crop belts throughout the world. Further, we analyzed the patterns of crop diversification across the world. While these data are not sufficiently accurate at local scales, they can be used to analyze crop geography in a regional-to-global context. They can also be used to understand the global patterns of farming systems, in analyses of food security, and within global ecosystem and climate models to understand the environmental consequences of cultivation.

DOI

[36]
Lei H, Yang D, Lokupitiya Eet al., 2010. Coupling land surface and crop growth models for predicting evapotranspiration and carbon exchange in wheat-maize rotation croplands.Biogeosciences, 7(10): 3363-3375.The North China Plain is one of the most important crop production regions in China. However, water resources in the area are limited. Accurate modeling of water consumption and crop production in response to the changing environment is important. To better describe the two-way interactions among climate, irrigation, and crop growth, the crop phenology and physiology scheme of the SiBcrop model was coupled with the Simple Biosphere model version 2 (SiB2) for simulating crop phenology, as well as the crop production and evapotranspiration of winter wheat and summer maize, two of the main crops in the region. In the coupled model, the Leaf Area Index (LAI) produced by the crop phenology and physiology scheme was used in estimating the sub-hourly energy and carbon fluxes. Observations obtained from two typical eddy covariance sites located in this region were used to validate the model. The coupled model was able to simulate carbon and energy fluxes, soil water content, biomass carbon, and crop yield with high accuracy, especially for the latent heat flux and carbon flux. The LAI was also well-simulated by the model. Therefore, the coupled model is capable of assessing the responses of water resources and crop production to the changes of future climate and irrigation schedules.

DOI

[37]
Levis S, Bonan G B, Kluzek Eet al., 2012. Interactive crop management in the Community Earth System Model (CESM1): Seasonal influences on land-atmosphere fluxes.Journal of Climate, 25(14): 4839-4859.The Community Earth System Model, version 1 (CESM1) is evaluated with two coupled atmosphere-land simulations. The CTRL (control) simulation represents crops as unmanaged grasses, while CROP represents a crop managed simulation that includes special algorithms for midlatitude corn, soybean, and cereal phenology and carbon allocation. CROP has a more realistic leaf area index (LAI) for crops than CTRL. CROP reduces winter LAI and represents the spring planting and fall harvest explicitly. At the peak of the growing season, CROP simulates higher crop LAI. These changes generally reduce the latent heat flux but not around peak LAI (late spring/early summer). In midwestern North America, where corn, soybean, and cereal abundance is high, simulated peak summer precipitation declines and agrees better with observations, particularly when crops emerge late as is found from a late planting sensitivity simulation (LateP). Differences between the CROP and LateP simulations underscore the importance of simulating crop planting and harvest dates correctly. On the biogeochemistry side, the annual cycle of net ecosystem exchange (NEE) also improves in CROP relative to Ameriflux site observations. For a global perspective, the authors diagnose annual cycles of CO2 from the simulated NEE (CO2 is not prognostic in these simulations) and compare against representative GLOBALVIEW monitoring stations. The authors find an increased (thus also improved) amplitude of the annual cycle in CROP. These regional and global-scale refinements from improvements in the simulated plant phenology have promising implications for the development of the CESM and particularly for simulations with prognostic atmospheric CO2.

DOI

[38]
Liu F S, Tao F L, Liu J Yet al., 2016. Effects of land use/cover change on land surface energy partitioning and climate in Northeast China.Theoretical and Applied Climatology, 123(1/2): 141-150.The Simple Biosphere Model (SiB2) and the 265×65202km resolution National Land use/Land Cover database were used to investigate the effects of Land Use/Cover Change (LUCC) on land surface energy balance and climate in Jilin Province, northeast China, from 1990 to 2005. The spatial patterns of the components of surface energy balance (i.e., net radiation (R 63), latent heat (LH), sensible heat (SH), and albedo (α)) and climate (i.e., canopy temperature (T c), diurnal temperature range (DTR)), as well as the roles of land cover type in variations of energy balance and climate, were investigated. The results showed that there were general similar trends in R 63, LH, SH, and α in the LUCC process. The spatial patterns of T c and DTR also showed consistent relationships with LUCC processes. Leaf area index (LAI) and canopy conductance (g c) were found to be the key factors in controlling the spatial patterns of the components of surface energy balance and T c. Using linear correlation method, the gaps of the components of surface energy balance were well-explained by the differences of LAI and g c, and R 63 had a better correlation with T c and DTR, in the process of LUCC. The surface energy partitioning of R 63 into LH and SH could not only dampen or strengthen the temperature difference, but also change the relative size of albedo-based R 63 when the albedo gap was small, between land cover types.

DOI

[39]
Liu J Y, Shao Q Q, Yan X Det al., 2016. The climatic impacts of land use and land cover change compared among countries.Journal of Geographical Sciences, 26(7): 889-903.Land use and land cover change (LULCC) strongly influence regional and global climate by combining both biochemical and biophysical processes. However, the biophysical process was often ignored, which may offset the biogeochemical effects, so measures to address climate change could not reach the target. Thus, the biophysical influence of LULCC is critical for understanding observed climate changes in the past and potential scenarios in the future. Therefore, it is necessary to identify the mechanisms and effects of large-scale LULCC on climate change through changing the underlying surface, and thus the energy balance. The key scientific issues on understanding the impacts of human activities on global climate that must be addressed including: (1) what are the basic scientific facts of spatial and temporal variations of LULCC in China and comparative countries? (2) How to understand the coupling driving mechanisms of human activities and climate change on the LULCC and then to forecasting the future scenarios? (3) What are the scientific mechanisms of LULCC impacts on biophysical processes of land surface, and then the climate? (4) How to estimate the contributions of LULCC to climate change by affecting biophysical processes of land surface? By international comparison, the impacts of LULCC on climate change at the local, regional and global scales were revealed and evaluated. It can provide theoretical basis for the global change, and have great significance to mitigate and adapt to global climate changes.

DOI

[40]
Lobell D B, Bala G, Duffy P B, 2006. Biogeophysical impacts of cropland management changes on climate.Geophysical Research Letters, 33(6): L06708. doi: 10.1029/2005GL025492.It is well known that expansion of agriculture into natural ecosystems can have important climatic consequences, but changes occurring within existing croplands also have the potential to effect local and global climate. To better understand the impacts of cropland management practices, we used the NCAR CAM3 general circulation model coupled to a slab-ocean model to simulate climate change under extreme scenarios of irrigation, tillage, and crop productivity. Compared to a control scenario, increases in irrigation and leaf area index and reductions in tillage all have a physical cooling effect by causing increases in planetary albedo. The cooling is most pronounced for irrigation, with simulated local cooling up to ~8掳C and global land surface cooling of 1.3掳C. Increases in soil albedo through reduced tillage are found to have a global cooling effect (~0.2掳C) comparable to the biogeochemical cooling from reported carbon sequestration potentials. By identifying the impacts of extreme scenarios at local and global scales, this study effectively shows the importance of considering different aspects of crop management in the development of climate models, analysis of observed climate trends, and design of policy intended to mitigate climate change.

DOI

[41]
Lokupitiya E, Denning S, Paustian Ket al., 2009. Incorporation of crop phenology in Simple Biosphere Model (SiBcrop) to improve land-atmosphere carbon exchanges from croplands.Biogeosciences, 6(6): 969-986.Croplands are man-made ecosystems that have high net primary productivity during the growing season of crops, thus impacting carbon and other exchanges with the atmosphere. These exchanges play a major role in nutrient cycling and climate change related issues. An accurate representation of crop phenology and physiology is important in land-atmosphere carbon models being used to predict these exchanges. To better estimate time-varying exchanges of carbon, water, and energy of croplands using the Simple Biosphere (SiB) model, we developed crop-specific phenology models and coupled them to SiB. The coupled SiB-phenology model (SiBcrop) replaces remotely-sensed NDVI information, on which SiB originally relied for deriving Leaf Area Index (LA!) and the fraction of Photosynthetically Active Radiation (fPAR) for estimating carbon dynamics. The use of the new phenology scheme within SiB substantially improved the prediction of LA! and carbon fluxes for maize, soybean, and wheat crops, as compared with the observed data at several AmeriFlux eddy covariance flux tower sites in the US mid continent region. SiBcrop better predicted the onset and end of the growing season, harvest, interannual variability associated with crop rotation, day time carbon uptake (especially for maize) and day to day variability in carbon exchange. Biomass predicted by SiBcrop had good agreement with the observed biomass at field sites. In the future, we will predict fine resolution regional scale carbon and other exchanges by coupling SiBcrop with RAMS (the Regional Atmospheric Modeling System).

DOI

[42]
Luyssaert S, Jammet M, Stoy P Cet al., 2014. Land management and land-cover change have impacts of similar magnitude on surface temperature.Nature Climate Change, 4(5): 389-393.Anthropogenic changes to land cover (LCC) remain common, but continuing land scarcity promotes the widespread intensification of land management changes (LMC) to better satisfy societal demand for food, fibre, fuel and shelter1. The biophysical effects of LCC on surface climate are largely understood2, 3, 4, 5, particularly for the boreal6 and tropical zones7, but fewer studies have investigated the biophysical consequences of LMC; that is, anthropogenic modification without a change in land cover type. Harmonized analysis of ground measurements and remote sensing observations of both LCC and LMC revealed that, in the temperate zone, potential surface cooling from increased albedo is typically offset by warming from decreased sensible heat fluxes, with the net effect being a warming of the surface. Temperature changes from LMC and LCC were of the same magnitude, and averaged 2 K at the vegetation surface and were estimated at 1.7 K in the planetary boundary layer. Given the spatial extent of land management (4258% of the land surface) this calls for increasing the efforts to integrate land management in Earth System Science to better take into account the human impact on the climate

DOI

[43]
McGuire A D, Chapin F S, Walsh J Eet al., 2006. Integrated regional changes in arctic climate feedbacks: Implications for the global climate system.Annual Review of Environment and Resources, 31: 61-91.

[44]
Mirschel W, Wenkel K O, Schultz Aet al., 2005. Dynamic phenological model for winter rye and winter barley.European Journal of Agronomy, 23(2): 123-135.A detailed dynamic crop stand phenological model is presented for winter barley and winter rye. The modelled phenological stages are described in different scale units (FEEKES [1&ndash;20], BBCH [1&ndash;100] and DC [1&ndash;100]) and a differentiation in mathematical approaches and in parameterisation is made between the germination, the vegetative and the generative phases. The following driving forces are taken into account: temperature, day length, drought stress and nitrogen availability. Drought stress is described using the ratio of actual to potential evapotranspiration and nitrogen availability is described using the nitrogen content in the above-ground biomass. Vernalisation is considered as a process influencing phenology and is described normalised between 0 and 1. In the paper the model parameters are listed separately for winter barley and winter rye. Model parameterisation and validation results are presented for three different German locations (M&uuml;ncheberg, Hohenfinow, Halle). The comparison of calculated and observed phenological phases (emergence, shooting, flowering, maturity) gives an R2 between 0.87 and 0.99 for winter rye and between 0.92 and 0.99 for winter barley. For these phenological stages the maximum mean deviation between calculations and observations is 5 days. For tillering an insufficient agreement was occurred only. Investigations regarding the geographical extrapolation of the model are carried out for two different German locations (Dedelow and Mariensee). The model-experiment-comparison results for all phenological phases show a sufficient accuracy (R2 = 0.98, N = 82), followed by the presentation and discussion of their results. Model simulation runs with drought stress and not enough nitrogen availability show the dominance of drought stress induced phenology acceleration.

DOI

[45]
Morin X, Lechowicz M J, Augspurger Cet al., 2009. Leaf phenology in 22 North American tree species during the 21st century.Global Change Biology, 15(4): 961-975.Recent shifts in phenology are the best documented biological response to current anthropogenic climate change, yet remain poorly understood from a functional point of view. Prevailing analyses are phenomenological and approximate, only correlating temperature records to imprecise records of phenological events. To advance our understanding of phenological responses to climate change, we developed, calibrated, and validated process-based models of leaf unfolding for 22 North American tree species. Using daily meteorological data predicted by two scenarios (A2: +3.2 pC and B2: +1 pC) from the HadCM3 GCM, we predicted and compared range-wide shifts of leaf unfolding in the 20th and 21st centuries for each species. Model predictions suggest that climate change will affect leaf phenology in almost all species studied, with an average advancement during the 21st century of 5.0 days in the A2 scenario and 9.2 days in the B2 scenario. Our model also suggests that lack of sufficient chilling temperatures to break bud dormancy will decrease the rate of advancement in leaf unfolding date during the 21st century for many species. Some temperate species may even have years with abnormal budburst due to insufficient chilling. Species fell into two groups based on their sensitivity to climate change: (1) species that consistently had a greater advance in their leaf unfolding date with increasing latitude and (2) species in which the advance in leaf unfolding differed from the center to the northern vs. southern margins of their range. At the interspecific level, we predicted that early-leafing species tended to show a greater advance in leaf unfolding date than late-leafing species; and that species with larger ranges tend to show stronger phenological changes. These predicted changes in phenology have significant implications for the frost susceptibility of species, their interspecific relationships, and their distributional shifts.

DOI

[46]
Mueller N D, Butler E E, McKinnon K Aet al., 2016. Cooling of US Midwest summer temperature extremes from cropland intensification.Nature Climate Change, 6(3): 317-324.High temperature extremes during the growing season can reduce agricultural production. At the same time, agricultural practices can modify temperatures by altering the surface energy budget. Here we identify centennial trends towards more favourable growing conditions in the US Midwest, including cooler summer temperature extremes and increased precipitation, and investigate the origins of these shifts. Statistically significant correspondence is found between the cooling pattern and trends in cropland intensification, as well as with trends towards greater irrigated land over a small subset of the domain. Land conversion to cropland, often considered an important influence on historical temperatures, is not significantly associated with cooling. We suggest that agricultural intensification increases the potential for evapotranspiration, leading to cooler temperatures and contributing to increased precipitation. The tendency for greater evapotranspiration on hotter days is consistent with our finding that cooling trends are greatest for the highest temperature percentiles. Temperatures over rainfed croplands show no cooling trend during drought conditions, consistent with evapotranspiration requiring adequate soil moisture, and implying that modern drought events feature greater warming as baseline cooler temperatures revert to historically high extremes.

DOI

[47]
Oguntunde P G, van de Giesen N, 2004. Crop growth and development effects on surface albedo for maize and cowpea fields in Ghana, West Africa.International Journal of Biometeorology, 49(2): 106-112.The albedo () of vegetated land surfaces is a key regulatory factor in atmospheric circulation and plays an important role in mechanistic accounting of many ecological processes. This paper examines the influence of the phenological stages of maize (Zea mays) and cowpea (Vigna unguiculata) fields on observed albedo at a tropical site in Ghana. The crops were studied for the first and second planting dates in the year 2002. Crop management was similar for both seasons and measurements were taken from 10&nbsp;m&times;10-m plots within crop fields. Four phenological stages were distinguished: (1) emergence, (2) vegetative, (3) flowering, and (4) maturity. measured from two reference surfaces, short grass and bare soil, were used to study the change over the growing seasons. Surface was measured and simulated at sun angles of 15, 30, 45, 60, and 75&deg;. Leaf area index (LAI) and crop height (CH) were also monitored. Generally, increases from emergence to maturity for both planting dates in the maize field but slightly decreases after flowering in the cowpea field. For maize, the correlation coefficient (R) between and LAI equals 0.970, and the R between and CH equals 0.969. Similarly, for cowpea these Rs are 0.988 and 0.943, respectively. A modified albedo model adequately predicted the observed s with an overall R&gt;0.860. The relative difference in surface with respect to the values measured from the two reference surfaces is discussed. Data presented are expected to be a valuable input in agricultural water management, crop production models, eco-hydrological models and in the study of climate effects of agricultural production, and for the parameterization of land-surface schemes in regional weather and climate models.

DOI PMID

[48]
Olesen J E, Borgesen C D, Elsgaard Let al., 2012. Changes in time of sowing, flowering and maturity of cereals in Europe under climate change. Food Additives and Contaminants Part A:Chemistry Analysis Control Exposure & Risk Assessment, 29(10): 1527-1542.

[49]
Osborne T M, Lawrence D M, Challinor A Jet al., 2007. Development and assessment of a coupled crop-climate model.Global Change Biology, 13(1): 169-183.It is well established that crop production is inherently vulnerable to variations in the weather and climate. More recently the influence of vegetation on the state of the atmosphere has been recognized. The seasonal growth of crops can influence the atmosphere and have local impacts on the weather, which in turn affects the rate of seasonal crop growth and development. Considering the coupled nature of the crop-揷limate system, and the fact that a significant proportion of land is devoted to the cultivation of crops, important interactions may be missed when studying crops and the climate system in isolation, particularly in the context of land use and climate change. To represent the two-way interactions between seasonal crop growth and atmospheric variability, we integrate a crop model developed specifically to operate at large spatial scales (General Large Area Model for annual crops) into the land surface component of a global climate model (GCM; HadAM3). In the new coupled crop-揷limate model, the simulated environment (atmosphere and soil states) influences growth and development of the crop, while simultaneously the temporal variations in crop leaf area and height across its growing season alter the characteristics of the land surface that are important determinants of surface fluxes of heat and moisture, as well as other aspects of the land-surface hydrological cycle. The coupled model realistically simulates the seasonal growth of a summer annual crop in response to the GCM's simulated weather and climate. The model also reproduces the observed relationship between seasonal rainfall and crop yield. The integration of a large-scale single crop model into a GCM, as described here, represents a first step towards the development of fully coupled crop and climate models. Future development priorities and challenges related to coupling crop and climate models are discussed.

DOI

[50]
Oteros J, Garcia-Mozo H, Botey Ret al., 2015. Variations in cereal crop phenology in Spain over the last twenty-six years (1986-2012).Climatic Change, 130(4): 545-558.Over recent years, the Iberian Peninsula has witnessed an increase both in temperature and in rainfall intensity, especially in the Mediterranean climate area. Plant phenology is modulated by climate, and closely governed by water availability and air temperature. Over the period 1986–2012, the effects of climate change on phenology were analyzed in five crops at 26 sites growing in Spain (southern Europe): oats, wheat, rye, barley and maize. The phenophases studied were: sowing date, emergence, flag leaf sheath swollen, flowering, seed ripening and harvest. Trends in phenological response over time were detected using linear regression. Trends in air temperature and rainfall over the period prior to each phenophase were also charted. Correlations between phenological features, biogeographical area and weather trends were examined using a Generalized Lineal Mixed Model approach. A generalized advance in most winter-cereal phenophases was observed, mainly during the spring. Trend patterns differed between species and phenophases. The most noticeable advance in spring phenology was recorded for wheat and oats, the “ Flag leaf sheath swollen” and “Flowering date” phenophases being brought forward by around 302days/year and 102day/year, respectively. Temperature changes during the period prior to phenophase onset were identified as the cause of these phenological trends. Climate changes are clearly prompting variations in cereal crop phenology; their consequences could be even more marked if climate change persists into the next century. Changes in phenology could in turn impact crop yield; fortunately, human intervention in crop systems is likely to minimize the negative impact.

DOI

[51]
Parent B, Tardieu F, 2012. Temperature responses of development processes have not been affected by breeding in different ecological areas for 17 crop species.New Phytologist, 194(3): 760-774.Rates of tissue expansion, cell division and progression in the plant cycle are driven by temperature, following common Arrhenius-type response curves. We analysed the genetic variability of this response in the range 637 degrees C in seven to nine lines of maize (Zea mays), rice (Oryza spp.) and wheat (Triticum aestivum) and in 18 species (17 crop species, different genotypes) via the meta-analysis of 72 literature references. Lines with tropical or north-temperate origins had common response curves over the whole range of temperature. Conversely, appreciable differences in response curves, including optimum temperatures, were observed between species growing in temperate and tropical areas. Therefore, centuries of crop breeding have not impacted on the response of development to short-term changes in temperature, whereas evolution over millions of years has. This slow evolution may be a result of the need for a synchronous shift in the temperature response of all developmental processes, otherwise plants will not be viable. Other possibilities are discussed. This result has important consequences for the breeding and modelling of temperature effects associated with global changes.

DOI PMID

[52]
Penuelas J, Rutishauser T, Filella I, 2009. Phenology feedbacks on climate change.Science, 324(5929): 887-888.

[53]
Pielke R A, Adegoke J, Beltran-Przekurat Aet al., 2007. An overview of regional land-use and land-cover impacts on rainfall. Tellus Series B:Chemical and Physical Meteorology, 59(3): 587-601.This paper documents the diverse role of land-use/land-cover change on precipitation. Since land conversion continues at a rapid pace, this type of human disturbance of the climate system will continue and become even more significant in the coming decades.

DOI

[54]
Raddatz R L, Cummine J D, 2003. Inter-annual variability of moisture flux from the prairie agro-ecosystem: Impact of crop phenology on the seasonal pattern of Tornado Days.Boundary-Layer Meteorology, 106(2): 283-295.This study, through the inclusion of a simpleparameterization of the phenologicaldevelopment of spring wheat in evapotranspirationsimulations for 1988–2000, at a representativearid grassland and a representative transitionalgrassland site, delineated the inter-annualvariability of the seasonal moisture flux from theCanadian Prairie agro-ecosystem. Theagro-ecosystem's contribution to atmospheric boundary-layermoisture, at these representative sites, wasrelated to the seasonal pattern of tornado days in thegrassland eco-climatic zone for the averageyear, for a warmer/drier year and for a cooler/wetteryear. The following conclusions were drawn:(1) The moisture flux from the Prairie agro-ecosystemdisplays considerable inter-annualvariability due, in the main, to the rate andtiming of crop phenological development andassociated biophysical parameters, and (2) themoisture flux from the Prairie agro-ecosystemtranslates directly into changes in atmosphericboundary-layer moisture, which subsequentlyaffects the magnitude of the potential energyavailable for deep convection and the seasonalpattern of tornado days. For expansive agriculturalareas, representing the inter-annual variabilityof crop phenological development in land surfacemodels is critical to the successful simulationof the surface moisture flux, and thus thethermodynamic properties of the atmospheric boundarylayer. Therefore, it is of particularimportance to Prairie climate and climate change modelling.

DOI

[55]
Richardson A D, Keenan T F, Migliavacca Met al., 2013. Climate change, phenology, and phenological control of vegetation feedbacks to the climate system.Agricultural and Forest Meteorology, 169: 156-173.Vegetation phenology is highly sensitive to climate change. Phenology also controls many feedbacks of vegetation to the climate system by influencing the seasonality of albedo, surface roughness length, canopy conductance, and fluxes of water, energy, CO 2 and biogenic volatile organic compounds. In this review, we first discuss the environmental drivers of phenology, and the impacts of climate change on phenology, in different biomes. We then examine the vegetation-climate feedbacks that are mediated by phenology, and assess the potential impact on these feedbacks of shifts in phenology driven by climate change. We finish with an overview of phenological modeling and we suggest ways in which models might be improved using existing data sets. Several key weaknesses in our current understanding emerge from this analysis. First, we need a better understanding of the drivers of phenology, particularly in under-studied biomes (e.g. tropical forests). We do not have a mechanistic understanding of the role of photoperiod, even in well-studied biomes. In all biomes, the factors controlling senescence and dormancy are not well-documented. Second, for the most part (i.e. with the exception of phenology impacts on CO 2 exchange) we have only a qualitative understanding of the feedbacks between vegetation and climate that are mediated by phenology. We need to quantify the magnitude of these feedbacks, and ensure that they are accurately reproduced by models. Third, we need to work towards a new understanding of phenological processes that enables progress beyond the modeling paradigms currently in use. Accurate representation of phenological processes in models that couple the land surface to the climate system is particularly important, especially when such models are being used to predict future climate.

DOI

[56]
Sacks W J, Kucharik C J, 2011. Crop management and phenology trends in the US Corn Belt: Impacts on yields, evapotranspiration and energy balance.Agricultural and Forest Meteorology, 151(7): 882-894.Crop yields are affected by many factors, related to breeding, management and climate. Understanding these factors, and their relative contributions to historical yield increases, is important to help ensure that these yield increases can continue in the future. Two important factors that can affect yields are planting dates and the crop's growing degree day (GDD) requirements. We analyzed 25 years of data collected by the USDA in order to document trends in planting dates, lengths of the vegetative and reproductive growth periods, and the length of time between maturity and harvest for corn and soybeans across the United States. We then drove the Agro-IBIS agroecosystem model with these observations to investigate the effects of changing planting dates and crop GDD requirements on crop yields and fluxes of water and energy. Averaged across the U.S., corn planting dates advanced about 10 days from 1981 to 2005, and soybean planting dates about 12 days. For both crops, but especially for corn, this was accompanied by a lengthening of the growth period. The period from corn planting to maturity was about 12 days longer around 2005 than it was around 1981. A large driver of this change was a 14% increase in the number of GOD needed for corn to progress through the reproductive period, probably reflecting an adoption of longer season cultivars. If these changes in cultivars had not occurred, yields around 2005 would have been 12.6 bu ac(-1) lower across the U.S. Corn Belt, erasing 26% of the yield increase from 1981 to 2005. These changes in crop phenology, together with a shortening of the time from maturity to harvest, have also modified the surface water and energy balance. Earlier planting has led to an increase in the latent heat flux and a decrease in the sensible heat flux in June, while a shorter time from maturity to harvest has meant an increase in net radiation in October. (C) 2011 Elsevier B.V. All rights reserved.

DOI

[57]
Schwartz M D, Ahas R, Aasa A, 2006. Onset of spring starting earlier across the Northern Hemisphere.Global Change Biology, 12(2): 343-351.Abstract Recent warming of Northern Hemisphere (NH) land is well documented and typically greater in winter/spring than other seasons. Physical environment responses to warming have been reported, but not details of large-area temperate growing season impacts, or consequences for ecosystems and agriculture. To date, hemispheric-scale measurements of biospheric changes have been confined to remote sensing. However, these studies did not provide detailed data needed for many investigations. Here, we show that a suite of modeled and derived measures (produced from daily maximum–minimum temperatures) linking plant development (phenology) with its basic climatic drivers provide a reliable and spatially extensive method for monitoring general impacts of global warming on the start of the growing season. Results are consistent with prior smaller area studies, confirming a nearly universal quicker onset of early spring warmth (spring indices (SI) first leaf date, 611.2daysdecade 611 ), late spring warmth (SI first bloom date, 611.0daysdecade 611 ; last spring day below 5°C, 611.4daysdecade 611 ), and last spring freeze date (611.5daysdecade 611 ) across most temperate NH land regions over the 1955–2002 period. However, dynamics differ among major continental areas with North American first leaf and last freeze date changes displaying a complex spatial relationship. Europe presents a spatial pattern of change, with western continental areas showing last freeze dates getting earlier faster, some central areas having last freeze and first leaf dates progressing at about the same pace, while in portions of Northern and Eastern Europe first leaf dates are getting earlier faster than last freeze dates. Across East Asia last freeze dates are getting earlier faster than first leaf dates.

DOI

[58]
Sharma K D, Pannu R K, 2008. Physiological response of wheat (Triticum durum L.) to limited irrigation.Journal of Agrometeorology, 10(2): 113-117.Abstract A field study was conducted at CCS Haryana Agricultural University, Hisar, during two consecutive rabi seasons of 2002-03 and 2003-04 on wheat genotypes. The main plots treatment consisted of three irrigation schedules viz., normal irrigation (Control), two irrigations at 45 and 85 DAS (limited irrigation) and no post sowing irrigation (rainfed) and in sub-plots five genotypes were grown namely WH 896, WH 912, WHD 935, WHD 936, PDW 233, Raj 1555. The restricted irrigation decreased the leaf water potential (LWP), canopy temperature depression (CTD), transpiration rate, stomatal conductance and photosynthesis significantly over irrigated control, while, significant increase was observed in plant water retention. Reduction in grain yield under rainfed condition was 23.4 per cent. Reduced irrigation application decreased the yield attributes with maximum reduction in number of grains per spike. Genotype PDW 233 yielded significantly higher than all other tested genotypes. It maintained higher plant water status and higher rate of photosynthesis than other genotypes.

[59]
Shi Wenjiao, Tao Fulu, Zhang Zhao, 2012. Identifying contributions of climate change to crop yields based on statistical models: A review.Acta Geographica Sinica, 67(9): 1213-1222. (in Chinese)Statistical models and crop models are two major tools for research of contributions of climate change to agricultural production. The researchers have paid much attention to the studies of effects of climate change on crop growth based on crop models. However, the topic based on statistical models has not been fully realized. This paper starts with the difference and relation between statistical models and crop models, and introduces three main statistical methods for identifying contributions of climate change to crop yields including time-series model, cross-section model and panel model. It reviews the topic on different scales, e.g. global scale, national scale, provincial scale, regional scale, county scale and site scale. There are four problems in identifying response sensitivity of crop yields to climate change, namely spatial and temporal scale, non-climatic trend removal, co-linearity existing in climate variables and the non-consideration of adaptation.

DOI

[60]
Song Y, Jain A K, McIsaac G F, 2013. Implementation of dynamic crop growth processes into a land surface model: Evaluation of energy, water and carbon fluxes under corn and soybean rotation.Biogeosciences, 10(12): 8201-8201.No abstract available.

DOI

[61]
Tao F L, Zhang S A, Zhang Z, 2012. Spatiotemporal changes of wheat phenology in China under the effects of temperature, day length and cultivar thermal characteristics.European Journal of Agronomy, 43: 201-212.Investigating the spatiotemporal changes of crop phenology in field is important to understand the processes and mechanisms of crop response and adaption to ongoing climate change. Here, the wheat phenology at more than 100 national agro-meteorological experiment stations across China spanning the years 1981-2007 was examined. Spatiotemporal changes of wheat phenology and seasonal temperature, as well as the correlations between them were presented. During the investigation period, heading dates advanced significantly at 43 stations from the 108 investigated stations; maturity dates advanced significantly at 41 stations from the 109 investigated stations. Lengths of growing period (from sowing to maturity) and vegetative growing period (from sowing to heading) were significantly reduced at about 30% of the investigated stations, especially for spring wheat in northwestern China, despite thermal accumulation during the periods increased. In contrast, although significantly and negatively related to mean temperature, lengths of reproductive growing period (from heading to maturity) increased at 60% of the investigated stations, owing to increase in crop cultivars thermal requirements or/and decrease in mean temperature. The results showed that besides the complex influences of agronomic factors, climate change contributed substantially to the shift of wheat phenology. Mean day length during vegetative growing period had a decreasing trend at most of the investigated stations owing to delay of sowing date or/and advancement of heading date, which counterbalanced the roles of temperature in controlling the duration of vegetative growing period. In-depth analyses showed that thermal requirements from sowing to almost each development stage increased, however the thermal requirements to complete each single development stage changed differently, which tended to increase yield and adapt to ongoing climate change. Our findings have important implications for improving climate change impact studies, for breeding scientists to breed higher yielding cultivars, and for agricultural production to cope with ongoing climate change.

DOI

[62]
Tao F L, Zhang S, Zhang Zet al., 2014. Maize growing duration was prolonged across China in the past three decades under the combined effects of temperature, agronomic management, and cultivar shift.Global Change Biology, 20(12): 3686-3699.Maize phenology observations at 112 national agro-meteorological experiment stations across China spanning the years 1981-2009 were used to investigate the spatiotemporal changes of maize phenology, as well as the relations to temperature change and cultivar shift. The greater scope of the dataset allows us to estimate the effects of temperature change and cultivar shift on maize phenology more precisely. We found that maize sowing date advanced significantly at 26.0% of stations mainly for spring maize in northwestern, southwestern and northeastern China, although delayed significantly at 8.0% of stations mainly in northeastern China and the North China Plain (NCP). Maize maturity date delayed significantly at 36.6% of stations mainly in the northeastern China and the NCP. As a result, duration of maize whole growing period (GPw) was prolonged significantly at 41.1% of stations, although mean temperature (Tmean) during GPw increased at 72.3% of stations, significantly at 19.6% of stations, and Tmean was negatively correlated with the duration of GPw at 92.9% of stations and significantly at 42.9% of stations. Once disentangling the effects of temperature change and cultivar shift with an approach based on accumulated thermal development unit, we found that increase in temperature advanced heading date and maturity date and reduced the duration of GPw at 81.3%, 82.1% and 83.9% of stations on average by 3.2, 6.0 and 3.5days/decade, respectively. By contrast, cultivar shift delayed heading date and maturity date and prolonged the duration of GPw at 75.0%, 94.6% and 92.9% of stations on average by 1.5, 6.5 and 6.5days/decade, respectively. Our results suggest that maize production is adapting to ongoing climate change by shift of sowing date and adoption of cultivars with longer growing period. The spatiotemporal changes of maize phenology presented here can further guide the development of adaptation options for maize production in near future.

DOI PMID

[63]
Tsarouchi G M, Buytaert W, Mijic A, 2014. Coupling a land-surface model with a crop growth model to improve ET flux estimations in the Upper Ganges basin, India.Hydrology and Earth System Sciences, 18(10): 4223-4238.Land-Surface Models (LSMs) are tools that represent energy and water flux exchanges between land and the atmosphere. Although much progress has been made in adding detailed physical processes into these models, there is much room left for improved estimates of evapotranspiration fluxes, by including a more reasonable and accurate representation of crop dynamics. Recent studies suggest a strong land-surface–atmosphere coupling over India and since this is one of the most intensively cultivated areas in the world, the strong impact of crops on the evaporative flux cannot be neglected. In this study we dynamically couple the LSM JULES with the crop growth model InfoCrop. JULES in its current version (v3.4) does not simulate crop growth. Instead, it treats crops as natural grass, while using prescribed vegetation parameters. Such simplification might lead to modelling errors. Therefore we developed a coupled modelling scheme that simulates dynamically crop development and parametrized it for the two main crops of the study area, wheat and rice. This setup is used to examine the impact of inter-seasonal land cover changes in evapotranspiration fluxes of the Upper Ganges River basin (India). The sensitivity of JULES with regard to the dynamics of the vegetation cover is evaluated. Our results show that the model is sensitive to the changes introduced after coupling it with the crop model. Evapotranspiration fluxes, which are significantly different between the original and the coupled model, are giving an approximation of the magnitude of error to be expected in LSMs that do not include dynamic crop growth. For the wet season, in the original model, the monthly Mean Error ranges from 7.5 to 24.4 mm month, depending on different precipitation forcing. For the same season, in the coupled model, the monthly Mean Error's range is reduced to 5.4–11.6 mm month. For the dry season, in the original model, the monthly Mean Error ranges from 10 to 17 mm month, depending on different precipitation forcing. For the same season, in the coupled model, the monthly Mean Error's range is reduced to 2.2–3.4 mm month. The new modelling scheme, by offering increased accuracy of evapotranspiration estimations, is an important step towards a better understanding of the two-way crops–atmosphere interactions.

DOI

[64]
Tsvetsinskaya E A, Mearns L O, Easterling W E, 2001. Investigating the effect of seasonal plant growth and development in three-dimensional atmospheric simulations. Part I: Simulation of surface fluxes over the growing season.Journal of Climate, 14(5): 692-709.

[65]
Van den Hoof C, Hanert E, Vidale P L, 2011. Simulating dynamic crop growth with an adapted land surface model - JULES-SUCROS: Model development and validation.Agricultural and Forest Meteorology, 151(2): 137-153.The increasing demand for ecosystem services, in conjunction with climate change, is expected to significantly alter terrestrial ecosystems. In order to evaluate the sustainability of land and water resources, there is a need for a better understanding of the relationships between crop production, land surface characteristics and the energy and water cycles. These relationships are analysed using the Joint UK Land Environment Simulator (JULES). JULES includes the full hydrological cycle and vegetation effects on the energy, water, and carbon fluxes. However, this model currently only simulates land surface processes in natural ecosystems. An adapted version of JULES for agricultural ecosystems, called JULES-SUCROS has therefore been developed. In addition to overall model improvements, JULES-SUCROS includes a dynamic crop growth structure that fully fits within and builds upon the biogeochemical modelling framework for natural vegetation. Specific agro-ecosystem features such as the development of yield-bearing organs and the phenological cycle from sowing till harvest have been included in the model. This paper describes the structure of JULES-SUCROS and evaluates the fluxes simulated with this model against FLUXNEf measurements at 6 European sites. We show that JULES-SUCROS significantly improves the correlation between simulated and observed fluxes over cropland and captures well the spatial and temporal variability of the growth conditions in Europe. Simulations with JULES-SUCROS highlight the importance of vegetation structure and phenology, and the impact they have on land-atmosphere interactions. (C) 2010 Elsevier B.V. All rights reserved.

DOI

[66]
Wang E, Engel T, 1998. Simulation of phenological development of wheat crops.Agricultural Systems, 58(1): 1-24.By Enli Wang and Thomas Engel; Simulation of phenological development of wheat crops

DOI

[67]
Wang Z, Chen J, Li Yet al., 2016. Effects of climate change and cultivar on summer maize phenology.International Journal of Plant Production, 10(4): 509-525.To identify countermeasures to the effects of climate warming on crop production, we mustunderstand the changes in crop phenology and the relationships between phenology and climatechange and cultivar. We used summer maize phenological and climate data in the North ChinaPlain, collected from 1981 to 2010. This study analyzed the spatiotemporal trends inphenological data and lengths of different growing phases, mean temperatures and rainfall.The analyses showed that sowing, jointing and anthesis occurred relatively early at 13 (48.1%),11 (40.7%) and 13 (48.1%) stations, respectively. Maturity dates were delayed significantly at10 (37.0%) stations. The lengths of the vegetative growing phases, vegetative and reproductivegrowing phase at most stations showed a negative trend. The lengths of the reproductivegrowing phase increased at 25 (92.6%) stations, respectively. Furthermore, at most stations, thecorrelations between Tmeans and lengths of the various growing phases were negative, whereasthe correlations between rainfall and lengths of various growing phases were positive.Furthermore, a field experiment, including four summer maize cultivars which were introducedduring the 1950s, 1970s, 1990s and 2000s, was carried out during 2012 to 2014. The analysesshowed that the durations of the various growing phases increased significantly. These resultsindicated that climate warming accelerates summer maize growth and shortens the growingperiods of maize growth, whereas cultivars shift might prolong the maize growing season.Therefore, the maize cultivars with more longer whole growing period should be adopt in theNorth China Plain under the trend of global warming and the adaptation strategy of maizeproduction under climate change should include crop phenology in response to climate change.The findings presented here could guide the development of options to adapt maize productionto climate change in the North China Plain and other areas with similar ecologies.

[68]
Wilson D R, Muchow R C, Murgatroyd C J, 1995. Model analysis of temperature and solar radiation limitations to maize potential productivity in a cool climate.Field Crops Research, 43(1): 1-18.Abstract In cool-temperate climates, potential maize grain yields are variable and often small. Low temperature prolongs growth duration, reduces crop growth rate, and increases the risk of frost terminating grain filling prematurely. The objectives of this study were (1) to assess the performance of a radiation- and temperature-driven maize simulation model in a cool-temperate climate and (2) to modify the model to allow the effects of temperature and solar radiation on growth and yield to be simulated in both warm and cool climates.Modifications to the model to improve simulation in the cool climate included a changed phenology response to low temperature, a reduction in radiation-use efficiency and rate of harvest index increase at low temperature, and an increased time lag between silking and the start of grain growth at low temperature. The modified model gave good agreement between observed independent datasets and simulated values of grain and total biomass yield in tropical, subtropical and cool-temperate locations; root mean square deviations of the comparisons averaged across all locations were about 12% of the mean values. Thus the utility of the model has been enhanced for a wider range of climates. The study also showed that the conclusion from previous analyses with the model in warm climates that the highest potential maize yields occur at locations with a combination of high incident radiation, low temperature and long growth duration may not be valid if mean temperature during growth is less than ca. 18掳C. However, this condition would only occur in cool-temperate climates.

DOI

[69]
Xiao D P, Moiwo J P, Tao F Let al., 2015. Spatiotemporal variability of winter wheat phenology in response to weather and climate variability in China.Mitigation and Adaptation Strategies for Global Change, 20(7): 1191-1202.Weather and climate variability are predicted to impact food security by altering crop growth, phenology, and yield processes. Adaptation measures are critical for reducing future vulnerability of crop production to warming weather and climate variability. It is therefore vital to investigate the shifts in crop phenological processes in response to weather/climate variability. This study analyzes the trends in the dates of winter wheat ( Triticum aestivum L.) phenology in relation to average temperature of different growth stage and the adaptation of the crop to weather/climate variability in China. The results suggest that the phenological phases of winter wheat have specific regional patterns in China. There are also significant shifts in the dates of winter wheat phenology and the duration of the growth stages in the investigated 30-year period of 1980-2009. While the date of sowing winter wheat delays, the dates of post-winter phenological phases (e.g., heading and maturity dates) advances in most areas of China. Detailed analysis shows that the changes in the phenological phases of winter wheat are strongly related to temperature trends. Temporal trends in phenological phases of winter wheat are similar in characteristics to corresponding trends in temperature. Although warming weather and climate variability is the main driver of the changes in winter wheat phenology, temperature is lower than before in most of the investigated stations during the period from heading to maturity-ainly the grain-filling stage. This is mainly due to the early heading and maturity dates, which in turn not only prolong growth stages but also enhance productivity of winter wheat. This could be a vital adaptation strategy of winter wheat to warming weather with beneficial effects in terms of productivity.

DOI

[70]
Xiao D P, Qi Y Q, Shen Y Jet al., 2016. Impact of warming climate and cultivar change on maize phenology in the last three decades in North China Plain.Theoretical and Applied Climatology, 124(3/4): 653-661.As climate change could significantly influence crop phenology and subsequent crop yield, adaptation is a critical mitigation process of the vulnerability of crop growth and production to climate change. Thus, to ensure crop production and food security, there is the need for research on the natural (shifts in crop growth periods) and artificial (shifts in crop cultivars) modes of crop adaptation to climate change. In this study, field observations in 18 stations in North China Plain (NCP) are used in combination with Agricultural Production Systems Simulator (APSIM)-Maize model to analyze the trends in summer maize phenology in relation to climate change and cultivar shift in 1981–2008. Apparent warming in most of the investigated stations causes early flowering and maturity and consequently shortens reproductive growth stage. However, APSIM-Maize model run for four representative stations suggests that cultivar shift delays maturity and thereby prolongs reproductive growth (flowering to maturity) stage by 2.4613.702day per decade (d 10a 611 ). The study suggests a gradual adaptation of maize production process to ongoing climate change in NCP via shifts in high thermal cultivars and phenological processes. It is concluded that cultivation of maize cultivars with longer growth periods and higher thermal requirements could mitigate the negative effects of warming climate on crop production and food security in the NCP study area and beyond.

DOI

[71]
Xiao D P, Tao F L, Liu Y Jet al., 2013. Observed changes in winter wheat phenology in the North China Plain for 1981-2009.International Journal of Biometeorology, 57(2): 275-285.Climate change in the last three decades could have major impacts on crop phenological development and subsequently on crop productivity. In this study, trends in winter wheat phenology are investigated in 36 agro-meteorological stations in the North China Plain (NCP) for the period 1981-2009. The study shows that the dates of sowing (BBCH 00), emergence (BBCH 10) and dormancy (start of dormancy) are delayed on the average by 1.5, 1.7 and 1.5 days/decade, respectively. On the contrary, the dates of greenup (end of dormancy), anthesis (BBCH 61) and maturity (BBCH 89) occur early on the average by 1.1, 2.7 and 1.4 days/decade, respectively. In most of the investigated stations, GP2 (dormancy to greenup), GP3 (greenup to anthesis) and GP0 (entire period from emergence to maturity) of winter wheat shortened during the period 1981-2009. Due, however, to early anthesis, grain-filling stage occurs at lower temperatures than before. This, along with shifts in cultivars, slightly prolongs GP4 (anthesis to maturity). Comparison of field-observed CERES (Crop Environment Resource Synthesis)-wheat model-simulated dates of anthesis and maturity suggests that climate warming is the main driver of the changes in winter wheat phenology in the NCP. The findings of this study further suggest that climate change impact studies should be strengthened to adequately account for the complex responses and adaptations of field crops to this global phenomenon.

DOI PMID

[72]
Xiao Y G, Qian Z G, Wu Ket al., 2012. Genetic gains in grain yield and physiological traits of winter wheat in Shandong Province, China, from 1969 to 2006.Crop Science, 52(1): 44-56.Knowledge on the changes in yield potential and associated physiological traits is essential for understanding the main yield-limiting factors and guiding future breeding strategies. Our objective was to identify physiological traits associated with genetic gains in grain yield of winter wheat (Triticum aestivum L.) in Shandong province, China. Thirteen milestone cultivars and two advanced lines released from 1969 to 2006 were examined over 3 yr at Tai'an during 2006 to 2009. The genetic gain in grain yield was 62 kg ha(-1) yr(-1), largely associated with increased kernels per square meter, biomass, and harvest index (HI) and reduced plant height. Significant genetic changes were also observed especially for apparent leaf area index (LAI) at heading and anthesis, chlorophyll content (Chl) at anthesis, photosynthesis rate during grain filling, and stem water-soluble carbohydrate (WSC) content at anthesis. Comparing genotypes having Rht-D1b and others with both Rht-D1b and Rht8c (Rht-D1b+Rht8c) showed increased grain yield, thousand kernel weight, kernels per spike, kernel weight per spike, HI, canopy temperature depression, and Chl at anthesis and LAI at heading with the latter but no difference in height. The results suggested that genetic gains in grain yield in Shandong province were mainly contributed by increases in kernels per square meter and biomass, which were achieved through improving crop photosynthesis at and after heading, and the source for grain filling may have benefited from increased WSC in stems at anthesis.

DOI

[73]
Yuan Zaijian, Shen Yanjun, Chu Yingminet al., 2010. Characteristics and simulation of heat and CO2 fluxes over a typical cropland during the winter wheat growing in the North China Plain.Environmental Science, 31(1): 41-48. (in Chinese)In order to study the surface energy budget of the cropland in North China Plain,this paper discussed the characteristics of heat and CO_2 fluxes of the cropland during the winter wheat growing,and then simulated the dynamic change of the flux of heat and carbon by SiB2(simple biosphere model Version2) based on the observational data from 2005-10-10 to 2006-06-10 of Weishan experimental station.The results showed that the heat and CO_2 fluxes put up obvious inter-daily variations in the course of the wheat ...

[74]
Zhang X, Tang Q, Zheng Jet al., 2013. Warming/cooling effects of cropland greenness changes during 1982-2006 in the North China Plain.Environmental Research Letters, 8(2): 024038.This study analysed the changes in cropland greenness during 1982–2006 in the North China Plain (NCP) and investigated the warming/cooling effects of the greenness changes. The results show that while spring cropland greenness increased, early summer cropland greenness substantially decreased from 1982 to 2006. In contrast to the cooling and wetting effects of the greenness increase in spring, the greenness reduction in early summer had warming and drying effects. The cooling/warming effects of cropland greenness changes accounted for 6547% of the spatial variance of daily maximum temperature (T) change in spring and 6544% in early summer. The wetting/drying effects of cropland greenness changes accounted for 6548% of the spatial variance of daily minimum specific humidity (SPH) change in spring and 6519% in early summer. The cooling–wetting/warming–drying effects mainly resulted from the distinct partitioning of surface net radiation between surface latent heat flux and sensible heat flux over cropland with different greenness. Canopy transpiration plays a dominant role. The increased (decreased) cropland greenness corresponds to high (low) transpiration rate, less (more) sensible heat flux and high (low) humidity, and consequently cooling–wetting (warming–drying) effects. In comparison, there was little change in surface net radiation, although surface albedo and emissivity had changed with greenness change. (letter)

DOI

[75]
Zheng Jingyun, Liu Yand, Ge Quanshenget al., 2015. Spring phenodate records derived from historical documents and reconstruction on temperature change in Central China during 1850-2008.Acta Geographica Sinica, 70(5): 696-704. (in Chinese)To reconstruct the series of annual temperature in Central China from 1850 to 2008, we have applied the following data, including the phenodate data series of plants in spring derived from historical records, the data related to snowfall days in 4 sites of Hunan province derived from Yu-Xue-Fen-Cun in the archives of the Qing Dynasty, data from five tree-ring width chronologies. In the reconstruction, the instrumental observation data of annual temperature anomaly for the whole region was adopted as the calibrated series, and the stepwise regression was used for calibration with leave-one-out validation, together with variance matching. The results show that: (1) In Central China, temperature fluctuated at inter-annual and decadal scales since 1850, but increased rapidly after 1990, which exceeded the inter-annual and decadal variability before. Although the warm interval lasted 20 years from the mid-1920s to the mid-1940s, its warmth could not match with that of the 1990s-2000s. The coldest decades are the 1860s, 1890s and 1950s, while 1893 witnessed the lowest temperature. (2) There were decadal cycles of 10-20 years and 35 years in temperature variation in Central China, which contained a cycle of 12-14 years before the 1920s and cycles of 18-20 years and 35-years after the 1940s.

DOI

[76]
Zhou Guangsheng, 2015. Research prospect on impact of climate change on agricultural production in China.Meteorological and Environmental Sciences, 38(1): 80-94. (in Chinese)

DOI

Outlines

/