Research Articles

Reponses and sensitivities of maize phenology to climate change from 1981 to 2009 in Henan Province, China

  • LIU Yujie , 1 ,
  • QIN Ya 1, 2 ,
  • GE Quansheng 1 ,
  • DAI Junhu 1 ,
  • CHEN Qiaomin 1, 3
Expand
  • 1. Key Laboratory of Land Surface Pattern and Simulation, Institute of Geographic Sciences and Natural Resources Research, CAS, Beijing 100101, China
  • 2. Xi’an University of Science and Technology, College of Surveying and Mapping Science and Technology, Xi’an 710054, China
  • 3. University of Chinese Academy of Sciences, Beijing 100049, China

Author: Liu Yujie, PhD and Associate Professor, specialized in climate change. E-mail:

Received date: 2016-11-15

  Accepted date: 2017-01-16

  Online published: 2017-09-05

Supported by

National Natural Science Foundation of China, No.41671037, No.41301091

The National Key Research and Development Program of China, No.2016YFA0602402

The Youth Innovation Promotion Association of CAS, No.2016049

Copyright

Journal of Geographical Sciences, All Rights Reserved

Abstract

With the global warming, crop phenological shifts in responses to climate change have become a hot research topic. Based on the long-term observed agro-meteorological phenological data (1981-2009) and meteorological data, we quantitatively analyzed temporal and spatial shifts in maize phenology and their sensitivities to key climate factors change using climate tendency rate and sensitivity analysis methods. Results indicated that the sowing date was significantly delayed and the delay tendency rate was 9.0 d·10a-1. But the stages from emergence to maturity occurred earlier (0.1 d·10a-1<θ<1.7 d·10a-1, θ is the change slope of maize phenology). The length of vegetative period (VPL) (from emergence to tasseling) was shortened by 0.9 d·10a-1, while the length of generative period (GPL) (from tasseling to maturity) was lengthened by 1.7 d·10a-1. The growing season length (GSL) (from emergence to maturity) was lengthened by 0.4 d·10a-1. Correlation analysis indicated that maize phenology was significantly correlated with average temperature, precipitation, sunshine duration and growing degree days (GDD) (p<0.01). Average temperature had significant negative correlation relationship, while precipitation, sunshine duration and growing degree days had significant positive correlations with maize phenology. Sensitivity analysis indicated that maize phenology showed different responses to variations in key climate factors, especially at different sites. The conclusions of this research could provide scientific supports for agricultural adaptation to climate change to address the global food security issue.

Cite this article

LIU Yujie , QIN Ya , GE Quansheng , DAI Junhu , CHEN Qiaomin . Reponses and sensitivities of maize phenology to climate change from 1981 to 2009 in Henan Province, China[J]. Journal of Geographical Sciences, 2017 , 27(9) : 1072 -1084 . DOI: 10.1007/s11442-017-1422-4

1 Introduction

Phenology is the study of periodic plant and animal life cycle events and how these are influenced by seasonal and interannual variations in climate, as well as habitat factors (Zhu and Wan, 1973). As the phenology will shift with the environmental changes and therefore it can be used as an important biological indicator to reflect the responses of terrestrial systems to climate change (He et al., 2015). According to IPCC 5th Assessment Report, the global average temperature has increased by 0.85℃ over the past 100 years (IPCC, 2013). Under the background of global warming, the studies of the responses of phenology to climate change have become an important international issue.
Many studies have shown that shifts in plant phenology were correlated with increasing temperature (Schleip et al., 2009; Wu and Liu, 2013; Wittich and Liedtke, 2015). For instance, Wang et al. (2015) studied the influence of temperature rising and frost in wheat flowering period in eastern Australia, which suggested that farmers could choose longer growing-season cultivars to offset the negative effects of increasing temperature in the future. Other studies also paid attention to precipitation and other climate factors. For instance, Wang et al. (2016) investigated the influences of average temperature and precipitation on the growing season of maize and soybean in the East Greater Hinggan Mountains during the last 29 years. Ji et al. (2012) found that precipitation during the growing season of maize in Northeast China decreased starting from 1991, and the accumulated temperature (≥10℃) zone extended northward 200 to 300 km and eastward 50 to 150 km since 1971. Ren and Yin (2013) focused on single climate factor during the crop growing season in upstream of the Hanjiang River, and found that late spring chilling would seriously affect the production of rice, wheat and fruit trees. Some researchers have also studied the impacts of tropical climate change on the growth and phenological phases of Jerusalem artichoke, and found that low temperature and a short-wave light were good for Jerusalem artichoke tuber growth and development (Puangbut et al., 2015). Oteros et al. (2015) used a general linear hybrid model to examine the influences of temperature change on each phenological parameter in different species of Spanish cereal crops. The results showed that changes of phenology affected crop yield but proper human intervention would reduce these negative effects.
Although a large number of studies have been carried out, most of them only focused on a single climate factor change influences such as temperature or precipitation, on crop phenology. Actually, compared with natural plants, crop phenology is influenced by the joint effects of climate, hydrology, soil condition and the management measures. Currently, quantitative researches on comprehensive changes of multiple climate factors on crop phenology were still insufficient (Tao et al., 2014; He et al., 2015). Therefore, based on the long sequence of phenological observation data from 1981 to 2009, this study analyzed the temporal and spatial shifts of maize phenology and their sensitivities to key climate factors in Henan Province. The mechanism of climate change impacts on key phenological trends for maize was also discussed.

2 Data and methods

2.1 Study area

Henan, one of the major grain production provinces in China, is located between 31°23′- 36°22′N and 110°21′-116°39′E. The annual average temperature is 13-15℃, varying from -1.57℃ to 3.54℃ in January and 24℃ to 28℃ in July. The annual frost-free period is 180 to 240 days from north to south. The annual precipitation is approximately 550 to 1100 mm, and concentrates in the southern and western regions. Half of the annual precipitation concentrates in summer, often with heavy rains. The sunshine duration is 1800 to 2100 hours per year. The typical planting system is winter wheat and summer maize rotation, which could be representative of agricultural production in the North China Plain.

2.2 Data

Agro-meteorological stations selected for analysis must meet the following criterions: (1) have long historical observation records of maize phenology; (2) have matched climate observed data, which can be used to perform correlation analysis; (3) have field management records, such as cultivars and irrigation and fertilizer practices; (4) highlight local agricultural production. Based on the above requirements, six sites were selected, namely, Lushi (LS), Nanyang (NY), Ruzhou (RZ), Shangqiu (SQ), Xinxiang (XX), and Zhengzhou (ZZ) for the whole study area. The maize phenological data from 1981 to 2009 include sowing date (SOD), emergence date (EMD), trefoil date (TRD), seven leaf date (SLD), jointing date (JOD), tasseling date (TAD), flowering date (FLD), silking date (SID), milk ripening date (MRD) and maturity date (MAD). Corresponding meteorological observation data from 1981 to 2009 were also collected including maximum temperature, minimum temperature, average temperature, precipitation and sunshine duration. The locations and average annual changes for main climate factors at each station are presented in Figure 1 and Table 1, respectively.
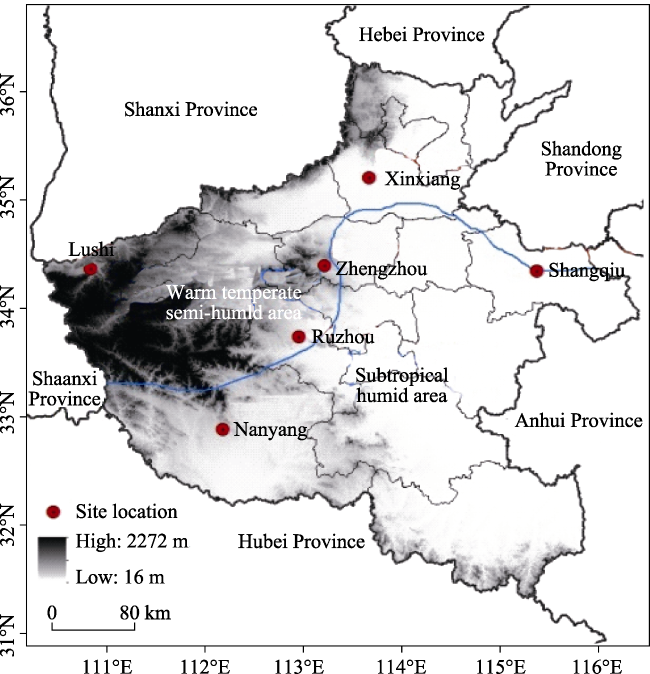
Figure 1 Location of the study area and selected sites in Henan Province
Table 1 Geographical information and average annual climate changes during maize growing season (mean value ±SD) of each site in Henan Province
Station Longitude
(°E)
Latitude
(°N)
Altitude
(m)
Growing season length (d) Tmean
(℃)
Precipitation
(mm)
Sunshine
duration (h)
LS 111.02 34.00 568.80 85.36±16.93 23.32±2.88 416.05±5.13 514.54±4.15
NY 112.58 33.17 129.2 97.67±8.40 25.93±2.59 431.39±13.53 496.64±4.12
RZ 112.83 34.18 212.9 93.29±6.32 25.90±2.72 392.68±12.83 510.27±4.00
SQ 115.67 34.45 50.10 90.97±6.09 25.82±2.68 518.60±14.54 551.74±4.28
XX 113.82 35.17 79.00 92.69±7.41 25.97±2.58 335.11±11.83 586.69±4.05
ZZ 113.67 34.82 80.80 90.07±4.31 26.08±2.65 388.65±13.09 485.72±3.98

2.3 Methods

2.3.1 Trend analysis
Trend analysis was used to analyze the temporal variations in maize phenology at each site from 1981 to 2009. This method can quantitatively assess the overall tendency of each trait during the whole study period (Guo et al., 2010; Ma et al., 2006). The formula is shown below:
$$\theta_i=\frac{n\times\sum^n_{j=1}(j\times p_{I,j})-\sum^n_{j=1}j\times \sum^n_{j=1}p_{i,j}}{n\times \sum^n_{j=1}j^2-(\sum^n_{j=1}j)^2}\ \ (1)$$
where n is the number of years, Pi,j is the value of variable i in year j, and θi is the change slope of variable i. If θi>0, the maize phenological period was delayed or lengthened, otherwise it was advanced or shortened.
The t-test was used to test the significance of the changing trend.
2.3.2 Sensitivity analysis
The sensitivity of the phenological change refers to the days that maize phenological period changes as the climate factors changes one unit. Generally, linear regression is used to represent the relationship between phenology and the climate factors:
$$y=a+\frac{\sum^n_{i=1}(x_i-\bar{x})(y_i-\bar{y})}{\sum^n_{i=1}(x_i-\bar{x})^2}*x=a+bx\ \ (2)$$
where x represents the average value of climate factors, and y is the maize phenology. The sensitivity coefficient can be expressed as:
$$Se=\frac{dy}{dx}=b\ \ (3)$$
The regression coefficient b can be calculated using the least squares method (LSM). The formula is as follows:
$$Se=\frac{dy}{dx}=b=\frac{\sum^n_{i=1}(x_i-\bar{x})(y_i-\bar{y})}{\sum^n_{i=1}(x_i-\bar{x})^2}=\frac{\sum^n_{i=1}(x_i-\bar{x})(y_i-\bar{y})}{\sqrt{\sum^n_{i=1}(x_i-\bar{x})^2(y_i-\bar{y})^2}}*\frac{\frac{1}{n}\sqrt{\sum^n_{i=1} (y_i-\bar{y})^2}}{\frac{1}{n}\sqrt{(x_i-\bar{x})^2}}=r*\frac{SD_{phe}}{SD_{tem}}\ \ (4)$$
where r is the Pearson correlation coefficient between x and y, SDphe is the standard deviation (SD) of the phenological time series, and SDtem is the time series data standard deviation of climate factor. The Se is significant if the correlation coefficients (r) of y and x are obvious.
2.3.3 Growing degree days
Generally, growing degree days (GDD) is an index used to analyze the quantity of heat that crop growth requires. In this study, GDD refers to the accumulated average daily temperature higher than 10℃. The formula is expressed as following (McMaster and Wilhelm, 1997):
$$GDD=\sum^n_0\bigg[\frac{T_{max}+T_{min}}{2}\bigg]-T_{base} \ \ (5)$$
where Tmax is the daily maximum temperature, Tmin is the daily minimum temperature, and Tbase is the biological lower limit temperature in maize growing season (10℃) (Hou et al., 2014).

3 Results analysis

3.1 Trends of key climate factors

Over the past 29 years, trend of average temperature in Henan was 0.2℃·10a‒1 during the maize growing season, showing an increasing trend (Table 2). As the altitude of LS was the highest of all the sites, the maximum temperature during growing season was lower than that of the other sites (Figure 2a). The warming tendency rate at LS was the highest of all the six sites (Table 2). It can be found that the tendency rate grew higher with the increase of the altitude. The average precipitation showed an increasing trend in the maize growing season, and the tendency rate was 30.7 mm·10a‒1. The changing rate at RZ, XX and ZZ was higher than that of the other sites and reached a significance level. The annual fluctuation range of precipitation at SQ was the largest (Figure 2b). The sunshine duration of most sites decreased with a rate of 28.1 h·10a‒1 except RZ, which increased by 14.5 h·10a‒1. The sunshine duration of LS in most of the years was higher than the 29-year median value (1981-2009) (Figure 2c). The average GDD of growing season increased by 51.6℃·10a‒1, but the tendency varied at each site. GDD at SQ, XX and ZZ increased while the other three sites showed a decreasing tendency (Table 2).

3.2 Phenological changes

Overall, the maize phenology was advanced during the whole growing season (Table 3 and Figure 3). EMD and TRD of most sites were advanced by 0.8 d·10a‒1 and 0.1 d·10a‒1 respectively. The changes of SLD and MAD were not significant. SLD, JOD, TAD, FLD, SID and MRD were advanced by 0.2 d·10a‒1, 1.3 d·10a‒1, 1.7 d·10a‒1, 1.3 d·10a‒1, 0.8 d·10a-1 and 1.6 d·10a‒1 respectively. Among them, the TAD, SID and MRD presented significant changing trends. The SOD of each site presented a trend of delay, averaging 9.0 d·10a‒1 for the whole study area. But the extent of the changes varied at different sites.
We further analyzed the changing differences among sites. The average MAD of the whole region was advanced by 0.4 d·10a-1. But MAD of maize at most sites showed a delayed trend, with XX being delayed the most and reaching the significance level of p<0.01. However, the MAD was advanced at LS and ZZ. The MAD changing trend at LS was significant. It can also be found that most maize phenological stages at LS were advanced except for SOD.
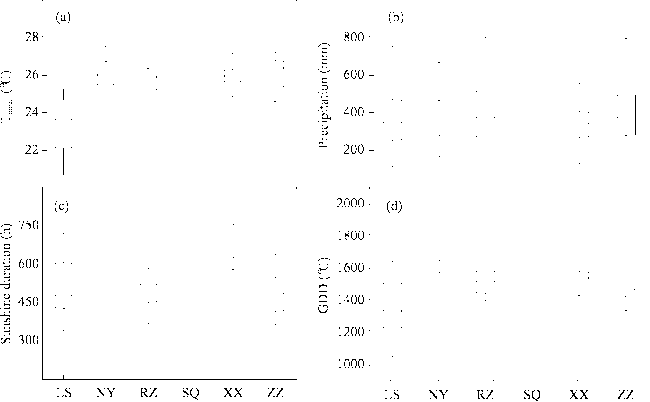
Figure 2 Changes of key climate factors during the maize growing season (1981-2009) at different sites in Henan Province (Different climate factors in growing season of the same site also showed different changes. At LS and NY, average temperature and precipitation during maize growing season increased while sunshine duration and GDD decreased. The average temperature, precipitation and GDD during the maize growing season decreased at SQ, XX and ZZ. RZ was characterized by increasing in the average temperature, precipitation and sunshine duration but decreasing in GDD.)
Table 2 Climate change tendency rates at different sites in Henan Province (+ and - indicated that the climate factor increased or decreased, respectively. ** and * indicated significance levels at 1% and 5% respectively. The bellows are same)
Climate factor LS NY RZ SQ XX ZZ Study area
Tmean (℃·10a-1) 0.7* 0.2 0.1 0.1 0.1 0.3* 0.2
Precipitation (mm·10a-1) 15.1 25.8 96.8** 8.3 33.0** 78.6* 30.7
Sunshine duration (h·10a-1) -63.1* -29.1 14.5 -42.5* -31.2 -20.1 -28.1**
GDD (℃·10a-1) -85.8 -66.6* -76.8** 55.4** 89.3** 61.5** 51.6**
The vegetative period length (VPL) refers to the number of days from EMD to TAD during maize growing. As shown in Figure 3, the maize VPL showed a decreasing trend at most sites. At LS, NY, RZ, SQ and XX, it was shortened by 5.5 d·10a‒1, 1.1 d·10a‒1, 0.5 d·10a‒1, 0.4 d·10a‒1 and 1.8 d·10a‒1 respectively, while it was lengthened by 1.4 d·10a‒1 at ZZ. The VPL changing trend at LS was significant at p<0.05 level. Averagely, the VPL of maize in Henan was shortened by 0.9 d·10a‒1. The generative period length (GPL) is the number of days from TAD to MAD. In Henan, the maize GPL was prolonged by 1.7 d·10a‒1 from 1981 to 2009. It was prolonged by 1.9 d·10a‒1, 3.1 d·10a‒1, 1.7 d·10a‒1 and 5.0 d·10a‒1 at NY, RZ, SQ and XX, respectively. The changing trend at XX reached the significance level of p<0.01. But the GPL of LS was shortened by 0.9 d·10a‒1 (Figure 3a). Generally, the growing season length (GSL: the number of days from EMD to MAD) of maize was prolonged by 0.4 d·10a‒1 averagely. It was extended by 0.8 d·10a‒1, 2.6 d·10a‒1, 1.4 d·10a‒1, 3.2 d·10a‒1 and 0.9 d·10a‒1 at NY, RZ, SQ, XX and ZZ, respectively, but the GSL of LS was shortened by 9.8 d·10a‒1.
Table 3 The trends of the changes of maize phenology at selected stations in Henan Province (+ and - in the table showed delay and advance of the phenological stages respectively. The unit is d·10a‒1)
Station SOD EMD TRD SLD JOD TAD FLD SID MRD MAD
LS 10.0 -3.1 -0.7 -4.0* -3.7 -6.7** -9.6 -2.7 -11.0** -12.9*
NY 11.9** 0.3 -0.4 -1.1 0.5 -0.8 -1.1 -1.6 -1.6 1.1
RZ 5.9 -1.4 0.7 1.0 -0.5 -1.4 -0.4 -0.4 4.4** 1.7
SQ 10.2* -0.1 -0.1 0.3 -1.3 -0.5 -0.8 0.7 1.0 1.2
XX 11.0** 1.1 2.3 3.1* -3.0 -0.6 0.9 1.0 1.2 4.3**
ZZ 5.3 -1.4 -1.2 0.07 0.07 0.06 -0.04 -0.4 -3.2 -0.5
Study area 9.0** -0.8 -0.1 -0.2 -1.3 -1.7* -1.3 -0.8* -1.6* -0.4
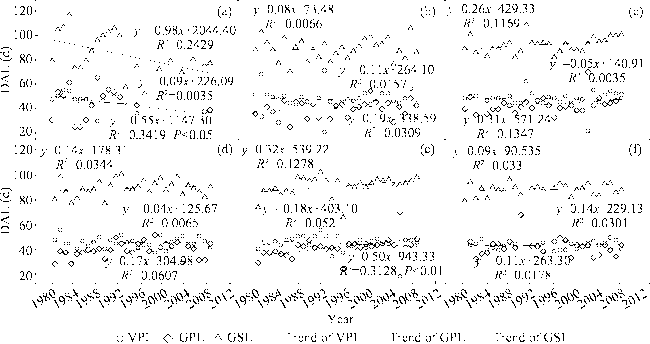
Figure 3 Variations in maize phenological phase in Henan Province^a. LS; b. NY; c. RZ; d. SQ; e. XX; f. ZZ. VPL is the vegetative period length, GPL is the generative period length, and GSL is the entire growing season length, DAE means days after emergence

3.3 Correlation analysis

We analyzed the correlation of growing season length (GSL) with key climate factors including average temperature, precipitation, sunshine duration and GDD in Henan. Results showed that average temperature had a significant negative correlation with GSL, and the correlation coefficient was -0.26 (Figure 4a). However, precipitation, sunshine duration and GDD had positive correlation with GSL and the correlation coefficients were 0.21, 0.38 and 0.78, respectively (Figures 4b-4d).
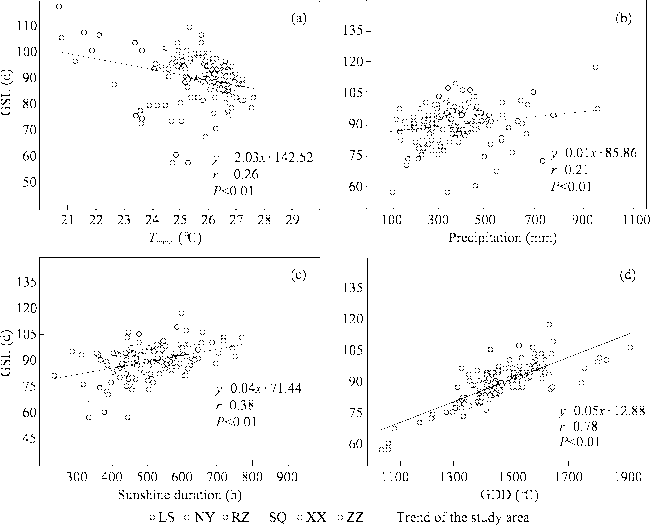
Figure 4 Correlation analysis between key climate factors and maize growing season length

3.4 Sensitivity analysis

The sensitivity of maize growing season length to climate factors varied. Responses of GSL at the same site to different climate factors changes were also different. The response of GSL to temperature change was negative. Four of the six selected sites reached significance level. The GSL at LS, NY, RZ, SQ, XX and ZZ was shortened by 10 d, 4.7 d, 5.0 d, 5.5 d, 4.0 d and 3.2 d, respectively when average temperature rose by 1℃ (Figure 5a). Compared with the sensitivity to temperature, the sensitivity of GSL to precipitation at each site was lower. Only LS and NY showed moderate sensitivity levels (p<0.05). The GSL was prolonged by 0.04 d and 0.02 d, respectively, when precipitation increased by 1 mm at these two sites. But at XX, the GSL was shortened by 0.001 d when precipitation increased by 1 mm (Figure 5b). The sensitivity of GSL to sunshine duration at each site was also different. Sensitivities at LS and XX were the highest, with GSL of maize being prolonged by 0.13 d and 0.03 d when the sunshine duration increased by 1 h, respectively (Figure 5c). Sensitivity of GSL to GDD at each site was significant (p<0.05). As GDD increased by 1℃, the GSL of different sites was prolonged by 0.09 d, 0.05 d, 0.04 d, 0.05 d, 0.05 d and 0.02 d respectively (Figure 5d). At all of the six sites, responses of GSL at LS to all climate factors reached the significance level. The sensitivities of GSL were -10 d, 0.04 d, 0.13 d and 0.09, respectively, as average temperature, sunshine duration and GDD increased by one unit.
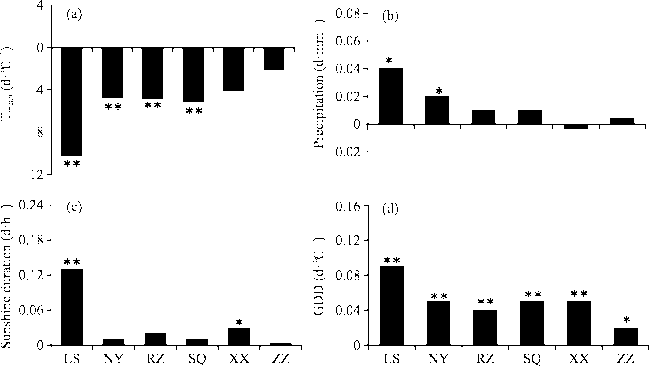
Figure 5 Sensitivity analysis of maize phenological changes in climate factors

4 Discussion

4.1 Climate change impacts on maize phenology

In this study, detailed and long time series climate and observed phonological data were
used to analyze the maize phenological variation and its sensitivity to key climate factors change. Our results indicated that the temperature, precipitation and GDD increased during maize growing season. Meanwhile, the sunshine duration of all sites showed a decreasing trend and LS was the most significant one. The possible reason was air humidity and air pollution caused by human activities in the northern and central parts of Henan. The high humidity and pollution caused an increase in light fog or haze (Zhao et al., 2010), and reduced the visibility of atmosphere. Li et al. (2012) studied the agricultural climatic resources change of summer maize growth period in Henan. He found that the precipitation increased from 1961 to 2008, and the tendency trend was positive in most parts of central, eastern and southern Henan. The changing trend of sunshine duration from 1961 to 2008 also declined and the spatial differences were significant among these years.
Under the background of climate change, VPL in Henan was shortened, but the GPL and GSL were extended during the past 29 years. The correlation coefficient between GDD and GSL was the highest, while the correlation coefficient between precipitation and GSL was the lowest, due to the higher requirements for precipitation and temperature during each physical growth stage of maize. The increase of precipitation delayed some phenological stages. Conversely, persistent droughts advanced the dates of flowering, fruiting and defoliation (Chang and Zhang, 2011). Meng et al. (2015) also found that the maize growing season increased in the North China Plain from 1981 to 2009 and had significant correlation with climate factors. The VPL was prone to drought, which slowed the plants growth and led to a significant delay in the maize growing season (Dou and Yu, 2014; Song et al., 2016). Although the overall trend of maize phenology was advanced and shortened, SOD was prolonged by farmers to adapt to the whole advanced growing season. It can also be found that the maize phenological trends of LS were very similar to that of the whole region, because LS had the highest elevation among the six sites. The phenological fluctuations of LS were much larger than those of the other sites. Overall the MAD was advanced by 0.4 d·10a‒1, the amplitudes of the delay in MAD at the other sites were less than the increase at LS. This can explain the main reason why the overall tendency of MAD was advanced. The variations index of generative growth phenology of crops was obviously greater than that of the vegetative growth phenology (Wu et al., 2009).

4.2 Sensitivities of maize phenological responses to climate change

Generally, the sensitivities of maize phenology to precipitation, sunshine duration, GDD and the average temperature increased during the maize growing season. But the spatial differences also existed at different sites as the GDD requirements were different (Hou et al., 2014). This is mainly because the spatial and temporal variations of precipitation became more complex with the climate warming. Meanwhile, there were also significant differences in the temperature and precipitation changes with the changes of terrain and seasons (Wang et al., 2010). Climate change would cause variations in crop phenology, which could increase the instability of agricultural production as well as the yield fluctuations (Zhang et al., 2016). The same crop in different regions responded differently to changes in climate factors. Many scholars discussed the responses of crop phenological changes to climate changes (Liu et al., 2013). Guo et al. (2015) found that temperature was a key factor which can accelerate crop growth and determine the length of the growing season. Liu et al. (2014), who studied the impacts of temperature and precipitation on the crop planting system in Hebei Province, concluded that climate change reduced the agricultural production level and raised the production cost to a certain extent. At the same time, frequent extreme climate events also increased the loss of agricultural production. The impacts of climate change on maize phenology in Xinjiang of China showed a trend toward earlier sowing dates. It was due to the rising temperature which caused the crops to meet the accumulated temperature demand in advance, making the tasseling date and maturity date tend to advance (Xiao et al., 2015). Maize varieties and changes in plant density would affect the water consumption during the maize growth period and would further affect the phenology and yield (Liu et al., 2012).
The responses of different crop types to climate change were different. Under the background of climate change, the vegetative growth length of winter wheat in Henan was shortened, while the generative growth length was lengthened (Sun et al., 2014). The trend of warming in March and April was obvious, which advanced the seeding date and transplanting date of rice significantly. The length of time from transplanting to earing was significantly extended (Xue et al., 2010). Annual accumulated temperature higher than 10℃ significantly increased in the North China Plain, but the precipitation decreased. The seeding date of winter wheat was delayed, but the jointing date was advanced and maturity date of winter wheat was delayed in most parts of the province (Yang et al., 2011). Based on our results, we concluded that the regularity in the changes of vegetative growth period and generative growth period of maize in Henan was similar to that of wheat, but there were some differences with rice.

4.3 Uncertainties

Limited by the length of the article and observed data, we mainly discussed the maize phenological variation and the impacts of climate change on it. In addition, the maize phenology was also affected by the cultivar shifts and field management measure changes. With climate warming, the risk of extreme heat wave and precipitation increased, and the high temperature during the vegetative growth period could reduce the maize photosynthetic rate (Wang et al., 2015). All these factors would affect the growth and development of maize and then lead to phenological changes. The influences of extreme climate change, cultivar shifts, planting density, and irrigation and fertilization management on crop phenology should be considered comprehensively in the future to deeply understand the mechanisms of crop phenological responses to climate change.

5 Conclusions

Climate trend rate and sensitivities analysis were applied in this study based on long sequence observed phenological data. The average temperature, precipitation, and GDD in maize growing season all showed increasing trends from 1981 to 2009. The average temperature increased by 0.2℃·10a‒1, the precipitation increased by 30.7 mm·10a‒1, and the GDD increased by 51.6℃·10a‒1 while sunshine duration decreased by 28.1 h·10a‒1.
The SOD at the whole study area was delayed by 9.0 d·10a‒1, while the EMD, TRD, SLD, JOD, TAD, FLD, SID, MRD and MAD of maize were advanced by 0.8 d, 0.1 d, 0.2 d, 1.3 d, 1.7 d, 1.3 d, 0.8 d, 1.6 d and 0.4 d, respectively. The VPL of maize was shortened by 0.9 d·10a‒1 and GPL of maize was lengthened by 1.7 d·10a‒1. The GSL was lengthened by 0.4 d·10a‒1.
The GSL of maize has a significant negative correlation with average temperature, but a significant positive correlation with precipitation, sunshine duration and GDD with a significance level of P<0.01, and the correlation coefficient was -0.26, 0.21, 0.38 and 0.78, respectively. The GSL at LS, NY, RZ and SQ were shortened by 10 d, 4.7 d, 5 d and 5.5 d, respectively, when the average temperature increased by 1℃ with a significance level of p<0.01. Sensitivity to precipitation was lower than to other climate factors at each site, only LS and NY reached the significance level of p<0.05. For an increase in 1 mm of precipitation, GSL at LS and NY was prolonged by 0.04 d and 0.02 d, respectively. The sensitivity to sunshine duration of LS and XX reached the significance level of p<0.05. When sunshine duration increased by 1 h, the GSL of LS and XX was prolonged by 0.13 d and 0.03 d, respectively. Maize at all the six sites was sensitive to GDD, that is, when GDD increased by 1℃, the GSL of LS, NY, RZ, SQ, XX and ZZ was prolonged by 0.09 d, 0.05 d, 0.04 d, 0.05 d, 0.05 d and 0.02 d, respectively.

The authors have declared that no competing interests exist.

[1]
Chang Z F, Zhang J H, 2011. The achievements, problems and growing point on study of plant phenology.Chinese Agricultural Science Bulletin, 27(29): 276-283. (in Chinese)With global warming,the response of plant phenology to global warming has become the study focus.The author looked at a lot of research data at the same time of plant phenology observations in the years.This paper analyzed the main problems and find out the growing point of future development of phenology based on research on phenology characteristics,applied research of phenology,response phenological to global change and research methods of phenology were reviewed:(1) search for genes on the environmentally sensitive on the plant phenology;(2) the application development of research results;(3) automatic methods of observation on plant ' phenology.

DOI

[2]
Dou C Y, Yu J C, Yu X Q, 2014. Effect of short time and continuous drought stress on growth and yield of maize in semi-arid area of western Liaoning.Journal of Jilin Agricultural Sciences, 39(3): 18-21, 58. (in Chinese)Drought stress and water deficiency is the status quo in western arid region of Liaoning province. To provide theoretical basis for reasonable irrigation, effects of short time and continuous drought stress on the growth, yield and water use efficiency of maize were studied with 'Danyu 77' as the test material under controlled irrigation. The results showed that the growth and yield of maize were restrained by drought stress, and the situation was the worst in continuous drought stress, in which the maximum reduction of yield reached 42.6%. Seedling stage, elongation stage and heading stage of plant growth were susceptible to drought stress, while during the grain filling stage, the adverse effects were not significant. Water use efficiency of the treatments ranged from 2.2 to 3.23 kg路m-3, and in following order: continuous drought from seedling to elongation stage ck drought in grain filling stage continuous drought from elongation to heading stage =seedling stage drought continuous drought from heading to grain filling stage elongation stage drought heading stage drought. WUE decreased as drought stress happened during elongation stage to heading stage.Though WUE increased in continuous drought stress, but crop production reduced substantially. When the water resource is scarce for irrigation in the research area, for balancing food production and WUE, appropriate drought stress in grain filling stage is recommended.

[3]
Guo J P, 2015. Advanced in impact of climate change on agricultural production in China.Journal of Applied Meteorological Science, 26(1): 1-11. (in Chinese)Climate change,the main feature of which is global warming,has become one of the important environmental problems in the world.Also,it is a matter of general concern by the scientific community,governments and the social public.Climate change has brought a series of problems that beyond the range of nature changes in the earth itself,which poses a serious threat to human survival and social economy.Agriculture,especially crop production and food security,is one of the largest and the most direct industry affected by climate change.Therefore,the impact of climate change on agricultural production is always one of the hottest issues in the field of climate change.The present situation and progress in the research field of climate change impact on agricultural production in China is summarized systematically,introducing research methods,the progress in the experiment of greenhouse gases concentration enrichment in the atmosphere impact on crops,impacts and future trends of climate change on agricultural climate resources,the possible impact of climate change on crop growth and yield,impacts and future trends of climate change on agricultural planting system and varieties distribution,impact of climate change on crop potential productivity,impact of measures of adapting to climate change to increase the utilization ratio of agricultural climate resources and so on.On the basis,current problems in the impact assessment of climate change on agriculture is proposed too.In order to improve the reliability and rationality of the impact assessment for climate change on agriculture,more attention needs to be paid to the research of uncertainty of future climate change scenarios,model prediction and evaluation method.In addition,further researches are also needed about the impact of extreme weather events under climate change on agricultural production,the impact of climate change on agricultural plant diseases and insect pests,impacts of climate change on cash crops,fruit,animal husbandry and farmland ecosystem.

[4]
Guo Z X, Zhang X N, Wang Z Met al., 2010. Simulation and variation pattern of vegetation phenology in Northeast China based on remote sensing.Chinese Journal of Ecology, 29(1): 165-172. (in Chinese)By using 1982-2003 GIMMS-NDVI data and with the help of GIS spatial analysis, the NDVI time-series data of different vegetation types in Northeast China were extracted. In the meantime, the phenological phases of the vegetation types were simulated by Logistic function, with their variation trends in 1982-2003 analyzed. It was shown that the beginning dates of vegetation growth seasons in needleleaf forest, broadleaf forest, grassland, meadow, and swamp were advanced, and the lengths of the growth seasons were prolonged, being more obvious in swamps, followed by in needle-leaf forests. On the contrary, the beginning dates of vegetation growth seasons in needle-leaf and broadleaf mixed forest, shrub, grassland, and farmland were delayed, and the lengths of the growth seasons were shortened, being more obvious in farmland, followed by in grassland. The ending dates of the growth seasons appeared inconsistent, being delayed in needleleaf forest and swamp, slightly advanced in broadleaf forest, grassland, and meadow, and advanced in needle-leaf and broadleaf mixed forest, shrub, grassland, and farmland, especially in shrub.

DOI

[5]
He L, Asseng S, Zhao Get al., 2015. Impacts of recent climate warming, cultivar changes, and crop management on winter wheat phenology across the Loess Plateau of China.Agricultural and Forest Meteorology, 200: 135-143.Crop yields are influenced by growing season length, which are determined by temperature and agronomic management, such as sowing date and changes in cultivars. It is essential to quantify the interaction between climate change and crop management on crop phenology to understand the adaptation of farming systems to climate change. Historical changes in winter wheat phenology have been observed across the Loess Plateau of China during 1981–2009. The observed dates of sowing, emergence, and beginning of winter dormancy were delayed by an average of 1.2, 1.3, and 1.202days02decade 611 , respectively. Conversely, the dates of green-up (regrowth after winter dormancy), anthesis, and maturity advanced by an average of 2.0, 3.7, and 3.102days02decade 611 , respectively. Additionally, the growth duration (sowing to maturity), overwintering period, and vegetative phase (sowing to anthesis) shortened by an average of 4.3, 3.1, and 5.002days02decade 611 , respectively. The changes in phenological stages and phases were significantly negatively correlated with a temperature increase during this time. Differently to most other phase changes, the reproductive phase (anthesis to maturity) prolonged by an average of 0.702day02decade 611 , but this was spatially variable. The prolonged reproductive phase was due to advanced anthesis dates and consequently caused the reproductive phase to occur during a cooler part of the season, which led to an extended reproductive phase. Applying a crop simulation model using a field-tested standard cultivar across locations and years indicated that the simulated phenological stages have accelerated with the warming trend more than the observed phenological stages. This indicated that, over the last decades, later sowing dates and the introduction of new cultivars with longer thermal time requirement have compensated for some of the increased temperature-induced changes in wheat phenology.

DOI

[6]
Hou P, Liu Y E, Xie R Zet al., 2014. Temporal and spatial variation in accumulated temperature requirement of maize.Field Crops Research, 158: 55-64.Temperature, especially accumulated temperature, is an important environmental factor that plays a fundamental role in agricultural productivity. To examine temporal and spatial variation in accumulated temperature requirements of maize as indicated by ≥1002°C accumulated temperature and growing degree days (GDD), we conducted experiments during 2007–2012 at 35 locations in seven provinces in the north spring maize region between 35°11′02N and 48°08′02N and 6 locations in four provinces in the Huanghuaihai maize region between 32°52′02N and 41°05′02N in China. The most widely cultivated maize hybrids of ZD958 and XY335 were used in this study. We found that the coefficients of variation for ≥1002°C accumulated temperature and GDD requirements were different during different growth periods, with a descending rank order of sowing to emergence02>02silking to maturity02>02emergence to silking02>02sowing to maturity and greater in the north spring maize region than in the Huanghuaihai maize region. The coefficients of variation were lower for ≥1002°C accumulated temperature than GDD requirements for both cultivars in both planting regions. Significant differences existed between locations and years for the ≥1002°C accumulated temperature and GDD requirements. These have implications for appropriate maize cultivars recommendation, and high and stable yield achieving by reasonably using accumulated temperature across different regions of China.

DOI

[7]
IPCC, 2013. Climate Change 2013: The Physical Science Basis. In: Stocker T F, Qin D, Plattner G-Ket al. eds. Contribution of Working Group I to the Fifth Assessment Report of the Intergovernmental Panel on Climate Change. Cambridge, United Kingdom and New York, NY,USA: Cambridge University Press, 1535 pp.

[8]
Ji R P, Zhang Y S, Jiang L Xet al., 2012. Effect of climate change on maize production in Northeast China.Geographical Research, 31(2): 291-298. (in Chinese)This paper analyzed the facts of climate change and its effects on the maize production in Northeast China according to the meteorological,maize yield and planting area data.The results are as follows.The heat resources in this region have been increasing continually since 1971.The accumulated temperature over 10℃ has increased by 262.8℃ averaged for the whole region.The plain area with accumulated temperature(≥10℃) higher than 2700℃ has extended northward 200-300 km,and eastward 50-150 km respectively.The precipitation in growing period(from April to September) during 1981-1990 had an increasing trend,but has been decreasing continually since 1991.Annual average water deficiency amounts to 391.5 mm.Humid area is decreasing and the whole region has a drying trend.The early frost date(the date with the lowest temperature ≤0℃) has postponed 7-9 days,and the frostless period has prolonged 14-21 days,so the probability of frost disaster occurrence is reduced.The period with high probability of lingering low temperature disaster on maize was observed in the 1960s and 1970s,and the period with low probability started in the 1990s.Heilongjiang Province had a high probability of frost disasters.With the heat resources increasing continually,adaptive area of maize planting is growing,with its north boundary extending northward and eastward,so the adaptive seeding date comes earlier.With steady increase of maize planting area and yield,the total yield and total planting area will increase by 9,670,000 t and 720,000 ha per decade respectively. Although climate change has supplied more heat resources for maize production in Northeast China,it is enhancing drought.So,we should adjust maize distribution and varieties.Additionally,using irrigation engineering and dry-farming technology widely,and selecting varieties with disease-resistance,drought-endurance and strong stress-resistance are the important measures to realize sustainable development of maize production in Northeast China.

DOI

[9]
Li S Y, Fang W S, Ma Z H, 2012. Change of agricultural climate resources in Henan province during summer maize growing season.Journal of Henan Agricultural Sciences, 41(7): 21-26. (in Chinese)To fully and reasonably use climate resources and assess possible effects of future climate,the interannual change trend and spatial distribution differentiation of light,temperature and precipitation during summer maize season were analyzed using the weather data from 1961 to 2008 of 118 meteorological stations in Henan province.Possible effects of agro-climate resource changes on summer maize production were further discussed.Results showed that light resource reduced from north to south spatially,and presented obviously decreasing trend:the solar radiation and sunshine hour every 10 years decreased by 50.2 MJ/m2 and 37.6 h,respectively.Heat resource had a slight improvement,so the sowing date significantly advanced with 2 d earlier and possible growing duration significantly prolonged with 2.85 d increasing every 10 years,respectively.Suitable growing duration had no obvious variation trend but with increasing annual fluctuations.Accumulated temperature during summer maize season indicated an overall reducing trend during the past 50 years,but an increasing trend was dominated during mid and late 1980s in most areas of Henan province.Spatially,the accumulated temperature significantly decreased in west and southwest areas with a climate tendency of above 20 鈩兟穌 every 10 years.Rainfall had large annual fluctuations and showed an increasing trend but not significantly.Overall,light resource decreased,annual fluctuation of heat increased,and spatial and temporal distribution of rainfall was further uneven,which increased the occurrence possibilities of multi-disasters and climate risks of summer maize production.Measures such as variety screening,sowing time adjustment and management improving should be taken to avoid disadvantages,to protect the high and stable maize production.

[10]
Liu F Y, Xiao S R, Liu Het al., 2014. Research of impacts of climate change on agriculture in Hebei region.Geography and Geo-Information Science, 30(4): 123-126. (in Chinese)Climate change of Hebei region(Beijing,Tianjin,Heibei Province)during 1956-2007was analyzed using temperature and precipitation data of 23meteorological stations in Hebei,Beijing and Tianjin.The result showed that:1)in recent 50years,the average annual temperature was fluctuating upward trend,and the winter temperature rise had the greatest contribution to annual temperature rise;2)the annual precipitation was overall fluctuating decrease,and the summer precipitation showed obviously fluctuating decrease trend.The future climate change in this region was also estimated.On this basis,the impact of climate change on agriculture production environment in Hebei region was analyzed from the view of water table,land environment,agriculture pest.The impact of climate change on crop planting system,physiological ecology and quality of crops were analyzed.It is believed that climate change in Hebei region reduced the level of agricultural production to some extent,and resulted in increasing costs and loss of crop production.Finally,the possible impact on future agriculture production in this region was forecasted.

[11]
Liu Y J, Tao F L, 2013. Probabilistic change of wheat productivity and water use in China for global mean temperature changes of 1, 2, and 3℃.Journal of Applied Meteorology and Climatology, 52(1): 114-129.Impacts of climate change on agriculture are a major concern worldwide, but uncertainties of climate models and emission scenarios may hamper efforts to adapt to climate change. In this paper, a probabilistic approach is used to estimate the uncertainties and simulate impacts of global warming on wheat production and water use in the main wheat cultivation regions of China, with a global mean temperature (GMT) increase scale relative to 1961-90 values. From output of 20 climate scenarios of the Intergovernmental Panel on Climate Change Data Distribution Centre, median values of projected changes in monthly mean climate variables for representative stations are adapted. These are used to drive the Crop Environment Resource Synthesis (CERES)-Wheat model to simulate wheat production and water use under baseline and global warming scenarios, with and without consideration of carbon dioxide (CO2) fertilization effects. Results show that, because of temperature increase, projected wheat-growing periods for GMT changes of 1 degrees, 2 degrees, and 3 degrees C would shorten, with averaged median values of 3.94%, 6.90%, and 9.67%, respectively. There is a high probability of decreasing (increasing) changes in yield and water-use efficiency under higher temperature scenarios without (with) consideration of CO2 fertilization effects. Elevated CO2 concentration generally compensates for the negative effects of warming temperatures on production. Moreover, positive effects of elevated CO2 concentration on grain yield increase with warming temperatures. The findings could be critical for climate-change-driven agricultural production that ensures global food security.

DOI

[12]
Liu Z D, Xiao J F, Yu J Cet al., 2012. Effects of varieties and planting density on plant traits and water consumption characteristics of spring maize.Transactions of the Chinese Society of Agriculture Engineering, 28(11): 125-131. (in Chinese)Varieties and planting density are reference basis for water saving and high-yielding cultivation of spring maize in Western Liaoning. Taking the low seeding density cultivar DY12 and high density type cultivar ZD77 as experimental materials, a field experiment was conducted to evaluate the effects of four planting densities on plant traits, water consumption, ear characters, yield and water use efficiency (WUE) of spring maize, and the differences in all characters between the two types of varieties were analyzed. The results showed that with the increase of planting density, the stem diameter, the leaf area per plant of ZD77 and DY12 decreased gradually, their plant heights, the leaf area index (LAI) increased gently, and the stem diameter of DY12 and plant height of ZD77 in different planting densities reached a significant difference respectively (P0.05). Under the same planting density condition, plant height and stem diameter of DY12 were higher than that of ZD77, while LAI of the ZD77 was larger than that of DY12, thus ZD77 showed a strong resistance to the high density planting. With the planting density increasing, water consumption during the whole growth period of both varieties increased, but water consumption of ZD77 was lower than that of DY12 under the same planting density condition. With the increase of planting density, yield increased first and then decreased. The effects of planting densities on ear diameter, row numbers and 100-揼rain weight for DY12 were not obvious, and the differences in other yield characters of different planting densities reached significant levels (P0.05), while the effects of planting densities on each yield characters of ZD77 were not significant. With the increase of planting density, the WUE of DY12 increased first and then decreased, and when the planting density was 45 000 plants/hm2, its WUE reached the maximum (2.48 kg/m3). The WUE of ZD77 showed a decreasing trend with the planting density. High density type varieties of spring maize should be selected to plant with reasonable planting density in the production of this area, so the results of water-saving and yield-increasing can be achieved significantly.

DOI

[13]
Ma M G, Wang J, Wang X M, 2006. Advance in the inter-annual variability of vegetation and its relation to climate based on remote sensing.Journal of Remote Sensing, 10(3): 421-431.Climate indicators suggest a warming of the Earth.Since vegetation elicits seasonal dynamics and annual changes,the monitoring of vegetation change is an important activity to study global climatic change.The daily temporal resolution and global coverage of some satellite sensors make it possible to monitor vegetation at different spatial and temporal scales globally.The pre-processing of remote sensing(RS) data affects monitoring results directly,so a lot of international organizations perform global satellite data acquisition to receive,process,and create data sets,which strongly supports this work.Indications exist as well that an increase in global and specifically boreal vegetation activity occurs.The middle and high latitude region of the Northern Hemisphere show a widely increasing vegetation activity while arid and semi-arid regions elicit a decrease in vegetation photosynthesis in the Southern Hemisphere.It is suggested that precipitation and temperature are the primary drivers for inter-annual vegetation changes.Vegetation cover changes are also highly related to ecosystems susceptible to global climate change.

DOI

[14]
Ma S X, Churkina G, Trusilova K, 2012. Investigating the impact of climate change on crop phenological events in Europe with a phenology model.International Journal of Biometeorology, 56(4): 749-763.Predicting regional and global carbon and water dynamics requires a realistic representation of vegetation phenology. Vegetation models including cropland models exist (e.g. LPJmL, Daycent, SIBcrop, ORCHIDEE-STICS, PIXGRO) but they have various limitations in predicting cropland phenological events and their responses to climate change. Here, we investigate how leaf onset and offset days of major European croplands responded to changes in climate from 1971 to 2000 using a newly developed phenological model, which solely relies on climate data. Net ecosystem exchange (NEE) data measured with eddy covariance technique at seven sites in Europe were used to adjust model parameters for wheat, barley, and rapeseed. Observational data from the International Phenology Gardens were used to corroborate modeled phenological responses to changes in climate. Enhanced vegetation index (EVI) and a crop calendar were explored as alternative predictors of leaf onset and harvest days, respectively, over a large spatial scale. In each spatial model simulation, we assumed that all European croplands were covered by only one crop type. Given this assumption, the model estimated that the leaf onset days for wheat, barley, and rapeseed in Germany advanced by 1.6, 3.4, and 3.4 days per decade, respectively, during 1961-2000. The majority of European croplands (71.4%) had an advanced mean leaf onset day for wheat, barley, and rapeseed (7.0% significant), whereas 28.6% of European croplands had a delayed leaf onset day (0.9% significant) during 1971-2000. The trend of advanced onset days estimated by the model is similar to observations from the International Phenology Gardens in Europe. The developed phenological model can be integrated into a large-scale ecosystem model to simulate the dynamics of phenological events at different temporal and spatial scales. Crop calendars and enhanced vegetation index have substantial uncertainties in predicting phenological events of croplands. Caution should be exercised when using these data.

DOI PMID

[15]
McMaster G S, Wilhelm W W, 1997. Growing degree-days: One equation, two interpretations.Agricultural and Forest Meteorology, 87: 291-300.Heat units, expressed in growing degree-days (GDD), are frequently used to describe the timing of biological processes. The basic equation used is GDD = [(TMAX + TMIN)/2] - TBASE where TMAX and TMIN are daily maximum and minimum air temperature, respectively, and TBASE is the base temperature. Two methods of interpreting this equation for calculating GDD are: (1) if the daily mean temperature is less than the base, it is set equal to the base temperature, or (2) if TMAX or TMIN < TBASE they are reset equal to TBASE. The objective of this paper is to show the differences which can result from using these two methods to estimate GDD, and make researchers and practitioners aware of the need to report clearly which method was used in the calculations. Although percent difference between methods of calculation are dependent on TMAX and TMIN data used to compute GDD, our comparisons have produced differences up to 83% when using a 0掳C base for wheat (Triticum aestivum L.). Greater differences were found for corn (Zea mays L.) when using a base temperature of 10掳C. Differences between the methods occur if only TMIN is less than TBASE and then Method 1 accumulates fewer GDD than Method 2. When incorporating an upper threshold, as commonly done with corn, there was a greater difference between the two methods. Not recognizing the discrepancy between methods can result in confusion and add error in quantifying relationships between heat unit accumulation and timing of events in crop development and growth, particularly in crop simulation models. This paper demonstrates the need for authors to clearly communicate the method of calculating GDD so others can correctly interpret and apply reported results.

DOI

[16]
Meng L, Liu X J, Wu D Ret al., 2015. Responses of summer maize phenology to climate changes in the North China Plain.Chinese Journal of Agrometeorology, 36(4): 375-382. (in Chinese)Knowledge about response of crop phenology to current climate change is of much importance to predict its response to future climate change scenario,since it helps reduce the prediction uncertainty.In this paper,based on phonological observation data of summer maize from agricultural meteorological station records and daily meteorological data during 1981-2009 in the North China Plain (NCP),responses of summer maize phenology to climate change were analyzed using linear regression method and significance analysis.Results showed that:(1) over the past 30 years,minimum and average temperature increased significantly(P<0.05)during summer maize growing season in NCP with a trend of decline negatively correlated with latitude.Sunshine hours declined substantially (P<0.01)and precipitation change was not significant;(2)The dates of main growth period of summer maize in the Beijing-Tianjin-Hebei region and Shandong province delayed significantly(P<0.05),while in the Henan province they advanced significantly(P<0.05);(3)The whole growth days in NCP increased with a rate of 2.72d·10y-1(P<0.01),and those in the Beijing-Tianjin-Hebei region had the highest rate of 3.36d·10y-1;(4)The whole growth days were mainly negatively correlated with average temperature during the same period. Regression coefficient varied in -7.16~3.17.The reproductive days were also negatively correlated with average temperature.Regression coefficient varied in -3.56~1.87.The results indicated that while temperature increased by 1oC,the daysof whole growth period and reproductively stage of summer maize would shorten by 2.71d and 1.07d, respectively.Summer maize in different regions of NCP had different ways of responding to climate change.Suitable seeding time and variety types should be selected according to local response features.

DOI

[17]
Oteros J, Garcia-Mozo H, Botey Ret al., 2015. Variations in cereal crop phenology in Spain over last twenty-six years (1986-2012).Climatic Change, 130: 545-558.Over recent years, the Iberian Peninsula has witnessed an increase both in temperature and in rainfall intensity, especially in the Mediterranean climate area. Plant phenology is modulated by climate, and closely governed by water availability and air temperature. Over the period 1986–2012, the effects of climate change on phenology were analyzed in five crops at 26 sites growing in Spain (southern Europe): oats, wheat, rye, barley and maize. The phenophases studied were: sowing date, emergence, flag leaf sheath swollen, flowering, seed ripening and harvest. Trends in phenological response over time were detected using linear regression. Trends in air temperature and rainfall over the period prior to each phenophase were also charted. Correlations between phenological features, biogeographical area and weather trends were examined using a Generalized Lineal Mixed Model approach. A generalized advance in most winter-cereal phenophases was observed, mainly during the spring. Trend patterns differed between species and phenophases. The most noticeable advance in spring phenology was recorded for wheat and oats, the “ Flag leaf sheath swollen” and “Flowering date” phenophases being brought forward by around 302days/year and 102day/year, respectively. Temperature changes during the period prior to phenophase onset were identified as the cause of these phenological trends. Climate changes are clearly prompting variations in cereal crop phenology; their consequences could be even more marked if climate change persists into the next century. Changes in phenology could in turn impact crop yield; fortunately, human intervention in crop systems is likely to minimize the negative impact.

DOI

[18]
Puangbut D, Jogloy S, Vorasoot Net al., 2015. Responses of growth, physiological traits and tuber yield in Helianthus tuberosus to seasonal variations under tropical area.Scientia Horticulturae, 195: 108-115.Seasonal variations affect growth and yield of a crop, primarily by changing its phenological developmental processes. The objective of the present study was to evaluate seasonal variation effects on growth and development of Jerusalem artichoke. The experiment was conducted during the early-rainy seasons in June-揝eptember 2011 and the post-rainy seasons in September-揇ecember in 2011, and two seasons were repeated in 2012 at the Field Crop Research Station of Khon Kaen University. A randomize complete block design (RCBD) with 5 replications was used. Four Jerusalem genotypes including JA 89, HEL 65, CN 52867 and KT 50-4 were used. Results indicated similar phenological development between the early and post rainy-seasons. However, high temperature combined with long photoperiod during the early-rainy seasons delayed tuber initiation and extended maturity. Low temperature and short photoperiod was a favorable condition for tuber development but reduced vegetative and reproductive development. On average, tuber dry weights and tuber growth rate were higher in the post-rainy season compared to the early-rainy season. On the other hand, biomass and crop growth rates were higher in the early-rainy seasons compared to the post-rainy seasons. The knowledge obtained in this study is important for Jerusalem artichoke production and selection of Jerusalem artichoke genotypes in the tropical climate.

DOI

[19]
Ren L L, Yin S Y, 2013. Temperature changes and its impacts on agriculture in the upper reaches of Hanjiang River in southern Shaanxi.Chinese Journal of Agrometeorology, 34(3): 272-277. (in Chinese)The variation and mutation of temperature at inter annual and seasonal scales and their impacts on agriculture were analyzed,by using of linear trend analysis,moving average methods and Mann-Kendall,based on daily and monthly average temperature data of 3 stations in the upper reaches of Hanjiang river in Southern Shaanxi from 1960 to 2010.The results showed that the annual average temperature and annual average minimum temperature increased generally at the rate of 0.107℃/10y(P<0.01)and 0.16℃/10y(P<0.01)respectively,but annual average maximum temperature did not increased obviously.The mutation point for annual average temperature,annual average minimum temperature,and annual average maximum temperature were detected in 2001,2000 and 2001 respectively.The seasonal change showed that greater in winter(P<0.01),and it had large contribution to climate warming.Temperature decreased a little in summer,but increased extreme significantly in spring and significantly in autumn.Late spring coldness delayed,with high intensity and high frequency.The frequency of autumn chilling decreased with longer duration greater intensity.Therefore,late spring coldness and autumn disasters caused a serious damage on crop production,including rice,maize and wheat.It was help for adapting to climate change and ensuring food security to understand climate change and its mechanism in upper Hanjiang river.

DOI

[20]
Schleip C, Rais A, Menzel A, 2009. Bayesian analysis of temperature sensitivity of plant phenology in Germany.Agricultural and Forest Meteorology, 149(10): 1699-1708.For all phenophases a strong dependence of phenology on temperature is determined. We can classify two main temperature response patterns of the studied phenological phases: on the one hand spring phenophases are particularly sensitive to temperatures in April, exhibiting a prompt response. On the other hand summer phenophases are less influenced by temperature during or right before the month of the onset. They reveal a delayed response to nonlinear temperature changes mainly of April. Especially abrupt changes during the temperature sensitive stage of species cause a pronounced change in plant phenology regardless of the time of onset.

DOI

[21]
Song L B, Yao N, Feng Het al., 2016. Effects of water stresses at different growth stages on development and yields of summer maize in arid region.Journal of Maize Sciences, 24(1): 63-73. (in Chinese)Objective】 To investigate the influences of water stress at different growth stages on the growth and yields of winter wheat, field experiments were conducted under a rainout shelter during two seasons of 2012-2013 and 2013-2014. The dynamic changes of several eco-physical characteristics of wheat growth were measured and compared, including height, leaf area index, phenology, biomass, and yield. 【Method】 The whole growth season of wheat was divided into five growing stages (wintering, greening, jointing, heading, and grain filling). Water stress occurred at two continuous stages, while irrigations were applied at other stages, which resulted in four different levels of stress period (D1-D4). Two irrigation levels of 40 mm (I1) and 80 mm (I2) were applied. A total of eight treatments, with three replicates for each, followed a split-plot experiment design. An extra control treatment with irrigation at all five stages was arranged beside.【Result】The results showed that normal growth and development of wheat could be obviously influenced by continuous water stress given at vegetative stages. The height, LAI and biomass were the worst for all treatments, when water stress occurred at the stages of wintering and greening. However, the negative influences on wheat growth were not notable when water stress occurred after jointing stage. The average growth rate of height and LAI after jointing was about ten times as that before jointing. There were no notable differences of biomass between all of the treatments until the jointing stage. The biomass values of treatments with water stresses at wintering and greening stages were remarkably lower than other treatments. The irrigation later could not recover these serious biomass losses. Water stress could shorten the whole growth season of wheat, with a maximal 5-day advancing of maturation. At the same irrigation level, the heading and flowering stages could be delayed for 1-3 days for different levels of stress period. For the same irrigation level, relatively higher numbers of productive ears and seeds per ear could be obtained when water stress occurred at the heading and grain filling stages, but with a lower thousand-kernel weight. On the contrary, a relatively higher thousand-kernel weight could be achieved when irrigation was applied at the heading and grain filling stages, but with lower numbers of productive ears and seeds per ear. For irrigation levels of I1 and I2, yields were the lowest when water stress occurred at wintering and greening stages, which was only 42% of the control treatment. However, the treatments with the highest yield were different for different irrigation levels. For I1, it was the treatment with water stress at jointing and heading stages that had the highest yield, or about 63% of the control treatment. For I2, it was the treatment with water stress at greening and jointing stages, which had a yield of about 75% of the control treatment. 【Conclusion】There was a clear interaction between the intensity and occurring stage of water stress. In general, the greening and filling stages were the critical periods of water demand for winter wheat. Reasonable irrigation managements are needed at these two growth stages to guarantee a higher yield of winter wheat in arid region.

[22]
Sun Q, Huang Y, Ji X Jet al., 2014. Characteristic of winter wheat cultivar shift in Henan province under climate change.Progressus Inquisitiones de Mutatione Climatis, 10(4): 282-288. (in Chinese)Based on the data observed at 30 agro-meteorological stations in Henan Province that include the phenological development and grain yield components of winter wheat and meteorological elements over the period of 1981-2010, the changes in the length of growing season, the requirement of accumulated temperature, and the yield components of winter wheat were investigated. A total of 196 cultivars of winter wheat were planted during this period. Correlation analysis and regression were used to perform the investigation. The results show that mean temperature in wheat growing season increased significantly. The increase in vegetative period was more pronounced than in reproductive period. In contrast, precipitation did not show significant trends over the 30 years. Cultivar shift and climate warming shortened the length from emergence (E) to heading (H) significantly with the rate of 2.8-5.9 d/10a, but the days from heading to maturity (M) increased significantly with the rates of 1.3-2.5 d/10a. Nevertheless, the accumulated temperature (>0鈩 to complete the developmental phases increased, particularly in the H-M phase. The increase rates were 26-50 鈩d per decade. The weight of 1000 kernels increased markedly with the extended H-M phase. However, the spikes and kernels per spike were correlated neither with the length nor with the accumulated temperature (>0鈩 in the phase of E-M. A further investigation indicated that both the ratios of H-M to E-M in days and in accumulated temperature in southern Henan, and the ratio of H-M to E-M in days in central and northern Henan increased with time. The variability of grain yield in southern Henan was better explained by the ratio in accumulated temperature than in days. In central and northern Henan, the grain yield was positively correlated with the ratio of H-M to E-M in days. The cultivar shift of winter wheat over 1981-2010 in Henan Province was characterized by shortening vegetative period, extending reproductive period and improving the weight of 1000 kernels under climate warming.

[23]
Tao F L, Zhang Z, Xiao D Pet al., 2014. Responses of wheat growth and yield to climate change in different climate zones of China, 1981-2009.Agricultural and Forest Meteorology, 189/190: 91-104.The experiment observations at 120 agricultural meteorological stations spanning from 1981 to 2009 across China were used to accelerate understandings of the response of wheat growth and productivity to climate change in different climate zones, with panel regression models. We found climate during wheat growth period had changed significantly during 1981–2009, and the change had caused measurable impacts on wheat growth and yield in most of the zones. Wheat anthesis date and maturity date advanced significantly, and the lengths of growth period before anthesis and whole growth period were significantly shortened, however the length of reproductive growth period was significantly prolonged despite of the negative impacts of temperature increase. The increasing adoption of cultivars with longer reproductive growth period offset the negative impacts of climate change and increased yield. Changes in temperature, precipitation and solar radiation in the past three decades jointly increased wheat yield in northern China by 0.9–12.9%, however reduced wheat yield in southern China by 1.2–10.2%, with a large spatial difference. Our studies better represented crop system dynamics using detailed phenological records, consequently better accounted for adaptations such as shifts in sowing date and crop cultivars photo-thermal traits when quantifying climate impacts on wheat yield. Our findings suggest the response of wheat growth and yield to climate change is underway in China. The changes in crop system dynamics and cultivars traits have to be sufficiently taken into account to improve the prediction of climate impacts and to plan adaptations for future.

DOI

[24]
Wang B, Liu D L, Asseng Set al., 2015. Impact of climate change on wheat flowering time in eastern Australia.Agricultural and Forest Meteorology, 209/210: 11-21.The flowering time of wheat is strongly controlled by temperature and is potentially highly sensitive to climate change. In this study, we analysed the occurrence of last frost (days with minimum temperature under 202°C) and first heat (days with maximum temperatures exceeding 3002°C) events of the year to determine the optimum flowering date in the wheat belt of New South Wales (NSW), eastern Australia. We used statistically downscaled daily maximum and minimum temperature data from 19 Global Climate Models (GCMs) with a vernalizing–photothermal model in order to simulate future flowering dates and the changes in frost and hot days occurrence at flowering date (± 7 days) for two future scenarios for atmospheric greenhouse gas concentrations (RCP4.5 and RCP8.5) in 2040s (2021–2060) and 2080s (2061–2100). Relative to the 1961–2000 period, the GCMs projected increased daily maximum and minimum temperatures for these future periods, accompanied by reduced frost occurrence and increased heat stress incidence. As a consequence, by the 2080s, simulations suggest a general advance in spring wheat flowering date by, on average, 10.2 days for RCP4.5 and 17.8 days for RCP8.5 across the NSW wheat belt. Winter wheat flowering dates were delayed by an average of 2.4 days for RCP4.5 and 14.3 days for RCP8.5 in the warmest parts of the region (the northwest) due to reduced cumulative vernalization days (requiring cool conditions). In the cooler regions (the northeast, southeast and southwest), flowering date occurred earlier by 6.2 days for RCP4.5 and 6.7 days for RCP8.5 on average. Moreover, in the western parts of the wheat belt the delay of winter wheat flowering date was about 9.5 days longer than that in the eastern parts. As a result of phenological responses to increasing temperatures, current wheat varieties may not be suitable for future climate conditions, despite reduced frost risk. In the future, it may be necessary to use longer-season wheat varieties and varieties with increased heat-stress resistance.

DOI

[25]
Wang C Y, He J F, Wu J H, 2010. Study of climate factor effect on summer maize growth and development countermeasures in the southern Henan province.Journal of Shaanxi Agricultural Science, (4): 57-59. (in Chinese)

[26]
Wang Y P, Yin X X, Hou Qet al., 2016. Influence of climate on corn and soybean in Eastern Da Hinggan Mountains over the last 30 years.Research of Soil and Water Conservation, 23(4): 326-337. (in Chinese)

[27]
Wang Z B, Wang M, Yin X G, et al., 2015. Spatiotemporal characteristics of heat and rainfall changes in summer maize season under climate change in the North China Plain.Chinese Journal of Eco-Agriculture, 23(4): 473-481. (in Chinese)Significant climate change has occurred across the North China Plain in the past few decades, corresponding to global climate change. Climate change during the growth period of summer maize has caused far-reaching impacts on production in the region, which is one of the most vital summer maize production regions in China. Based on observation data from 49 meteorological stations and 27 agro-meteorological stations, this paper analyzed growth degree days (GDD), heat degree days (HDD) and rainfall, and their climatic trend rates for the vegetative growth phase, vegetative and reproductive growth phase, productive growth phase and whole growth period of summer maize in the North China Plain for the period 1961?2010. The results showed that both GDD and HDD increased from northeast to southwest of the North China Plain. However, rainfall decreased from southeast to northwest of the plain. The climatic trend rates of GDD, HDD and rainfall from 1961 to 2010 in the North China Plain were 8.14 ℃·d·10a-1, 2.45 ℃·d·10a-1 and 10.75 mm·10a-1, respectively. Furthermore, GDD decreased during the vegetative growth phase, increased during vegetative and reproductive growth phase, reproductive growth phase and whole growth period of summer maize in northern region of the North China Plain for the period 1961-2010. However, the reverse trends were noted for the southern of the plain. HDD increased in the north but decreased in the southern of the North China Plain. Rainfall decreased in the north but increased in the south for all the growth stages. Consequently, high temperature and drought posed significant risks to summer maize production in the north Hebei Province, Beijing City and Tianjin City in the north of the North China Plain. However, the risks of temperature and drought decreased for most of Henan Province and southern Shandong Province in the south of the North China Plain for the period 1961-2010.

[28]
Wu R J, Zheng Y F, Zhao G Qet al., 2009. Spring phenophase changes of dominant plants in Zhengzhou and their responses to air temperature change.Chinese Journal of Ecology, 28(6): 1049-1054. (in Chinese)Based on the 1983〖KG-*2〗-〖KG-*7〗2004 observation data of phenophas e and air temperature in Zhengzhou, the spring phenophase changes of four tree s pecies and two herb species in the City as well as their relationships with air temperature change were studied. Since 1983, there had been an advancing tendenc y of the spring phenophase of the dominant plants in Zhengzhou, with the charact eristics of synchronization and sequentiality. There was a significant correlati on between the first flowering dates of dominant plants and the mean air temperature from March to April, and for Populus tomentosa and Salix babylonica , their first flowering dates also had significant correlations with the mean air temperature in winter. The first flowering dates of the dominant plants advanced with increasing mean air temperature from March to April. With an increase of 1 ℃, the first flowering dates of Robinia pseudoacacia, S. babylonica, Tar axacum mongolicum, and Plantago asiatica advanced 417, 369, 816, and 130 days, respectively. The 4 ten-days before first flowering of the dominant plants were the most sensitive period of time to air temperature change.

[29]
Xiao D P, Qi Y Q, Wang R Det al., 2015. Changes in phenology and climate conditions of wheat and maize in Xinjiang during 1981-2009.Agricultural Research in the Arid Areas, 33(6): 190-202. (in Chinese)

[30]
Xue C Y, Liu R H, Wu Q, 2010. Effect of climate warming on rice growing stages in Xinyang.Chinese Journal of Agrometeorology, 31(3): 353-357. (in Chinese)Based on meteorological data from 1961 to 2008 of Xinyang meteorological station and rice phonological data from 1981 to 2007 of Xinyang agro-meteorological experimental station,the effects of climate warming on rice growth stage in Xinyang area was analyzed.The results showed that annual average temperature increased in last 48 years,especially after 1981.Temperature increased significantly in April to May during rice growing season,resulted in rice sowing and transplanting date advancing,which was benefit to early emergence and strong seedlings.However,the temperature did not change lot during the mid-and-late growing season,resulted in the duration from transplanting to heading extending,which was benefit to prolong the period of panicle initiation and formation for large panicle and yield improvement.

DOI

[31]
Yang F, Yao Z F, Song Jet al., 2012. Temporal and spatial changes characteristics of the agricultural meteorological factors and crops growth stages in Songnen Plain.Chinese Journal of Agrometeorology, 33(1): 18-26. (in Chinese)Based on the climatic data from 1951 to 2008 and the crops growth stages record data from 1992 to 2010 in Songnen plain and its surrounding areas,the temporal and spatial variation characteristics of the key climatic factors and main crops growth stages were studiedThe results showed that the climate changes in Songnen plain for nearly 60 years was very obvious,the temperature increased on average about 1.79 ℃,the accumulated temperature &ge; 10℃ increased on average about 228 ℃〖DK〗&middot;d and the lines of 2700,2800 and 2900 ℃〖DK〗&middot;d moved to north about 100~240 km,the precipitation and relative humidity both decreased and these two factors in western Songnen plain varied significantly than that in the eastern area,the sunshine hours increased in the north area and decreased in the south〖JP+1〗Overall,the climate changes made different influences on these major dryland crops,then the soybeans growth stages delayed obviously,and the second was spring corn,the spring wheats growth stages delayed the least in the southern and western Songnen plain.

DOI

[32]
Yang J Y, Mei X R, Liu Qet al., 2011. Variations of winter wheat growth stages under climate changes in northern China.Chinese Journal of Plant Ecology, 35(6): 623-631. (in Chinese)Aims Climate change is generally accepted to be a critical problem. It affects crop growth stages through changes in sunlight, heat and moisture. Our objective is to investigate the development of winter wheat growth stages under climate changes in northern China to determine possible causes of changes.</br>Methods Based on data of winter wheat growth stages and meteorology, we used multiple stepwise regression + residual interpolation to determine changes in winter wheat growth stages in northern China since 2000. Changes were investigated for two periods: 1971&ndash;1980 and after 2000.</br>Important findings The north part of northern China, including Beijing, Tianjin, Hebei and Shanxi Provinces, showed a significant warming and drying trend. In Henan and Shandong Provinces, temperature and precipitation had increased and sunlight had decreased. Jiangsu and Anhui Provinces also showed a trend of decreased sunlight and increased annual average temperature and accumulated temperature over 10 &deg;C; however, the changes were small. Variations in climate cause changes in the growth stages of winter wheat. Compared to the 1970s, the sowing period had been delayed about 7&ndash;10 days after 2000 in most parts of northern China except Jiangsu and Anhui Provinces. The greening stage had advanced in the southeast, but was delayed in the northwest part of northern China. The jointing stage had advanced in northern China, especially in Beijing, Tianjin, Hebei, Shanxi and Shandong Provinces. It postponed the heading stage about 2&ndash;15 days. The harvesting stage had been postponed in most parts of northern China by 5&ndash;10 days. Variations in climate factors, mainly sunlight, temperature and precipitation, are the main influences on winter wheat growth stages. Greening and jointing stages showed significant correlations to annual average sunlight hours. An increase of annual average temperature more strongly affected the heading stage. An increase of accumulated temperature over 10 &deg;C can postpone maturity of the stage. Precipitation can promote the stages of jointing and heading.

DOI

[33]
Zhang X R, Wang C J, Lei W, 2016. Influence of climate change on the agricultural production research of Baoji.Shaanxi Journal of Agricultural Sciences, 62(1): 87-91. (in Chinese)

[34]
Zhao D, Luo Y, Gao Get al., 2010. Long-term changes and essential climatic characteristics of sunshine duration over China during 1961-2007.Resources Science, 32(4): 701-711. (in Chinese)

[35]
Zhu K Z, Wan M W, 1973. Phenology. Beijing: Science Press, 1-131. (in Chinese)

Outlines

/