Research Articles

Development of quantitative methods for detecting climate contributions to boundary shifts in farming-pastoral ecotone of northern China

  • SHI Wenjiao , 1, 2, 3 ,
  • LIU Yiting 1, 3 ,
  • SHI Xiaoli , 4, *
Expand

*Corresponding author: Shi Xiaoli, PhD and Associate Professor, E-mail:

Author: Shi Wenjiao, PhD and Associate Professor, specialized in global change and agriculture. E-mail:

Received date: 2017-03-12

  Accepted date: 2017-04-15

  Online published: 2017-09-05

Supported by

National Natural Science Foundation of China, No.41401113, No.41371002

Foundation of Excellent Young Talents of IGSNRR, CAS, No.2016RC201

The Open Fund of State Key Laboratory of Remote Sensing Science, No.OFSLRSS201622

The Key Project of Physical Geography of Hebei Province

China Scholarship Council

Copyright

Journal of Geographical Sciences, All Rights Reserved

Abstract

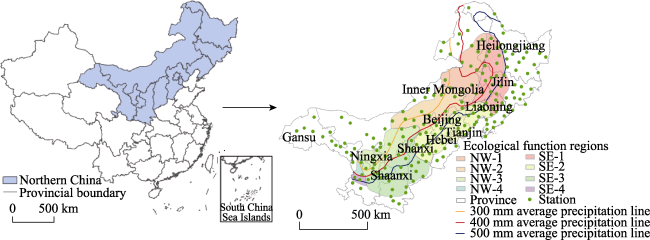
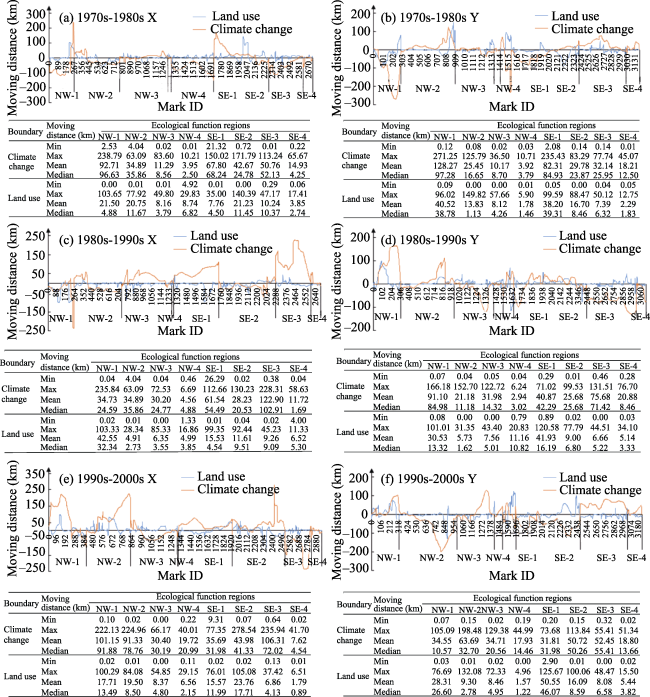
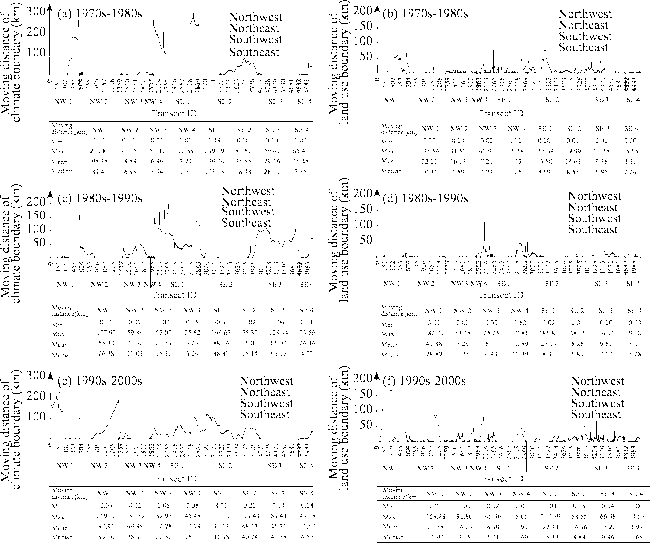
The quantitative effect of climate change on fragile regions has been a hot topic in the field of responses to climate change. Previous studies have qualitatively documented the impacts of climate change on boundary shifts in the farming-pastoral ecotone (FPE); however, the quantitative methods for detecting climate contributions remain relatively limited. Based on long-term data of meteorological stations and interpretations of land use since 1970, climate and land use boundaries of the 1970s, 1980s, 1990s and 2000s were delineated. To detect climate contributions to the FPE boundary shifts, we developed two quantitative methods to explore the spatial-temporal pattern of climate and land use boundary at the east-west (or south-north) (FishNet method) and transect directions (Digital Shoreline Analysis System, DSAS method). The results indicated that significant differences were exhibited in climate boundaries, land use boundaries, as well as climate contributions in different regions during different periods. The northwest FPE had smaller variations, while the northeast FPE had greater shifts. In the northwest part of the southeast fringe of the Greater Hinggan Mountains and the Inner Mongolian Plateau, the shifts of climate boundaries were significantly related to the land use boundaries. The climate contributions at an east-west direction ranged from 10.7% to 44.4%, and those at a south-north direction varied from 4.7% to 55.9%. The majority of the results from the DSAS were consistent with those from the FishNet. The DSAS method is more accurate and suitable for precise detection at a small scale, whereas the FishNet method is simple to conduct statistical analysis rapidly and directly at a large scale. Our research will be helpful to adapt to climate change, to develop the productive potential, as well as to protect the environment of the FPE in northern China.

Cite this article

SHI Wenjiao , LIU Yiting , SHI Xiaoli . Development of quantitative methods for detecting climate contributions to boundary shifts in farming-pastoral ecotone of northern China[J]. Journal of Geographical Sciences, 2017 , 27(9) : 1059 -1071 . DOI: 10.1007/s11442-017-1421-5

1 Introduction

The farming-pastoral ecotone (FPE), which is a transitional region between agricultural cultivation and pasture (Zhao and Li, 2009), is particularly susceptible to climate change and anthropogenic disturbances (Liu and Gao, 2008a). In this region, cropland and grassland are changed frequently over different spatial and temporal scales (Zhao et al., 2002). In China, the FPE are mainly located in the South, Southwest and Northwest regions. As the most extensive spatial extent with fragile environment, the FPE in northern China has attracted the scholars who are interested in climate change and land use change, focusing on boundary fluctuation of the FPE.
From the delineation of the FPE boundary, various qualitative studies indicated that the climate and land use boundaries shifted at opposite directions (Liu and Gao, 2008b; Li and Pan, 2012). Some researchers also found that climate, policy and reclamation together dominated the processes of land use and land cover change, causing the fluctuations of boundaries (Ye and Fang, 2012), especially in Northeast China. A growing number of researchers have quantitatively investigated the influences of climate change and human activities on land use patterns (Shi and Shi, 2015). Models, like the Conversion of Land Use and its Effects Model (CLUE) (Gao and Yi, 2012) and Environment for Geoprocessing Objects Model (Dinamica EGO) (Deng and Zhan, 2004), are often combined with economic models to identify the contributions of natural and anthropogenic impacts on land use change and to project the future pattern in the FPE in northern China (Yang et al., 2014). However, some problems including parameter acquisition, sophisticated operation, and inconsistent validation restricted the application of model analysis. Mathematical statistics such as logistic regression (Gao and Yi, 2012) and pearson correlation (Su et al., 2015) can focus on the impacts of a specific climatic factor on land use change in the FPE in northern China. Previous studies focused on the impact analysis at point (Liu and Gao, 2008b; Gao and Liu, 2006) or polygon scales (Ye and Fang, 2013; Shi et al., 2014). However, the methods for detecting quantitative contributions of climate change on boundary shift of the FPE in northern China are still unclear, particularly on line analysis of the boundary (Liu and Gao, 2008a; Liu and Gao, 2008b). Moreover, most of the previous analysis considered the study area as a whole region, which ignored the spatial heterogeneity in the contributions of climate change to the boundary shifts.
Based on the delineation of climate and land use boundaries of the FPE in northern China, we presented two methods to quantitatively measure the contributions of climate change to the boundary fluctuation at 1 km resolution across different periods and eco-regions, which can detect the impacts of climate change on the boundary fluctuation at the east-west and south-north directions as well as transect directions, respectively. In addition, we also conducted comparisons between the two methods, as well as the analysis of their advantages and limitations.

2 Data and methods

2.1 Study area

The FPE in northern China, including the southeast fringe of the Greater Hinggan Mountains, the southern fringe of the Inner Mongolian Plateau, and the northern Loess Plateau, as well as a part of the Hexi Corridor, lies between 102°40′E-126°14′E and 34°16′N-48°57′N. It covers an area of about 61.4×10⁴ km2, and is located in ten provincial regions including Inner Mongolia, Ningxia, Heilongjiang, Jilin, Liaoning, Hebei, Beijing, Shanxi, Shaanxi and Gansu. In the study area, the annual mean temperature ranges from 0 to 10℃, and the mean annual precipitation is between 300 mm and 500 mm. The elevations in most of the study area are over 1000 m. The cropland, grassland and forest are demonstrated staggered distribution. The major land use type is grassland in the northwest FPE, while cropland is predominant in the southeast FPE. The vegetation is typical dry steppe, varying from forest-steppe to steppe and desert steppe. Moreover, due to the rapid increase of economy and population in the southeast FPE during the past 40 years, extensive lands were reclaimed. Consequently, the boundaries were significantly disturbed by human activities in this region. Because different natural and human factors dominated in different regions of the FPE in northern China, four eco-regions are divided to obtain specific results of the climate contributions to the FPE boundary shifts. Based on the division of Huang et al. (2010), we buffered the eco-regions as far as totally covering the whole FPE. The four eco-regions in the study area were created, including the restricted cultivation and water conservation region in the southeast fringe of the Greater Hinggan Mountains (region 1), the agricultural-forestry-pastoral production region in the southeast fringe of the Inner Mongolian Plateau (region 2), the farming-pastoral and soil-water conservation region in northern Loess Plateau (region 3), and the arid desert-oasis cultivation region in the Hexi Corridor (region 4) (Figure 1 and Table 1). Then, the 400 mm isotype was further used to divide the four eco-regions into the northwest (NW) and southeast (SE) parts (Figure 1 and Table 1).
Table 1 Ecological function regions in the FPE of northern China
Regions Ecological function regions Primary ecological functions
Northwest part of region 1 (NW-1) The restricted cultivation and water conservation region in the southeast fringe of the Greater Hinggan Mountains Agricultural-pastoral production, forestry-fruit production, and
ecological tourism
Southeast part of region 1 (SE-1)
Northwest part of region 2 (NW-2) The agricultural-forestry-pastoral and ecological production region in the southeast fringe of the Inner Mongolian Plateau Agricultural-pastoral production, and desertification mitigation
Southeast part of region 2 (SE-2)
Northwest part of region 3 (NW-3) The farming-pastoral and soil-water conservation region in northern Loess Plateau Soil-water conservation, and
agricultural-forestry production
Southeast part of region 3 (SE-3)
Northwest part of region 4 (NW-4) The arid desert-oasis cultivation region in the Hexi Corridor Desertification mitigation, and agricultural production
Southeast part of region 4 (SE-4)

2.2 Data

2.2.1 Climate data
The daily temperature and precipitation data (1970-2010) were from 197 national meteorological stations. ANUSPLIN was employed to obtain raster datasets of climate variables at a 1 km resolution. The daily temperature dataset was represented by the homogenized daily temperature series for China with the Multiple Analysis of Series for Homogenization (MASH), which can remove systematic bias from time and instruments of observation (Li and Yan, 2009).
Figure 1 The distributions of ecological function regions and isohyets in the FPE of northern China
2.2.2 Land use data
We obtained the time-series dataset of 1 km2 area percentage land use data (1970s, 1980s, 1990s and 2000s) from the National Land Cover Dataset (NLCD) (Liu et al., 2003; Liu et al., 2005a; Liu et al., 2010) to investigate the dramatic changes during the past 40 years, which were based on the interpretation of Landsat TM/ETM/MSS, CBERS-1 and CBERS-2. The land use category included cropland, grassland, forest, water body, built-up land and unused land in the NLCD (Liu et al., 2005b; Zhang et al., 2012).

2.3 Method

2.3.1 Delineation of boundaries based on climate and land use data
Recent works have presented various indices to define the spatial extent of the FPE in northern China. There are two types of indices usually used to delineate the FPE boundary, including climate index and land use index.
For the definition of climate boundary, Zhu et al. (1984) considered that the mean annual precipitation in the FPE varies between 300 and 500 mm. Based on the location of the south fringe of the Inner Mongolian Plateau and the Great Wall, Zhao et al. (2002) selected the mean annual precipitation between 300 and 450 mm, the precipitation variability between 15% and 30%, and the aridity index between 1 and 2 to delineate the spatial extent of the FPE. Similarly, Liu and Gao (2008b) modified the scope from Zhao et al. (2002) with the precipitation variability (between 15% and 30%) and acidity index (between 0.2 and 0.5). Furthermore, they set the 400 mm isotype as the central line, and used the 300 mm and 450 mm isotypes to modify the northwest and southeast boundaries, respectively. Based on the previous research, we defined the climate boundary as follows: (i) the precipitation variability varies from 15% to 30% (Liu and Gao, 2008b); (ii) the acidity index varies from 0.2 to 0.5 (Liu and Gao, 2008b); (iii) the 400 mm, 300 mm and 500 mm isotypes are set as the central line, northwest boundary and southeast boundary, respectively. The isotypes with an interval of 50 mm from 300 mm to 500 mm were used to connect the northwest and southeast boundaries to complete closed boundaries. For a given part of the boundary during different periods, the same isotypes were used to make fair comparison.
For the definition of land use, Ye and Fang (2012) considered that the area-percentage of cropland should be higher than 15% in the FPE. Wang and Shi (1988) chose the area- percentage of cropland (between 15% and 35%) and grassland (between 35% and 75%) to define the FPE of Inner Mongolia. Actually, the cropland proportion for the whole FPE should be higher than those in Inner Mongolia. Wu and Guo (1994) presented that the proportion for cropland, grassland and forest should be 1:0.5:1.5 in the FPE. Therefore, we defined land use boundary as follows: (i) both the area-percentages of cropland and grassland should be greater than 15% in each 1 km×1 km grid; and (ii) the spatial extent should be contiguous distribution and also be contained in the four eco-regions.
2.3.2 Detection of the boundary shifts at the east-west and south-north directions
This method could distinguish the boundary shift at the east-west and south-north directions with the FishNet operation in ArcGIS. The 1 km×1 km fishnet was created to entirely cover the largest scope of the FPE over the four periods, the shift distances and directions for both of the climate and land use boundaries on each fishnet line were computed at two directions in each period. When a fishnet line crossed the boundaries during former period and latter period from east to west (or from south to north), the direction was coded as 1. The direction was set as -1 if it crossed boundaries from the opposite directions. The direction was coded as 0 for the boundaries of the same period crossed by a fishnet line. The distance signed with direction could be computed by the equation (1),
Dfp-lp=Lfp-lp×Direction (1)
where fp is the former period, lp is the latter one; Lfp-lp represents the length of fishnet line; Direction represents the shift direction of boundaries; Dfp-lp represents the distance with direction sign. The Lfp-lp was used to compute the maximum, minimum, median, as well as the mean of the shift distance for climate and land use boundaries, and the Dfp-lp was used to examine the shift ranges and correlations between climate and land use boundaries.
2.3.3 Detection of the boundary shifts at the transect direction
A baseline was created according to the buffer of the innermost boundary, and then transects were casted perpendicularly to the baseline with an internal of 1 km and intersected the boundaries during different periods using the Digital Shoreline Analysis System (DSAS method) (Wang et al., 2014; Jayson et al., 2013). The distance (Dp) from the baseline to the intersect point of each boundary was computed. The shift distance and direction of climate and land use boundaries could be computed according to the equation (2),
Dfp-lp=Dlp-Dfp (2)
where Dfp represents the distance between the boundary in the former period and the baseline, Dlp represents the distance between the latter boundary and the baseline, Dfp-lp represents the distance between the former and latter boundaries marked with direction. The absolute values of Dfp-lp can be used to compute the maximum, minimum, median, as well as the mean of the shift distance for climate and land use boundaries. The Dfp-lp was subsequently used to examine the shift ranges and correlations between climate and land use boundaries.
2.3.4 Calculation of the climate contributions to boundary shifts
The shift distances (Dfp-lp) of the climate and land use boundaries at the east-west, south-north and transect directions in each eco-region were calculated using both methods of the FishNet and DSAS. The correlation, coefficient (r2) and significance (p) were calculated according to the shift distances of the climate and land use boundaries. To explore how much of land use boundary shifts can be explained by climate change, we selected the datasets with significantly positive correlations (p<0.05, r>0) between climate and land use boundaries shifts, and selected the coefficient (r2) to demonstrate the contributions of climate change to the FPE boundary shifts.

3 Results and discussion

We used the FishNet and DSAS methods to detect the spatial-temporal pattern changes of the FPE boundaries based on the data of climate and land use. Quantitative detection of the climate contributions to the FPE boundary shifts was then conducted using these two methods.

3.1 Spatial-temporal pattern changes of the FPE boundaries detected by the FishNet method

3.1.1 Climate boundary
The greatest change of climate boundary shifted eastward in SE-2 region from the 1990s to the 2000s with 278.54 km at the east-west direction (Figures 2a, 2c and 2e). Extensive shifts existed in region 1, NW-2 and SE-3 regions. For example, during the 1990s-2000s, the FPE boundaries in NW-1 and NW-2 regions significantly moved eastward with the median shift distances of 91.88 km and 78.76 km, while it moved westward with 72.02 km in the SE-3 region. In contrast, the FPE boundaries in region 4 varied more slightly with the median distances less than 10 km.
The largest change of climate boundary shifted southward with 271.25 km at the south-north direction in NW-1 region from the 1970s to the 1980s (Figures 2b, 2d and 2f). The climate boundaries in the southeast (SE) part experienced greater shifts than those in the northwest (NW) part. More extensive changes of the FPE boundaries can be detected in region 1, SE-2 and SE-3 regions, while the boundaries in NW-4 region continuously moved northward with slight changes. As an increase of precipitation in Northeast China during the 1980s, the FPE boundaries in region 1, NW-3 and SE-2 regions shifted southward during the 1970s-1980s. The median shift distances of the NW and the SE parts in region 1 were 97.28 km and 84.93 km, respectively. After that period, the climate boundaries gradually moved northward with a decrease of precipitation.
3.1.2 Land use boundary
The land use boundary shifted eastward with 140.39 km at the east-west direction in SE-2 region during the 1970s-1980s, which was the most extensive shift in the whole FPE area during the study periods (Figures 2a, 2c and 2e). Similarly, extensive shifts of the land use boundaries were found in region 1 and region 2. During the 1980s-1990s, the boundary in NW-1 region mainly experienced westward moving with a median distance of 32.34 km, while boundaries moved slightly in region 4, with the median distances lower than 7 km. However, for the whole FPE boundaries, there were no significant differences between the SE and NW parts due to the boundary fluctuations.
At the south-north direction, the largest change of land use boundary shifting northward with 149.82 km was observed in NW-2 region during the 1970s-1980s (Figures 2b, 2d and 2f). Boundaries shifts in region 1 were more extensive than those in the others. A significant northward moving was detected in SE-1 region during the 1990s-2000s, with a median distance of 46.07 km. The boundaries in regions 2, 3 and 4 experienced minor shifts, of which median distances were lower than 10 km with the exception of those in NW-4 region with 10.82 km during the 1980s-1990s.
Figure 2 Changes of climate and land use boundaries detected by the FishNet method

3.2 Spatial-temporal pattern changes of the FPE boundaries detected by the DSAS method

3.2.1 Climate boundary
The climate boundaries experienced more extensive shifts than land use boundaries. The largest change of climate boundary was observed in SE-1 region during the 1970s-1980s, which shifted southward with 299.09 km (Figures 3a, 3c and 3e). Similarly, we found considerable shifts in regions 1 and 2 detected by the FishNet. The most extensive shift was detected during the 1970s-1980s in SE-1 region, which shifted westward with the median shift distance of 103.75 km. On the contrary, boundaries in region 4 experienced slight fluctuations, most of medians of shift distances were lower than 5 km, except for those in the NW-4 region during the 1990s-2000s (16.71 km). For boundary fluctuations of the whole FPE, the greater changes were observed in the SE part than those in the NW part.
3.2.2 Land use boundary
The largest change of land use boundary was observed with a shift of 217.79 km moving northeastward in SE-1 region from the 1990s to the 2000s (Figures 3b, 3d and 3f). The highest median was found in NW-1 region, which was 28.89 km shifted northwestward during the 1980s-1990s. Similar to the results from the FishNet, there were no significant shifts in regions 2, 3 and 4. The medians of shift distances in region 4 were lower than 10 km except for that in the NW-4 region during the 1980s-1990s (12.39 km).
Figure 3 Changes of climate and land use boundaries detected by the DSAS method

3.3 Quantitative detection of the climate contributions to the FPE boundary shifts using the FishNet method

The climate contributions to the FPE boundary shifts significantly varied among regions and periods detected by the FishNet method (Table 2).
Table 2 The quantitative detection of climate change effects on the boundary fluctuation in the FPE of northern China
Regions Periods X direction Y direction Transect direction
Sample numbers r2 Sample numbers r2 Sample numbers r2
NW-1 1970s-1980s 261 0.444 580 0.027
1980s-1990s 255 0.107
1990s-2000s 411 0.202 331 0.047 580 0.011
NW-2 1970s-1980s 473 0.209 655 0.088 755 0.168
1980s-1990s 726 0.559
1990s-2000s 697 0.104 755 0.043
NW-3 1970s-1980s
1980s-1990s 457 0.082 612 0.043
1990s-2000s
NW-4 1970s-1980s 77 0.052 73 0.153
1980s-1990s
1990s-2000s
SE-1 1970s-1980s
1980s-1990s
1990s-2000s 891 0.015
SE-2 1970s-1980s
1980s-1990s 567 0.040 985 0.032
1990s-2000s
SE-3 1970s-1980s 357 0.201 568 0.227 932 0.099
1980s-1990s
1990s-2000s 932 0.019
SE-4 1970s-1980s
1980s-1990s
1990s-2000s
In different eco-regions of the FPE, climate had pronounced impacts on the FPE boundary fluctuations in NW-1 region, with the contributions from 10.7% to 44.4% at the east-west direction, while the climate contribution at the south-north direction was only 4.7% during the 1990s-2000s. In region 2, climate change significantly influenced boundary fluctuations in the NW part with climate contributions from 8.8% to 55.9% at the south-north direction in the three periods. However, the boundary during the 1970s-1980s was only largely driven by climate change with a contribution of 20.9% at the east-west direction. In addition, climate change hardly impacted the boundaries in the SE part; only 4.0% of the climate contribution was detected at the east-west direction during the 1980s-1990s. In region 3, the climate contribution was 8.2% at the south-north direction during the 1980s-1990s in the NW part. On the contrary, remarkable climate impacts with contributions of 20.1% and 22.7% were observed in both directions during the 1970s-1980s. The climate contributions were also very low in region 4, in which climate change only significantly drove the boundary shift with a contribution of 5.2% in the NW part at the south-north direction during the 1970s-1980s.
During different periods, climate change had different contributions to the FPE boundary shifts. The climate contributions in NW-1, NW-2 and SE-3 regions varied from 20.1% to 44.4% at the east-west direction in the 1970s-1980s. Meanwhile, the contributions of climate change in NW-2, NW-4 and SE-3 regions varied from 5.2% to 22.7% at the south-north direction. During the 1980s-1990s, the contributions of climate change in NW-1 and SE-2 regions were between 4.0% and 10.7% at the east-west direction, while the contributions of climate change in NW-2 and NW-3 regions ranged from 8.2% to 55.9% at the south-north direction. During the 1990s-2000s, climate significantly influenced the NW-1 and NW-2 regions. The contribution of climate change in NW-1 region got up to 20.2% at the east-west direction during this period, and the contributions in NW-1 and NW-2 regions at the south-north direction were 4.7% and 10.4%, respectively.
Detected by the FishNet method, the greatest climate contribution was 44.4% in NW-1 region at the east-west direction during the 1970s-1980s. In addition, it was 55.9% at the south-north direction in NW-2 region during the 1980s-1990s. Higher contributions of climate change were concentrated in NW-1 and NW-2 regions, which were between 10.7% and 44.4% at the east-west direction and ranging from 4.7% to 55.9% at the south-north direction. The results indicated that the FPE boundary changes were largely driven by climate in Northeast China.

3.4 Quantitative detection of the climate contributions to the FPE boundary shifts using the DSAS method

The climate contributions in different regions and periods detected by the DSAS method were similar to those detected by the FishNet method (Table 2).
The FPE boundaries in regions 1 and 2 were considerably shaped by climate change. The contributions during the 1970s-1980s and 1990s-2000s in NW-1 region were 2.7% and 1.1%, respectively. Furthermore, the climate contribution during the 1990s-2000s in SE-1 region was 1.5%. For NW-2 region, the climate contributions to land use boundaries were 16.8% and 4.3% during the 1970s-1980s and 1990s-2000s, respectively. It was 3.2% in SE-2 region during 1980s-1990s. Significant impacts of climate on the FPE boundaries were limited in regions 3 and 4. The contributions in SE-3 region were higher than those in NW-3 region. The contributions were 9.9% and 1.9% in SE-3 region during the 1970s-1980s and
1990s-2000s, respectively. The climate contribution in NW-3 region was 4.3% during the 1980s-1990s. However, the climate contribution in the NW-4 region was 15.3% during the 1970s-1980s.
Climate had pronounced influences on land use boundaries during the 1970s to the 1980s. The climate contributions in the NW part ranged from 2.7% to 16.8%, which were slightly higher than those in the SE part. During the 1980s-1990s, the climate contributions exhibited lower values than those in the 1970s-1980s, which varied from 3.2% to 4.3%. From the 1990s to the 2000s, land use boundaries in region 1, NW-2 and SE-3 regions were all influenced by climate, in which the climate contributions were between 1.1% and 4.3%.
Using the DSAS method, the largest contribution with 16.8% was observed in NW-2 region during the 1970s-1980s. Higher contributions existed in NW-1, NW-2, NW-4 and SE-3 regions during the 1970s-1980s.

3.5 Discussion

3.5.1 Compared with the results from previous research
Several studies showed that climate warming had caused cropland expansion in Northeast China since the 1980s (Ye et al., 2012; Liu et al., 2009; Wang et al., 2009), which fitted well with the obvious climate contributions in NW-1 and NW-2 regions in our study. Liu et al. (2011) found that the FPE boundary in the SE part of Northeast China was influenced by human activities from 1986 to 2000, and cropland in this region showed a predominant expansion to the west, which was in accordance with the results of insignificant climate impacts on the FPE shifts in SE-1 region during the former two periods. This conclusion was similar to the results in SE-1 region in our study. Furthermore, the implement of the Green for Grain Project and Grazing Prohibition policy affected the boundary shifts in the northwest FPE since 1999, which was in accordance with the insignificant impacts of climate on the FPE boundaries in NW-3 and NW-4 regions during the 1990s-2000s (Lu et al., 2013). Zuo et al. (2014) showed that the land use in western China has been dominated by human activities and policies since the 1980s. This result was also consistent with the insignificant contributions of climate in region 4 since the 1980s, which was located in the northwest of China. Thus, anthropogenic disturbance was also one of the primary drivers of boundary shifts in the FPE of northern China (Yang et al., 2014; Liu et al., 2014).
3.5.2 Comparison of the two methods of FishNet and DSAS
Most of the spatial-temporal pattern of boundary shifts detected by the methods of FishNet and DSAS had good consistence with each other. The changes of climate boundaries were at larger extent than those of land use boundaries using both methods. The greatest shifts were detected in region 1 and the smallest shifts were shown in region 4 over the three periods. The mean values and medians of shift distances in most of regions were close to the minimum, suggesting smaller changes of boundaries in these regions. The shift directions of the boundaries based on climate and land use were similar in most of the regions. For example, the shift directions of climate boundaries in regions 2 and 3, as well as land use boundaries in SE-2 and SE-3 regions were coincident detected by the methods of FishNet and DSAS. However, some inconsistencies also existed in some regions. Compared with the FishNet method, the DSAS method is closer to the facts of the detection of directions and distances for the FPE shifts.
Using the two methods, climate contributions to the FPE boundary shifts varied among regions during the study periods, and the results detected by the FishNet and DSAS methods were approximately coincident. For example, during the 1970s-1980s, the climate contributions detected by the FishNet in NW-2 region at the east-west and south-north directions were 20.9% and 8.8%, respectively, and the contribution was 16.8% from the DSAS method. Another example was in SE-3 region during the 1970s-1980s. The contributions were 20.1% and 22.7% at the east-west and south-north directions detected by the FishNet method, whereas the result from DSAS was 9.9%. However, differences were also investigated from the two methods. For instance, during the 1980s-1990s, the climate contribution at the south-north direction was 55.9% in NW-2 region, but the correlation of the shifts based on climate and land use boundaries detected from the DSAS method was not significant in this region.
Overall, the FishNet method distinctly demonstrates the climate impacts on the FPE boundary at the east-west and south-north directions, which is simple but not as accurate as the DSAS method. Therefore, this method can be employed to directly analyze the boundary changes at large scales, if it is not necessary to achieve strict requirement of accuracy. On the contrary, the DSAS method can precisely show the climate contributions to boundary shifts at the transect direction, but it is noted that the results are easily affected by the baseline. This method is especially suitable to detect the boundary changes at a small scale. Both of the two methods are primarily influenced by extreme values, and the uncertainties are relatively large in the junctures of eco-regions.

4 Conclusions

The FPE boundary fluctuations were not only driven by climate change, but also affected by human activities in northern China. We presented the FishNet method and DSAS method to quantitatively investigate the climate contributions to the boundary shifts at the scale of 1 km resolution. The results will be helpful for understanding the climate change impacts on fragile regions, and also for determining adaptation measures that should be adopted.
Due to the large area of the FPE in northern China and complicated natural environment of different eco-regions, the boundary shifts have great differences among regions during different periods. We detected these differences in the shifts of climate and land use boundaries using the methods of FishNet and DSAS. The greatest fluctuations were detected in region 1, whereas region 4 had the smallest shifts. Good spatial coupling relationships between the shifts of climate and land use boundaries were detected in the NW-1 and NW-2 regions. Climate contributions of these regions varied from 10.7% to 44.4% at the east-west direction, as well as from 4.7% to 55.9% at the south-north direction detected by the FishNet method. The climate contributions in these regions were between 1.1% and 16.8% detected by the DSAS method. During the study periods, relationship between the shifts of climate boundaries and land use boundaries was not significant in region 4, suggesting that climate change was not the main driving force of the FPE boundary shifts.
Therefore, the conclusions of the detection from the FishNet method and DSAS method had good consistence. The DSAS method is more accurate than the FishNet method, which is a proper one to detect precise changes at a smaller scale. However, the FishNet method is simple to operate, and is suitable to conduct statistical analysis rapidly and directly at a larger scale.

The authors have declared that no competing interests exist.

[1]
Deng X Z, Zhan J Y, 2004. Scale-effect analysis of LUCC driving forces in the farming-pasturing interlocked area in northern China.Geography and Geo-Information Science, 20(3): 64-68. (in Chinese)The"modifiable areal unit"is an unavoidable problem in the spatial statistical analysis of areal data.Focusing on the farming-pasturing interlocked area in Northern Plain and Northwestern Plateau of China,this paper explores the driving mechanism of the land use change since 1980s by driving forces modeling.It is showed that the BETA coefficient,reflecting the relationship between driving forces and land-use change (expansion of farmland and shrinkage of grassland),varies remarkably with different research scale,which make it necessary to conduct multi-scale analysis in constructing models in research of regional land-use change.Thus,unit-scale problem should be paid attention to ensure results accurate and reasonable.

DOI

[2]
Gao Z Q, Liu J Y, 2006. The LUCC responses to climate changes in China from 1980 to 2000.Acta Geographica Sinica, 61(8): 865-872. (in Chinese)Adopted with Holdridge Life Zone Model (HLZM), Weight Centre Model (WCM) and Land Use Degree Model (LUDM), climate data of China in recent 20 years and 2-period LUCC data covering China are used to analyze the impact degree and direction of changes caused by climatic changes and human activities to China vegetation covers and land use. In recent 20 years, the rise in temperature and increase in precipitation in most parts of China have influenced not only China's biome, but also growth conditions of Holdridge life zone deeply. In this period, variations in both precipitation and temperature in Northeast China, North China and the Inner Mongolia Plateau have improved living environment and led to the transformation of Nature Covered Ecological Type from unutilized land to grassland and shrubland types, grassland and shrubland types transformed to forest and arable land. Meanwhile, China's economic development in recent 20 years, as well as land use increment in rural and urban areas for construction and transportation purposes in eastern coastal zones have made Land Use Type developed from farmland to construction land, leading to increase in land use degree index. Thereby the dual impacts by climatic changes and economic development resulted in a shift of Land Use Degree Weight Centre northeastward by 54 km. With regard to Land Use Degree Excursion Intensity, in east-west direction, 81% is caused by climatic changes and 19% by anthropogenic impacts; while in north-south direction, 85% is caused by climatic changes and 15% by anthropogenic impacts.

DOI

[3]
Gao Z Q, Yi W, 2012. Land use change in China and analysis of its driving forces using CLUE-S and Dinamica EGO model.Transactions of the Chinese Society of Agricultural Engineering, 28(16): 208-216. (in Chinese)In order to analyze the driving mechanism and to predict land use change of China in the future, CLUE-S(the conversion of land use and its effects at small regional extent) and Dinamica EGO(environment for geoprocessing objects) model were used to simulate land use change in China from 2000 to 2020 based on the land use data in 2000 and 2005 from Data Center for Resources and Environmental Sciences Chinese Academy of Sciences (RESDC). With Logistic regression and Bayesian estimation, land use suitability and spatial characters of driving factors of land use change from 2000 to 2005 in China were analyzed. The simulation results in 2005 indicated that, the predictions of LUCC (land use change in China) with CLUE-S and Dinamica EGO matched broadly with actual situation and CLUE-S was better than Dinamica EGO model in overall accuracy. However, the Markov process in Dinamica EGO could precisely predict the amount of land use change and the spatial pattern was consistent with empirical result. The simulation results of land use in 2020 showed that areas of farmland, forest, water and construction land would increase, while grassland would decrease largely. Unused land would increase with CLUE-S model but decrease with Dinamica EGO model. This article serves as the scientific foundation for land resource plan and farmland protection policy in China.

DOI

[4]
Huang Q, Xin X P, Zhang H B, 2010. Ecosystem-service-based regionalization of the grassland and agro-pastoral transition zone in northern China.Acta Ecologica Sinica, 30(2): 350-356. (in Chinese)With a primary consideration of the ecosystem service function of different grassland types,and basing on the principles of regional planning,methodology,nomenclature,the features of regional eco-environment,as well as "3S" techniques,The grassland and agro-pastoral transitional zone in northern China was classified into 3 ecological regions and 10 eco-function regions.Then,the elaborations were carried out in detail regarding the territory of each function region,primary eco-environment issues,core ecological service functions and means to be adopted for protection and sustainable development of each specific function region.We believe that the developed regionalization result is very helpful in understanding the ecological service function value of different grassland types,facilitating effective use of grassland resources,promoting optimal layout of agricultural production,improving the regional ecological security,as well as strengthening the regional sustainable development in the grassland and agro-pastoral transitional zone of northern China.

DOI

[5]
Jayson Q P, Appeaning A K, Kufogbe S, 2013. Medium resolution satellite imagery as a tool for monitoring shoreline change: Case study of the Eastern coast of Ghana.Journal of Coastal Research, 65(sp1): 511-516.Shoreline change analysis provides important information upon which most coastal zone management and intervention policies rely. Such information is however mostly scarce for large and inaccessible shorelines largely due to expensive field work. This study investigated the potential of medium resolution satellite imagery for mapping shoreline positions and for estimating historic rate of change. Both manual and semi-automatic shoreline extraction methods for multi-spectral satellite imageries were explored. Five shoreline positions were extracted for 1986, 1991, 2001, 2007 and 2011 covering a medium term of 25 years period. Rates of change statistics were calculated using the End Point Rate and Weighted Linear Regression methods. Approximately 283 transects were cast at simple right angles along the entire coast at 200m interval. Uncertainties were quantified for the shorelines ranging from 卤4.1m to 卤5.5m. The results show that the Keta shoreline is a highly dynamic feature with average rate of erosion estimated to be about 2m/year 卤0.44m. Individual rates along some transect reach as high as 16m/year near the estuary and on the east of the Keta Sea Defence site. The study confirms earlier rates of erosion calculated for the area and also reveals the influence of the Keta Sea Defence Project on erosion along the eastern coast of Ghana. The research shows that shoreline change can be estimated using medium resolution satellite imagery.

DOI

[6]
Li Q Y, Pan X B, 2012. The impact of climate change on boundary shift of farming pasture ecotone in northern China.Journal of Arid Land Resources and Environment, 26(10): 1-6. (in Chinese)

[7]
Li Z, Yan Z W, 2009. Homogenized daily mean/maximum/minimum temperature series for China from 1960-2008.Atmospheric and Oceanic Science Letters, 2(4): 236-242.In this study the authors apply the chemistry version of the Weather Research and Forecasting model (WRF-Chem) to examine the impacts of black carbon (BC)-induced changes in snow albedo on simulated temperature and precipitation during the severe snowstorm that occurred in southern China during 0800 26 January to 0800 29 January 2008 (Note that all times are local time except when otherwise stated). Black carbon aerosol was simulated online within the WRF-Chem. The model results showed that surface-albedo, averaged over 27-28 January, can be reduced by up to 10% by the deposition of BC. As a result, relative to a simulation that does not consider deposition of BC on snow/ice, the predicted surface air temperatures during 27-28 January can differ by -1.95 to 2.70 K, and the predicted accumulated precipitation over 27-28 January can differ by -2.91 to 3.10 mm over Areas A and B with large BC deposition. Different signs of changes are determined by the feedback of clouds and by the availability of water vapor in the atmosphere.

[8]
Liu D W, Wang Z M, Song K Set al., 2009. Land use/cover changes and environmental consequences in Songnen Plain, Northeast China.Chinese Geographical Science, 19(4): 299-305.The Songnen Plain in Northeast China, one of the key national bases of agricultural production, went through remarkable land use/cover changes in recent years. This study aimed to explore the long-term land use/cover changes and the effects of these changes on the environment. The Landsat-based analysis showed that, during 1986-2000, cropland, built-up land and barren land had increased, among which cropland had the largest increase of 9,198km 2 with an increase rate of 7.5%. Woodland, grassland, water body and swampland had decreased correspondingly, among which grassland had the most dramatic decrease of 6,127km 2 with a decrease rate of 25.6%. The transition matrix results revealed that grassland, woodland and swampland were the three main land use types converted to cropland. Climate warming created the potential environment for the conversion of grassland and swampland into cropland. Land resources policy made by central and provincial governments of China affected the pattern and intensity of land use. Land use/cover changes accompanied by climatic variation brought out a series of environmental consequences, such as sand desertification of land, land salinization and alkalinization, grassland degradation, and more frequent floods. Under this circumstance, optimized land use structure and restoration measures are needed.

DOI

[9]
Liu J H, Gao J X, 2008a. Changes of land use and landscape pattern in the boundary change areas in farming-pastoral ecotone of northern China.Transactions of the Chinese Society of Agricultural Engineering, 24(11): 76-82. (in Chinese)The ecotone was defined as a transitional zone between two adjacent ecosystems, and it was the sensitive region of terrestrial ecosystems which is vulnerable to global change and human disturbance. Under the impact of global climate change and human disturbance, the location and boundary in farming-pastoral ecotone of Northern China are changing continually, and the land use and landscape pattern of boundary changing area are also changing quickly. Based on the meteorological data and land use data, by using RS, GIS technology and landscape ecological methods, the locations of farming-pastoral ecotone of Northern China and its boundary change area are defined, and the temporal and spatial changes of land use and landscape pattern are analyzed in boundary change area from 1986 to 2000. The main results reveal that: (1) The structural changes of land use, the alternative transformation of different land use types and the dynamic degree of land use have obvious regional differences in the buffer zones of northwest boundary and southeast boundary. (2)The distances and directions of landscape gravity centers transfer, and the changes of landscape pattern have their different characteristics in buffer zones of northwest boundary and southeast boundary.

DOI

[10]
Liu J H, Gao J X, 2008b. Spatial changes of boundary based on land use and climate change in the farming-pastoral ecotone of northern China.China Environmental Science, 28(3): 203-209. (in Chinese)Based on meteorological data of 218 weather stations during 1961~2005 and land use data of 1986 and 2000 in nine provinces of northern China, the location of farming-pastoral ecotone of northern China from the perspective of global climate change and land use change were redefined, and the change characteristics of its boundary was analyzed. There was some disputes on the location of farming-pastoral ecotone of northern China. The whole farming-pastoral ecotone of northern China moved northwestwards. The northwest boundary had gone deep into the pure pasture zone in a northward direction, and farming-pastoral ecotone near southeast boundary had changed to pure farming zone. Climatic boundary changed southeastwards while land use boundary changed northwestwards, and their changing directions were reverse. The change ranges of boundary in northeast section and North China section were far greater than northwest section.

[11]
Liu J H, Gao J X, Lv Set al., 2011. Shifting farming-pastoral ecotone in China under climate and land use changes.Journal of Arid Environments, 75(3): 298-308.Meteorological records show a rise in temperature and decrease in precipitation in most parts of the farming–pastoral ecotone of Northern China over the last 50 years. During the last quarter of the 20th Century, the agrarian sector went through a series of reforms and changes in government policies on land use that have led to extensive changes in land cover. The objective of this study was to redefine the location and analyze the boundary variations under the effects of climate and land use changes in the farming–pastoral ecotone of Northern China. The results showed that the location of study area has been redefined as both a climatic ecotone from the perspective of suitability of precipitation and temperature for agricultural crops and vegetation growth, and also a land use ecotone based on the impacts of farmland restructuring by government policies on land use. In recent decades, the climatic boundary has moved southeast while the land use boundary has moved northwest, showing opposing directions of change. The extent of boundary changes in the northeast and northern sections are far greater than in the northwestern section of the farming–pastoral ecotone of Northern China.

DOI

[12]
Liu J Y, Kuang W H, Zhang Z Xet al., 2014. Spatiotemporal characteristics, patterns, and causes of land-use changes in China since the late 1980s.Journal of Geographical Sciences, 24(2): 195-210.Land-use/land-cover changes (LUCCs) have links to both human and nature interactions. China's Land-Use/cover Datasets (CLUDs) were updated regularly at 5-year intervals from the late 1980s to 2010,with standard procedures based on Landsat TM\ETM+ images. A land-use dynamic regionalization method was proposed to analyze major land-use conversions. The spatiotemporal characteristics,differences,and causes of land-use changes at a national scale were then examined. The main findings are summarized as follows. Land-use changes (LUCs) across China indicated a significant variation in spatial and temporal characteristics in the last 20 years (1990-2010). The area of cropland change decreased in the south and increased in the north,but the total area remained almost unchanged. The reclaimed cropland was shifted from the northeast to the northwest. The built-up lands expanded rapidly,were mainly distributed in the east,and gradually spread out to central and western China. Woodland decreased first,and then increased,but desert area was the opposite. Grassland continued decreasing. Different spatial patterns of LUC in China were found between the late 20th century and the early 21st century. The original 13 LUC zones were replaced by 15 units with changes of boundaries in some zones. The main spatial characteristics of these changes included (1) an accelerated expansion of built-up land in the Huang-Huai-Hai region,the southeastern coastal areas,the midstream area of the Yangtze River,and the Sichuan Basin;(2) shifted land reclamation in the north from northeast China and eastern Inner Mongolia to the oasis agricultural areas in northwest China;(3) continuous transformation from rain-fed farmlands in northeast China to paddy fields;and (4) effectiveness of the &quot;Grain for Green&quot; project in the southern agricultural-pastoral ecotones of Inner Mongolia,the Loess Plateau,and southwestern mountainous areas. In the last two decades,although climate change in the north affected the change in cropland,policy regulation and economic driving forces were still the primary causes of LUC across China. During the first decade of the 21st century,the anthropogenic factors that drove variations in land-use patterns have shifted the emphasis from one-way land development to both development and conservation.The &quot;dynamic regionalization method&quot; was used to analyze changes in the spatial patterns of zoning boundaries,the internal characteristics of zones,and the growth and decrease of units. The results revealed &quot;the pattern of the change process,&quot; namely the process of LUC and regional differences in characteristics at different stages. The growth and decrease of zones during this dynamic LUC zoning,variations in unit boundaries,and the characteristics of change intensities between the former and latter decades were examined. The patterns of alternative transformation between the &quot;pattern&quot; and &quot;process&quot; of land use and the causes for changes in different types and different regions of land use were explored.

DOI

[13]
Liu J Y, Liu M L, Tian H Qet al., 2005. Spatial and temporal patterns of China's cropland during 1990-2000: An analysis based on Landsat TM data.Remote Sensing of Environment, 98(4): 442-456.There are large discrepancies among estimates of the cropland area in China due to the lack of reliable data. In this study, we used Landsat TM/ETM data at a spatial resolution of 30 m to reconstruct spatial and temporal patterns of cropland across China for the time period of 1990-2000. Our estimate has indicated that total cropland area in China in 2000 was 141.1 million hectares (ha), including 35.6 million ha paddy land and 105.5 million ha dry farming land. The distribution of cropland is uneven across the regions of China. The North-East region of China shows more cropland area per capita than the South-East and North regions of China. During 1990-2000, cropland increased by 2.79 million ha, including 0.25 million ha of paddy land and 2.53 million ha of dry farming land. The North-East and North-West regions of China gained cropland area, while the North and South-East regions showed a loss of cropland area. Urbanization accounted for more than half of the transformation from cropland to other land uses, and the increase in cropland was primarily due to reclamation of grassland and deforestation. Most of the lost cropland had good quality with high productivity, but most gained cropland was poor quality land with less suitability for crop production. The globalization as well as changing environment in China is affecting land-use change. Coordinating the conflict between environmental conservation and land demands for food will continue to be a primary challenge for China in the future.

DOI

[14]
Liu J Y, Liu M L, Zhuang D Fet al., 2003. Study on spatial pattern of land-use change in China during 1995-2000.Science in China. Series D: Earth Sciences, 46(4): 373-384.It is more and more acknowledged that land-use/cover dynamic change has become a key subject urgently to be dealt with in the study of global environmental change. Supported by the Landsat TM digital images, spatial patterns and temporal variation of land-use change during 1995 -2000 are studied in the paper. According to the land-use dynamic degree model, supported by the 1km GRID data of land-use change and the comprehensive characters of physical, economic and social features, a dynamic regionalization of land-use change is designed to disclose the spatial pattern of land-use change processes. Generally speaking, in the traditional agricultural zones, e.g., Huang-Huai-Hai Plains, Yangtze River Delta and Sichuan Basin, the built-up and residential areas occupy a great proportion of arable land, and in the interlock area of farming and pasturing of northern China and the oases agricultural zones, the reclamation of arable land is conspicuously driven by changes of production conditions, economic benefits and climatic conditions. The implementation of -渞eturning arable land into woodland or grassland- policies has won initial success in some areas, but it is too early to say that the trend of deforestation has been effectively reversed across China. In this paper, the division of dynamic regionalization of land-use change is designed, for the sake of revealing the temporal and spatial features of land-use change and laying the foundation for the study of regional scale land-use changes. Moreover, an integrated study, including studies of spatial pattern and temporal process of land-use change, is carried out in this paper, which is an interesting try on the comparative studies of spatial pattern on change process and the change process of spatial pattern of land-use change.

DOI

[15]
Liu J Y, Zhang Z X, Xu X Let al., 2010. Spatial patterns and driving forces of land use change in China during the early 21st century.Journal of Geographical Sciences, 20(4): 483-494.Land use and land cover change as the core of coupled human-environment systems has become a potential field of land change science (LCS) in the study of global environmental change. Based on remotely sensed data of land use change with a spatial resolution of 1 km &times; 1 km on national scale among every 5 years, this paper designed a new dynamic regionalization according to the comprehensive characteristics of land use change including regional differentiation, physical, economic, and macro-policy factors as well. Spatial pattern of land use change and its driving forces were investigated in China in the early 21st century. To sum up, land use change pattern of this period was characterized by rapid changes in the whole country. Over the agricultural zones, e.g., Huang-Huai-Hai Plain, the southeast coastal areas and Sichuan Basin, a great proportion of fine arable land were engrossed owing to considerable expansion of the built-up and residential areas, resulting in decrease of paddy land area in southern China. The development of oasis agriculture in Northwest China and the reclamation in Northeast China led to a slight increase in arable land area in northern China. Due to the &ldquo;Grain for Green&rdquo; policy, forest area was significantly increased in the middle and western developing regions, where the vegetation coverage was substantially enlarged, likewise. This paper argued the main driving forces as the implementation of the strategy on land use and regional development, such as policies of &ldquo;Western Development&rdquo; &ldquo;Revitalization of Northeast&rdquo; coupled with rapidly economic development during this period.

DOI

[16]
Liu J Y, Zhang Z X, Zhuang D F et al., 2005. The Study on the Spatial-temporal Information of Land Use Changes in China with Remote Sensing in the 1990s. Beijing: Science Press. (in Chinese)

[17]
Lu W, Jia G S, 2013. Fluctuation of farming-pastoral ecotone in association with changing East Asia monsoon climate.Climatic Change, 119(3): 747-760.As a monsoon climate dominated region, East Asia has a high rate of climate variation. Previous studies demonstrated that the East Asian monsoon had weakened since the end of 1970’s; however, contrary to the climatic trend, a common scenario of advancing farming-pastoral ecotone (FPE) has been proposed. The objective of this study is to analyze land surface changes in association with monsoon climate variability over past 2502years in East Asia. A combination of intensive ground survey of vegetation and land use, meteorological data, and remote sensing are used to quantify the relationship between vegetation and climate and to analyze the FPE fluctuations associated with changing climate. Field precipitation data from 1981 to 2005, are used to represent climate variations and to delineate the FPE boundary. NDVI data are used to evaluate greenness-precipitation linkages by vegetation type and to create land cover maps depicting spatial pattern fluctuations of the FPE. This study demonstrates that: (1) There was no persistent northwest shifting trend of either the FPE boundary or vegetation cover during last 2502years. (2) Time integrated NDVI (TI-NDVI) varies with precipitation, and the maximum or minimum NDVI may be only sensitive to precipitation for areas with mean annual precipitation lower than approximately 20002mm. (3) A significant relationship exists between NDVI and precipitation variations for areas with mean annual precipitation greater than approximately 30002mm, especially the ecotone with a ΔNDVI of 0.12265±650.032. (4) The “advances” of FPE closely mimic fluctuations of precipitation in East Asia.

DOI

[18]
Shi W J, Tao F L, Liu J Yet al., 2014. Has climate change driven spatio-temporal changes of cropland in northern China since the 1970s?.Climatic Change, 124(1/2): 163-177.Improving the understanding of cropland change and its driving factors is a current focus for policy decision-makers in China. The datasets of cropland and cropland changes from the 1970s to the 2000s

DOI

[19]
Shi X L, Shi W J, 2015. Identifying contributions of climate change and human activities to cropland spatial-temporal changes: A review.Acta Geographica Sinica, 70(9): 1463-1476. (in Chinese)It is important to study the contributions of climate change and human activities to spatial-temporal changes of cropland in the fields of climate change and land use change. Relationships between spatial-temporal cropland changes and driving forces were studied at qualitative aspects in most of the previous researches. However, the quantitative assessments of the contributions of climate change and human activities to spatial-temporal changes of cropland need to be explored for a better understanding of the dynamics of land use changes. We systematically reviewed the methods of identifying contributions of climate change and human activities to temporal-spatial cropland changes at quantitative aspects, e.g. model analysis, mathematical statistical method, framework analysis, index assessment and difference comparison. The progresses of the previous researches on quantitative evaluation of the contributions were introduced. However, there were four defects in assessing the contributions of climate change and human activities to spatial-temporal cropland changes. For example, the methods were lack of comprehensiveness, and the data need to be more accurate and abundant. Moreover, the scale was single and the explanations were biased. Meanwhile, we concluded a clue about quantitative approaches to assess the contributions from the synthetical aspect to specific driving forces. Besides, the solutions of the future researches on data, scale and explanation were proposed.

DOI

[20]
Su W, Liu X X, Luo Qet al., 2015. Responses of vegetation to change of meteorological factors in agricultural-pastoral area of northern China.Transactions of the Chinese Society for Agricultural Machinery, 46(11): 352-359. (in Chinese)Abstract Agricultural-pastoral area of Northern China is a ecologically fragile belt. Climate change has increased the risk of ecological vulnerability in this region. Besides, it has made the ecological vulnerability more serious because of the pattern of alternant farming and animal husbandry. Therefore, the aim of this paper was to study the responses of vegetation to the change of meteorological factors in agricultural-pastoral areas of Northern China during 2001-2013, using correlation analysis method. First, temporal and spatial variation rules of vegetation growing were explored based on NDVI (Normalized differential vegetation index) and GPP (Gross primary productivity) data. Then, variation rules of temperature and precipitation were found. Finally, we analyzed the responses of vegetation to the change of meteorological factors of different vegetation types using Pearson correlation coefficient method. The results showed that in the research area, vegetation ecological situation was negatively correlated with temperature and positively correlated with precipitation in growing season, while the correlations were on the contrast in non-growing season. The vegetation ecological situation was positively correlated with temperature and negatively correlated with precipitation. Because the higher temperature will inhibit the vegetation growth than the optimum temperature, while the precipitation in semi-arid area could promote the growth of vegetation. However, temperature was very low in non-growing season, so the increase in temperature promotes vegetation ecological situation obviously and the response of vegetation to precipitation was not obvious because precipitation was not the main factor influencing the vegetation ecological situation in this period. 漏 2015, Chinese Society of Agricultural Machinery. All right reserved.

DOI

[21]
Wang J A, Shi P J, 1988. The utilization of land resources and regional development strategies of farming-pastoral zone in Inner Mongolia.Areal Research and Development, 7(1): 24-28. (in Chinese)

[22]
Wang Y D, Hou X Y, Jia M Met al., 2014. Remote detection of shoreline changes in eastern bank of Laizhou Bay, North China.Journal of The Indian Society of Remote Sensing, 42(3): 621-631.Sandy beaches of the eastern coast zone in Eastern Laizhou Bay represent the most popular tourist, recreational destinations and constitute some of the most valuable restates in China. This paper presents the detection of shoreline changes in Laizhou Bay East Bank using an automatic histogram thresholding algorithm on the basis of multi-temporal Landsat images. Shoreline change rates (SCR) and shoreline change areas (SCA) were retrieved using the statistical approach and zonal change detection method, respectively. Results showed that during 1979-2010 a large portion (over 59.8 %) of shoreline are dominated by a retreating process with an average rate of -2.01 m/year, while other parts of shoreline exhibited a seaward advancing trend due to intense land reclamation activities. It is our anticipation that the result of this work would support sandy beaches protection and management in China coast.

DOI

[23]
Wang Z M, Liu Z M, Song K Set al., 2009. Land use changes in Northeast China driven by human activities and climatic variation.Chinese Geographical Science, 19(3): 225-230.

DOI

[24]
Wu C J, Guo H C, 1994. The Land Use of China. Beijing: Science Press. (in Chinese)

[25]
Yang Y Y, Zhang S W, Wang D Yet al., 2014. Spatiotemporal changes of farming-pastoral ecotone in northern China, 1954-2005: A case study in Zhenlai County, Jilin Province.Sustainability, 7(1): 1-22.Analyzing spatiotemporal changes in land use and land cover could provide basic information for appropriate decision-making and thereby plays an essential role in promoting the sustainable use of land resources, especially in ecologically fragile regions. In this paper, a case study was taken in Zhenlai County, which is a part of the farming-pastoral ecotone of Northern China. This study integrated methods of bitemporal change detection and temporal trajectory analysis to trace the paths of land cover change for every location in the study area from 1954 to 2005, using published land cover data based on topographic and environmental background maps and also remotely sensed images including Landsat MSS (Multispectral Scanner) and TM (Thematic Mapper). Meanwhile, the Lorenz curve and Gini coefficient derived from economic models were also used to study the land use structure changes to gain a better understanding of human impact on this fragile ecosystem. Results of bitemporal change detection showed that the most common land cover transition in the study area was an expansion of arable land at the expense of grassland and wetland. Plenty of grassland was converted to other unused land, indicating serious environmental degradation in Zhenlai County during the past decades. Trajectory analysis of land use and land cover change demonstrated that settlement, arable land, and water bodies were relatively stable in terms of coverage and spatial distribution, while grassland, wetland, and forest land had weak stability. Natural forces were still dominating the environmental processes of the study area, while human-induced changes also played an important role in environmental change. In addition, different types of land use displayed different concentration trends and had large changes during the study period. Arable land was the most decentralized, whereas forest land was the most concentrated. The above results not only revealed notable spatiotemporal features of land use and land cover change in the time series, but also confirmed the applicability and effectiveness of the methodology in our research, which combined bitemporal change detection, temporal trajectory analysis, and a Lorenz curve/Gini coefficient in analyzing spatiotemporal changes in land use and land cover.

DOI

[26]
Ye Y, Fang X Q, 2012. Expansion of cropland area and formation of the eastern farming-pastoral ecotone in northern China during the twentieth century.Regional Environmental Change, 12(4): 923-934.Land cover changes induced by historical cultivation in ecologically fragile areas involving important issues such as environmental change, ecology, and human sustainability are particularly worthy of attention. This paper reconstructs the spatial distribution of cultivated areas at the county level in the eastern farming-pastoral ecotone of northern China for four time periods during the twentieth century. The paper also analyzes how the location of cultivation ratio contours of 15 and 30 %, representing the boundaries of agricultural areas, have moved and the formation process of farming-pastoral ecotone patterns during this period. The study concludes that the area and ratio of cultivated land fluctuations increased during the twentieth century. The boundaries of the cultivation ratio contours of 15 and 30 % continually moved west and north. Moving north took priority over the other directions during the period of 1916-1940, when its center moved the farthest during the twentieth century, and the boundaries primarily moved westward during 1940-1980 and northwestward during 1980-2000. The distance, direction, and extent of the movement of the cultivation boundaries are all related to agricultural area expansion processes during this period, finally resulting in the creation of the modern farming-pastoral ecotone pattern.

DOI

[27]
Ye Y, Fang X Q, 2013. Boundary shift of potential suitable agricultural area in farming-grazing transitional zone in northeastern China under background of climate change during 20th century.Chinese Geographical Science, 23(6): 655-665.

DOI

[28]
Ye Y, Fang X Q, Khan M A U, 2012. Migration and reclamation in Northeast China in response to climatic disasters in North China over the past 300 years.Regional Environmental Change, 12(1): 193-206.Climatic disaster-induced migration and its effects on land exploitation of new settlements is a crucial topic that needs to be researched to better understand the impact of climate change and human adaptation. This paper focuses on the process and mechanism of migrant-reclamation in Northeast China in response to climatic disasters over the past 300 years. The research used comparative analysis of key interlinked factors in this response involving drought/flood events, population, cropland area, farmer revolts, administrations establishment, and land reclamation policies. It draws the following conclusions: (1) seven peaks of migrants-reclamation in Northeast China were evident, most likely when frequent climatic disasters happened in North China, such as the drought-flood in 1851-1859, drought in 1875-1877, and drought 1927-1929; (2) six instances of policy transformation adopted to cope with extreme climatic events, including distinctive examples like changing to a firm policy prohibiting migration in 1740 and a subsequent lifting of that prohibition in 1860; and (3) the fast expansion of the northern agricultural boundary since the middle of the nineteenth century in this area benefited from a climate change trend from a cold period into a warm period. Altogether, over the past 300 years, extreme climatic disasters in North China have deepened the contradiction between the limited land resources and the rapidly increasing population and have resulted in migration and reclamation in Northeast China. Climate, policy, and reclamation constructed an organic chain of response that dominated the land use/cover change process of Northeast China.

DOI

[29]
Zhang Z X, Zhao X L, Wang X, 2012. Remote sensing monitoring of land use in China. Beijing: Star Map Press. (in Chinese)

[30]
Zhao H L, Zhao X Y, Zhang T Het al., 2002. Boundary line on agro-pasture zigzag zone in North China and its problems on eco-environment.Advance in Earth Sciences, 17(5): 739-747. (in Chinese)North Agro pasture zigzag zone located mainly in south edge on Inner Mongolia plateau and area along the line of Great Wall, the boundaries of east and south part are Lonjing, Anda, Qian'an, Changling, Kangping, Fuxin, Fengning, Huai'an, Hunyuan, Wuzai, Shenmu,Yulin and Huanxian, and that of west and north are Chenbaerhu, Wulanhaote, Linxi, Duolun, Tuoketuo, Etuoke and Yanchi.It involves 9 provinces and 106 counties that total area is 654 564 km 2 and total population is 3135.6×10 4 and average density of population per km 2 is 47.9 and ratio among farmland and woodland and pasture is 1.0∶1.17∶3.67. In recent tens years, There are some ecological problems in the zone inclusing desertification developing rapidly and land resources and its bearing capacity decreasing sharply and eco environment worsening obviously and natural calamity appearing frequently. The causes of formation, expecting for natural harmful factors and artificially strong disturbance, includes yet the history brand of desertification and northern moving of the zigzag zone in recent hundred years and economic geography. Degeneration eco environment control in the zone should pay attention to replace poplar by local tree species progressively and to adopt banding afforestation ways combined with tree and shrub and grass.To establish a artificia1 steppe vegetation with scattered trees and to make its eco barrier affects well.

DOI

[31]
Zhao J, Li X, 2009. Research progress on the farming-pastoral ecotone in China.Pratacultural Science, 26(1): 94-99. (in Chinese)Based on the domestic literature on farmingpastoral ecotone, the research emphases, contents, methods, progresses and prospects of the farmingpastoral ecotone in China were analyzed. The conclusions are as follows: 1) From 1990 to 2006, the studies on farmingpastoral ecotone mainly focused on the natural conditions, landuse and landscape, ecosystems, industry and regional economic development etc; 2) GIS, RS, GPS technologies and model analysis gradually became the important methods; 3) The integrated multidisciplinary, multiscale research and timespatial integrated and applications of modern information technology will be main trend in future.

[32]
Zhu Z D, Liu S, Yang Y L, 1984. The possibilities and realities on re-management of desertified lands in the inter-distributing areas for argicultural and graziery practices in northern China.Scientia Geographica Sinica, 4(3): 197-206. (in Chinese)Desertification is a process of environmental degradation on the aspect of declining land productivity in arid and semi-arld(include some areas in semi- humid)zones,and is a phenomenon of disaccords between the human activities and environmental resources,namely,it is the result of the destruction of fragile ecobalance under the interaction of over-utilization of land resources and sand deposits conditions in dry and windy season.From these processes,the desert-like landscape,where winds and sands are active,is oceured on surface,and they are called desertification processes and the lands affected by them is called desertified land. There are 11,750,000 of population,40% of total population in arid and semi-arid areas in Northern China,in 81 counties and banners in the inter-di- stributing areas for agricultural and graziery practices where desertification is occured;and approximately 261,000 km~2 of land area here,of which cultivated fields occupy about 4,500,000ha.,and cover 47% of that in arid and semi-arid areas in Northern China,The deserfification processes are developing rapidly at present and 61.5% of land area in the inter-distributing areas for agricultural and graziery practices is occupied by the desertified land.As for the desertified land above-mentioned,26.9% of it was occupied by severe desertified land;25.7%by most severe desertified land;and 47.4% by on-going desertified land. It is estimated that,on the basis of the data combined the analysis of airphoto with ground investigation and surv ey,the desertified land in the inter-distributing areas for agricultural and graziery practices increased for 3.4 million ha,during last 30 years.Of which 42.9% is formed by over-cultivation for farming; 31.1% by transcendence of carrying capacity and over-grazing;22.2% by conti- nuous firewood collection and the rest caused by construction of mills,mines,co- mmunication lines and new towns and by the destruction of vegetation and the misuse of water resources.Because of the difference of formational type,the de- velopment of desertification landscape is also different relatively.A diagramme of formation of desertification processes in the inter-distributing areas for agricultural and graziery practices is given in the paper. Huanghua Tala Commune in Naiman Banner,Inner Mongolia,for example,was a sandy steppe and annual rainfall is about 360mm,but the deserfified land area developed to occupy 81% of the total land area in the commune due to over-recla- matiion and over-cultivation of steppe and firewood collections.Since 1970,the land use rate which centred on dry farming has been re-managed;the specific gravity of forest and forage has been enlarged;the measures of combination of trees,shrubs and grass,of plantation of tree-belts and forests in patches have been adapted;the basic farmland and fodder farm has been protected;the tillage influenced by desertification has been cut down unceasingly and the measures for fencing-Sand-to-cultivating-grass have been integrated with other measures.At pre- sent,the land-use rate of the commune has been readjusted to the structure of 21:52:27 in the midst of agriculture,forestry and graziery practices.The deserti- fied land at first has been controlled initially,the total grain output has been increased 3.36 times that before controlling and the desertification process has been rationally reversed basically. By sythesizing above analysis,the desertified land in the inter-distributing areas for agricultural and graziery practices possesses not only the possibility.to remanage,but also the reverse rotation of desertification is becoming real in a great deal of typical region.

[33]
Zuo L J, Zhang Z X, Zhao X Let al., 2014. Multitemporal analysis of cropland transition in a climate-sensitive area: A case study of the arid and semiarid region of northwest China.Regional Environmental Change, 14(1): 75-89.Land-use change is becoming an important anthropogenic force in the global climate system through alteration of the Earth's biogeophysical and biogeochemical processes. Cropland, which provides people with food, is the most variable vegetation land-use type and is affected by natural and anthropic forces and in turn affects the environment and climate system. This paper investigates the temporal-spatial pattern of cropland transition in the arid and semiarid region of northwest China, using remote sensing data for the late 1980s, 1995, 2000, 2005, 2008, and 2010. The aim was to clarify the change intensity and conversion pattern of cropland with a view to identifying the effects of a series of governmental policies and their influence on the climate system. Mathematical methodologies including the use of a transition matrix model, dynamic degree model, area-weighted centroid model, and area percentage were employed to analyze the temporal change in cropland. Meanwhile, a gridded zonal model with 10-km(2) resolution was used to detect the spatial pattern of cropland transition. During the period from the late 1980s to 2010, cropland increased dramatically by 23,182.17 km(2), an increase of 13.61 % relative to the area under cultivation in the late 1980s. Cropland transition accumulated in the western oasis-desert ecotone of the study area while it declined in the eastern farming-pastoral ecotone, leading to the westward movement of the cropland centroid. A net decrease in natural vegetation and unused land along with a net increase in built-up land due to cropland conversion was observed in the monitoring period. The three major driving forces of the cropland transition were population growth, economic development, and land-use management governed by the Grain for Green Program. The climate response to different conversion patterns was simply analyzed. However, quantitative assessment of the effect should be undertaken by employing ecosystem and climate models.

DOI

Outlines

/