Research Articles

Spatiotemporal changes in frequency and intensity of high-temperature events in China during 1961-2014

  • ZHANG Ming , 1 ,
  • DU Shiqiang , 1, * ,
  • WU Yanjuan , 2, 1 ,
  • WEN Jiahong 1 ,
  • WANG Congxiao 1 ,
  • XU Ming 3 ,
  • WU Shuang-Ye 4
Expand

*Corresponding author: Du Shiqiang (1984-), Associate Professor, E-mail:; Wu Yanjuan (1989-), PhD, E-mail:

Author: Zhang Ming (1989-), Master, specialized in meteorological disasters and climate change. E-mail:

Received date: 2016-08-16

  Accepted date: 2017-02-24

  Online published: 2017-09-05

Supported by

National Natural Science Foundation of China, No.41401603

Copyright

Journal of Geographical Sciences, All Rights Reserved

Abstract

In this study, we explored spatial patterns and the temporal trends in high-temperature events (HTEs) for the mainland of China during 1961-2014 based on a daily- maximum surface-air-temperature dataset of 494 stations and nonparametric trend detection methods. With three thresholds of 35°C (HTE35), 37°C (HTE37), and 40°C (HTE40), HTEs occurred in 82%, 71%, and 37% of the surveyed stations and showed an overall increasing trend in both frequency and intensity during 1961-2014. In northern and southeastern China, HTEs showed a significant increasing trend in both frequency and intensity, whilst a decreasing trend for both was observed in central China. Despite such regional heterogeneity, HTEs overwhelmingly presented three-phase characteristics in all three representative regions and throughout China; the phases are 1961-1980, 1980-1990, and 1990-2014. Both frequency and intensity of HTEs have strongly increased during 1990-2014 at 54.86%, 48.38%, and 23.28% of the investigated stations for HTE35, HTE37 and HTE40, respectively. These findings implied that HTEs adaptation should be paid further attention in the future over China because the wide spread distribution of HTEs and their increasing trends in both frequency and intensity during recent decades might pose challenges to the sustainability of human society and the ecosystem.

Cite this article

ZHANG Ming , DU Shiqiang , WU Yanjuan , WEN Jiahong , WANG Congxiao , XU Ming , WU Shuang-Ye . Spatiotemporal changes in frequency and intensity of high-temperature events in China during 1961-2014[J]. Journal of Geographical Sciences, 2017 , 27(9) : 1027 -1043 . DOI: 10.1007/s11442-017-1419-z

1 Introduction

A high-temperature event (HTE) is a natural hazard that occurs when temperature exceeds a threshold, i.e. 35°C, 37°C, and 40°C (CMA, 2008). HTEs can seriously affect various aspects of human society and the ecosystem, e.g., human health, energy consumption, labor productivity, precipitation, and hydrological processes (Davis and Gertler, 2015; Portmann et al., 2009; Zander et al., 2015). Because of an HTE in Europe in 2003, more than 70,000 people died across European countries and crop losses were estimated to be approximately US$ 12 billion (Robine et al., 2008). In 2013, a HTE-related drought caused direct economic loss of nearly US$ 10 billion in China (Hou et al., 2014). Moreover, HTEs may change in both intensity and frequency in the context of global climate change and urbanization.
The intensity and frequency of HTEs have shown complicated spatial patterns and temporal trends worldwide (Donat et al., 2013; Hansen et al., 2012). On one hand, global warming has been argued to probably cause increases in HTEs (IPCC, 2012). For example, Hansen et al. (2012) showed that the areas impacted by HTEs have expanded globally since 1981. Moreover, HTEs are probably enhanced by urban heat islands in the process of accelerated urbanization (Sun et al., 2014; Zhou et al., 2004). On the other hand, both temporal and spatial heterogeneity were found in the trends of mean temperature and HTEs (Donat et al., 2013). Temporally, a phenomenon called “hiatus” slowed down global warming after 1998 (Easterling and Wehner, 2009; Karl et al., 2015), which may have affected the frequency and intensity of HTEs (Donat et al., 2013). Spatially, “warming holes” were revealed in the southeastern United States (Donat et al., 2013; Meehl et al., 2012) and central China (Pan et al., 2013) that showed cooling trends in the summer mean temperature in the second half of the 20th century. Complicated spatial patterns and temporal trends of HTEs were therefore expected with the combination of global warming, urban heat islands, hiatus, and the warming hole.
HTEs are attracting increasing attention in China; however, different conclusions have been reached regarding HTEs’ variations over space and time (Ding et al., 2010; Pan et al., 2013; Sun et al., 2014). For example, Wang et al. (2014b) showed an increasing trend in both frequency and intensity of HTEs in northern China; in contrast, a decreasing trend of HTEs was found both in northern China (Zhang et al., 2004) and throughout China (Zhai and Pan, 2003) during 1951-1999. Wang et al. (2014b) concluded that HTEs had different temporal phases, e.g., high frequency in the 1960s, low frequency in the 1970s and 1980s, and high frequency in the 1990s and 2000s. However, different temporal modes were found in other regions, e.g., northwestern China (Ding et al., 2010), and Three Gorges area (Deng et al., 2012). Thus, contrasting conclusions exist regarding the spatial distribution and temporal change of HTEs.
These differences were mainly caused by the different standards used for defining an HTE. Previous studies used both the 90th percentile of the daily maximum temperature (Piao et al., 2010; Wang et al., 2014b) and 35°C (Ding et al., 2010; Sun et al., 2014; Zhai and Pan, 2003; Zhang et al., 2004) as the threshold for an HTE. According to Zhang et al. (2011), percentile-based temperature indices can ensure an adequate sample size for statistical analyses but are likely to only reflect “moderate extremes”; moreover, such indices are subject to sampling uncertainty and result in spatial inconsistency. In contrast, absolute indices may be more suitable for impact analyses and regional comparison (Zhang et al., 2011). Absolute indices are, therefore, necessary to be employed for understanding the possible impacts and regional variations of HTEs in China (Deng et al., 2011). However, the value of 35°C has been used as a sole threshold of HTE in previous studies in China (Ding et al., 2010; Liu et al., 2015; Sun et al., 2014; Zhai and Pan, 2003; Zhang et al., 2004).
As mentioned above, three shortcomings still exist against a comprehensive understanding of HTEs in China, despite the merits of recent studies. First, existing studies have only paid attention to HTEs exceeding 35°C when using absolute indices of HTEs; multi-threshold HTEs have not yet been examined. Second, few studies have investigated both the frequency and intensity of HTEs. Third, a knowledge gap still exists in the patterns and trends of HTEs in the context of asymmetric warming (e.g., “warming hole” and “hiatus”). The present paper aims to overcome these shortcomings through examining the spatiotemporal patterns of HTEs’ frequency and intensity across China during 1961-2014 in the context of asymmetric warming. First, it develops indices of intensity and frequency of multi-threshold HTEs and investigates spatial patterns in these indices in stations across China. Second, it analyzes the magnitude and significance of trends in these indices through the weighted Sen’s slope and Mann-Kendell (MK) test, respectively. Third, it produces time series of those HTE indices throughout China and in representative regions through the area-weighted average and examines the possible temporal asymmetries in those HTE indices via the locally weighted regression (LOESS).

2 Data and indices

2.1 Meteorological dataset

The daily-maximum surface-air-temperature dataset during 1961-2014 was provided by the National Climate Center (NCC) of the China Meteorological Administration (CMA). This dataset has gone through the strict quality control procedures and has also been widely used in studying climate changes in China (Li et al., 2015; Shi et al., 2016). Only the daily maximum temperature of summer, defined as June-August, was employed because HTEs occurred very rarely in other seasons. To avoid bias in trend analyses due to missing data and enhance the temporal consistency in time series of daily temperature, 260 stations that had one or more missing records in the summer dataset of daily maximum temperature during 1961-2014 were excluded. The final dataset covered 494 stations, as shown in Figure 1.
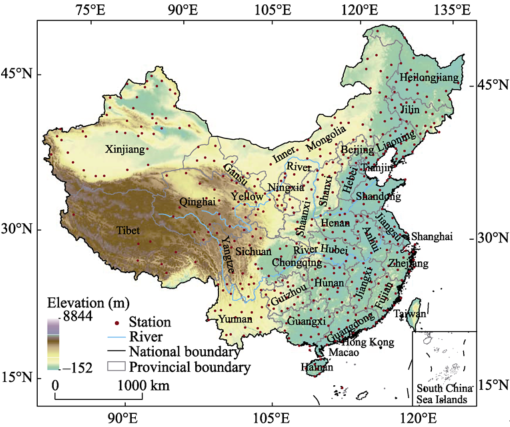
Figure 1 Distribution of the meteorological stations, main rivers, elevation, and provincial boundaries of China

2.2 High-temperature indices

High-temperature indices were developed according to the standards of heat-warning alerts designed by the China Meteorological Administration (CMA). Three-grade warning alerts are announced by NWS based on 24-hour temperature forecasts when the maximum temperature is expected to reach 35°C (yellow alert), 37°C (orange alert), and 40°C (red alert). With the alerts come a series of corresponding responses, e.g., a reduction in outdoor activities; protection to outdoor workers; assistance to infants, disabled, and elders; and protection to critical facilities. Accordingly, this study defined HTEs of three grades based on the 24-hour maximum temperature. HTEs was named HTE35, HTE37, and HTE40 when the 24-hour maximum temperature reached 35°C, 37°C, and 40°C, respectively. HTEs’ frequencies (HTEf) and intensities (HTEi) were calculated for each station by using the following equations:
$$HTEf(j,k)=\sum^n_{i=1}logical(t_{i,j}-S_k)\ \ (1)$$
$$ HTEi(j,k)=\sum^n_{i=1} (t_{i,j}-S_k)/HTEf(j,k)\ \ (2)$$
where HTEf(j,k) and HTEi(j,k) refer to the frequency and intensity in the year j for grade-k HTE, respectively; i and j indicate date and year, respectively; ti,j is the maximum temperature for date i in year j; k indicates three HTE grades corresponding to the thresholds for HTEs, Sk, namely 35°C, 37°C, and 40°C; logical (ti,j - Sk) is 0 when ti,j<Sk or 1 otherwise. On this basis, six HTE indices were developed as the three-grade HTE’s frequencies—HTE f35, HTE f37, and HTE f40—and intensities—HTE i35, HTE i37, and HTE i40.

3 Methodology

This study investigated trends in the frequencies and intensities of HTEs at two levels, namely station level and regional level. First, it assessed the station-level trends in indices and corresponding significance through the weighted Thiel-Sen’s slope (Wu et al., 2016) and Mann-Kendall (MK) test (Kendall, 1975; Mann, 1945). Second, three representative regions are selected based on the station-level occurrence and trends in both indices and the biophysical zonation of China and then produced regional time series of both indices by using the grid-area weighted average (GAWA) method (Jones and Hulme, 1996). Additionally, the temporal characteristics of these time series were examined using a robust locally weighted regression (LOESS) (Cleveland, 1979).

3.1 Trend analysis

3.1.1 Sen’s slope estimator
The Thiel-Sen’s slope is a nonparametric method that estimates the sign and magnitude of a trend in a time series (Li et al., 2015). It does not require samples to follow a specific distribution and can perform well even when there are a few anomalous values (Alexander et al., 2006; Sen, 1968). It has been widely applied as an effective method to evaluate trends in extreme-climate indices (Alexander et al., 2006; Donat et al., 2013; Peterson et al., 2008). This method first calculates the slope between any two points in the time series (X=x1, ... xj, … xk, …, xn) as follows:
Sjk = (xj - xk) / (j - k) (3)
where Sjk is the slope between data points xj and xk; j-k represents the temporal length between data points xj and xk (j>k). In this manner, this method produces a series of Sjk. It then calculates the median of the series of Sjk as the Sen’s slope estimator of the original time series X.
However, this method can be problematic when many ties exist in the data, i.e., when xj=xk, yielding many slopes of zero. This could occur in count-based data (e.g., HTEs’ frequency and intensity variables) or areas where many observations were zero. In these cases, the Thiel-Sen’s slope could be zero even when other methods, e.g., the Mann-Kendall test, detect a statistically significant non-zero trend. In order to counter this problem, Wu et al. (2016) introduced a weighted-average Sen’s slope estimator based on the assumption that pairs of samples with greater differences in x-coordinates (years) are more likely to have an accurate slope and, therefore, should receive a greater weight (Sievers, 1978). Therefore, the Thiel-Sen slope was rectified by a weight for all Sjk to generate an average estimator for the long-term trend of the time series (Wu et al., 2016). The weighted trend (ws) is defined as follows:
$$ws=\sum w_{jk}\times S_{jk}\ \ (4)$$
where
$$w_{jk}=\frac{(x_j-x_k)^2}{\sum (x_j-x_k)^2} \ \ (5)$$
3.1.2 MK test
The MK test is a non-parametric method that can reveal the significance of a trend in time series (Kendall, 1975; Mann, 1945). As a method robust to anomalies, it has been widely applied in hydro-meteorological time series (Alexander et al., 2006; Donat et al., 2013; Peterson et al., 2008). In this method, the MK Z statistic follows a standard normal distribution and can indicate the significance of a trend (Wang and Swail, 2001). In this study, a significance level of 5% (the absolute value of Z≥1.96) was used to determine the significance of a trend for a single station against the null hypothesis that no significant trend exists in the station’s times series.
3.1.3 Serial correlation
According to previous studies (Wang and Swail, 2001), climatic data are somehow correlated in time. Therefore, the MK test and Sen’s slope estimator encounter a problem in detecting a significant trend in serially correlated data (Alexander et al., 2006; Peterson et al., 2008). Autocorrelation existed for stations with HTE f35 (39.7%), HTE i35 (44.7%), HTE f37 (28.5%), HTE i37 (33.6%), HTE f40 (4.2%), and HTE i40 (6.7%). Thus, pre-whitening was applied before the MK test and weighted Sen’s slope estimator to these time series of HTE indices for removing serial correlation. Detailed information on the pre-whitening procedure can be found in Wang and Swail (2001).

3.2 High-temperature time series

The regional time series of HTEs were computed using the grid-area weighted method (Jones and Hulme, 1996). This method is simple and reliable for estimating regional time series based on point datasets (e.g., station-based HTEs) and has been widely used in regional time series analyses (Li et al., 2015). It first calculates the simple average of data in stations within a grid (e.g., 2° by 2° grid) for a given year. It then generates an area-weighted average of all grid-simple averages as the regional value for the given year (Li et al., 2015). The calculation is as follows:
$$X_k=\frac{\sum^m_{i=1}w_i\times X_{ik}}{\sum^m_{i=1}w_i}=\frac{\sum^m_{i=1}cos(lati)\times X_{ik}}{\sum^m_{i=1}cos(lati)}\ \ (6)$$
where Xk represents the regional average at a given year k; wi is the weight for grid i that is represented by cosine value of the central latitude of grid i—cos(lati); Xik is the simple average of the data in stations within grid i.

3.3 Local weighted regression

In order to show decadal or longer-time-scale variations and trends, we used a robust locally weighted regression algorithm (LOESS) (Cleveland, 1979). The LOESS does not require the specification of a function to fit a model. Hence, no assumptions need to be made about the distribution of data, which is often problematic with daily climate data. The LOESS has been proved to be a good choice for reducing the influence of anomalous values on the trend, and it allows for a temporal-explicit trend curve (Peterson et al., 2008).

4 Results

4.1 Spatial distributions of HTE frequency and intensity

The three HTEs varied over space in both frequency and intensity (Figure 2). The HTEs were low in both frequency and intensity for all the three types in the mountainous and elevated southwest China (Tibet, Qinghai, west Sichuan, and Yunnan), except for a few stations. This region was, therefore, excluded from further analyses in this paper. In contrast, other regions had much higher HTEs, and the corresponding magnitudes were much greater. However, clear variations occurred in those regions as well.
HTE35 occurred in 82% of the surveyed stations (403/494) and with a frequency greater than once per year in 58% of the stations (286/494) (Figure 2a). In the belt between Gansu and Heilongjiang, the annual HTE35 frequencies were mostly less than 3 per year. In northwest (mainly Xinjiang) and southeast China, HTE35s occurred frequently. Here, the frequencies mostly ranged from 12 to 24 per year, while dozens of stations in the mid-lower reaches of the Yangtze River and Xinjiang had 24 or more HTE35s per year, among which seven stations had 36 or more HTE35s per year. The HTE35 intensity had different spatial patterns from that of HTE35 frequencies (Figure 2b). Most stations that experienced HTE35s had an average intensity of 36.0-36.5°C. The stations with average intensities less than 36°C were mainly distributed in northeast China, the upper-middle reaches of the Yellow River, the middle reaches of the Yangtze River, and eastern and southern coastal regions. The stations with average intensities greater than 37°C were located in Xinjiang and the mid-lower reaches of the Yangtze River.
The distribution of HTE37s is significantly less than that of HTE35s (Figure 2c). HTE37s occurred in 71% (349/494) of all the stations, two thirds of which had frequencies less than 3 per year. The stations with 3-6 HTE37s annually were distributed in the lower reaches of the Yellow River, mid-lower reaches of the Yangtze River, and Xinjiang. The stations with more than 6 HTE37s per year were mainly distributed in Xinjiang and the mid-lower reaches of the Yangtze River; two stations in Xinjiang had more than 24 HTE37s per year. The average intensity of HTE37s mainly ranges from 37.0°C to 38.5°C (Figure 2d). There were approximately half of the stations to the north of the Yangtze River had average intensities of 38.0-39.0°C; while the average intensity mainly ranged from 37.0°C to 38.0°C for stations in the reaches of the Yangtze River and to its south. Only about 37% (181/494) of the stations experienced HTE40s, and they were mainly distributed in Xinjiang and the mid-lower reaches of the Yellow River and Yangtze River (Figure 2e). Most of these stations had less than 3 HTE40s per year, while two stations in Xinjiang experienced more than 3 HTE40s annually. Similar to the intensities of HTE37s, stations that had higher average intensities of HTE40s (e.g. >41°C) were mainly located in northern China, e.g. Xinjiang, Gansu, Shanxi, Henan, Hebei, Liaoning, and Jilin (Figure 2f).
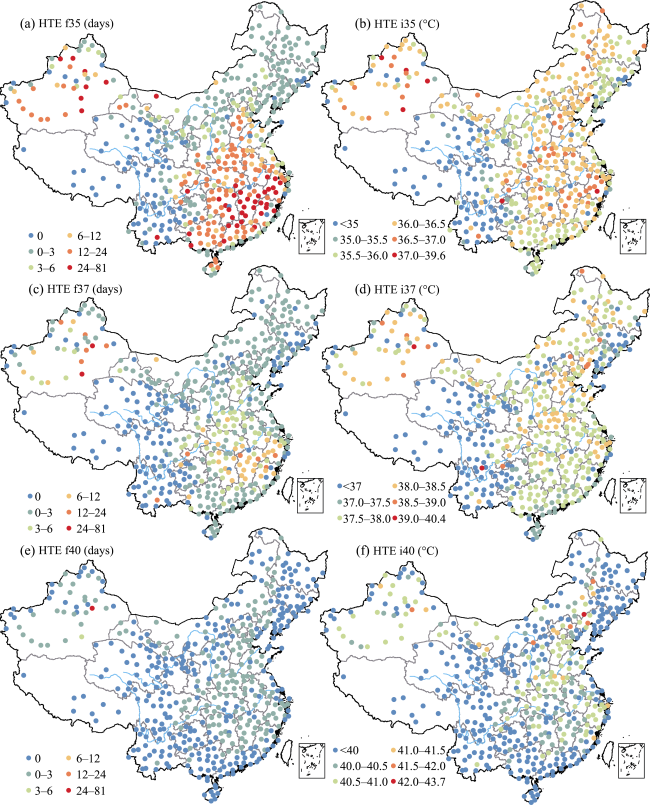
Figure 2 Annual frequencies (a, c, e) and mean intensities (b, d, f) during 1961-2014 of HTE35, HTE37, and HTE40

4.2 Trends in HTE frequency and intensity

Spatially varied trends were observed in annual frequency and mean intensity of the three-threshold HTEs during 1961-2014 (Figure 3). Overall, stations in southwest China did not show observable trends in HTE frequency or intensity for all the three-level HTEs. Most stations showed increasing trends in both HTE frequency and intensity while declining trends were mainly observed in the mid-lower reaches of the Yellow River.
HTE35 increased in frequency and intensity for most stations that witnessed HTE35 (Figures 3a and 3b). The frequency of HTE35 increased at 323 stations (65% of all stations) and its intensity increased at 296 stations (60% of all stations), among which 271 stations (55% of all stations) showed increasing trends in both frequency and intensity. Further, significant increasing trends (p<0.05) were detected in frequency at 95 stations (19% of all stations) in intensity at 69 stations (14% of all stations), and in both frequency and intensity at 55 stations (11% of all stations). The strongest increasing trends in HTE35 frequency and intensity occurred in Xinjiang, Inner Mongolia, Yangtze River Delta, and Pearl River Delta. Their rates of increase in frequency and intensity can be as high as 5.5 days/10a and 0.24°C/10a, respectively. In contrast, decreasing trends in HTE35 frequency and intensity were mainly detected in the mid-lower reaches of the Yellow River, and the distribution was relatively limited. HTE35 decreased in frequency at 80 stations (16% of all stations) and in intensity at 107 stations (22% of all stations), among which 55 stations (or 11% all stations) showed decreasing trends in both frequency and intensity. Only two stations had significant decreasing trends of HTE35 in both frequency and intensity.
HTE37 showed a spatial pattern similar to that of HTE35 in both frequency and intensity. Increasing trends were detected to the north of the Yellow river and to the south of the Yangtze River, while decreasing trends were mainly found in the mid-lower reaches of the Yellow River. The strongest increasing trends of HTE37 in frequency and intensity were detected in Xinjiang, Inner Mongolia, Yangtze River Delta, and Pearl River Delta. Their rates of increase in frequency and intensity were as high as 4.17 days/10a and 0.23°C/10a, respectively. Increasing trends were detected at 266 stations (54%) in HTE37 frequency, at 265 stations (54%) in HTE37 intensity, and at 239 stations in both indices. Among these stations, significant increasing trends were detected at 47 stations in frequency, at 33 stations in intensity, and at 29 stations in both indices (p<0.05). In contrast, decreasing trends were detected only at 83 stations in frequency, at 84 stations in intensity, and at 57 stations in both indices. Among them, significant trends were detected only at four stations in frequency, at two stations in intensity, and at two stations in both indices.
The HTE40 increased at 123 stations for frequency, at 126 stations for intensity, and at 115 stations for both indices. These stations were mainly located to the north of the Yellow River and to the south of the Yangtze River. Among them, significant increasing trends were detected at 9 stations in frequency, at 11 stations in intensity, and at 7 stations in both indices (p<0.05). The strongest increasing trends were 1.15 days per decade for frequency and 0.17°C per decade for intensity. Decreasing trends were detected at 58 stations for frequency, at 55 stations for intensity, and at 47 stations for both indices. These stations were still mainly located in the mid-lower reaches of the Yellow River, but the extent shrank remarkably compared with those of HTE35 and HTE37. Among them, significant decreasing trends were detected at one station in both frequency and intensity (p<0.05). The strongest decreasing trends were -0.34 days per decade for frequency and -0.94°C per decade for intensity.
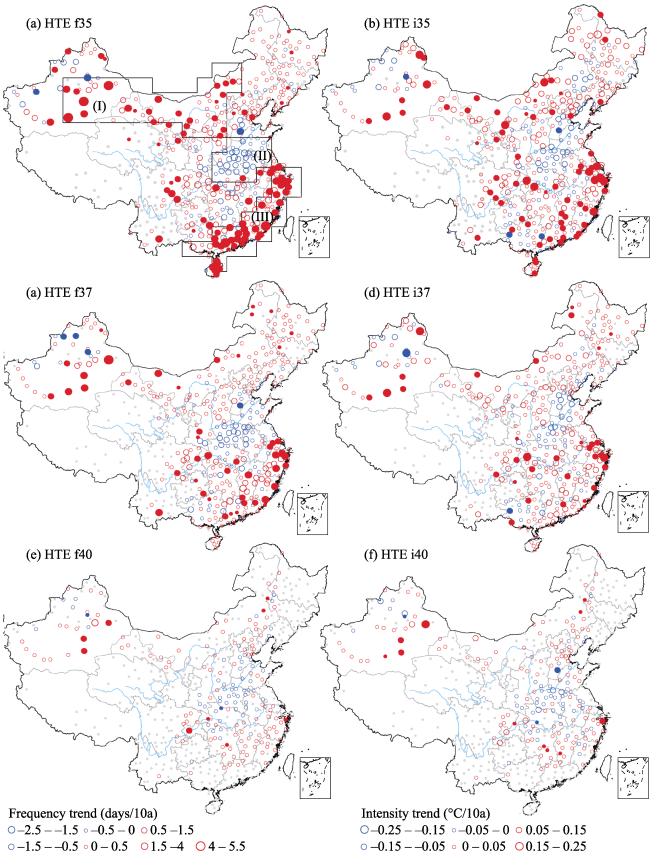
Figure 3 Trends in HTE frequency (a, c, e; days/10a) and intensity (b, d, f; °C/10a) during 1961-2014 (Red circles = increasing trends; blue circles = decreasing trends; filled circles = significant trends (p<0.05); gray dots = no trend or no data; three representative regions: I, northern China; II, central China; and III, southeastern coast).

4.3 Time series of frequency and intensity of HTEs

Regional time series were investigated for entire China and three selected regions. The three representative regions were northern China (Region I), central China (Region II), and southeastern coast (Region III) (Figure 3a). They were all typical regions according to the bio-physical zonation of China; moreover, they were relatively homogeneous in occurrence and trends of HTEs. HTE35, HTE37, and HTE40 showed overall increasing trends in both frequency and intensity during 1961-2014 in northern China, southeast China, and entire China, while the HTEs decreased in central China (Figures 4 and 5). However, the LOESS curves largely displayed three-phase characteristics in HTEs; the phases were 1961-1980, the 1980s, and 1990-2014. To increase the reliability of statistical analyses, the linear slopes of frequency and intensity in four phases are given in Tables 1 and 2: 1961-1980, 1961-1990, 1990-2014, and 1961-2014.
At the national scale, HTE35, HTE37, and HTE40 increased in both frequency and intensity (Figures 4a, 4b, 4c, 5a, 5b and 5c). The overall linear slopes of frequency and intensity were 0.425 day/10a (p<0.05) and 0.022°C/10a (p<0.1) for HTE35s and 0.24 day/10a (p<0.05) and 0.013°C/10a for HTE37. However, the changes in frequency and in intensity of both HTE35 and HTE37 (Figures 4a, 4b, 5a and 5b) were not homogeneous over time. Their LOESS curves were all “U” shaped and presented three stages: before 1980, the 1980s, and after 1990. During 1961-1980, both the frequency and intensity of HTE35 and HTE37 showed decreasing trends; from the period 1961-1980 to the period 1961-1990, the magnitude of those decreasing trends decreased; during 1990-2014, both the trends were positive (Tables 1 and 2). In contrast, HTE40 showed a slight increasing trend in frequency and intensity. HTE40 increased in both frequency and intensity consistently over the entire period.
In addition to the asymmetrical characteristics of the trends of HTEs over time, they also varied over space. The frequency and intensity of HTE35s increased by 1.04 day/10a (p<0.01) and 0.04°C/10a (p<0.05) in northern China, and by 1.34 day/10a (p<0.01) and 0.03°C/10a (p<0.05) in southeastern China (Tables 1 and 2). In contrast, they decreased by -0.59 day/10a and -0.03°C/10a in central China (Region II). In the three regions, the LOESS curves were all asymmetrical before and after the 1980s (Figures 4 and 5). The frequency of HTE35 showed no clear trend in northern China and southeastern China during 1961-1980, whilst increasing trends were observed during 1961-1990, and the trends were enhanced during 1990-2014 (Figures 4d and 4g). The intensity of HTE35 showed no clear trend and a decreasing trend in northern China (Region I) and southeastern coast (Region III) before 1990, respectively, whilst it showed increasing trends in both regions during 1990-2014 (Figures 5d and 5g). In central China, the frequency and intensity of HTE35 showed strong decreasing trends during 1961-1980, moderate decreasing trends during 1961-1990, and strong increasing trends during 1990-2014 (Figures 4j and 5j).
The frequency and intensity of HTE37 also varied over space and showed temporal asymmetry. They increased by 0.378 day/10a and 0.016°C/10a in northern China (Region I), and by 0.5 day/10a (p<0.05) and 0.025°C/10a (p<0.1) in the southeastern coast region (Region III) (Tables 1 and 2). In contrast, they decreased by -0.423 day/10a (p<0.01) and -0.004°C/10a in central China (Region II). In the three regions, the LOESS curves were all asymmetrical, and three phrases were detected (Figures 4e, 4h, 4k, 5e, 5h and 5k). During 1961-1980, the frequency and intensity of HTE37 decreased in all the three regions, which are consistent with the trends for entire China (Tables 1 and 2). From the period 1961-1980 to 1961-1990, the decreasing trends in the frequency of HTE37 clearly dropped in magnitude in northern China (Region I) and central China (Region II), while it changed into an increasing trend in southeastern coast (Region III) (Table 1); the decreasing trends in intensity were largely constant in northern China and central China, while it changed into an increasing trend in southeastern China (Table 2). During 1990-2014, both the frequency and intensity of HTE37 increased in the three regions, which are consistent with the trends for entire China (Tables 1 and 2).
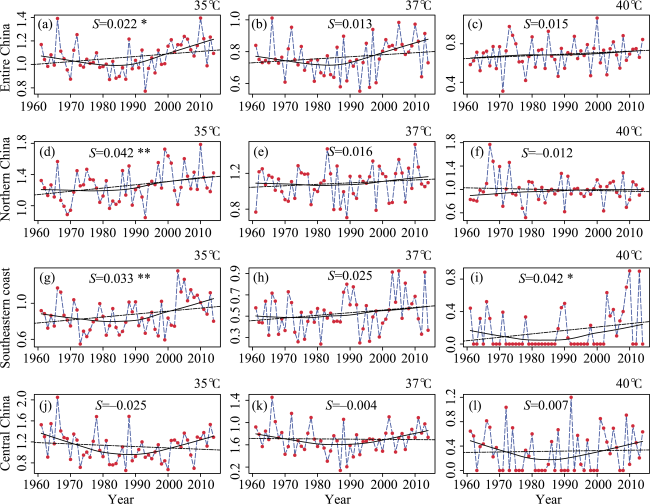
Figure 4 Time series of HTE frequency during 1961-2014 in entire China and three regions (S indicates the magnitude of a trend (days/10a); the trend significance is marked as * p<0.1, ** p<0.05, and *** p<0.01)
HTE40 decreased slightly in frequency for all three regions, while it had a weak decreasing trend in northern China (Region I), a significant increasing trend in southeastern coast (region III), and a weak increasing trend in central China (Region II) (Tables 1 and 2). Only northern China (Region I) had HTE40s every year in this period (Figure 4f); in contrast, neither central China (Region II) nor Southeastern Coast China (Region III) had continuous HTE40s over the 54 years (Figures 4i and 4l). Nevertheless, the LOESS curves for HTE40 were analogous to those for HTE35 and HTE37, showing asymmetry (Figures 4f, 4i, and 4l, 5f, 5i and 5l). During 1961-1980, both the frequency and intensity of HTE40 decreased in the three selected regions, while the magnitude of these decreasing trends significantly dropped from the period of 1961-1980 to 1961-1990 (Tables 1 and 2). During 1990-2014, both the frequency and intensity of HTE40 increased in the three regions, which are consistent with the trends for entire China.
Table 1 Trends of HTE frequency during 1961-2014 in entire China and representative regions (days/10a)
1961-1980 1961-1990 1990-2014 1961-2014 1961-1980 1961-1990 1990-2014 1961-2014
Entire China Southeastern Coast
HTEf35 -1.455* -0.653 1.833*** 0.425** HTEf35 -0.888 0.804 2.768** 1.345***
HTEf37 -0.665 -0.321 0.947** 0.240** HTEf37 -0.426 0.125 1.227 0.500**
HTEf40 0.018 0.175 0.105 0.033 HTEf40 -1.068 -0.571 0.370 -0.033
Northern China Central China
HTEf35 -0.078 0.020 2.059*** 1.043*** HTEf35 -5.326** -4.012*** 2.068 -0.595
HTEf37 -1.195 -0.357 1.25* 0.378 HTEf37 -2.746** -1.742*** 0.933* -0.423*
HTEf40 -2.492 -0.684 1.451 -0.386 HTEf40 -0.503 -0.345* 0.386** -0.021

Note: The trend significance is marked as * p<0.1, ** p<0.05, and *** p<0.01.

Table 2 Trends of HTE intensity during 1961-2014 in entire China and representative regions (°C/10a)
1961-1980 1961-1990 1990-2014 1961-2014 1961-1980 1961-1990 1990-2014 1961-2014
Entire China Southeastern Coast
HTEi35 -0.052 -0.048* 0.099*** 0.022* HTEi35 -0.061 -0.02 0.116** 0.033**
HTEi37 -0.041 -0.036* 0.061* 0.013 HTEi37 -0.037 0.021 0.049 0.025
HTEi40 0.046 0.005 0.019 0.015 HTEi40 -0.105 -0.013 0.162** 0.042*
Northern China Central China
HTEi35 0.011 -0.008 0.071 0.042** HTEi35 -0.201 -0.164** 0.152** -0.025
HTEi37 -0.013 -0.018 0.041 0.016 HTEi37 -0.102 -0.131** 0.132*** -0.004
HTEi40 -0.035 -0.049 0.021 -0.012 HTEi40 -0.135 -0.133** 0.093 0.007

Note: The trend significance is marked as * p<0.1, ** p<0.05, and *** p<0.01.

Figure 5 Time series of HTE intensity during 1961-2014 in entire China and three regions (S indicates the magnitude of a trend (°C/10a); the trend significance is marked as * p<0.1, ** p<0.05, and *** p<0.01)

5 Discussion

5.1 Spatial heterogeneity in frequency and intensity of HTEs and their trends

The present study investigated both spatial patterns and temporal trends in the frequency and intensity of HTE35, HTE37, and HTE40. Overall, the frequencies of HTEs were much higher in southeast and northwest China than in northern China; however, the HTEs in northern China had relatively high intensities, particularly HTE37s and HTE40s. The trends in both frequency and intensity largely coincided over space. In north and southeastern China, HTEs increased significantly in both frequency and intensity. In central China, a warming hole was found in the frequencies and intensities of HTEs. These results thus extend the understanding of patterns and trends of HTEs in previous studies, which mainly investigated the changes in frequencies of HTE35 (Ding et al., 2010; Sun et al., 2014; Zhai and Pan, 2003; Zhang et al., 2004) and in the 90th-percentile temperature (Piao et al., 2010; Wang et al., 2014b).

5.2 Three phases in HTEs’ trends

Although clear spatial variations were found in the patterns and overall trends of HTEs, the HTEs overwhelmingly presented three-phase characteristics in all the three representative regions and throughout China; the phases were 1961-1979, 1980-1989, and 1990-2014. All the three HTEs overwhelmingly decreased in both frequency and intensity during 1961-1979 throughout China, and those decreasing trends dropped in magnitude or changed to increasing trends during 1961-1990. In contrast, all the three HTEs increased strongly in both frequency and intensity during 1990-2014 across China. Recently, several studies argued that global warming has slowed down since 1998, and this phenomenon was termed “hiatus” (Easterling and Wehner, 2009; Karl et al., 2015). Moreover, Li et al. (2015) demonstrated that China is experiencing a hiatus. However, HTEs have been increasing since 1990 without any pause across China, as indicated by the above results. This phenomenon may indicate that the slowdown in global warming (hiatus) does not decrease HTEs; this finding agrees with other studies (Donat et al., 2013; Seneviratne et al., 2014; Sillmann et al., 2014) that argued that no pause exists in the increase of HTES.
Additionally, strong increases in the frequency and intensity of HTEs were also detected during 1990-2014 even in central China. With the monotonic trends in this study indicated by the MK test and Sen’s slope estimator, this region had decreasing trends (mainly insignificant) in both the frequency and intensity of HTEs, which was also in agreement with previous studies (Pan et al., 2013). From this perspective, central China had been called a “warming hole” region; such a phenomenon had also been found in other countries, e.g., USA (Donat et al., 2013; Meehl et al., 2012). However, the regional time series indicated obvious temporal asymmetries in the trends in both frequency and intensity of HTEs in central China. The time series of frequency and intensity of HTEs were all “U” shaped and presented three stages: before 1980, the 1980s, and after 1990. The three-phase characteristics and strong increasing trends in HTEs during the hiatus period have not yet reported in “warming hole” areas. This phenomenon should be paid further attention, and further studies are needed to reveal the mechanism underlying this phenomenon.

5.3 Potential impacts and possible causes of the recently increasing trends in HTEs

The strong increases in both the frequency and intensity of HTEs should be paid further attention as this phenomenon may cause various impacts on human society and the ecosystem (Deng et al., 2011; Reichstein et al., 2013). As a semiarid region, northern China experienced clear deforestation and desertification in the past decades (Liu and Wang, 2011), which would probably enhance HTEs via a decrease in the evaporative cooling effect and increase in incoming shortwave solar radiation (Charney, 1975). The enhanced HTEs, in turn, may exacerbate the degradation of the ecosystem (Reichstein et al., 2013). Such feedback would also probably have negative impacts on water resources and agricultural productivity (Piao et al., 2010). In southeastern China, the strongest increasing trends in the frequency and intensity of HTEs spatially coincided with the most rapidly urbanizing areas. This region has been experiencing rapid urbanization since the implementation of reform and opening up policy in 1978 (Du et al., 2015; Small and Elvidge, 2013). The urban heat islands (UHI) effect has been argued to enhance HTEs in this region (Sun et al., 2014). Additionally, studies also found that this region has a significant increasing trend in precipitation (Shi et al., 2014). The coincidence of increases in HTEs and humidity in such rapidly urbanizing and densely populated areas would likely cause more severe impacts on society, ranging from human health (Xie et al., 2015), energy consumption (Davis and Gertler, 2015), labor productivity (Zander et al., 2015), to economic growth (Dell et al., 2014).
However, the mechanism for the three-phase phenomenon in HTEs remains unclear. Future studies should focus on the transition mechanisms. A probable mechanism is the enhanced UHI associated with accelerated urbanization across China (Sun et al., 2014). Possible mechanisms also include changes in atmospheric circulation (Coumou et al., 2015), El Niño/Southern Oscillation (Wang et al., 2014a), and planetary waves (Cohen et al., 2014).
Additionally, inhomogeneity may influence the reliability of the results and findings. The surface air temperature dataset used in this study was obtained from the China Meteorological Data Sharing Service System. Some of the meteorological stations have been relocated or their surrounding condition has been changed during rapid urbanization, which may cause the data inhomogeneity. However, the quality of the meteorological dataset was firmly controlled before its release for public use through procedures including the climatological limit check, the station or regional extremes check, the internal consistency check, and the temporal and spatial consistency checks, etc. (Zhang et al., 2011). Following previous studies (e.g., Zhai and Pan, 2003; Zhang et al., 2004, 2011; Liu and Wang, 2011), we did not apply further homogeneity adjustment to this dataset. Although previous adjustment to the temperature dataset before its release can ensure the reliability of our results to a certain extent, we still think benchmarking of methods is needed in future studies for a strict data homogenization (Li et al., 2015).

6 Conclusions

This paper presented the spatial patterns and temporal trends in the frequency and intensity of HTEs at 494 stations across China during 1961-2014. HTEs happened throughout China except for the mountainous and elevated southwestern part (Tibet, Qinghai, west Sichuan and Yunnan). HTE35, HTE37, and HTE40 respectively occurred in 82%, 71%, and 37% of the surveyed stations, with an average frequency of more than once per year at 57.89%, 34.82%, and 2.43% of the stations. Overall, the frequency of HTEs was much higher in southeast and northwest China than in northern China; however, HTEs in northern China had relatively high intensities, particularly HTE37s and HTE40s. China is therefore prone to HTEs, particularly in the humid southeastern region and the semiarid/arid areas in northwest China.
Moreover, the impacts of HTEs would likely exacerbate as the increasing trends were found in both frequency and intensity of the HTEs. Frequency and intensity of all three HTEs increased during 1961-2014 for China as a whole, with a trend ranging from 0.425 to 0.033 days/10a for frequency and from 0.022 to 0.015 °C/10a for intensity. The increasing trends in HTE35 and HTE37 were stronger for southeastern coast and northern China than the overall trend for China. For China and the representative regions, the fastest increases in both frequency and intensity occurred during 1990-2014; in contrast, both frequency and intensity of HTEs overwhelmingly decreased during 1961-1990, which made the time series of HTEs were “U-shaped”. Such increasing trends would likely increase drought risk and challenge the health and sustainability of both human society and ecosystem, particularly because the strongest increasing trends were detected in southeastern China with rapid urbanization and in the arid/semiarid northern China. Further studies are needed to elucidate the exact mechanism underlying the HTEs and their changes.
Additionally, a “warming hole” was found in central China, which showed decreasing trends in both frequency and intensity of HTEs during 1961-2014. However, all the three HTEs increased strongly in both frequency and intensity during 1990-2014 in this region; in contrast, both frequency and intensity of HTEs decreased significantly during 1961-1990. The “warming hole” region in 1961-1990 changed into an area that experienced rapid increase in HTEs during 1990-2014. Such a finding implied that temporal scale is vital for understanding the trends in HTEs and the existence of the “warming hole” phenomena. A time-series analysis may be also necessary for other “warming hole” regions (Donat et al., 2013). So this “warming hole” phenomenon needs to be further discussed and explored in the future.

The authors have declared that no competing interests exist.

[1]
Alexander L V, Zhang X, Peterson T Cet al., 2006. Global observed changes in daily climate extremes of temperature and precipitation. Journal of Geophysical Research: Atmospheres, 111(D5): D05109.

[2]
Charney J G, 1975. Dynamics of deserts and drought in the Sahel.Quarterly Journal of the Royal Meteorological Society, 101(428): 193-202.Abstract It is suggested that the high albedo of a desert contributes to a net radiative heat loss relative to its surroundings and that the resultant horizontal temperature gradients induce a frictionally controlled circulation which imports heat aloft and maintains thermal equilibrium through sinking motion and adiabatic compression. In the subtropics this sinking motion is superimposed on the descending branch of the mean Hadley circulation but is more intense. Thus the desert feeds back upon itself in an important manner. If one takes into account the biosphere, this feedback mechanism could conceivably lead to instabilities or metastabilities in desert border regions. It is argued that a reduction of vegetation, with consequent increase in albedo, in the Sahel region at the southern margin of the Sahara would cause sinking motion, additional drying, and would therefore perpetuate the arid conditions. Numerical integrations with the general circulation model of NASA's Goddard Institute for Space Studies appear to substantiate this hypothesis. Increasing the albedo north of the ITCZ from 14% to 35% had the effect of shifting the ITCZ several degrees of latitude south and decreasing the rainfall in the Sahel about 40% during the rainy season.

DOI

[3]
China Meteorological Administration (CMA), 2008. Warning signals: High temperature warning signals were classified into three grades. Beijing: China Meteorological Administration.

[4]
Cleveland W S, 1979. Robust locally weighted regression and smoothing scatterplots.Journal of the American Statistical Association, 74(368): 829-836.

[5]
Cohen J, Screen J A, Furtado J Cet al., 2014. Recent Arctic amplification and extreme mid-latitude weather.Nature Geoscience, 7(9): 627-637.The Arctic region has warmed more than twice as fast as the global average - a phenomenon known as Arctic amplification. The rapid Arctic warming has contributed to dramatic melting of Arctic sea ice and spring snow cover, at a pace greater than that simulated by climate models. These profound changes to the Arctic system have coincided with a period of ostensibly more frequent extreme weather events across the Northern Hemisphere mid-latitudes, including severe winters. The possibility of a link between Arctic change and mid-latitude weather has spurred research activities that reveal three potential dynamical pathways linking Arctic amplification to mid-latitude weather: changes in storm tracks, the jet stream, and planetary waves and their associated energy propagation. Through changes in these key atmospheric features, it is possible, in principle, for sea ice and snow cover to jointly influence mid-latitude weather. However, because of incomplete knowledge of how high-latitude climate change influences these phenomena, combined with sparse and short data records, and imperfect models, large uncertainties regarding the magnitude of such an influence remain. We conclude that improved process understanding, sustained and additional Arctic observations, and better coordinated modelling studies will be needed to advance our understanding of the influences on mid-latitude weather and extreme events.

DOI

[6]
Coumou D, Lehmann J, Beckmann J, 2015. The weakening summer circulation in the Northern Hemisphere mid-latitudes.Science, 348(6232): 324-327.Rapid warming in the Arctic could influence mid-latitude circulation by reducing the poleward temperature gradient. The largest changes are generally expected in autumn or winter, but whether significant changes have occurred is debated. Here we report significant weakening of summer circulation detected in three key dynamical quantities: (i) the zonal-mean zonal wind, (ii) the eddy kinetic energy (EKE), and (iii) the amplitude of fast-moving Rossby waves. Weakening of the zonal wind is explained by a reduction in the poleward temperature gradient. Changes in Rossby waves and EKE are consistent with regression analyses of climate model projections and changes over the seasonal cycle. Monthly heat extremes are associated with low EKE, and thus the observed weakening might have contributed to more persistent heat waves in recent summers.

DOI PMID

[7]
Davis L W, Gertler P J, 2015. Contribution of air conditioning adoption to future energy use under global warming.Proceedings of the National Academy of Sciences, 112(19): 5962-5967.As household incomes rise around the world and global temperatures go up, the use of air conditioning is poised to increase dramatically. Air conditioning growth is expected to be particularly strong in middle-income countries, but direct empirical evidence is scarce. In this paper we use high-quality microdata from Mexico to describe the relationship between temperature, income, and air conditioning. We describe both how electricity consumption increases with temperature given current levels of air conditioning, and how climate and income drive air conditioning adoption decisions. We then combine these estimates with predicted end-of-century temperature changes to forecast future energy consumption. Under conservative assumptions about household income, our model predicts near-universal saturation of air conditioning in all warm areas within just a few decades. Temperature increases contribute to this surge in adoption, but income growth by itself explains most of the increase. What this will mean for electricity consumption and carbon dioxide emissions depends on the pace of technological change. Continued advances in energy efficiency or the development of new cooling technologies could reduce the energy consumption impacts. Similarly, growth in low-carbon electricity generation could mitigate the increases in carbon dioxide emissions. However, the paper illustrates the enormous potential impacts in this sector, highlighting the importance of future research on adaptation and underscoring the urgent need for global action on climate change.

DOI PMID

[8]
Dell M, Jones B F, Olken B A, 2014. What do we learn from the weather? The new climate-economy literature.Journal of Economic Literature, 52(3): 740-798.A rapidly growing body of research applies panel methods to examine how temperature, precipitation, and windstorms influence economic outcomes. These studies focus on changes in weather realizations over time within a given spatial area and demonstrate impacts on agricultural output, industrial output, labor productivity, energy demand, health, conflict, and economic growth, among other outcomes. By harnessing exogenous variation over time within a given spatial unit, these studies help credibly identify (i) the breadth of channels linking weather and the economy, (ii) heterogeneous treatment effects across different types of locations, and (iii) nonlinear effects of weather variables. This paper reviews the new literature with two purposes. First, we summarize recent work, providing a guide to its methodologies, datasets, and findings. Second, we consider applications of the new literature, including insights for the "damage function" within models that seek to assess the potential economic effects of future climate change.

DOI

[9]
Deng H, Zhao F, Zhao X, 2012. Changes of extreme temperature events in Three Gorges area, China.Environmental Earth Sciences, 66(7): 1783-1790.Meteorological data and heat stress indices from 1958 to 2007 in the Three Gorges area were investigated in this study. It is found that there is a (1) mild augmentation of the diurnal temperature range in the region (2) antithetical trends in mean\maximum\minimum temperatures, indicated by warmer winters and slightly cooler summers and (3) declining linear trends of the number of (very) hot days and annual frequencies of (long) heat waves, despite rising frequencies of (very) hot days and annual short heat waves. A U-shape was detected for all the climatic indices, with low values occurring mostly in the 1980s. However, spatial variations exist. Decreasing trends of hot days and frequency of heat waves were more evident in areas like Shapingba, where high annual temperatures were recorded. The finding also suggests a positive impact of the subtropical high on high temperatures and extreme temperature events.

DOI

[10]
Ding T, Qian W, Yan Z, 2010. Changes in hot days and heat waves in China during 1961-2007.International Journal of Climatology, 30(10): 1452-1462.lt;P>Based on the daily maximum temperature (DMT) records at 512 stations during 1961–2007, the geographical patterns and temporal variations of hot days (HDs) and heat waves (HWs, including those persisting for 3–5 days and longer) over mainland China were studied. The HD (and hence HW) was defined in two ways, one by an absolute criterion, DMT > 35 °C, as applied in the nationwide meteorological agencies and another in a relative sense, DMT > the 90th percentile threshold of a local daily temperature distribution around the day. Two centers of high frequencies (over 5 days per year) of the absolute HDs during June–September were found in the regions of Xinjiang and the mid-lower reaches of the Yangtze River. The highest frequencies of the absolute HWs were about 1.5 times per year in the Xinjiang region and to the south of the mid-lower reaches of the Yangtze River. The frequencies of the relative HWs were about 1–1.5 times per year in most of China. The HDs and HWs increased significantly during the studied period in most of China, especially over the southeastern coast and northern China (by over 4 days per decade for relative HDs and 0.4 times per decade for relative HWs), but decreased significantly at some stations in the lower reaches of the Yellow River. Over most of China except northwestern China, the frequency of HDs was high during the 1960s–1970s, low in the 1980s, and high afterwards, with strong interannual variations. A remarkable increasing trend of HDs occurred after the 1990s in all regions. The changes in HDs and HWs were closely related to those in rain days and atmospheric circulation patterns at the interannual and interdecadal scales. Copyright 08 2009 Royal Meteorological Society</P>

DOI

[11]
Donat M G, Alexander L V, Yang Het al., 2013. Global land-based datasets for monitoring climatic extremes.Bulletin of the American Meteorological Society, 94(7): 997-1006.The World Meteorological Organization (WMO) Commission for Climatology (CCl)/CLIVAR/JCOMM Expert Team on Climate Change Detection and Indices (ETCCDI) held a number of regional workshops whose data were used to help create HadEX, the first global land-based, gridded dataset of temperature and precipitation extremes. Experts from ETCCDI developed a new dataset to address the issues of HadEX, using the world's largest repository of daily in situ observations of temperature and precipitation. The resulting dataset was known as GHCNDEX, which was an operationally updated, global land gridded dataset of climate extremes. The experts also demonstrated the application of the dataset for climate change and climate monitoring purposes in addition to assessing some issues regarding uncertainty by comparing the results with existing datasets.

DOI

[12]
Du S, Van Rompaey A, Shi Pet al., 2015. A dual effect of urban expansion on flood risk in the Pearl River Delta (China) revealed by land-use scenarios and direct runoff simulation.Natural Hazards, 77(1): 111-128.Since the late 1970s, the Pearl River Delta (PRD) in China has undergone a rapid transition from an agricultural landscape to a metropolitan area. The rapid urbanization has not only increased the area of impervious surfaces in the central plain; it has displaced farmland to the hilly peripheral areas. The objectives of this study are to: (1) analyze how these changes in land use in the PRD have influenced flood incidence over the past 20years and (2) explore possible changes in flood incidence in the coming two decades. An integrated simulation of the land-use changes and the hydrological processes is employed to investigate the impact of urbanization on the volume of direct runoff. Historical flood records are used for validation. The simulation results indicate that land-use change in the PRD has markedly increased direct runoff over the past two decades. Changes in direct runoff generation and in land use are significantly correlated with historical floods at the county level. These results suggest that the increase in floods stems from the dual effect of urbanization on land use through the expansion of impervious surfaces and the displacement of farmlands to the hilly outskirts. The simulations suggest that the dual effect would continue in a future of business as usual. Stopping farmland replacement would likely reduce the increase in direct runoff generation, and this reduction would be augmented if changes in farmland replacement were combined with compact city development.

DOI

[13]
Easterling D R, Wehner M F, 2009. Is the climate warming or cooling?Geophysical Research Letters, 36(8): L08706.Numerous websites, blogs and articles in the media have claimed that the climate is no longer warming, and is now cooling. Here we show that periods of no trend or even cooling of the globally averaged surface air temperature are found in the last 34 years of the observed record, and in climate model simulations of the 20th and 21st century forced with increasing greenhouse gases. We show that the climate over the 21st century can and likely will produce periods of a decade or two where the globally averaged surface air temperature shows no trend or even slight cooling in the presence of longer-term warming. Copyright 2009 by the American Geophysical Union.

DOI

[14]
Hansen J, Sato M, Ruedy R, 2012. Perception of climate change.Proceedings of the National Academy of Sciences, 109(37): E2415-E2423.

[15]
Hou W, Yu C, Ying Let al., 2014. Climatic characteristics over China in 2013.Meteorologica Monthly, 40(4): 482-493. (in Chinese)In 2013,the mean annual precipitation in China was 653.5 mm,4%higher than normal and slightly less than in 2012.The seasonal precipitation was below normal in winter,but above normal in spring,summer and fall.The annual mean temperature over China was the fourth highest since 1961,0.6 C higher than normal and 0.8 higher than in 2012.Mean temperature was lower than normal in winter,but persistently higher than normal in spring,summer,and fall.In 2013,the winter monsoon in East Asia was stronger than normal and the subtropical high intensity over the Northwest Pacific in summer was weaker clearly;the summer monsoon in the South China Sea broke out earlier but ended later with weak intensity.Besides,the first rainy season in South China began earlier and ended later with a larger amount of precipitation than normal.The beginning of Meiyu in the middle and low reaches of Yangtze River started later and ended earlier with less precipitation than normal.The rainy season in North China began earlier,bringing more precipitation than normal.The beginning of autumnal rain of Huaxi(Western China)started earlier and ended later with a smaller amount of precipitation than normal.The rainy season in Southwest China started earlier and ended later than normal with a small amount of precipitation.In2013,the main meteorological disasters in China were rainstorms,typhoons,heat wave,bringing serious losses to local arias.In general.2013 was a year with moderate meteorological disaster,and the economic losses were serious,hut the dealh toll and disaster-hit areas were fewer in amount.

[16]
IPCC, 2012. Managing the risks of extreme events and disasters to advance climate change adaptation. A Special Report of Working Groups I and II of the Intergovernmental Panel on Climate Change. Cambridge, UK and New York, NY: Cambridge University Press. 582.

[17]
Jones P D, Hulme M, 1996. Calculating regional climatic time series for temperature and precipitation: Methods and illustrations.International Journal of Climatology, 16(4): 361-377.

[18]
Karl T R, Arguez A, Huang Bet al., 2015. Possible artifacts of data biases in the recent global surface warming hiatus.Science, 348(6242): 1469-1472.Much study has been devoted to the possible causes of an apparent decrease in the upward trend of global surface temperatures since 1998, a phenomenon that has been dubbed the global warming "hiatus." Here, we present an updated global surface temperature analysis that reveals that global trends are higher than those reported by the Intergovernmental Panel on Climate Change, especially in recent decades, and that the central estimate for the rate of warming during the first 15 years of the 21st century is at least as great as the last half of the 20th century. These results do not support the notion of a "slowdown" in the increase of global surface temperature.

DOI PMID

[19]
Kendall M, 1975. Rank Correlation Methods. London: Grif.

[20]
Li Q, Yang S, Xu Wet al., 2015. China experiencing the recent warming hiatus.Geophysical Research Letters, 42(3): 889-898.Abstract Based on the homogenized data set, we analyze changes in mean temperature and some extreme temperature indices over China since 1961 and especially during the recent warming hiatus period (1998–2012) in a global average context. The result shows that the decrease of annual mean maximum has contributed most to the decreases in overall mean temperature and in diurnal temperature range (DTR) during the warming hiatus period. In most parts of China except the southwest, the summer mean maximum temperature ( T xS) shows the largest increase, while the winter mean minimum temperature ( T nW) indicates slight cooling trends. These changes have augmented the seasonal cycle and increased the likelihood of extreme warm and cold events. Further analyses reveal that the increases in T xS are significantly correlated with concurrent increases in solar radiation. In southwest China, the annual mean temperature, T xS, T nW, and DTR increased during 1998–2012, possibly related to increased dryness in this region during the hiatus period.

DOI

[21]
Liu G L, Zhang L C, He Bet al., 2015. Temporal changes in extreme high temperature, heat waves and relevant disasters in Nanjing metropolitan region, China.Natural Hazards, 76(2): 1415-1430.The urban heat environment in Nanjing metropolitan region is significantly affected by human activities. The days of high temperature and heat waves became increasingly obvious. Therefore, this paper aimed to reveal the temporal changes in high temperature and heat waves and analyze the relevant disasters. The results showed that the duration and average high temperature were both increasing during 1951-2013. Days of heat waves were mainly concentrated in August. The longest duration of extreme heat was in 2013 lasting 9days. The major issues caused by high temperature and heat waves were energy consumption, power shortage, human health and human habitat deterioration. Land use change driven by human activities altered the underlying surface and accelerated urban heat island effect. These views provide scientific evidence for assisting urban planning and industrial restructuring in the future.

DOI

[22]
Liu S, Wang T, 2011. Climate change and local adaptation strategies in the middle Inner Mongolia, northern China.Environmental Earth Sciences, 66(5): 1449-1458.According to records of 17 meteorological stations distributed in the study area, climate change of the middle Inner Mongolia in northern China was analyzed in this paper. Based on SPOT VGT data, combined with field investigation, local vegetation change was detected in the last 1002years. The results show that annual mean air temperature obviously rose, while precipitation slightly decreased in fluctuation in the study area during the last 5002years. Air temperature increasing rates are +0.318°C021002year 611 during 1960-2009 and +0.423°C021002year 611 during 1980–2009, while precipitation decreasing rates are 612.9102mm021002year 611 during 1960–2009. There were five different dry or wet periods from the 1960s to the 2000s in order, and the wetter 1990s and the drier 2000s changed dramatically in the study area. Local climate totally tend to warm–dry conditions during the last 5002years. According to coefficient of variation ( Cv ) of yearly growing-season cumulative NDVI value and yearly NDVI maximum in pixel scale, vegetation had experienced huge temporal and spatial variation during the last 1002years. Recently, frequent droughts and dust storms seriously affected local agriculture and grazing activities, and resulted in heavy economic loss, especially over the drought period of 1999–2001. Faced with those drought disasters accompanied with strong dust storms, the local authorities proposed the enclosing-transferring strategy and made great efforts to adapt overt climate change and improve environment, including making selective emigration, decreasing livestock numbers, fencing grasslands and building forage production bases with irrigation instruments and actively adjusting industry structure. However, some effects and potential problems of this adaptation strategy still need to be comprehensively assessed further in longer time scales and aimed at different sub-regions.

DOI

[23]
Mann H B, 1945. Nonparametric tests against trend.Econometrica, 13(3): 245-259.A family of two-sample non-parametric tests is described, in which only the tails of the distributions are used. Some are presented as tests of dispersion and some as tests of location. Critical values for certain of the tests are given for large samples. The power of the tests is discussed, and fresh results are given for a test of dispersion against rectangular alternatives.

DOI

[24]
Meehl G A, Arblaster J M, Branstator G, 2012. Mechanisms contributing to the warming hole and the consequent U.S. east-west differential of heat extremes.Journal of Climate, 25(18): 6394-6408.A linear trend calculated for observed annual mean surface air temperatures over the United States for the second-half of the twentieth century shows a slight cooling over the southeastern part of the country, the so-called warming hole, while temperatures over the rest of the country rose significantly. This east west gradient of average temperature change has contributed to the observed pattern of changes of record temperatures as given by the ratio of daily record high temperatures to record low temperatures with a comparable east west gradient. Ensemble averages of twentieth-century climate simulations in the Community Climate System Model, version 3 (CCSM3), show a slight west east warming gradient but no warming hole. A warming hole appears in only several ensemble members in the Coupled Model Intercomparison Project phase 3 (CMIP3) multimodel dataset and in one ensemble member of simulated twentieth-century climate in CCSM3. In this model the warming hole is produced mostly from internal decadal time-scale variability originating mainly from the equatorial central Pacific associated with the Interdecadal Pacific Oscillation (IPO). Analyses of a long control run of the coupled model, and specified convective heating anomaly experiments in the atmosphere-only version of the model, trace the forcing of the warming hole to positive convective heating anomalies in the central equatorial Pacific Ocean near the date line. Cold-air advection into the southeastern United States in winter, and low-level moisture convergence in that region in summer, contribute most to the warming hole in those seasons. Projections show a disappearance of the warming hole, but ongoing greater surface temperature increases in the western United States compared to the eastern United States.

DOI

[25]
Pan Z, Wan B, Gao Z, 2013. Asymmetric and heterogeneous frequency of high and low record-breaking temperatures in China as an indication of warming climate becoming more extreme. Journal of Geophysical Research:Atmospheres, 118(12): 6152-6164.The ratio of record highs to record lows and their rates of decay with time has emerged as a new metric for climatic warming and extremes complementing with the well-documented daily temperature range. This paper evaluates both the observed and model-projected high/low record behaviors in China, with a particular focus on an anomalous cooling region sometimes termed warming hole. We found that the observed frequency decay over time of high (low) record temperatures occurred much slower (faster) than the theoretically expected rate (1/n) of the independently and identically distributed (i.i.d.) time series. The high to low record (H/L) ratio is 3.0 in the recent years, about 50% larger than those in the U.S. and Europe. A drifting-mean i.i.d. model mimicking warming climate represents the observed record behavior much better than the i.i.d. sequence, but it still cannot explain the full record variability, implying that either the past mean warming rate has been nonlinear (accelerating) or temperature variance has become more extreme. The H/L record ratio by the mid-2040s with respect to 2006 could reach 6.8 under the high emission RCP8.5 scenario, whereas the increase of the record magnitude in the representative concentration path scenario remains largely similar to the current climate. Record frequency is highly correlated not only to Pacific Warm Pool temperature but also to Atlantic Multidecadal Oscillation index, with significant positive correlation in northern and southeastern China.

DOI

[26]
Peterson T C, Zhang X, Brunet-India Met al., 2008. Changes in North American extremes derived from daily weather data. Journal of Geophysical Research:Atmospheres, 113(D7): D07113.

[27]
Piao S, Ciais P, Huang Yet al., 2010. The impacts of climate change on water resources and agriculture in China.Nature, 467(7311): 43-51.China is the world's most populous country and a major emitter of greenhouse gases. Consequently, much research has focused on China's influence on climate change but somewhat less has been written about the impact of climate change on China. China experienced explosive economic growth in recent decades, but with only 7% of the world's arable land available to feed 22% of the world's population, China's economy may be vulnerable to climate change itself. We find, however, that notwithstanding the clear warming that has occurred in China in recent decades, current understanding does not allow a clear assessment of the impact of anthropogenic climate change on China's water resources and agriculture and therefore China's ability to feed its people. To reach a more definitive conclusion, future work must improve regional climate simulations-especially of precipitation-and develop a better understanding of the managed and unmanaged responses of crops to changes in climate, diseases, pests and atmospheric constituents.

DOI PMID

[28]
Portmann R W, Solomon S, Hegerl G C, 2009. Spatial and seasonal patterns in climate change, temperatures, and precipitation across the United States.Proceedings of the National Academy of Sciences, 106(18): 7324-7329.Changes in climate during the 20th century differ from region to region across the United States. We provide strong evidence that spatial variations in US temperature trends are linked to the hydrologic cycle, and we also present unique information on the seasonal and latitudinal structure of the linkage. We show that there is a statistically significant inverse relationship between trends in daily temperature and average daily precipitation across regions. This linkage is most pronounced in the southern United States (30-40 degrees N) during the May-June time period and, to a lesser extent, in the northern United States (40-50 degrees N) during the July-August time period. It is strongest in trends in maximum temperatures (T(max)) and 90th percentile exceedance trends (90PET), and less pronounced in the T(max) 10PET and the corresponding T(min) statistics, and it is robust to changes in analysis period. Although previous studies suggest that areas of increased precipitation may have reduced trends in temperature compared with drier regions, a change in sign from positive to negative trends suggests some additional cause. We show that trends in precipitation may account for some, but not likely all, of the cause point to evidence that shows that dynamical patterns (El Ni帽o/Southern Oscillation, North Atlantic Oscillation, etc.) cannot account for the observed effects during May-June. We speculate that changing aerosols, perhaps related to vegetation changes, and increased strength of the aerosol direct and indirect effect may play a role in the observed linkages between these indices of temperature change and the hydrologic cycle.

DOI PMID

[29]
Reichstein M, Bahn M, Ciais Pet al., 2013. Climate extremes and the carbon cycle.Nature, 500(7462): 287-295.The terrestrial biosphere is a key component of the global carbon cycle and its carbon balance is strongly influenced by climate. Continuing environmental changes are thought to increase global terrestrial carbon uptake. But evidence is mounting that climate extremes such as droughts or storms can lead to a decrease in regional ecosystem carbon stocks and therefore have the potential to negate an expected increase in terrestrial carbon uptake. Here we explore the mechanisms and impacts of climate extremes on the terrestrial carbon cycle, and propose a pathway to improve our understanding of present and future impacts of climate extremes on the terrestrial carbon budget.

DOI PMID

[30]
Robine J-M, Cheung S L K, Le Roy Set al., 2008. Death toll exceeded 70,000 in Europe during the summer of 2003.Comptes Rendus Biologies, 331(2): 171-178.Nous avons collecté le nombre quotidien de décès par région dans 16 pays européens et analysé la mortalité estivale pour la période de référence (1998–2002) et pour 2003. Il s'est produit plus de 7065000 décès supplémentaires au cours de l'été 2003. On observe des distorsions importantes dans la distribution par 09ge des décès, mais pas d'effet de rattrapage dans les mois suivants. Le réchauffement climatique constitue une nouvelle menace pour la santé des personnes 09gées, qui peut être difficile à détecter au niveau d'un pays, en fonction de la taille de ce dernier. Le décompte centralisé des décès journaliers à une échelle géographique opérationnelle constitue une priorité de santé publique en Europe. Pour citer cet article : J.-M. Robine et al., C. R. Biologies 331 (2008).

DOI PMID

[31]
Sen P K, 1968. Estimates of the regression coefficient based on Kendall’s Tau.Journal of the American Statistical Association, 63(324): 1379-1389.

[32]
Seneviratne S I, Donat M G, Mueller Bet al., 2014. No pause in the increase of hot temperature extremes.Nature Climate Change, 4(3): 161-163.Observational data show a continued increase of hot extremes over land during the so-called global warming hiatus. This tendency is greater for the most extreme events and thus more relevant for impacts than changes in global mean temperature.

DOI

[33]
Shi J, Wen K, Cui L, 2016. Distribution and trend on consecutive days of severe weathers in China during 1959-2014.Journal of Geographical Sciences, 26(6): 658-672.Based on daily surface climate data and weather phenomenon data, the spatial and temporal distribution and trend on the number of consecutive days of severe weathers were analyzed in China during 1959-2014. The results indicate that the number of consecutive days for hot weathers increased at a rate of 0.1 day per decade in China as a whole, while that for cold weathers, snowfall weathers, thunderstorm weathers and foggy weathers showed significant decreasing trends at rates of 1.4, 0.3, 0.4 and 0.4 day per decade, respectively. Spatially, there were more consecutive hot days and rainstorm days in southeastern China, and more consecutive cold days and snowfall days in northeastern China and western China. Consecutive thunderstorm days were more in southern China and southwestern China, and consecutive foggy days were more in some mountain stations. Over the past 56 years, annual number of consecutive cold days decreased mainly in most parts of western China and eastern China. Consecutive thunderstorm days decreased in most parts of China. The trend of consecutive hot days, snowfall days and foggy days was not significant in most parts of China, and that of consecutive rainstorm days was not significant in almost the entire China.

DOI

[34]
Shi P, Sun S, Wang Met al., 2014. Climate change regionalization in China (1961-2010).Science China Earth Sciences, 57(11): 2676-2689.

[35]
Sievers G L, 1978. Weighted Rank Statistics for Simple Linear Regression.Journal of the American Statistical Association, 73(363): 628-631.This article is concerned with statistical inferences for the slope parameter 尾 in the simple linear regression model. Rank procedures are proposed which extend the procedures of Theil and Sen by using weights for the pairwise slopes. Estimation, confidence interval, and hypothesis testing problems are considered.

DOI

[36]
Sillmann J, Donat M G, Fyfe J Cet al., 2014. Observed and simulated temperature extremes during the recent warming hiatus.Environmental Research Letters, 9(6): 064023.The discrepancy between recent observed and simulated trends in global mean surface temperature has provoked a debate about possible causes and implications for future climate change projections. However, little has been said in this discussion about observed and simulated trends in global temperature extremes. Here we assess trend patterns in temperature extremes and evaluate the consistency between observed and simulated temperature extremes over the past four decades (1971-2010) in comparison to the recent 15 years (1996-2010). We consider the coldest night and warmest day in a year in the observational dataset HadEX2 and in the current generation of global climate models (CMIP5). In general, the observed trends fall within the simulated range of trends, with better consistency for the longer period. Spatial trend patterns differ for the warm and cold extremes, with the warm extremes showing continuous positive trends across the globe and the cold extremes exhibiting a coherent cooling pattern across the Northern Hemisphere mid-latitudes that has emerged in the recent 15 years and is not reproduced by the models. This regional inconsistency between models and observations might be a key to understanding the recent hiatus in global mean temperature warming.

DOI

[37]
Small C, Elvidge C D, 2013. Night on Earth: Mapping decadal changes of anthropogenic night light in Asia.International Journal of Applied Earth Observation and Geoinformation, 22: 40-52.The defense meteorological satellite program (DMSP) operational linescan system (OLS) sensors have imaged emitted light from Earth's surface since the 1970s. Temporal overlap in the missions of 5 OLS sensors allows for intercalibration of the annual composites over the past 19 years (Elvidge et al., 2009). The resulting image time series captures a spatiotemporal signature of the growth and evolution of lighted human settlements and development. We use empirical orthogonal function (EOF) analysis and the temporal feature space to characterize and quantify patterns of temporal change in stable night light brightness and spatial extent since 1992. Temporal EOF analysis provides a statistical basis for representing spatially abundant temporal patterns in the image time series as uncorrelated vectors of brightness as a function of time from 1992 to 2009. The variance partition of the eigenvalue spectrum combined with temporal structure of the EOF5 and spatial structure of the PCs provides a basis for distinguishing between deterministic multi-year trends and stochastic year-to-year variance. The low order EOF5 and principal components (PC) space together discriminate both earlier (1990s) and later (2000s) increases and decreases in brightness. Inverse transformation of these low order dimensions reduces stochastic variance sufficiently so that tri-temporal composites depict potentially deterministic decadal trends. The most pronounced changes occur in Asia. At critical brightness threshold we find an 18% increase in the number of spatially distinct lights and an 80% increase in lighted area in southern and eastern Asia between 1992 and 2009. During this time both China and India experienced a similar to 20% increase in number of lights and a similar to 270% increase in lighted area - although the timing of the increase is later in China than in India. Throughout Asia a variety of different patterns of brightness increase are apparent in tri-temporal brightness composites - as well as some conspicuous areas of apparently decreasing background luminance and, in many places, intermittent light suggesting development of infrastructure rather than persistently lighted development. Vicarious validation using higher resolution Landsat imagery verifies multiple phases of urban growth in several cities as well as the consistent presence of low DN (<similar to 15) background luminance for many agricultural areas. Lights also allow us to quantify changes in the size distribution and connectedness of different intensities of development. Over a wide range of brightnesses, the size distributions of spatially contiguous lighted area are consistent with power laws with exponents near -1 as predicted by Zipf's Law for cities. However, the larger lighted segments are much larger than individual cities; they correspond to vast spatial networks of contiguous development (Small et al., 2011). (C) 2012 Published by Elsevier B.V.

DOI

[38]
Sun Y, Zhang X, Zwiers F Wet al., 2014. Rapid increase in the risk to extreme summer heat in eastern China.Nature Climate Change, 4(12): 1082-1085.The summer of 2013 was the hottest on record in Eastern China. Severe extended heatwaves affected the most populous and economically developed part of China and caused substantial economic and societal impacts. The estimated direct economic losses from the accompanying drought alone total 59 billion RMB (ref. ). Summer (June-August) mean temperature in the region has increased by 0.82 掳C since reliable observations were established in the 1950s, with the five hottest summers all occurring in the twenty-first century. It is challenging to attribute extreme events to causes. Nevertheless, quantifying the causes of such extreme summer heat and projecting its future likelihood is necessary to develop climate adaptation strategies. We estimate that anthropogenic influence has caused a more than 60-fold increase in the likelihood of the extreme warm 2013 summer since the early 1950s, and project that similarly hot summers will become even more frequent in the future, with fully 50% of summers being hotter than the 2013 summer in two decades even under the moderate RCP4.5 emissions scenario. Without adaptation to reduce vulnerability to the effects of extreme heat, this would imply a rapid increase in risks from extreme summer heat to Eastern China.

DOI

[39]
Wang W, Zhou W, Chen D, 2014a. Summer high temperature extremes in Southeast China: Bonding with the El Niño-Southern Oscillation and East Asian summer monsoon coupled system.Journal of Climate, 27(11): 4122-4138.This study investigates summer high temperature extremes (HTEs) in southeast China and their linkage with the El Nino-Southem Oscillation (ENSO) and atmospheric circulations in the East Asian summer monsoon (EASM). An interdecadal change in HTEs associated with the abrupt shift of the ENSO monsoon climate in the late 1980s is demonstrated. Before this interdecadal shift, the interannual variability of HTEs was linked mainly to temperature adjustments associated with the meridional displacement of the East Asian jet stream (EAJS), whereas after the shift HTEs were found to follow an ENSO cycle, which may be due to intensified and persistent ENSO activities, tropical Indian Ocean (TIO) warming, and changes in atmospheric teleconnections. Impacts of the EAJS, the South Asian high (SAH), and the western North Pacific subtropical high (WNPSH) on HTEs are further investigated based on empirical orthogonal function (EOF) analysis. It is found that mainly the first leading EOF mode with a homogeneous spatial pattern shows dominance before the interdecadal shift, whereas both of the first two leading EOF modes show dominance after the interdecadal shift. A possible mechanism of how HTEs in southeast China are linked to the EAJS, the SAH, and the WNPSH in the ENSO-monsoon coupled system is proposed.

DOI

[40]
Wang X L, Swail V R, 2001. Changes of extreme wave heights in Northern Hemisphere Oceans and related atmospheric circulation regimes.Journal of Climate, 14(10): 2204-2221.

[41]
Wang Y, Ren F, Zhang X, 2014b. Spatial and temporal variations of regional high temperature events in China.International Journal of Climatology, 34(10): 3054-3065.An objective identification technique is applied to identify Regional High Temperature Events (RHTE) in China using daily maximum temperature data at 642 stations from 1961 to 2010. There are 213 RHTE identified. These events in general occur from May to September, with months from June to August being high season and the peak frequency appearing in July. Over the space, these events mainly occur in regions east of 90 degrees E, with higher frequencies and stronger intensities in the middle and lower valleys of the Yangtze River. Extreme and severe RHTE are more frequent in southern, central and eastern China and are less frequent in northern China. Statistics that characterize the regional events including annual frequency, annual sum of integrated index, annual sum of single indices (e. g. duration, accumulated high temperature intensity, accumulated impacted area and extreme high temperature) and annual maximum values of these single indices suggest that the RHTE are becoming more severe in both space and time and impacting more areas. A further analysis shows that the distribution patterns of the trend change of China RHTE, i.e. RHTE becoming more frequent and stronger in most China especially in northern China, but less frequent and weaker in eastern regions between the Yangtze River and the Yellow River during the past 50 years, is mainly a regional response to global warming. Meanwhile, the increasing trends in frequency and accumulated intensity of the RHTE in southern China may also be partly due to the western Pacific subtropical high westward extension and intensification in summer during the past decades.

DOI

[42]
Wu Y J, Wu S Y, Wen J Het al., 2016. Changing characteristics of precipitation in China during 1960-2012.International Journal of Climatology, 36(3): 1387-1402.ABSTRACT In this study, we investigated changes in the precipitation characteristics for China from 1960 to 2012 based on a recent daily precipitation dataset of 666 climate stations and robust non-parametric trend detection techniques. We divided all precipitation events into four non-overlapping categories: light, moderate, heavy and very heavy based on percentile thresholds. We then established the trends for annual total and precipitation of different intensity categories, and examined their regional and seasonal variations. The results show that there was little change in annual total precipitation for entire China, but distinctive regional patterns existed. In general, precipitation increased in the west and decreased in east. Precipitation of different intensities, in general, changed in the same direction as the mean, but heavy and very heavy precipitation events had higher rates of change than mean precipitation. The exception was the southeast region, where despite the slight decrease in mean precipitation, heavy and very heavy precipitation still increased significantly. In addition, we used multiple regression models to explore the contribution of changes of frequency and intensity to total precipitation change, and the contributions of changes of precipitation at different intensities to total precipitation change. For western China, total precipitation change was associated more with frequency change, whereas in eastern China intensity contributed more. For precipitation amount, moderate, heavy and very heavy precipitations contributed to the total change, with little contribution from light precipitation change. For frequency, changes in light and moderate precipitation frequencies dominated the total change, with very little contributions from heavy and very heavy precipitation frequency changes. In addition, we examined the linkage between summer precipitation in eastern China and the East-Asian Summer Monsoon (EASM), found that the northern decrease and southern increase in summer precipitation was likely caused by the weakening of EASM over the study period.

DOI

[43]
Xie P, Wang Y, Liu Yet al., 2015. Incorporating social vulnerability to assess population health risk due to heat stress in China.Acta Geographica Sinica, 70(7): 1041-1051. (in Chinese)This paper presented a new conceptual framework by taking account of heat stress, social vulnerability, and population exposure. Meanwhile, an index system combining environmental data, demographics data and socioeconomic data has been built for the quantitative assessment of county-level heat stress risk pattern of China. The counties with the greatest vulnerability scores contain the Tarim Basin in Northwest China, Yudong Plain and Huaibei Plain in North China, Sichuan Basin in Southwest China, Jianghan Plain and Dongting Lake Basin in Central China, and Pearl River Basin in South China. The hot spots of heat stress risk are located in Jianghan Plain and Dongting Lake Basin in Central China, Sichuan Basin in Southwest China, the junction of Jiangsu, Zhejiang and Shanghai in East China, and Pearl River Basin in South China, especially the Pearl River Delta Region. The hot spots of vulnerability are located in counties of high heat stress or high social vulnerability level, while the hot spots of risk mainly consist of metropolitan areas with dense population and advanced economic level. The results of dominant factor partition show that heat stress dominant areas are mainly located in basins or plains which are more prone to high temperature, social vulnerability dominant areas are mainly located in less developed counties, and population exposure dominant areas are mainly located in coastal counties with dense population.

DOI

[44]
Zander K K, Botzen W J W, Oppermann Eet al., 2015. Heat stress causes substantial labour productivity loss in Australia.Nature Climate Change, 5(7): 647-651.Heat stress at the workplace is an occupational health hazard that reduces labour productivity. Assessment of productivity loss resulting from climate change has so far been based on physiological models of heat exposure. These models suggest productivity may decrease by 11-27% by 2080 in hot regions such as Asia and the Caribbean, and globally by up to 20% in hot months by 2050. Using an approach derived from health economics, we describe self-reported estimates of work absenteeism and reductions in work performance caused by heat in Australia during 2013/2014. We found that the annual costs were US$655 per person across a representative sample of 1,726 employed Australians. This represents an annual economic burden of around US$6.2 billion (95% CI: 5.2-7.3 billion) for the Australian workforce. This amounts to 0.33 to 0.47% of Australia- GDP. Although this was a period when many Australians experienced what is at present considered exceptional heat, our results suggest that adaptation measures to reduce heat effects should be adopted widely if severe economic impacts from labour productivity loss are to be avoided if heat waves become as frequent as predicted.

DOI

[45]
Zhai P, Pan X, 2003. Trends in temperature extremes during 1951-1999 in China.Geophysical Research Letters, 30(17): 1913.Based on the daily surface air temperature data from about 200 stations during 1951-1999 in China, changes in the frequency of some extreme temperature events were studied with a focus on trends. For China as a whole, the number of hot days (Tmax over 35掳C) displays a slightly decreasing trend, while the number of frost days (Tmin below 0掳C) exhibits a significant decreasing trend. Meanwhile, increasing trends were detected in the frequencies of warm days and warm nights. In addition, decreasing trends was found in the frequencies of cool days and even stronger decreasing trend was found in frequencies of cool nights in China.

DOI

[46]
Zhang Q, Li J, David Chen Yet al., 2011. Observed changes of temperature extremes during 1960-2005 in China: Natural or human-induced variations?Theoretical and Applied Climatology, 106(3): 417-431.The purpose of this study was to statistically examine changes of surface air temperature in time and space and to analyze two factors potentially influencing air temperature changes in China, i.e., urbanization and net solar radiation. Trends within the temperature series were detected by using Mann-Kendall trend test technique. The scientific problem this study expected to address was that what could be the role of human activities in the changes of temperature extremes. Other influencing factors such as net solar radiation were also discussed. The results of this study indicated that: (1) increasing temperature was observed mainly in the northeast and northwest China; (2) different behaviors were identified in the changes of maximum and minimum temperature respectively. Maximum temperature seemed to be more influenced by urbanization, which could be due to increasing urban albedo, aerosol, and air pollutions in the urbanized areas. Minimum temperature was subject to influences of variations of net solar radiation; (3) not significant increasing and even decreasing temperature extremes in the Yangtze River basin and the regions south to the Yangtze River basin could be the consequences of higher relative humidity as a result of increasing precipitation; (4) the entire China was dominated by increasing minimum temperature. Thus, we can say that the warming process of China was reflected mainly by increasing minimum temperature. In addition, consistently increasing temperature was found in the upper reaches of the Yellow River basin, the Yangtze River basin, which have the potential to enhance the melting of permafrost in these areas. This may trigger new ecological problems and raise new challenges for the river basin scale water resource management.

DOI

[47]
Zhang S Y, Song Y L, Zhang D Ket al., 2004. The climatic characteristics of high temperature and the assessment method in the large cities of northern China.Acta Geographica Sinica, 59(3): 383-390. (in Chinese)Based on the high temperature data covering June-August during summer of 1961-2000 in northern China, climatic characteristics of high temperature weather in Beijing, Jinan, Shijiazuang, Tianjin and Taiyuan are analyzed. Variable features of the subtropical high and denaturalization high are discussed. The results show that the subtropical high and denaturalization high over the high temperature weather in northern China are closely related with humidity. The subtropical high and denaturalization high in eastern China are the most important system. With an assessment model established, some computing cases show that the assessment experiment of the method has reference value to the assessment of the muggy high temperature weather in most cities of northern China.

DOI

[48]
Zhang X, Alexander L, Hegerl G Cet al., 2011. Indices for monitoring changes in extremes based on daily temperature and precipitation data. Wiley Interdisciplinary Reviews:Climate Change, 2(6): 851-870.

[49]
Zhou L, Dickinson R E, Tian Yet al., 2004. Evidence for a significant urbanization effect on climate in China.Proceedings of the National Academy of Sciences, 101(26): 9540-9544.

Outlines

/