
Journal of Geographical Sciences >
Measuring time accessibility and its spatial characteristics in the urban areas of Beijing
Author: Wang Jianghao, PhD and Assistant Professor, specialized in spatio-temporal data mining, geostatistics and GIS. E-mail: wangjh@lreis.ac.cn
*Corresponding author: Song Ci, PhD and Assistant Professor, specialized in GIS. E-mail: songci@igsnrr.ac.cn;Tian Dajiang, PhD, specialized in tourism geography. E-mail: tiandj.08b@igsnrr.ac.cn
Received date: 2015-07-15
Accepted date: 2015-09-09
Online published: 2016-12-20
Supported by
National Natural Science Foundation of China, No.41601164, No.41601427
Key Program of National Natural Science Foundation of China, No.71433008
Cultivate Project of Institute of Geographic Sciences and Natural Resources Research, CAS, No.TSYJS03
Copyright
Construction of road infrastructure is fundamental to city operation and development, as well as an important pathway and focus in physical urban-rural integration. The long-term implementation of a system of ring roads plus radiating roads in Beijing has strongly impacted urban infrastructure construction and space-time accessibility. Particularly, recent rapid growth of private car ownership in Beijing has imposed greater loads on its road system, seriously hampering urban commuting efficiency and negatively impacting quality of life. To address such challenges and enhance the rapid development of transport infrastructure, Beijing has accelerated rail transit construction since 2008 in an effort to improve commuting capacity. This paper aims to measure time accessibility and its spatial characteristics in urban areas of Beijing by applying a comprehensive method that combines vector and raster attribute data generated from road network and subway transport infrastructure. By using a dual index of accessibility and road density, the study further reveals the features of and differences in spatial accessibility and the construction of road systems in urban areas of the northern and southern parts of Beijing. The findings of this study can provide a scientific basis for future urban planning and road system construction both in general and with respect to Beijing, given its aspirations to become a world city.
Key words: accessibility; road density; spatial characteristics; Beijing
WANG Jianghao , DENG Yu , SONG Ci , TIAN Dajiang . Measuring time accessibility and its spatial characteristics in the urban areas of Beijing[J]. Journal of Geographical Sciences, 2016 , 26(12) : 1754 -1768 . DOI: 10.1007/s11442-016-1356-2
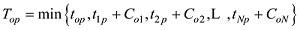
Figure 1 Location of the study area in Beijing |
Table 1 Road speed for different road types |
| Road type | Expressways | Arterial roads | State roads | |||
|---|---|---|---|---|---|---|
| Running attribute | Peak | Non-peak | Peak | Non-peak | Peak | Non-peak |
| Average speed (km/h) | 28.95 | 70 | 19.45 | 50 | 19.45 | 60 |
| Weighted average speed (km/h) | 49.475 | 34.725 | 39.725 | |||
Table 2 Subway speeds with different lines |
| Subway line | Starting point | Destination | Distance (km) | Time (min) | Average speed (km/h) | Average speed of subway (km/h) |
|---|---|---|---|---|---|---|
| Subway Line 5 | Tiantongyuanbei | Songjiazhuang | 27.3 | 54 | 30.33 | 31.31 |
| Subway Line 10 | Bagou | Jingsong | 23.8 | 50 | 28.56 | |
| Subway Line 13 | Xizhimen | Lishuiqiao | 25.1 | 39 | 38.61 | |
| Subway Line 8 | South Gate of Forest Park | Beitucheng | 3.7 | 11 | 20.18 | |
| Subway Line 4 | Anheqiaobei | Gongyiqiaoxi | 27.4 | 56 | 29.35 | |
| Subway Line 2 | Xizhimen | Qianmen | 7.9 | 19 | 24.94 | |
| Subway Line 1 | Pinguoyuan | Sihui | 28.6 | 55 | 31.2 | |
| Subway Line Batong | Sihui | Tuqiao | 18.1 | 35 | 31.02 | |
| Airport Line | Sanyuanqiao | Hangzhanlou | 25.4 | 32 | 47.62 |
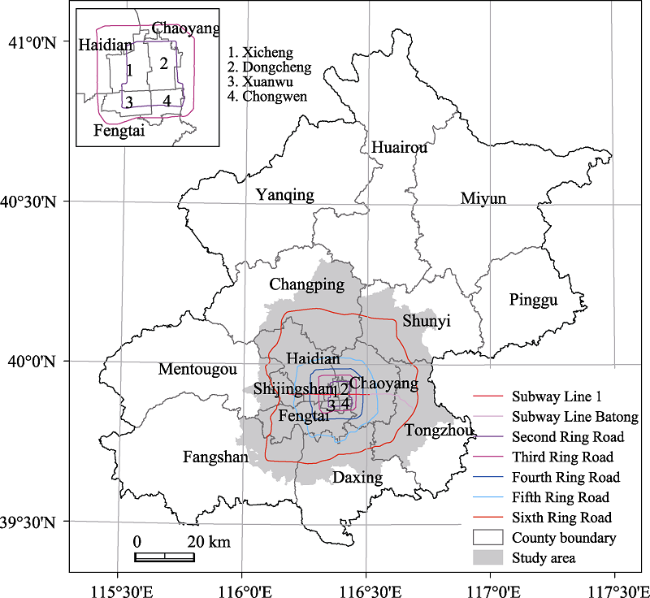
Figure 2 Map showing the arterial roads of Beijing in 2012 |
 .
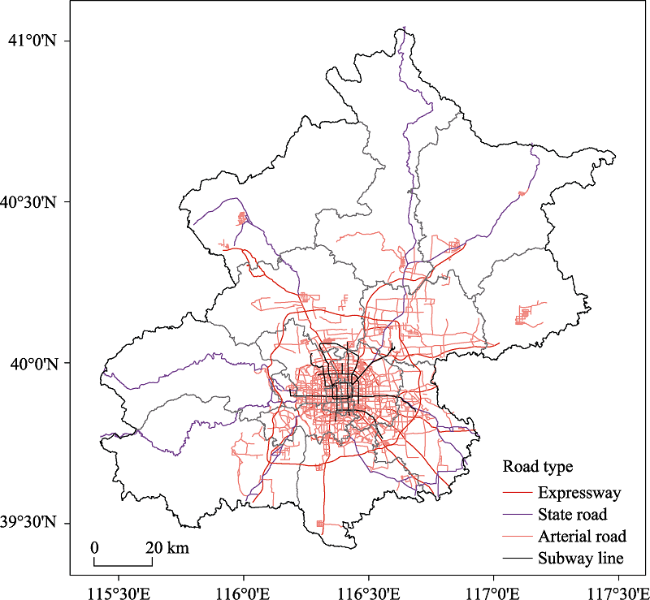
.Figure 3 Map showing time accessibility in the study area of Beijing in 2012 |
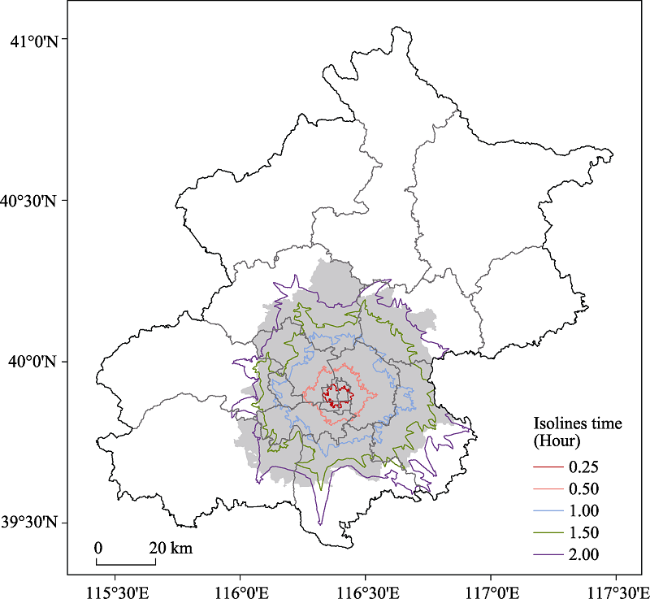
Figure 4 Isolines of time accessibility of Beijing urban area in 2012 |
Table 3 Isotime’s attribute and its relationship with city expressways and geographic locations |
| Length (km) | Area (km2) | The attribute of ring road nearby | |||
|---|---|---|---|---|---|
| Name | Length (km) | Area (km2) | |||
| 0.25 h Isotime line | 64.37 | 46.94 | Second Ring Road | 32.70 | 61.54 |
| 0.5 h Isotime line | 154.40 | 279.43 | Fourth Ring Road | 65.30 | 304.95 |
| 1.0 h Isotime line | 319.16 | 1150.31 | Fifth Ring Road | 98.58 | 667.63 |
| 1.5 h Isotime line | 372.75 | 2182.76 | Sixth Ring Road | 187.50 | 2269.27 |
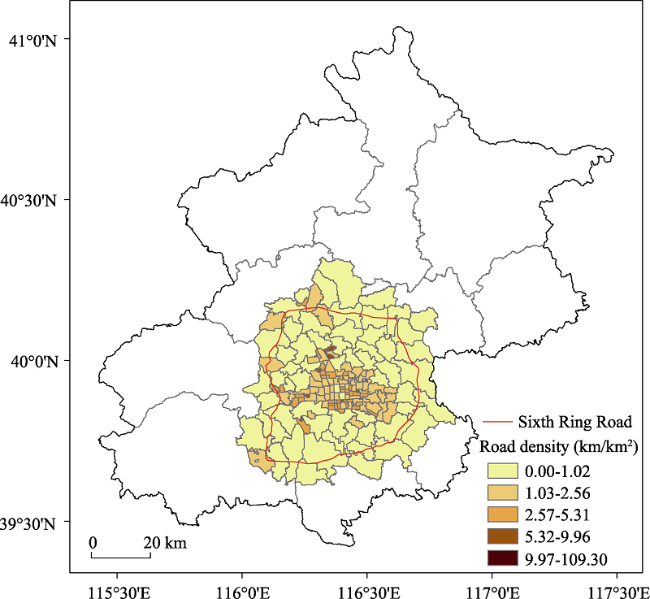
Figure 5 Road density in the study area of Beijing in 2012 |
Figure 6 Comparison of road density in the north and south parts of urban Beijing |
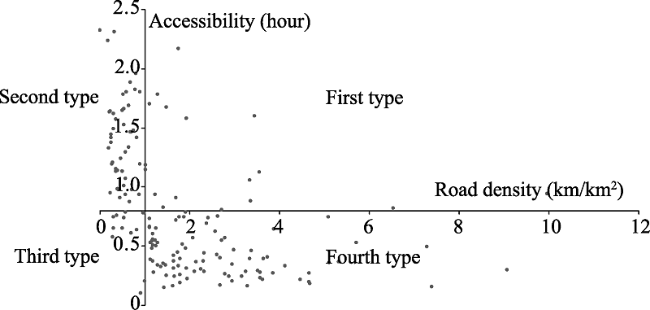
Figure 7 Types of township roads by road density and time accessibility for towns, townships and neighborhoods in the study area |
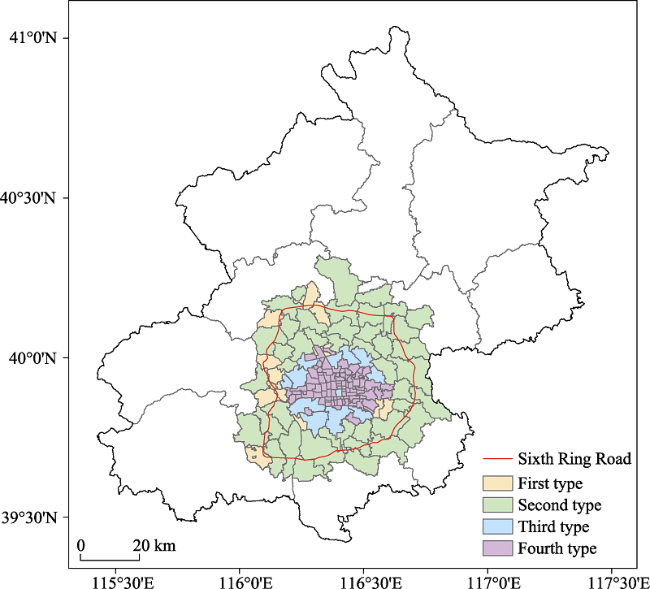
Figure 8 Spatial distribution of different types of units in Beijing in 2012 |
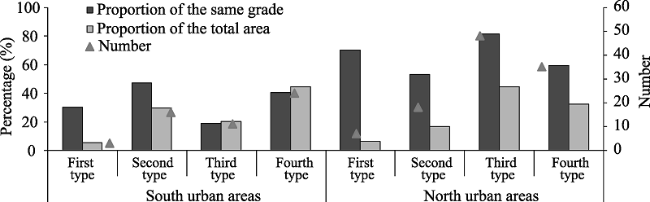
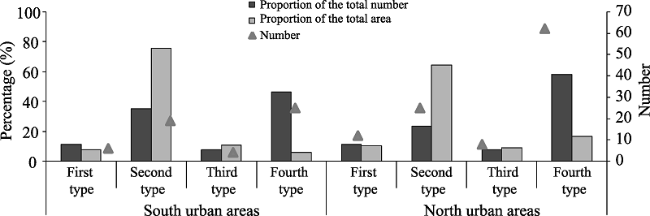
Figure 9 Comparison of different types of units between the northern and southern urban areas |
Table 4 Regression analysis of land price by different typologies |
| Land price sample | Regression equation | ||||||
|---|---|---|---|---|---|---|---|
| Commercial | Residential | Industrial | Total | Road density | Time accessibility | R2 | |
| First type region | 3 | 6 | 7 | 16 | 0.265** | 0.065 | 0.484 |
| Second type region | 45 | 80 | 190 | 315 | -0.133 | -0.355** | 0.230 |
| Third type region | 15 | 21 | 2 | 38 | 0.598 | -1.410* | 0.217 |
| Fourth type region | 22 | 24 | 0 | 46 | -0.206 | -5.524** | 0.395 |
Note: * denotes 0.1 significant level; ** 0.1 significant level; the remaining, non-significant. |
The authors have declared that no competing interests exist.
| 1 |
|
| 2 |
|
| 3 |
|
| 4 |
|
| 5 |
|
| 6 |
|
| 7 |
|
| 8 |
|
| 9 |
|
| 10 |
|
| 11 |
|
| 12 |
|
| 13 |
|
| 14 |
|
| 15 |
|
| 16 |
|
| 17 |
|
| 18 |
|
| 19 |
|
| 20 |
|
| 21 |
|
| 22 |
|
| 23 |
|
| 24 |
|
| 25 |
|
| 26 |
|
| 27 |
|
| 28 |
|
| 29 |
|
/
| 〈 |
|
〉 |