
Journal of Geographical Sciences >
HSR mechanisms and effects on the spatial structure of regional tourism in China
Author: Wang Degen (1973-), PhD and Professor, specialized in high-speed rail tourism and urban tourism. E-mail: wdg713@163.com
*Corresponding author: Wang Li (1974-), E-mail: wltsr@126.com
Received date: 2015-03-30
Accepted date: 2015-05-05
Online published: 2016-12-20
Supported by
Key Project of National Natural Science Foundation of China, No.41230631
National Natural Science Foundation of China, No.41271134
Copyright
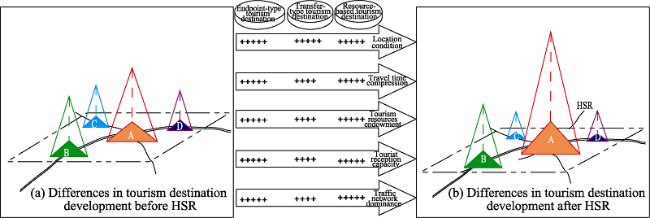
Chinese railway has entered the “HSR era”, while the structure of “four vertical and four horizontal” railways for transit passengers is almost completed. Taking the Beijing-Shanghai High-Speed Rail (hereinafter referred to as HSR) as an example, this paper first explores HSR’s effects on the spatial structure of regional tourist flows using the social network analysis. Next, it notes changes in the accessibility of regional transportation. After analyzing the factors including initial endowment of regional tourism resources, hospitality facilities, the density of the regional tourism transportation network, and locations, the paper discusses the mechanisms through which HSR affects regional tourist flows. The study shows the following: (1) HSR’s effects on the spatial structure of regional tourist flows are manifested through the Matthew effect, the filtering effect, the diffusion effect and the overlying effect, and (2) the Matthew effect of HSR is manifested under an obvious interaction of the location, the initial endowment of tourism resources, hospitality capacity, tourist transportation network density and “time-space compression”. The filtering effect of HSR is manifested for those tourism nodes without favorable location conditions, endowment of tourism resources, hospitality capacity, or tourist transportation network density and without obvious benefits from “time-space compression”. Those tourism nodes that boast advantages in terms of location condition, endowment of tourism resources, hospitality capacity, tourist transportation network density and obvious “time-space compression” will become sources for the diffusion effect. HSR will strengthen the aggregation effects of tourist flow in these diffusion sources, which will thereafter diffuse to peripheral tourist areas, manifesting “aggregation-diffusion”. HSR has overlapped tourists’ spatial traveling range over large-scale spaces. However, the overlying effect is only generated in those tourism nodes with a favorable location condition, an endowment of tourism resources, hospitality capacity, tourist transportation network density, and obvious “time-space compression”.
Key words: spatial structure; HSR effect; mechanism; Beijing-Shanghai HSR
WANG Degen , WANG Li , CHEN Tian , LU Lin , NIU Yu , ALAN August Lew . HSR mechanisms and effects on the spatial structure of regional tourism in China[J]. Journal of Geographical Sciences, 2016 , 26(12) : 1725 -1753 . DOI: 10.1007/s11442-016-1355-3
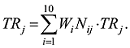
Figure 1 Construction of HSR in China |
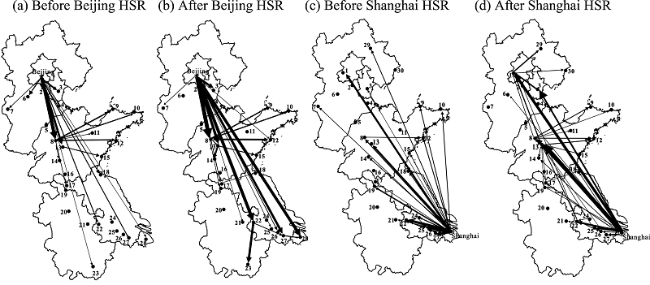
 TRj represents cities’ initial endowment of regional tourism resources; Nij is the quantity of world heritage, national scenic, and travel sites ranking 5A and 4A that are within the cities. Wi is the weight of the different grades of tourism resources; in this article, the weight of world heritage, national scenic areas, travel areas ranking 5A and 4A are 10, 6, 4 and 2, respectively (Shi et al., 2006). If a tourist site has more than one title, we choose the highest-ranking title. The quantity of tourism resources is taken from data released by the Chinese National Tourism Administration, and the statistics are as of the end of 2011. (2) Hospitality facilities primarily include hotels, restaurants, entertainment, tourist shopping areas, and so on. The most important facility for tourists to consider is hotels, and whether a hotel can be successfully booked is an important basis on which tourists choose their destination. Considering the possibility to acquire data, we select the number of starred hotels as the index of tourist reception capacity, and these data are taken from the Statistical Yearbook of every province for 2012 or from the statistical report on the urban national economic and social development. (3) The density of the regional tourism transportation network is an important index for evaluating the advantages of a destination’s traffic accessibility. This density primarily refers to the absolute ratio of the length of traffic routes to the area of the land (Huang et al., 2011). The formula is
  , in which TNj is the j-th urban density for the regional tourism transportation network. TLj is the j-th urban traffic route’s length, given that the traffic route includes high-speed railway, state roads, provincial roads and railway as of 2011. Aj is the j-th area of the city. The density of transportation network is a positive index, meaning that the larger the value is, the greater the traffic network density and the more favorable the regional traffic condition. (4) The space distance between tourists’ origin and destination can generally be reflected by traffic (geography) distance and time distance. This paper primarily compares the changes in tourists’ destination selection before and after the opening of HSR. Because the travel time from the origin to the same destination changes significantly before and after HSR opening, the space distance between tourists’ origin and destination can be reflected by time distance.
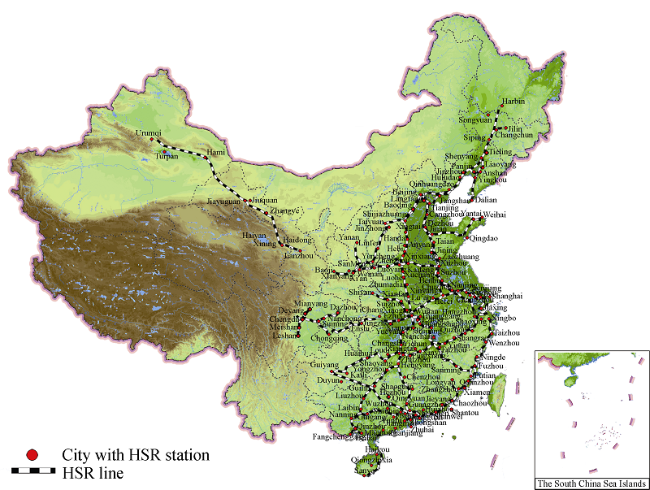
Figure 2 Spatial distribution of tourism resources along the Beijing-Shanghai HSR |
Table 1 Changes of network centrality of tourist flow of Beijing and Shanghai before and after HSR |
| The network of tourist flow in Beijing | The network of tourist flow in Shanghai | ||||||||||||
|---|---|---|---|---|---|---|---|---|---|---|---|---|---|
| Tourism nodes | Before opening HSR | After opening HSR | Tourism nodes | Before opening HSR | After opening HSR | ||||||||
| Degree centrality | Middle centrality | Degree centrality | Middle centrality | Degree centrality | Middle centrality | Degree centrality | Middle centrality | ||||||
| Outward | Inward | Outward | Inward | Outward | Inward | Outward | Inward | ||||||
| D2 | 0.00 | 3.85 | 0.00 | 0.00 | 0.00 | 0.00 | D27 | 3.85 | 11.54 | 0.46 | 7.69 | 3.85 | 0.00 |
| D3 | 0.00 | 6.95 | 0.00 | 0.00 | 4.85 | 0.00 | D26 | 3.85 | 7.70 | 0.00 | 7.69 | 7.69 | 0.19 |
| D4 | 0.00 | 3.85 | 0.00 | 0.00 | 3.70 | 0.00 | D25 | 11.54 | 11.54 | 0.92 | 5.64 | 9.12 | 0.39 |
| D6 | 0.00 | 3.85 | 0.00 | 0.00 | 3.70 | 0.00 | D24 | 3.85 | 7.69 | 0.00 | 3.85 | 0.00 | 0.00 |
| D7 | 0.00 | 3.85 | 0.00 | 0.00 | 3.70 | 0.00 | D22 | 7.69 | 11.54 | 0.92 | 9.74 | 13.96 | 2.68 |
| D5 | 0.00 | 0.00 | 0.00 | 0.00 | 0.00 | 0.00 | D21 | 0.00 | 3.85 | 0.00 | 0.00 | 3.85 | 0.00 |
| D8 | 15.23 | 3.85 | 0.77 | 15.39 | 3.85 | 0.46 | D20 | 0.00 | 0.00 | 0.00 | 0.00 | 0.00 | 0.00 |
| D9 | 0.00 | 3.85 | 0.00 | 0.00 | 4.15 | 0.00 | D19 | 0.00 | 3.85 | 0.00 | 0.00 | 3.85 | 0.00 |
| D10 | 0.00 | 3.85 | 0.00 | 0.00 | 4.15 | 0.00 | D18 | 0.00 | 3.85 | 0.00 | 0.00 | 7.69 | 0.00 |
| D11 | 0.00 | 3.85 | 0.00 | 0.00 | 4.50 | 0.00 | D17 | 0.00 | 3.85 | 0.00 | 7.69 | 3.85 | 0.00 |
| D12 | 0.00 | 3.85 | 0.00 | 3.85 | 7.69 | 0.00 | D16 | 0.00 | 0.00 | 0.00 | 0.00 | 0.00 | 0.00 |
| D13 | 3.85 | 3.85 | 0.15 | 7.69 | 11.54 | 0.92 | D15 | 0.00 | 3.85 | 0.00 | 3.85 | 4.15 | 0.00 |
| D14 | 0.00 | 3.85 | 0.00 | 0.00 | 4.52 | 0.00 | D14 | 0.00 | 3.85 | 0.00 | 0.00 | 7.69 | 0.00 |
| D15 | 0.00 | 3.85 | 0.00 | 0.00 | 4.15 | 0.00 | D13 | 0.00 | 3.85 | 0.00 | 19.23 | 26.92 | 9.85 |
| D16 | 0.00 | 0.00 | 0.00 | 0.00 | 0.00 | 0.00 | D10 | 0.00 | 0.00 | 0.00 | 3.85 | 3.85 | 0.00 |
| D17 | 0.00 | 3.85 | 0.00 | 3.85 | 3.85 | 0.15 | D11 | 0.00 | 0.00 | 0.00 | 0.00 | 0.00 | 0.00 |
| D18 | 0.00 | 0.00 | 0.00 | 0.00 | 3.85 | 0.00 | D12 | 0.00 | 3.85 | 0.00 | 3.85 | 7.69 | 0.08 |
| D19 | 0.00 | 0.00 | 0.00 | 0.00 | 3.85 | 0.00 | D8 | 0.00 | 3.85 | 0.00 | 15.39 | 7.69 | 3.65 |
| D20 | 0.00 | 0.00 | 0.00 | 0.00 | 0.00 | 0.00 | D9 | 0.00 | 0.00 | 0.00 | 0.00 | 3.85 | 0.00 |
| D21 | 0.00 | 0.00 | 0.00 | 0.00 | 3.85 | 0.00 | D5 | 0.00 | 0.00 | 0.00 | 0.00 | 0.00 | 0.00 |
| D22 | 0.00 | 3.85 | 0.00 | 7.69 | 7.70 | 0.35 | D7 | 0.00 | 3.85 | 0.00 | 0.00 | 0.00 | 0.00 |
| D24 | 0.00 | 0.00 | 0.00 | 0.00 | 3.85 | 0.00 | D6 | 0.00 | 0.00 | 0.00 | 0.00 | 0.00 | 0.00 |
| D25 | 0.00 | 0.00 | 0.00 | 0.00 | 3.70 | 0.00 | D4 | 0.00 | 0.00 | 0.00 | 3.85 | 0.00 | 0.00 |
| D26 | 0.00 | 0.00 | 0.00 | 3.85 | 3.85 | 0.00 | D3 | 0.00 | 3.85 | 0.00 | 3.85 | 4.52 | 0.00 |
| D27 | 0.00 | 3.85 | 0.00 | 3.85 | 11.54 | 0.11 | D2 | 0.00 | 0.00 | 0.00 | 0.00 | 3.85 | 0.00 |
| D28 | 0.00 | 3.85 | 0.00 | 0.00 | 11.54 | 0.00 | D1 | 0.00 | 3.85 | 0.00 | 11.54 | 26.92 | 4.23 |
| D23 | 0.00 | 3.85 | 0.00 | 0.00 | 3.85 | 0.00 | D30 | 0.00 | 0.00 | 0.00 | 0.00 | 3.85 | 0.00 |
| - | - | - | - | - | - | - | D29 | 0.00 | 3.85 | 0.00 | 0.00 | 4.52 | 0.00 |
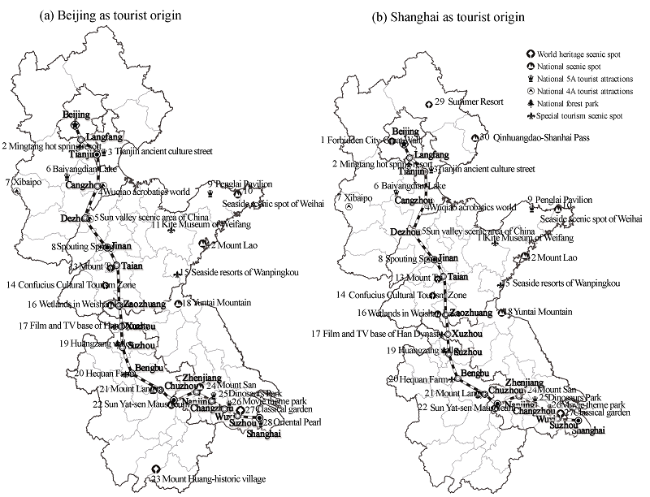
Figure 3 Impacts of Beijing-Shanghai HSR on the spatial structure of tourist flows in Beijing and Shanghai |
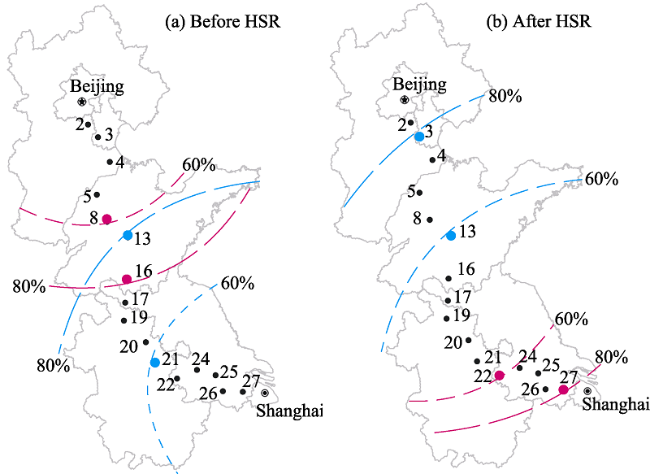
Figure 4 Comparison of the 60% & 80% traveling spatial range before and after HSR opening |
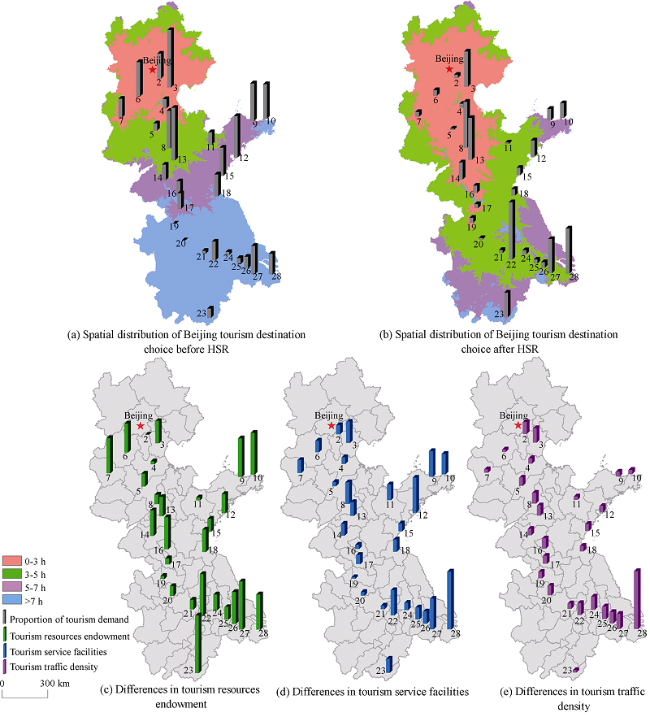
Figure 5 Influencing factors and changes in Beijing travelers’ spatial distribution before and after HSR opening |
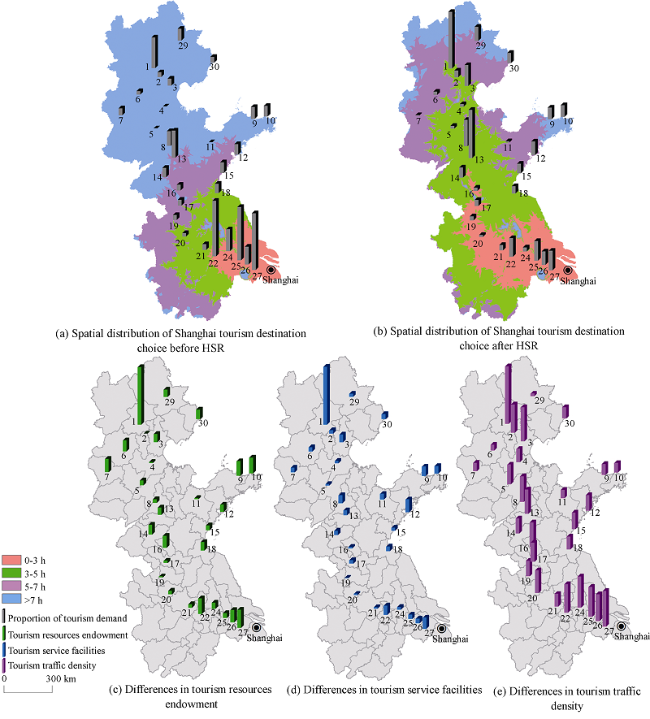
Figure 6 Influencing factors and changes in Shanghai travelers’ spatial distribution before and after HSR |
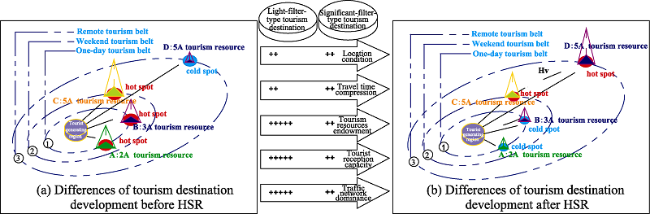
Figure 7 Mechanism of the Matthew effect for regional tourism space under the condition of HSR |
Figure 8 Mechanism of the filtering effect of regional tourism space under the condition of HSR |
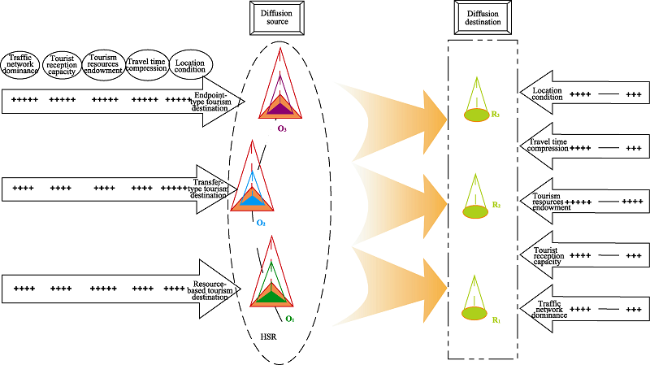
Figure 9 Mechanism of the diffusion effect for regional tourism space under the condition of HSR |
Table 2 Comparison of the overlying tourism nodes in terms of tourist demand, influencing factors and degree of time compression |
| Cities | The rank of travel demand in HSR | The rank of initial endowment of tourism resources | The rank of hospitality capacity | The rank of tourist transportation network density | The travel time of HSR | The travel time of bullet train |
|---|---|---|---|---|---|---|
| Tianjin | 5/4 | 12/12 | 7/12 | 3/3 | 0.40/3.99 | 0.93/8.90 |
| Cangzhou | 20/25 | 25/26 | 22/23 | 19/19 | 0.75/3.40 | 1.80/8.10 |
| Dezhou | 27/24 | 18/20 | 24/25 | 13/13 | 1.10/3.10 | 2.50/7.30 |
| Jinan | 2/3 | 20/21 | 6/6 | 9/9 | 1.40/2.95 | 3.30/6.50 |
| Taian | 4/2 | 14/15 | 11/10 | 11/11 | 1.60/2.60 | 3.80/6.10 |
| Zaozhuang | 13/2 | 8/8 | 23/24 | 10/10 | 2.10/2.00 | 5.10/4.80 |
| Xuzhou | 19/18 | 23/24 | 18/18 | 14/14 | 2.30/1.80 | 5.50/4.40 |
| Suzhou | 17/20 | 26/27 | 27/28 | 17/17 | 2.50/1.60 | 6.00/3.90 |
| Bengbu | 26/26 | 22/23 | 26/27 | 12/12 | 2.80/1.40 | 6.60/3.30 |
| Chuzhou | 24/19 | 21/22 | 25/26 | 21/21 | 3.15/1.00 | 7.50/2.40 |
| Nanjing | 1/7 | 4/3 | 5/5 | 6/6 | 3.30/0.87 | 7.80/2.00 |
| Zhengjiang | 22/21 | 16/17 | 21/22 | 4/4 | 3.50/0.68 | 8.30/1.60 |
| Changzhou | 21/6 | 19/18 | 15/15 | 5/5 | 3.70/0.50 | 8.80/1.10 |
| Wuxi | 16/10 | 9/7 | 13/13 | 8/8 | 3.80/0.37 | 9.00/0.85 |
| Suzhou | 6/5 | 2/2 | 3/3 | 2/2 | 3.90/0.25 | 9.30/0.57 |
Note: The data before and after “/” respectively show the tourism network space in Beijing and Shanghai |
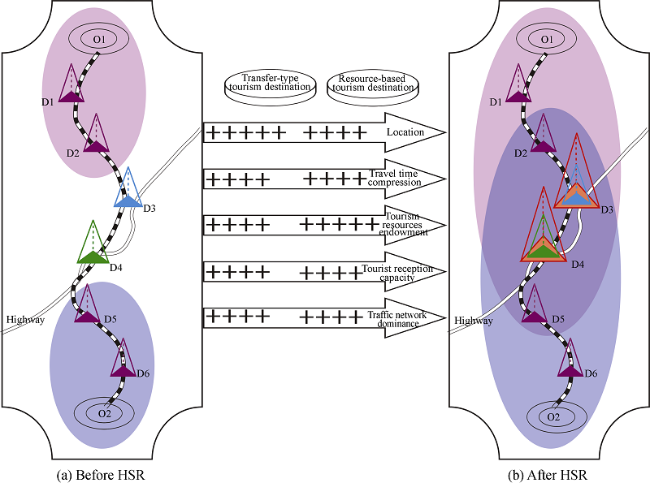
Figure 10 Mechanism of the overlying effect for regional tourism space under the condition of HSR |
The authors have declared that no competing interests exist.
| 1 |
|
| 2 |
|
| 3 |
|
| 4 |
|
| 5 |
|
| 6 |
|
| 7 |
|
| 8 |
|
| 9 |
|
| 10 |
|
| 11 |
|
| 12 |
|
| 13 |
|
| 14 |
|
| 15 |
|
| 16 |
|
| 17 |
Prideaux, B, 2000. The role of the transport system in destination development.Tourism Management, 21: 53-63.
|
| 18 |
|
| 19 |
|
| 20 |
|
| 21 |
|
| 22 |
|
| 23 |
|
| 24 |
|
| 25 |
|
| 26 |
|
| 27 |
|
| 28 |
|
| 29 |
|
| 30 |
|
| 31 |
|
| 32 |
|
| 33 |
|
/
| 〈 |
|
〉 |