Orginal Article

Spatio-temporal evolution of urban innovation structure based on zip code geodatabase: An empirical study from Shanghai and Beijing

  • DUAN Dezhong , 1, 2 ,
  • DU Debin , 1, 2, * ,
  • LIU Chengliang 2 ,
  • Seamus GRIMES 3
Expand
  • 1. School of Urban and Regional Science, East China Normal University, Shanghai 200062, China
  • 2. Institute for Innovation and Strategic Studies, East China Normal University, Shanghai 200062, China
  • 3. Whitaker Institute, National University of Ireland, Galway, Ireland

Author: Duan Dezhong (1989-), PhD, specialized in city and regional innovation. E-mail:

*Corresponding author: Du Debin (1963-), Professor, specialized in world geography and technological innovation. E-mail:

Received date: 2015-12-22

  Accepted date: 2016-01-20

  Online published: 2016-12-20

Supported by

National Natural Science Foundation of China, No.41471108, No.41501141

Copyright

Journal of Geographical Sciences, All Rights Reserved

Abstract

In today’s world, the innovation of science and technology has become the key support for improving comprehensive national strength and changing the mode of social production and lifestyle. The country that possesses world-class scientific and technological innovation cities maximizes the attraction of global innovation factors and wins a strategic initiative in international competition. Based on the urban zip code geodatabase, an evaluation system of urban innovation with the perspective of innovation outputs, and the spatial evolutionary mode, concerning the structure of innovation space of Shanghai and Beijing from 1991 to 2014, was developed. The results of the research indicated that the zip code geodatabase provided a new perspective for studying the evolving spatial structure of urban innovation. The resulting evaluation of the spatial structure of urban innovation using the urban zip code geodatabase established by connecting random edge points, was relatively effective. The study illustrates the value of this methodology. During the study period, the spatial structure of innovation of Shanghai and Beijing demonstrated many common features: with the increase in urban space units participating in innovation year by year, the overall gap of regional innovation outputs has narrowed, and the trend towards spatial agglomeration has strengthened. The evolving spatial structure of innovation of Shanghai and Beijing demonstrated differences between the common features during the 25 years as well: in the trend towards the suburbanization of innovation resources, the spatial structure of innovation of Shanghai evolved from a single-core to a multi-core structure. A radiation effect related to traffic arteries as spatial diffusion corridors was prominent. Accordingly, a spatial correlation effect of its innovation outputs also indicated a hollowness in the city center; the spatial structure of innovation of Beijing had a single-core oriented structure all the way. Together with the tendency for innovation resources to be agglomerated in the city center, the spatial correlation effect of innovation outputs reflected the characteristics of the evolutionary feature where “rural area encircles cities”. The innovation spatial structure of Shanghai and Beijing have intrinsic consistency with the spatial structure of their respective regions (Yangtze River Delta urban agglomeration and Beijing-Tianjin-Hebei metropolitan region), which suggested that the principle of proportional and disproportional distribution of a city-scale pattern of technological and innovational activities is closely related to its regional innovation pattern.

Cite this article

DUAN Dezhong , DU Debin , LIU Chengliang , Seamus GRIMES . Spatio-temporal evolution of urban innovation structure based on zip code geodatabase: An empirical study from Shanghai and Beijing[J]. Journal of Geographical Sciences, 2016 , 26(12) : 1707 -1724 . DOI: 10.1007/s11442-016-1354-4

1 Introduction

Nowadays, technological innovation has become the main support of comprehensive national strength and a powerful driver of production mode and lifestyle transition. Any country that possesses a world-class innovation city will be most capable of attracting global innovation elements to obtain a strategic initiative in international competition (Du, 2015). Since the 21st century, a new wave of scientific and technological innovation has been in the ascendant and the world political and economic landscapes have been changing rapidly: the global high-end production factors and innovation elements have been accelerating the transfer to the Asia-Pacific region, and the global pattern of scientific and technological innovation is showing a shifting trend from the West to the East. Compared to other countries in the Asia-Pacific region, and as the largest country in Asia and the world’s second largest economy, China possesses more resources and a wider market to become the global technology innovation center (Du, 2014; Du et al., 2015). According to the Innovation Cities™ Index (2009-2014), Shanghai has risen from being a Hub City in 2009 to being a Nexus City in 2014; Beijing has also risen from being a Node City in 2009 to being a Hub City in 2014. With the increase in innovation strength, Shanghai, Beijing and other Chinese mainland cities are increasingly playing a more important role in the global innovation city network.
Since Schumpeter first introduced innovation theory from the perspective of economics, the discussion on innovation has been continuously debated. Due to the increasingly obvious spatial trends of Humanities and Social Science and the increasingly mature spatial econometric analysis methods based on GIS, spatial research on innovation has become a key focus of many scholars, and includes the following topics: (1) Spatial distribution of innovation activities. The research scale ranges from county, city, provincial to the national level and the research methods are focused on
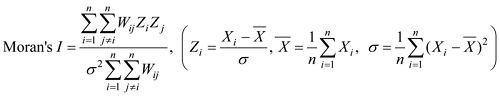
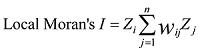
 Moran’s I Index, Location Gini Coefficient, Lorenz Curve, Variation Coefficient and other statistical methods. All the results revealed that innovation activities were highly concentrated and spatially imbalanced, revealing a scale-free property in the spatial distribution of innovation activities (Lim, 2003; Zhang et al., 2007; Liu, 2010; Wang et al., 2014; Jiang, 2014). (2) Spatial spillover effects of regional innovation. It was discovered that there was a significant spatial correlation in terms of innovation among regions (Moreno et al., 2005; Su, 2006; Zhang, 2013; Guastella et al., 2015). Unlike the scale-free dependency of spatial distribution of innovation activities, there was a certain degree of spatial limitations in knowledge spillovers (Lei Liang, 2015). (3) Influencing mechanism of the spatial distribution difference of innovation activities. Research in this area mainly established a regression model taking the innovation outputs or innovation efficiency as the dependent variable to reveal the factors influencing the spatial differences of innovation, which included innovation policy, foreign direct investment (FDI), enterprise scale, the industrial clusters and innovation environment, etc. (Geroski, 1990; Yu et al., 2007; Fan et al., 2013; Li et al., 2013; Felsenstein, 2015). (4) Spatial evaluation of innovation strength and efficiency. Studies on the evaluation of regional innovation strength are mainly carried out by constructing a comprehensive evaluation and analysis model based on a series of evaluation index systems to explore the spatial differentiation between cities, regions or provinces (Tao, 2013; Fang et al., 2014; Makkonen et al., 2014). Research on regional innovation efficiency was usually conducted from the input-output view to compare the efficiency of innovation activities at different spatial scales (Wang et al., 2011; Chen et al., 2012; Fan et al., 2013; Cheng et al., 2014). (5) Collaborative research on innovation and regional development. The driving effect of innovation on economic development has caught a large number of scholars’ attention since the 1990s. On the basis of a comprehensive evaluation of regional innovation strength and economic development level, a series of relational models were used to study the response and matching degree in space between regional innovation and its socioeconomic development (Wang, 1999; Cheng et al., 2011; Niu et al., 2012). (6) Research on innovation links and innovation networks. The research scales concerning this topic were relatively macro, mainly including a country or a city on the global scale and a provincial or a prefecture-level city on the national scale. The research methods and perspectives were mainly on three aspects. The first was to study the spatial location and structure of the global R&D network by taking the global layout of research institutes of the Multi-National Corporation as an example from the perspective of enterprise spatial organization (Zhu et al., 2005; Zhang, 2015). The second was to measure the regional innovation contact intensity and pattern according to the innovation space gravity model based on the evaluation of regional innovation strength (Lyu et al., 2015). The third was to study the structure and spatial complexity of the regional innovation network based on the social network analysis model from the perspective of regional innovation cooperation (Lyu et al., 2014; Li et al., 2015; Li et al., 2015; Berger et al., 2015).
In current innovation spatial research, it is not hard to find that there are three aspects to be carefully discussed. Firstly, medium and macro scale favoritism makes current innovation spatial research unable to sum up the evolution model of innovation space, so the optimization strategies of regional innovation spatial structure are often difficult to implement because of the transboundary nature of administrative jurisdiction. Secondly, when taking the administrative boundary as the research unit, there is no way to avoid the merging problems of statistical data resulting from administrative division reform, and when we look at this issue at the city level, we find that it becomes more serious, because adjustments of administrative divisions within the city are clearly more frequent. Thirdly, difficulties in obtaining statistical data on innovation for counties, streets and towns create obstacles for expanding spatial innovation research to inner city areas faced with great obstacles, resulting in city-scale spatial innovation research having the following features: (1) taking the innovation subjects as research objects and studying their innovation ability, efficiency and the relations among them, such as the enterprises, colleges and universities and other scientific research institutions (Hu et al., 2014); (2) choosing a hi-tech park or a creative industrial park as the example and studying the innovation spillover, innovation efficiency, spatial enterprise organization and its impact on regional economic development of the park (Zhu et al., 2010; Zhou et al., 2011); (3) taking knowledge production as the perspective and studying the city’s innovative functions and urban innovation system (Lyu et al., 2014); (4) taking the urban internal administrative divisions as the space carrier and studying the impact of innovation on economic development (Yang, 2007; Liu, 2010). However, we cannot extricate ourselves from the difficult position of overgeneralization whether taking the innovation subjects or hi-tech parks as the research objects. Even from the perspective of the county, the study of urban innovation still appears to be more macro, thus we cannot interpret the evolution of urban innovation spatial structure.
In general, in order to explore the evolution of a city’s innovation spatial structure systematically, we should overcome the inertia associated with the boundaries of administrative division, so as not to be affected by the discontinuity of statistical data, and we have to move on from the tradition of studying innovation subjects or favoring hi-tech parks, thus having a comprehensive understanding of the spatial agglomeration and diffusion processes of urban innovation. In this context, the zip code geodatabase provides a new perspective for the study of the evolution of urban innovation spatial structure. First, the zip code geodatabase has not changed with the step reforms of administrative divisions, so the spatial data on innovation based on the zip code has a good temporal extension. Second, with a perfect spatial coverage, the zip code geodatabase can reveal the evolving innovation structure of the whole city from a more microcosmic perspective. Third, there is a good correlation between the zip code and the innovation data, especially when using papers and patents as the outputs of innovation. Therefore, in order to provide a new perspective to explore the mechanism underlying the spatial structure of urban innovation and to provide a reference for the implementation of urban innovation space optimization policy, this paper constructs an evaluation index system of urban innovation outputs based on the urban zip code from the perspective of innovation outputs to research the model of evolving urban innovation structure in Shanghai and Beijing.
To this end, the remainder of this paper is organized as follows. Section 2 describes the data and methodology. In Section 3, the spatial pattern and the model of evolving urban innovation structure in Shanghai and Beijing are shown. Section 4 reveals the spatial correlation and agglomeration evolution of urban innovation structure in Shanghai and Beijing. Section 5 ends with a main conclusion and lists future tasks.

2 Research methods

2.1 Zip code geodatabase

Based on the zip code data in China Post Media Data Center, this paper takes the unit addresses of each zip code as the modified basis to construct the zip code geodatabase of Shanghai and Beijing (Shanghai city has 249 pieces of zip code, Beijing has 239) ( The detailed method is to determine a zip code area by connecting edge points. First, randomly selecting 10% unit addresses of each zip code, then marking them on Baidu Map. Secondly, connecting the points to determine the zip code area. Thirdly, randomly selecting 5% from the remaining units for checking, if they are all in this region, the range will be regarded as the area that is represented by the zip code; if some codes are out of the edge line, then repeating the connection and correction steps until they are all in the range. Finally, based on the ArcGIS spatial analysis platform, taking the geometric center points of each zip code area as the actual distribution points of the zip code so as to construct the encoding spatial point geodatabase of zip code.). And we use the Tyson Polygon Method to construct the spatial point database of zip code (Figure 1), to realize an effective, comprehensive and continuous evaluation of city innovation from the angle of internal urban space.
Figure 1 Zip code geodatabase of Shanghai and Beijing

2.2 Evaluation index system and the city profile

Scholars had different opinions on the evaluation index system of urban innovation. Limited from obtaining the innovation statistical data, most scholars used the patent data (application or authorization) to measure city or regional innovation capability from the perspective of innovation outputs (Zhang et al., 2007; Liu, 2010; Jiang, 2014; Wang et al., 2014). But there remain a few scholars that tried to build a comprehensive evaluation system of urban innovation including innovation input, innovation outputs, innovation environment, and other aspects through field survey, telephone consultation and other means to obtain a detailed account of the innovative data (Fan et al., 2013; Tao et al., 2013; Cheng et al., 2014; Fang et al., 2014). Compared with those individual scholars lacking funding and data, the innovation strength of evaluation systems developed by think tanks or decision-making consultancies with strong financial support was much greater, such as 2thinknow, the Australian think tank constructed an assessment system for global innovation city made up of 162 indicators including cultural assets, human capital, networked market and authorization on patents (Fang et al., 2014).
In the process of building the evaluation system of urban innovation, this paper found out that only the indexes of papers and patents of the innovation outputs can be used to identify the zip code. Despite their small proportion in the evaluation index of urban innovation strength, they have been used by many scholars to evaluate the innovative ability of the city or region, especially since patent remains the most appropriate and typical index to describe knowledge innovation (Cheng et al., 2014). As for papers, scholars used “Number of Papers Published” consistently as an evaluation indicator (Hu et al., 2014). However, some gaps exist between the application and granting of patents. We should also consider that patent licensing is largely influenced by some artificial factors such as government patent agency, whether the patent is approved or not, the application process of a patent reflects the investment in the early stage. Meanwhile, the number of patent applications can also reflect the innovation activity of a region. Therefore, based on the zip code geodatabase, this paper chose the two indicators of “Number of Papers Issued on Core Magazines” and “Invention Patent Applications” to construct the evaluation system of urban innovation from the perspective of innovation outputs. The core magazines not only include the Source Journals of Chinese Social Sciences Citation Index (CSSCI) and Chinese Science Citation Database (CSCD), but also include the Source Journals of Science Citation Index (SCI) and Social Sciences Citation Index (SSCI). The applications of invention patent include Chinese invention patent applications based on Wanfang Data Knowledge Service Platform and the international patent applications represented by PCT of the World Intellectual Property Organization (WIPO).
From 1991 to 2014, with the increasing number of urban zip code districts participating in innovation, the innovation outputs of Shanghai and Beijing also shows a rising trend. The total number of the papers issued on CSSCI and CSCD in Shanghai is 1,017,772; the average annual growth rate is 43.87%. The papers published on SCI and SSCI numbered 110,991, with the average annual growth rate of 341.40%. The number of Chinese invention patent applications is 235,721, and the international is 12,986, with an average annual growth rate of 1965.48%. Over the same period, the number of Chinese core papers in Beijing was 1,625,723, and the number of foreign core papers was 270,875. Both are far more than Shanghai, but the average annual growth rate was lower than Shanghai, respectively, 41.54% and 299%. In addition, during 1990-2014, the numbers of Chinese invention patent applications in Beijing was 292,167, and international was 16,505, both being higher than Shanghai. While the average annual growth rate of international invention patent applications is also lower than that of Shanghai, the rate of Chinese invention patent applications was higher than Shanghai (303.69%) by nearly 140% (Table 1).
Table 1 Overview of papers and patents for invention of Shanghai and Beijing
City Indicators 1991-1995 1996-2000 2001-2005 2006-2010 2011-2014 Total
Shanghai Number of zip code areas participating in innovation 170 228 246 249 248 /
Papers issued on CSSCI and CSCD 26381 83892 243529 359804 304166 1017772
Papers published on SCI and SSCI 527 3628 16695 46434 43707 110991
Chinese invention patent applications 1539 6874 28324 85273 113711 235721
International patent applications 14 232 2033 4089 6618 12986
Beijing Number of zip code areas participating in innovation 144 179 212 231 236 /
Papers issued on CSSCI and CSCD 42238 118544 343556 658073 463312 1625723
Papers published on SCI and SSCI 2034 8758 30200 81888 147995 270875
Chinese invention patent applications 5521 8496 33985 95389 148776 292167
International patent applications 65 397 1675 5852 8516 16505

2.3 Catastrophe progression method

Using cusp catastrophe model to solve the urban innovation comprehensive index:
where f(x) is the potential function of state variables x; a and b indicate the control variable of the state variable x.
The normalized formula is
Because of the obvious complementarity between selected indicators in this study, we use an average value method to determine the appraised value of each index and the comprehensive evaluation value.

2.4 Spatial autocorrelation analysis

Using global Moran’s I statistics to measure spatial correlated degree of the city’s zip code districts and their neighborhood on innovation outputs, the statistics can be expressed as:
where, n is the number of space units; Wij is the spatial weight matrix; Zi is standardization transformation of Xi (the attribute value of space unit i). The value of Moran’s I ranges from -1 to 1. Tending to 1 indicates the absolute positive spatial correlation; tending to 0 means a random distribution; tending to -1 indicates the absolute negative correlation.
Local indicators of spatial association (LISA) assumes that being adjacent to each other for every space unit helps identify the hot spots of innovation input and outputs. The statistics can be expressed as:
The positive values indicate the same type of elements is adjacent; the negative value indicates that different types of elements are adjacent, and the greater the absolute value of the numerical value is, the greater the spatial proximity is.

3 Spatial evolution pattern of urban innovation outputs

3.1 Statistical commonality of Shanghai and Beijing

To describe the statistical distribution features of the urban innovation outputs clearly, this paper introduces the Range method (R), the Standard Deviation (S-D), the Variation Coefficient (V-C) and the Gini Coefficient (G-C) based on Global Moran’s I Index (M-I) to explore the distribution of urban innovation outputs. No more calculation methods are listed here due to the universality (Table 2).
Table 2 Statistical characteristics of innovation outputs of Shanghai and Beijing from 1991 to 2014
1991-1995 1996-2000 2001-2005 2006-2010 2011-2014
Shanghai Beijing Shanghai Beijing Shanghai Beijing Shanghai Beijing Shanghai Beijing
R 2.035 2.492 2.695 3.019 3.873 3.699 3.507 4.457 4.223 5.049
S-D 0.536 0.665 0.561 0.727 0.616 0.836 0.658 0.945 0.644 0.936
V-C 0.900 1.043 0.621 0.870 0.462 0.743 0.390 0.645 0.353 0.601
G-C 0.502 0.570 0.345 0.486 0.251 0.412 0.215 0.359 0.194 0.334
M-I 0.383 0.519 0.496 0.547 0.562 0.627 0.604 0.733 0.565 0.727
During the last 25 years, the R and S-D of innovation outputs both in Shanghai and Beijing have expanded year by year. Respectively, the range of which have risen from 2.035 and 2.492 in 1991 to 4.223 and 5.049 in 2014; the standard deviation of which have risen from 0.536 and 0.665 in 1991 to 0.644 and 0.936 in 2014. These values show that with the rising strength of urban innovation and the increasing number of spatial units that participate in urban innovation, the statistical characteristics of urban innovation outputs present a severe shock trend. Although the weak will not be weaker, the rich gets richer.
During the last 25 years, the V-C and G-C of innovation outputs both in Shanghai and Beijing showed a downward trend, in which the V-C decreases from 0.900 and 1.043 in 1991 to 0.353 and 0.601 in 2014 respectively; the G-C decreases from 0.502 and 0.570 to 0.194 and 0.334, which shows that in the expanding process of innovation outputs in Shanghai and Beijing, the statistical distribution of innovation outputs presents a trend from a low level of agglomeration to optimized and balanced development.
From 1991 to 2014, the M-I of Shanghai and Beijing are higher than 0, showing a general ascending trend, respectively rising from 0.383 and 0.519 in 1991 to 0.565 and 0.727 in 2014. In both cities, innovation outputs had significant positive correlations in space, and presented a strongly concentrated spatial pattern. It is worth mentioning that, although the two cities showed a continuous increase in the spatial polarization trend, the degree of polarization in Beijing is more significant. Besides, the index values are higher than Shanghai in all five periods. Compared with Beijing, Shanghai’s decentralized agglomeration trend of innovation outputs spatial patterns has been highlighted.

3.2 The evolution pattern of urban innovation spatial structure in Shanghai

Although the spatial agglomeration of innovation outputs in Shanghai has been reinforcing, it has been split up and reconfigured under the influence of the suburbanization transfer of innovation resources, especially universities and research institutions. The overall pattern of urban innovation spatial structure in Shanghai has shown a trend of moving to east and south, which was specifically demonstrated by the evolving mode of single-core drive to multi-core and multi-axis drive under the core-periphery structure. Meanwhile, with the continuous optimization of traffic network structure, the corridor diffusion mechanism of Shanghai innovation outputs has been highlighted (Figure 2).
Figure 2 Spatial differentiation of innovation outputs of Shanghai and Beijing from 1991 to 2014

Note: on the left is Shanghai, and on the right is Beijing

During the period from 1991 to 1995, the highest value areas of innovation outputs in Shanghai basically gathered in the main city area, especially in Puxi Urban Area surrounded by South Zhongshan Rd, West Zhongshan Rd, North Zhongshan Rd, Handan Rd, Xiangyin Rd, Jungong Rd, Liping Rd, Yangshupu Rd, Mingda Rd and East Zhongshan Rd, includeing the Wujiaochang Area based on Fudan University and Tongji University, the Caohejing Area centered on Shanghai Normal University, East China University of Science and Technology and Caohejing Hi-tech Development Zone, the Hongqiao Area focused on Hongqiao Development Zone, Donghua University and Shanghai Engineering Technology Science University, the Xujiahui Area based on Shanghai Jiaotong University, Shanghai University of Traditional Chinese Medicine, Engineering College of Shanghai University and Medical College of Fudan University, the Jing-An Temple Area cored on Tongren Hospital, Huashan Hospital and Huadong Hospital, etc. At the same time, some Shanghai suburbs also grew some extreme values with a point distribution, such as Baoshan Town, Waigaoqiao Free Trade Zone, Songjiang Industrial Zone, Nanhui Industrial Park and Jiading Industrial Zone.
From 1996 to 2000, the spatial distribution pattern of innovation outputs in Shanghai was a continuation of the previous stage, basically showing a core-periphery structure. And the extreme value areas of innovation outputs were still within the Middle Ring. But compared with the previous stage, the urban spatial units participating in innovation had increased rapidly from 170 to 228. The corridor diffusion mechanism of urban innovation had initially developed, with obvious dependence on urban traffic trunks, such as the diffusion channel composed by Humin Rd and Provincial Rd 103 from downtown to Minhang District and Jinshan District, the diffusion channel dependent on Humin Rd, Provincial Rd 103 and Nanfeng Rd from downtown to Minhang District, Fengxian District and Nanhui District, the diffusion channel dependent on Shanghai-Hangzhou Highway from downtown to Songjiang District and Fengjing Town, the diffusion channel relied on Shanghai-Nanjing Highway and Huqingping Rd from downtown to Qingpu District and Jinze Town, the diffusion channel constituted by Shanghai-Jiading Highway and Hutai Rd from downtown to Jiading District, the diffusion channel dependent on Hunan Rd from downtown to Zhangjiang Town and Nanhui District, and the diffusion channel dependent on Pudong Avenue from downtown to Jinqiao Export Processing Zone and Waigaoqiao Port Area.
From 2001 to 2005, the spatial distribution pattern of innovation outputs in Shanghai began to show a differentiation trend. The extreme value area of the innovation outputs concentrated within the Middle Ring had been split up into two areas due to the emergence of the fault zone based on Suzhou River, one was the Hongkou-Yangpu Area with Wujiaochang as the core; the other was the Changning-Xuhui Area based on Xujiahui, Caohejing and Hongqiao Area. With the implementation of the strategy of Focusing on Zhangjiang proposed by Shanghai Municipal Government in 1999 and the establishment of Shanghai International Medical Zone in 2003, Zhangjiang Hi-tech Park had become a new growth pole of Shanghai innovation outputs, and formed the innovation outputs’ intensive area in Pudong New Area together with the Jinqiao Export Processing Zone. At the same time, due to the connection of Metro Line 1 and Line 5, the diffusion effects based on traffic corridors had been fully reflected at this stage. The regional innovation outputs along Metro Line 5 grew significantly, especially Beiqiao Town in Minhang District, had become another extreme area of Shanghai innovation outputs. In addition, driven by the beltway, the circle diffusion effect in Shanghai innovation outputs appeared, forming a ring zone of high value areas of innovation outputs.
From 2006 to 2010, with the increasing differentiation of Shanghai’s innovation outputs spatial distribution, the fault zone in the last stage expanded into a swathe of innovation outputs within the Middle Ring. Meanwhile, in the background of a continuously polarizing Hongkou-Yangpu high intensity area located at the north of the Suzhou River, the internal differentiation of Changning-Xuhui high intensity area located at the south of the Suzhou River occurred again. It had been divided into three groups of Caohejing, Xujiahui, and Hongqiao. With the successful development of Minhang Campus of Shanghai Jiaotong University, Minhang Campus of East China Normal University and Zizhu Hi-tech Park, innovation outputs extremum area in Minhang District had extended from Beiqiao Town to Tangwan Town and Wujing Town along the Huangpu River. During this period, under the development strategy of allocating innovation resources from a global perspective, Zhangjiang Hi-tech Park attracted a large number of well-known domestic and foreign enterprises, especially Multi-National Corporation R&D centers, such as GE, Roche, Novartis, Honeywell, etc. Among them, many R&D centers have been upgraded to Global R&D Centers. The continuous expansion of innovation outputs contributed to a radiation effect rising rapidly. Thus Zhangjiang Hi-tech Park became the dominant spatial unit of Shanghai’s innovation outputs. Besides, Songjiang University City entered a period of rapid development from the initial stage. With the joint efforts of all universities in the University City, innovation outputs increased year on year, and Songjiang University City became a high intensity value area of Shanghai’s innovation outputs. On the whole, the zero value areas in blocks of Shanghai had basically ceased to exist during this period, with Chongming Island becoming a new colony.
During the final stage from 2011 to 2014, the multi-core structure of Shanghai’s innovation outputs deepened, innovation activities were substantially transferred from inside to outside of the Middle Ring, and the spatial structure led by Central City basically collapsed. Whereas an oblique “W-shaped” pattern of multi-core structure of Shanghai’s innovation outputs formally came into being, Songjiang University Town, Zizhu Hi-tech Park, Xujiahui-Caohejing-Hongqiao Area, Zhangjiang Hi-tech Park and Wujiaochang Area were the five inflection points of the oblique “W-shaped” pattern of the multi-core structure. In this process, optimization of traffic flows played a very important role, because it was the expressways that connected the inflection points, such as the Shanghai-Jiaxing-Huzhou Expressway connecting Songjiang University Town and Zizhu Hi-tech Park, the Shanghai-Jinshan Expressway connecting Zizhu Hi-tech Park and Xujiahui Area, the Outer-Ring Expressway connecting Xujiahui Area and Zhangjiang Hi-tech Park, the Middle-Ring Expressway connecting Zhangjiang Hi-tech Park to Wujiaochang Area. Of course, the surrounding areas of these rapid transit corridors naturally became high value areas of innovation outputs.

3.3 The evolution pattern of urban innovation spatial structure in Beijing

Limited by terrain and under the continuous strengthening of spatial polarization trends, the spatial structure of innovation outputs in Beijing has basically been locked into a core-periphery structure led by downtown areas in the past 20 years. Innovation activities continued to occupy the space of downtown. During the gathering process of innovation activities, the urban innovation border gradually became clear (Figure 2).
In the first stage (1991-1995), there were only 144 spatial units participating in urban innovation. Like Shanghai, the highest value areas of innovation outputs in Beijing were basically in the main city area, extending from South Fifth Ring Rd to North Sixth Ring Rd. Having a large number of universities (Tsinghua University, Peking University, Renmin University of China, Beijing Jiaotong University, Beijing Normal University, Beijing University of Posts and Telecommunications, Beihang University, University of Science and Technology Beijing, Beijing Institute of Technology, etc.), research institutions (Chinese Academy of Sciences, Chinese Academy of Agricultural Sciences, etc.) and hi-tech enterprises, Haidian District had undoubtedly become the paradise of innovation activities in Beijing. Meanwhile, driven by Changping Park’s Zhongguancun Science Park, Changping County, as the northwest gate of Beijing, had become the innovation outputs’ highest intensity region. And the industrial towns along National Highway 110 have been developed into a high value region. In addition, Fangshan District as the southwest gate, Tongxian County as the east gate, Miyun County and Shunyi County as the northeast gate of Beijing, all became the innovation outputs high value regions due to their location along these traffic routes.
During the second period, after the rapid increase in urban spatial units involved in innovation, the innovation outputs of the city also increased dramatically. Though the spatial structure of innovation outputs in Beijing formed in the first stage was not changed, the innovation activities of the peripheral area in Beijing increased significantly. At the same time, as some quick traffic corridors had opened to traffic, the spatial diffusion effect of innovation outputs in Beijing began to be highlighted, forming several pieces of a spatial radiation channel, such as the diffusion channel composed by Beijing-Shijiazhuang Highway and National Highway 107 from downtown to Fengtai District and Fangshan District, the diffusion channel dependent on Beijing-Shanghai Highway from downtown to Yizhuang Town and Majuqiao Town, the diffusion channel relied on National Highway 101 from downtown to Shunyi District and Miyun District, the diffusion channel relied on National Highway 103 from downtown to Tongzhou District, etc.
After 2001, the spatial structure of innovation outputs in Beijing was basically focused on the core-periphery structure led by downtown. After experiencing the process from diffusion (the tripartite development centered on Zhongguancun from 2001 to 2005) to agglomeration (the One Body and Two Wings Pattern centered on Zhongguancun from 2006 to 2010; a cluster development pattern dominated by Zhongguancun and Asian Games Village from 2011 to 2014), Zhongguancun, the core of innovation outputs’ high intensity area, has gradually deepened its nuclear status. Meanwhile, driven by the Beijing Economic and Technological Development Zone, especially the Yizhuang Hi-tech Park of Zhongguancun, Yizhuang Town has gradually grown into an enclave of extreme value area of innovation outputs in Beijing. And because of the settlement of a large number of universities and research institutions, Tongzhou District has also become a hot spot for innovation activities. However, with the continuously high concentration of innovation resources in Zhongguancun and the Asian Games Village, the spatial diffusion effect of innovation outputs in Beijing has gradually weakened. In contrast, the circle locked-in effect based on Fifth Ring Rd became more prominent. Namely, by occupying a central area constantly, the spatial distribution of Beijing innovation activities has reflected a central gathering pattern with Fifth Ring Rd as the boundary.

4 Spatial correlation of innovation outputs

4.1 Common features of Shanghai and Beijing

The spatial scale dependence of knowledge spillovers and the scale effect of the industrial economy determine that the spatial distribution of innovation activities is bound to follow the law of distance decay, showing an agglomeration pattern around the extreme value of innovation outputs. However, the overall differentiation of innovation outputs can only reflect the two cities’ spatial variation, but cannot uncover the spatial interaction and the correlation intensity. In order to explain the spatial correlation effect of the innovation outputs in Shanghai and Beijing, this paper uses the LISA to classify the spatial correlation and agglomeration evolution of innovation outputs into four types: the first is High-High agglomeration (H-H) where both zip code districts and their neighbors have high outputs of innovation; the second is called High-Low agglomeration (H-L), zip code districts which have high outputs of innovation but with low outputs in their neighboring districts; the third is Low-Low agglomeration (L-L), where both zip code districts and their surrounding districts have low outputs of innovation; the fourth is Low-High agglomeration (L-H), in which zip code districts’ outputs are low but their neighbors’ are high.
During the past 25 years, both in Shanghai and Beijing, the innovation outputs distribution all presents a significant agglomeration effect, the spatial distribution of each type basically tends to flock together. Among them, H-H agglomeration types are distributed as clusters in the downtown of the two cities throughout the study period, showing a property of spatio-temporal inertia. L-L agglomeration types, evolving from dispersed blocks to continuous blocks, are basically gathered in the outer regions of the two cities. L-H agglomeration types are mainly found in the area near H-H agglomeration types, with a sporadic-like distribution. But their territory has been severely eroded, showing a trend towards extinction. H-L agglomeration types are scattered in the surrounding areas of L-L agglomeration types, with a chain-like continuous distribution. However, affected by the transfer of innovation resources, H-L agglomeration types are also close to extinction (Figure 3).
Figure 3 Bivariate LISA cluster map for innovation output of Shanghai and Beijing from 1991 to 2014

Note: the left is Shanghai, and the right is Beijing

4.2 Spatial correlation and agglomeration evolution of Shanghai innovation outputs

From 1991 to 2014, the spatial correlation in Shanghai innovation outputs is significant. Under the migration trend of shifting of innovation resources to east and south, the spatial correlation effects of Shanghai innovation outputs also appear as a central hollow phenomenon (Figure 3). Due to the time-space differences of innovation outputs distribution, the spatial distribution of H-H agglomeration types has differentiated into a dual-core pattern from the single-core pattern led by the downtown, obviously forming two high-value plates: one includes Hongqiao Area, Xujiahui Area, Xinzhuang Area and Zizhu Hi-tech Park; the other is composed of Zhangjiang Hi-tech Park, Jinqiao Export Processing Zone, Wujiaochang Area and Waigaoqiao Area. The region within the Inner Ring Rd has gradually degraded from H-H agglomeration types to types with no characteristics. The growth of L-L agglomeration types shows good spatial dependence, basically distributing in the city suburbs, such as Chongming Island, Qingpu District, Jinshan District as well as Nanhui District. Among these, Chongming Island basically fell into L-L agglomeration types in 2005, and this pattern has not been changed by the end of this study period. Though the number of L-L agglomeration types in Qingpu District and Jinshan District is dereasing year by year, the spatial distribution pattern has experienced an alternate evolution trend from differentiation to agglomeration. The growth of L-L agglomeration types in Nanhui District shows the jumping features in time sequence. In the first, third and fifth stages of this study, there were only a small number of L-L agglomeration types, showing a scattered and dispersed distribution pattern. However, in the second and fourth stages, there was a huge increase in the number of L-L agglomeration types, showing a continuous sheet-like distribution in space. The number and spatial distribution of L-H agglomeration types and H-L agglomeration types are largely influenced by the suburbanization trend of innovation resources. The chain-like encirclement of L-H agglomeration types was gradually broken through by H-H agglomeration types, and basically ceased to exist in 2014. Similarly, the spatial position of H-L agglomeration types continues to retreat from the middle circle to the periphery of Shanghai, and in the evacuation process, the territories of H-L agglomeration types are constantly lost. Towards the end of this research period, H-L agglomeration types are also approaching extinction.

4.3 Spatial correlation and agglomeration evolution of Beijing innovation outputs

Compared with the suburbanization trend of innovation resources in Shanghai, the direction of Beijing’s innovation resources is shifting the other way round, showing a significant polarization trend. During the past 25 years, the spatial agglomeration evolution of innovation resources in Beijing shows a landscape pattern using the rural areas to encircle the cities (Figure 3). H-H agglomeration types gradually shrink towards the inner city. In order to occupy the few blocks of territories of L-H agglomeration types in downtown, H-H agglomeration types would rather sacrifice their outlying areas. And the overall spatial distribution has developed from dispersion in the first stage to blocks in last stage, showing a strong spatial cohesion and an efficient internal innovation spillover mechanism. Relatively, although L-L agglomeration types originated in peripheral areas (such as the West Mountain Area, Jundu Mountain Area and Wuling Mountain Area) and were still in fragmented form in 2000, their spatial growth shows a significant tendency towards the inner city after 2000. Compared with the gigantic and vigorous evolution trend of H-H agglomeration types and L-L agglomeration types, L-H agglomeration types and H-L agglomeration types keep a relatively low profile. In particular, as the frontier battlefield for innovation space competition, not only does the number of L-H agglomeration types decreases, but also their spatial location has also been pushed out of the downtown area. H-L agglomeration types are located in the buffer zone, which is adjacent to L-L agglomeration types. Due to the less creative power of L-L agglomeration types, the treatment suffered by H-L agglomeration types is relatively mild, and the spatial evolution also shows a spatio-temporal stability.

5 Conclusions and discussions

5.1 Conclusions

Having not changed with the adjustment of administrative divisions, zip code geodatabase provides a new perspective to study the spatial structure of urban innovation outputs from the urban internal scale. In this paper, the spatial point data of zip code in Shanghai and Beijing are constructed by randomly connecting edge points and the two cities’ zip code geodatabase are divided by the Tyson polygon method. The results of this paper suggest that these methods are effective and worth spreading.
(1) During the past 25 years, there have been many commonalities in the growth of urban innovation spatial structure between Beijing and Shanghai: on the statistical distribution of urban innovation outputs portrayed by V-C and G-C, both cities show a development trend from low-level agglomeration to optimized balanced distribution; on the oscillation amplitude of urban innovation outputs characterized by R and S-D, both cities present a violent oscillation trend; on the spatial distribution of urban innovation outputs depicted by M-I, both cities show a significantly positive spatial correlation, and the degree of spatial agglomeration has been increasing; on the spatial correlation and agglomeration evolution of urban innovation outputs described by LISA, the spatial distribution of each type basically tends to flock together.
(2) During the past 25 years, there are also many differences in the innovation spatial structure between Beijing and Shanghai: influenced by the suburbanization transfer trend of innovation resources, the overall pattern of urban innovation spatial structure in Shanghai shows a development trend moving to east and south. The detailed performances are that the evolution mode of Shanghai innovation spatial structure has experienced a growth process from single-core driven development to multi-core and multi-axis driven development. Accordingly, the spatial correlation effects of Shanghai innovation outputs appear as a central hollow phenomenon. As for Beijing, limited by terrain and under the continuous strengthening of spatial polarization trends, the spatial structure of innovation outputs has been basically locked into the core-periphery structure led by downtown in the past 25 years, and the spatial agglomeration evolution of innovation resources in Beijing shows a landscape pattern using the rural areas to encircle the cities.
(3) The balanced and non-balanced laws of spatial distribution of innovation activities in the inner city are closely related to the regional (above the city scale) innovation pattern. The balanced development of innovation activities and resources in the Yangtze River Delta urban agglomeration has an endogenous complementarity with the suburbanization trends of Shanghai innovation resources, and the trend of spatial polarization of innovation resources in Beijing-Tianjin-Hebei metropolitan region appears to be clearer in the city of Beijing, which means that the innovation spatial structures between region scale and city scale have an inherent consistency. Compared to the single-core structure in Beijing-Tianjin-Hebei metropolitan region, the coordinated development of urban innovation has made the Yangtze River Delta urban agglomeration more competitive in global science and technology development. According to the Innovation Cities™ Index 2014, Shanghai is the only city in mainland China that sits on the Nexus classification, with a ranking of 35. Moreover, Nanjing, Suzhou and Hangzhou are also on the list, respectively, ranking 127, 182 and 208 in the world. Among them, Nanjing also occupies the hub classification that is the same as Beijing. By contrast, Tianjin, another core city of Beijing-Tianjin-Hebei metropolitan region, always falls behind, with a rank of 234.

5.2 Discussions

Although the spatio-temporal growth patterns of urban innovation spatial structure can be realized by city zip code geodatabase from city internal scale, limited by the caliber and encoding of statistical data, only papers and patents can be identified through searching the zip code. The data comes under the classification of innovation outputs, which limits the focus of this paper to studying the development of urban innovation spatial structure from the perspective of innovation outputs. The city innovation system is a giant and complex system. Although the spatial evolution of urban innovation structure can be explained to some extent from the perspective of innovation outputs, it is still not enough. How to get the best of both sides (research scale and evaluation index) is a subject worthy of further research.
Taking papers and patents as the evaluation indicators, this study acknowledges the key function of universities and research institutions in shaping the spatial structure of urban innovation to a large extent. Applications for invention patents can reflect the effectiveness of enterprises participating in innovation to some extent, but it is not enough. Scientific research is the process of turning money into knowledge, and innovation is the process of turning knowledge into money, which was proposed by Zhang Shousheng, a professor from Stanford University at the Sino-US Startup & Entrepreneur China Media Annual Conference in 2014. So innovation should be a market-oriented behavior, and enterprises should become the dominant actors in innovation. Therefore, how to construct the spatial database including the innovation ability of the enterprise based on zip code is a problem worthy of further consideration.

The authors have declared that no competing interests exist.

1
Berger L, Benschop Y, van den Brink M, 2015. Practising gender when networking: The case of University-Industry Innovation Projects.Gender Work and Organization, 22(6): 556-578.This paper gains insight into the role of gender in interpersonal networks, which is largely neglected in research on networking. We do so by exploring the concept of ractising gender , the spatial-temporal accomplishment of gender practices, when people build, maintain and exit social networks. The paper is based on a study of male-dominated technological collaboration projects between universities and industry. Our analysis of observations of project meetings and interviews with project participants demonstrates how people in real time and space draw from culturally available gender practices in their networking with each other. This practising of gender was found to be done largely unreflexively, sometimes through humour, within allegedly trivial activities such as pouring coffee and socializing as well as in critical activities such as composing the network. The exploration of the practising of gender in relation to culturally available gender practices enabled us to examine how those gender practices are reproduced, stretched or challenged when people network. We show how focussing on the dynamic side of gender allows us to get better insight into how gender inequalities in networks are reproduced or countered on the micro-interactional level.

DOI

2
Cheng Hua, Liao Zhongju, Dai Juanlan, 2011. The research on the coordination between China regional environment innovation ability and economy development.Economic Geography, 31(6): 985-991. (in Chinese)Based on the clear definition of the concept of environmental innovation ability,this paper further discusses the formation mechanism of environmental innovation ability,and chooses the 22 indexes to constitute the regional environmental innovation ability theory evaluation index system.Using factor analysis to evaluate and analyze 30 provinces and autonomous regions' environmental innovation ability and economic development level,and then using Set Pair Analysis to study the coordination between environment innovation ability and the regional economic development.The result shows that the overall environmental innovation ability and economic development present strong coordination.

3
Cheng Yeqing, Wang Zheye. Ma Jing, 2014. Analyzing the space-time dynamics of innovation in China.Acta Geographica Sinica, 69(12): 1779-1789. (in Chinese)Through an integration of exploratory spatial data analysis (ESDA) and confirmatory spatial data analysis (CSDA), this study examines the space-time dynamics of regional innovation at the provincial scale in China from 2000 to 2011. The results show that: firstly, since the implementation of national innovation strategy, the annual growth ratio of innovation outputs of the provinces in China has experienced a drastic process of acceleration, which suggests the overall improvement of regional innovation capabilities. However, an overwhelming status in growth rate still belongs to eastern region, leading to the rise of the coastal-interior division and the divergence among regions, and regional innovation in China may fall into the "Matthew Effect" that the strong will become stronger and the weak will be constantly weaker. Secondly, regional innovation outputs and inputs in China experience an increasing change of spatial clustering over time. Various types of hot spots are identified over time, revealing that innovation hot spots overlay well with other variables. Finally, the selected explanatory variables, such as GDP, RDE, RDP and PCH, have significant direct impacts on provincial innovation in China. There exist obvious spatial spillover effects in provincial innovation activities, and the geographic region of which has crossed the provincial border. The spatial dependence of innovation activities gives rise to the feedback among the provinces, and the acknowledge spillover of adjacent province have material influence on a specific province.

DOI

4
Chen Xiuying, Chen Ying, 2012. The regional differences of science and technology resources and the allocation efficiency evaluation in Zhejiang province. Scientia Geographica Sinica, 32(4): 418-425. (in Chinese)Science and technology resources are the foundation of science and technology activity, the main factor that creating science and technology achievements and pushing the whole economic and social development. In this article, we make use of the principal composition analysis to evaluate the stock of science and technology resources between every prefecture-level city in Zhejiang Province first, and use the ArcView to analyze the science and technology resources distribute condition. Then, we use Data Envelopment Analysis (DEA) to evaluate the allocation efficiency of science and technology resources between every prefecture-level city in Zhejiang Province. Finally, Cobb-Douglas production function and the Solow residual value method were used to calculate the contribution rate of every city-level scientific and technological progress for economic development. The results showed that: 1) In the northeastern Zhejiang, science and technology resources and the contribution rate of scientific and technological progress should be significantly higher than that in southwestern Zhejiang, while cities inside the northeastern Zhejiang, southwestern Zhejiang there is also a greater difference. The amount in storage of science and technology resources of Hangzhou, Ningbo, Shaoxin was ranked front three. Lishui and Quzhou have the least resources in Zhejiang Provence. 2) The science and technology resources of Hangzhou, Jiaxing, Shaoxing, Jinhua, Lishui and Zhoushan are more efficient allocated, while Ningbo, Wenzhou, Huzhou, Quzhou, Taizhou are inefficient, and the efficiency of the management and the allocation efficiency of science and technology resources needs to be improved in these areas. 3) The contribution ratio of science and technology progress of Hangzhou is the highest-level, the second is Ningbo and the third is Shaoxing City. The lowest were Quzhou, Lishui and Zhoushan. The contribution ratio of science and technology progress in the northeast was lower visibly than the sourthwest of Zhejiang. At the same time, there was biggish discrepancy between two regions, Hangzhou was the most efficient but Zhoushan, Jiaxing and Huzhou were the most inefficient in the northeastern Zhejiang. The contribution ratios of science and technology progress of Quzhou and Lishui was far below that of Wenzhou City. At last, we make a number of advises for upgrading technological level and promoting economic development. In the first place, we should increase the input of science and technology appropriations and establish the pluralistic iuput system. Secondly, we should set up and upgrading safeguard mechanisms of introduction of talents. Thirdly, we should make the market system be perfected and energetically promote the industrialization of scientific results.

5
Du Debin, 2014. The eve of a major reshuffle: Asia, the destination of the fifth transnational shifting of global innovation resources. Shanghai: Oriental Morning Post, 2014-10-14. (in Chinese)

6
Du Debin, 2015. Global S&E Innovation Center: Motivation and Model. Shanghai: Shanghai People’s Publishing House. (in Chinese)The panoply of microorganisms and other species present in our environment influence human health and disease, especially in cities, but have not been profiled with metagenomics at a city-wide scale. We sequenced DNA from surfaces across the entire New York City (NYC) subway system, the Gowanus Canal, and public parks. Nearly half of the DNA (48%) does not match any known organism; identified organisms spanned 1,688 bacterial, viral, archaeal, and eukaryotic taxa, which were enriched for harmless genera associated with skin (e.g., Acinetobacter ). Predicted ancestry of human DNA left on subway surfaces can recapitulate U.S. Census demographic data, and bacterial signatures can reveal a station history, such as marine-associated bacteria in a hurricane-flooded station. Some evidence ofpathogens was found ( Bacillus anthracis ), but a lack of reported cases in NYC suggests that the pathogens represent a normal, urban microbiome. This baseline metagenomic map of NYC could help long-term disease surveillance, bioterrorism threat mitigation, and health management in the built environment of cities.

DOI PMID

7
Du Debin, Duan Dezhong, 2015. Spatial distribution, development type and evolution trend of global S&E innovation center.Shanghai Urban Planning Review, (1): 76-81. (in Chinese)

8
Fan Bonai, Duan Zhongxian, Jiang Lei, 2013. The effect and spatial-temporal differences of Chinese independent innovation policy: Evidences from provincial panel data.Economic Geography, 33(8): 31-36. (in Chinese)The paper has used panel data model to do an empirical analysis on the data which was selected from 31 provinces in China during the period of"10th Five-Year Plan"and the"Eleventh Five-Year".An independent innovation policy type proposed by Rorhwell and Zegveld was selected as the explanatory variables and the indicator named successful domestic patent applications was granted into an explained variable,and FDI was used as a control one.A panel data model was used to test it including 31 provinces in the past 10 years divided into 2 periods.The result shows that,in a long term,some policies for the promotion of independent innovation have achieved positive results,such as supply policy,demand policy and infrastructure policies,but the effects of environmental policy is less stable;As for different development stages,different independent innovation policies has obvious differences in effect,and supply policy was the only policy which has played a significant positive effect in the"10th Five-Year Plan"period,while the supply policy,demand policy and infrastructure policies all achieved positive effects during the period of the"Eleventh Five-Year".Supply policy has strongest positive effect in the east,and the positive effects of the demand-side policies perform more significant in the eastern and western,while the negative effects of environmental policy is the most significant in the eastern and central parts,and the positive effects of infrastructure policy is more significant in the eastern and central.

9
Fan Fei, Du Debin, Li Heng et al., 2013. Spatial-temporal characteristics of scientific and technological resources allocation efficiency in prefecture-level cities of China.Acta Geographica Sinica, 68(10): 1331-1343. (in Chinese)The scientific and technological (S&T) resources allocation efficiency of China's 286 cities at prefecture-level during 2001-2010 is measured from both input and output perspectives in this paper. From an input perspective, employees in scientific research and technical services (ten thousand persons), financial expenditure on science (ten thousand yuan), total social investment in fixed assets (a hundred million yuan) and the number of Internet users (household) represent scientific human resources, scientific financial resources, scientific material resources and scientific information resources respectively, while the number of scientific thesis and the numbers of three types of patents which can be retrieved represent the output of technological resources allocation efficiency. The S&T resources allocation efficiency of each city is calculated by the improved data envelopment analysis (DEA) in different periods, while differences of distribution and change rule of it are revealed from spatial and temporal dimensions. Based on this, the spatial-temporal distribution pattern and evolution trend of S&T resources allocation efficiency in prefecture-level cities during the research period are analyzed and discussed with the method of exploratory spatial data analysis (ESDA). The results show that: (1) the average allocation efficiency of S&T resources in prefecture-level cities has been at low level, decreasing annually in a process of high-low crisscross, and the gap between the eastern and central-western China gradually expands. (2) In the aspect of spatial distribution, S&T resources allocation efficiency in prefecture-level cities remains unevenly distributed, and basically presents downtrend from East China, Central China to West China. The cities whose S&T resources allocation efficiency is at high level and higher level present a cluster distribution, which fits well with the 23 forming urban agglomerations in China. (3) In terms of spatial evolution trend, S&T resources allocation efficiency of prefecture-level cities illustrates significant spatial autocorrelation and has positive correlation in every stage. The S&T resources allocation efficiency of adjoining cities with similar values (high-high or low-low) is featured by spatial agglomeration. The phenomenon of spatial distribution agglomeration is gradually increasing, while the general geographic difference changes in the trend of diminishing. (4) By observing the LISA map of S&T resources allocation efficiency at different stages, we can find that the spatial location and spatial agglomeration range of four agglomeration types of S&T resources allocation efficiency have changed in different degrees with the elapse of time. The geographical space continuity of S&T resources allocation efficiency progressively enhances. (5) Economic development has been found to be positively correlated with S&T resources allocation efficiency to some extent. However, the improvement of S&T resources allocation efficiency does not depend only on economic development. The differences of S&T resources allocation relative efficiency appears universally. Geographic location, S&T resource endowment, innovation environment and other aspects are directly and indirectly influencing and reflecting the existence and evolution of those differences.

DOI

10
Fang Chuanglin, Ma Haitao, Wang Zhenbo et al., 2014. Comprehensive assessment and spatial heterogeneity of the construction of innovative cities in China.Acta Geographica Sinica, 69(4): 459-473. (in Chinese)Innovative cities are not only important basis for innovation activities, but also play a strategically critical role in constructing an innovative country. Meanwhile, the development of innovative cities can meet the urgent requirements of setting new forms of urban development and fostering the urban sustainable development. Currently, China is marching toward the goal of establishing an innovative country by 2020, but the start-up phase of innovative cities construction cannot realize the fundamental transition from factor driven development to innovation driven development, which means that there is a wide gap between China's innovative cities and the advanced innovative cites. Constructing innovative cities confronts with some bottlenecks like investments, income, techniques, contributions and talents. This article takes 287 prefecture-level cities as the object of comprehensive assessment. With the method of comprehensive assessment system of innovative cities and innovative monitoring system software, this article evaluates the current situation of innovative city construction from four aspects, namely independent innovation, industrial innovation, living environmental innovation and institutional innovation, and analyzed the characteristics of spatial heterogeneity of innovative cities construction. The results are as follows. The level of innovation of Chinese cities is low, and building an innovation-oriented country is difficult. Some 87.8% of cities are lower than the national average of comprehensive level of innovation. The level of city's comprehensive innovation has close and positive correlation with economic development. The level of the eastern region of China is significantly higher than that of the central and western regions. The levels of urban independent innovation, industrial innovation, habitat of environmental innovation and institutional mechanisms innovation show consistent spatial heterogeneity law with the city's comprehensive level of innovation. In the future, China should speed up the construction process in accordance with the basic principles of "independent innovation, breakthroughs in key areas, market-driver, regional linkage, personnel support". The purpose is to build Beijing, Shenzhen, Shanghai, Guangzhou into global innovation centers, to build Nanjing, Suzhou, Xiamen, Hangzhou, Wuxi, Xi'an, Wuhan, Shenyang, Dalian, Tianjin, Changsha, Qingdao, Chengdu, Changchun, Hefei, Chongqing into national innovation centers by 2020, through which China will finally build a national urban innovation network that includes 4 global innovative cities, 16 national innovative cities, 30 regional innovative cities, 55 local innovative cities, and 182 innovation-driven development cities and contributes to the establishment of an innovative country by 2020.

DOI

11
Felsenstein D, 2015. Factors affecting regional productivity and innovation in Israel: Some empirical evidence.Regional Studies, 49(9): 1457-1468.Entrepreneurship in the northern periphery in Israel should be viewed as a response to the crisis in rural agriculture during the 1980’s. Most entrepreneurs left their farms for salaried employment fo

DOI

12
Geroski P A,1990. Procurement policy as a tool of industrial policy.International Review of Applied Economics, (2): 182-198.Publication » Procurement Policy as a Tool of Industrial Policy..

DOI

13
Guastella G, van Oort F G, 2015. Regional heterogeneity and interregional research spillovers in European innovation: Modelling and policy implications.Regional Studies, 49(11): 1772-1787.Guastella G. and van Oort F. G. Regional heterogeneity and interregional research spillovers in European innovation: modelling and policy implications, . In agglomeration studies the effects of various regional externalities related to knowledge spillovers remain largely unclear. To explain innovation clustering, scholars emphasize the contribution of localized knowledge spillovers (LKS) and, specifically when estimating the knowledge production function (KPF), of (interregional) research spillovers. However, less attention is paid to other causes of spatial heterogeneity. In applied works, spatial association in data is econometrically related to evidence of research spillovers. This paper argues that, in a KPF setting, omitting spatial heterogeneity might lead to biased estimates of the effect of research spillovers. As an empirical test, a spatial KPF is estimated using EU-25 regional data, including a spatial trend to control for unexplained spatial variation in innovation. Accounting for geographical characteristics substantially weakens evidence of interregional research spillovers.

DOI

14
Hu Shuhong, Du Debin, You Xiaojun et al.You Xiaojun ., 2014. Spatial-temporal evolution analysis on knowledge innovation performance of universities in China’s “Growth Triangle Regions”.Economic Geography, 34(10): 15-22. (in Chinese)The right assessment and evaluation is the according for government and university make research program scientifically and distribute science and technology resource rationally. This thesis use Malmquist index to calculate and analysis the efficiency of university knowledge innovation of"Beijing-Tianjin-Hebei Region","Yangtze River Delta","Pearl River Delta","Central Growth Triangle","Western Growth Triangle"and the provinces and municipalities related from 2002 to 2011. The result shows that:(1)Efficiencies are disparity among regions, such as"Yangtze River Delta""Western Growth Triangle"advanced obviously,"Central Growth Triangle"and"Pearl River Delta"is equal, but"Beijing- Tianjin- Hebei Region"is decreased a little while it possesses abundant innovation resource;(2)Technical progress, the national policy, wages, degree of openness of region, and the relation between university knowledge innovation and industries of region can also influence the efficiency.

15
Jiang Tianying, 2014. Spatial differentiation and its influencing factors of regional innovation output in Zhejiang province.Geographical Research, 33(10): 1825-1836. (in Chinese)By general difference index and multiple spatial data analysis such as kernel density estimate, this paper makes an analysis of spatial distribution of regional innovation output and its influencing factors in Zhejiang province. The results are as follows: from 2006 to 2012,there are great differences of regional innovation output in Zhejiang, featured by a slow fluctuated rising trend, which shows an obvious trend of unbalanced development. It is the main stage for the unbalanced development of regional innovation in Zhejiang from 2006 to 2009.The kernel density estimation shows that there are increasing differences in the regional innovation output in this province. The spatial density tends to change from relative equality to polarization. The spatial hot spots of regional innovation output are mainly concentrated in the northern and eastern parts of Zhejiang, while the spatial cold spots are mainly concentrated in the southwest. And what's more, the regional innovation output presents a concentrational trend with Hangzhou, Ningbo and the surrounding counties as the hotspot regions. The overall regional innovation output has its obvious spatial directivity which shows the spatial distribution of being high in the east, low in the west and high in the north, and low in the south. With time going by, the original trend which is high in the middle but low in both ends is gradually replaced by the increasing trend from west to east. Finally, a conclusion can be drawn from the regression analysis that spatial distribution of regional innovation output in Zhejiang is mainly influenced by four factors: economic growth foundation, innovation policies, technology spillover and spatial proximity. In 2006, economic growth foundation, innovation policies and technology spillover have a positive impact on spatial distribution of regional innovation output in this province. Compared with 2006, in 2012, technology spillover, spatial proximity and innovation policies become main factors. Corresponding suggestions are put forward subsequently:(1) promoting the high-tech industry construction actively.(2) formulating the corresponding policies and regulations to ensure that the development of regional innovation is institutionalized and standardized and has its procedures.(3) establishment of high-tech parks within the provincial range.

DOI

16
Lei Liang, Xu Jiqin, Ying Miaohong, 2015. Spatial differentiation and temporal evolution of regional innovation: Taking the counties in Zhejiang province as an example.Science-Technology and Management, 17(1): 24-29. (in Chinese)As regional innovation has been given much concern recently,most studies focus on regional innovation at the national or provincial level while few study the regional innovation at a smaller spatial scale such as counties.This paper analyzes the spatial differences of regional innovation output of 71 counties in Zhejiang province and their changes from 2003 to 2012 by the range analysis,the Lorenz curve analysis and exploratory spatial data analysis( ESDA). The results show that spatial autocorrelation of regional innovation at the county level is stronger than it at the province level. While the Gini coefficient of regional innovation output decreases during the period of 2003 to 2012,the gap among the counties is still very big. We conclude that knowledge spillover has a spatial limitation and it will be discounted if the district cannot absorb the knowledge spilled from the neighbors effectively. The policy maker should illustrate the importance of knowledge spillover while increasing the innovation inputs.

17
Li Dandan, Wang Tao, Wei Yehua et al., 2015. Spatial and temporal complexity of scientific knowledge network and technological knowledge network on China’s urban scale.Geographical Research, 34(3): 525-540. (in Chinese)With the rise of the knowledge-based economy in the 1980 s, knowledge(including code and tacit knowledge) as the backbone of innovation has become a key factor affecting production process. Cities have gathered not only a large number of professionals, universities and research institutions, but also a great many producers and consumers, which provides the premise for the innovation actions. City's knowledge storage and its position in the regional knowledge network play an important role in comprehensive competitiveness. Published papers and patents are main outcomes of innovation, which are used to evaluate the urban innovation capability. Moreover, co- publications and co- patents are not only the form of knowledge spillover, but also the key indicators to measure regional innovation. Taking the co-publication and co-patent in the field of biotechnology in China during 2000-2009 as the original data, we built scientific knowledge network(SKN) and technological knowledge network(TKN)between cities. From the perspective of complex networks and geospatial analysis, we explored the temporal and spatial complexity of knowledge spillovers combining the indicators of whole network structure, ego network, power- law, hubs and so on. The results show that: firstly, the nodes degree distribution of SKN and TKN is consistent with the power- law distribution,which means that the both networks not only have a scale- free network structure, but also present a preferential attachment rule when the cities choose the cooperation partner. Secondly,central cities have an obvious hierarchical structure, and are featured by a "big scattered and small gathering" spatial pattern in SKN, while the TKN is not showing this feature. From the view of central city ego network, the cooperation develops between the coastal capital cities at first, and then turns to inter- regional cooperation, such as Yangtze River Delta, Pearl River Delta, and inter- regional knowledge spillovers is obvious in SKN. The central cities and its partners are still in the coastal city instead of western provincial capitals, and inter- regional knowledge spillovers are not significant in TKN. Thirdly, the temporal evolution of central cities and its ego- network presents hierarchical diffusion and contagious diffusion, and conforms to law of grades process in SKN. The TKN is dominated by hierarchical diffusion.Finally, this study draws conclusions on the temporal and spatial complexity of innovation network, which has a positive impact on quantifying spatial knowledge spillovers and measuring its space- time evolution. Besides, the results clarify the status of each city in innovation networks, which provides a new perspective for the cities to formulate innovative policies.

DOI

18
Li D D, Wei D Y H, Wang T, 2015. Spatial and temporal evolution of urban innovation network in China.Habitat International, (49): 484-496.Scientific and technological knowledge are increasingly becoming predominant in developing regional competitiveness and shaping the role of innovation in development. This paper focuses on the topological and spatial features of urban innovation networks in China. Using published papers and applied patents in biotechnology field from 2000 to 2012, we analyze the evolution of scientific knowledge networks (SKNs) and technological knowledge networks (TKNs). Four major findings are derived: (1) SKNs are much more complicated than TKNs in terms of size, ties, average degree and other indicators; (2) the two networks meet the scale-free networks, and the correlation analysis confirms the preferential attachment and dis-assortative traits in SKNs and TKNs; (3) spatial and temporal evolution of central nodes and networks structure show the hierarchical diffusion and contagious diffusion in both the networks; (4) multi-dimensional proximity (social, organizational, cognitive, geographical) well explains the knowledge spillover and innovation in SKNs, but it fails to explain them in TKNs. Moreover, social and organizational proximity weigh higher than the other two. The central nodes analysis helps cities better understand their position in networks. We find that comparative analysis of SKNs and TKNs contribute to recognizing the gaps of each city in innovation, which could assist in determining urban innovation policy.

DOI

19
Li Jin, Deng Feng, 2013. Research on the influence mechanism of government investment in R&D subsidies on technology innovation output capacity: Empirical analysis based on panel data of 5 high-tech industries.Science & Technology Progress and Policy, 30(13): 67-71. (in Chinese)With the gradual deepening of building an innovative country,Chinese investment in scientific and technological progress has been increased,especially the support efforts on technological innovation capability.In this paper,by introducing the coefficient of degree of government support for firms to the micro-enterprise production function,it discusses its relationship with the new product sales revenue and the patent applications and the new product development projects based on panel data of 5 high-tech industries.Furthermore,it make regression analysis on coefficient with new product revenue and the number of patent applications and the number of new product development projects.It also compares the coefficient with the investment of high-tech enterprise.Finally,it proposes some practical advice according to American experience.

20
Lim U, 2003. The spatial distribution of innovative activity in U.S. metropolitan areas: Evidence from patent data. Journal of Regional Analysis and Policy, 33(2): 84-126.Despite the fact that knowledge spillovers have explicitly geographic components, the role of spatial effects in the knowledge spillover process has been ignored. In this context, the objective of this paper is to observe differences in the spatial distribution of innovative activity across U.S. metropolitan areas, and thereby to examine whether the concentration of innovative activity in a metropolitan area is spatially correlated to the concentration of neighboring metropolitan areas0964 innovative activity. Based on a data set of patents, this paper presents the recent space-time patterns of metropolitan innovative activity for the period 1990-1999.

21
Liu Hedong, 2010. Research on spatial agglomeration of original innovation output of China’s region.Journal of Industrial Technological Economics, (11): 122-128. (in Chinese)

22
Liu Liying, 2010. Research on industry development from perspective of innovation in the districts and countries of Tianjin [D]. Tianjin: Tianjin University. (in Chinese)

23
Lyu Guoqing, Zeng Gang, Guo Jinlong, 2014. Innovation network system of industry-university-research institute of equipment manufacturing industry in the Changjiang River Delta.Scientia Geographica Sinica, 34(9): 1051-1059. (in Chinese)lt;p>Network perspective has already been applied in diverse areas. However, the adoption of innovation network formed by companies, universities and research institutes is not as common and integrated as that the academic research might have emphasized, especially the equipment manufacturing industry in the Changjiang River Delta of China. This article, using data from the national key industry patent information service platform, focuses on the structural and spatial characteristics of the innovation network from 1985 to 2010. Combining the judgment that universities have been the main forces in the field of public research since 2000, we analyze the evolution of the innovation network in terms of node type, segmented industry category and location by four stages in 1985-1999, 2000-2005, 2006-2008 and 2009-2010. Utilizing the analytical approach of the social network, there are some main conclusions drawn from the research. 1) Features of innovation network of equipment manufacturing industry in the Changjiang River Delta have changed obviously from 1985 to 2010, showing a&ldquo;core-periphery&rdquo;paradigm. The bidirectional interaction of cooperative innovation mechanism between universities and companies has not yet been established. It still stays at the initial stage. 2) From the spatial characteristics of the network during 1985-2010, cities have different characteristics individually. Although other cities out of the region, such as Beijing, have become a powerful knowledge pool, cities located in the region of Changjiang River Delta still tend to cooperate with local universities or research institutions. It is obvious that geographic proximity, administrative proximity and knowledge size proximity become the most important factors which influence agents to build the cooperation networks. 3) In order to promote the performance of innovation network, the article deems that we should select key enterprises, firms and factories. By supporting the central nodes, establishing the knowledge transfer platform and encouraging firms to cooperate with universities and research institutions in the process of innovation, we predict that the innovation network system of industry- university-research interaction of equipment manufacturing industry in Changjiang River Delta will become more robust and reliable. Finally, we make some key suggestions for the future research. First, the advantage of patent lies in the higher availability and controllability, but it only presents one facet of the innovation. So we must strengthen field research to get more detailed and accurate data. Second, the depiction of network graph can be conductive to express the visualization of information, but it does not involve the analysis of internal evolution mechanism. At last, it is important to build a multi-dimensional adjacent framework. The interaction effect on innovation between network and space will be the focus of research in the next stage.</p>

24
Lyu Lachang, He Ai, Huang Ru, 2014. Beijing’s urban innovational function based on knowledge output.Geographical Research, 33(10): 1817-1824. (in Chinese)With the coming of the era of the knowledge economy, innovation has become one of the most important functions for cities. However, the role of cities in the regional innovation system has rarely been studied. This paper focuses on Beijing's urban innovation function to demonstrate its functional structure and strength and compares with other top Chinese cities in innovation such as Shanghai, Shenzhen, Guangzhou and Tianjin.Using the urban innovation function index and urban innovation specialization index, the paper examines Beijing's urban innovation structure, and innovation intensity compared with those of Shanghai, Shenzhen, Guangzhou and Tianjin. The results show that there exist some differences, but not substantiality, in urban innovation based on publications and granted patents. Beijing's innovation index ranks from high to low based publications from sectors of science- education- culture, transportation and information, finance and real estate, industry and construction, trade and business, and corporate departments. Based on patents granted, Beijing innovation index ranks from high to low in the order of industry, transportation and information sector, science- education- culture sector, construction sector, trade and business sector, corporate departments sector, and finance and real estate sector. Beijing has higher level innovation capabilities in almost all the sectors. Compared with Shanghai, Tianjin, Guangzhou and Shenzhen, Beijing's innovation functions in finance and real estate and construction sectors is weaker than those of Shanghai. Beijing's innovation intensity is the highest in science-education-culture industry, and is the lowest in the trade and business sector. Beijing's innovation intensity is stronger than that of Guangzhou and Shenzhen, but weaker than that of Shanghai and Tianjin based on publications. However, based on patents granted, Beijing's innovation intensity is the highest in industry, while the weakest in trade and business. This paper provides a basic method to study urban innovation functions through urban innovation structure and intensity to enrich the theoretical understanding of national and regional innovation systems.

DOI

25
Lyu Lachang, Liang Zhengji, Huang Ru, 2015. The innovation linkage among Chinese major cities.Scientia Geographica Sinica, 35(1): 30-37. (in Chinese)<p>Inter-urban linkage is traditional research field of urban geography. With the increasing importance of innovation in city, inter-urban linkage of innovation has aroused the interesting of numerous sholars, some of which have examined the field through direct surveyed approach by co-author published papers or co-author patents granted, however, this approach is limited because it lacks data of the inter-urban and the rusults of survey may not present the comprensive inter-urban innovation situation of the cities. Therefore, we employ a indrect approach , using revised gravity model to map the pattern of inter-urban innovation linkage of Chinese major cities. China takes constructing the innovation country as the core strategy, and urban innovation as the core contents of national innovation system, so urban innovation linkage is an important part of China's national innovation system. However, a number of issues, such as the current sitation of urban innovaiton linkage, and the pattern and laws of inter urban innovation have rarely been studied. This article will try to study the inter urban innovation linkage among major Chinese cities so as to find innovation source cities and innovation nodes cities in urban innovation system and the general pattern of the inter urban innovation, to promote the complementary and optimization of urban innovation function and to plan the circle of China urban innovation. Based on the review of the literatures of innovation linkage and theoretical analysis, through establishing a set of measureement of index, this article defines ourward innovation linkage of scale and measures innovation linkage and innovation pattern among Chinese major cities. The research shows: 1) the general pattern of urban innovation linkage in East China is stronger and that in West China is weak, and a &quot;Golden Triangle innovation linkage&quot; pattern has formed in the coastal area of China, which takes Shanghai, Nanjing and Hangzhou as the vertex, while Beijing-Tianjin and Guangzhou-Shenzhen as two points. 2) the city innovation linkage presents obvious hierarchy, the cities, such as Beijing, Shanghai, Guangzhou, Shenzhen, Tianjin and Chongqing have national innovation influence with extensive innovative linkage with the other cities in China, while cities, such as Nanjing, Hangzhou, Wuhan, Zhengzhou, Jinan, Qingdao, Dalian and Xi'an have regional innovation influence. 3) in terms of the East Coastal main economic circle in China, the Zhujiang River Delta economic circle has the strongest internal innovation linkage, but less outward innovation radiation; the Changjiang River Delta economic circle has very strong internal innovation linkage with strong external innovation linkage with the cities of Huan Bohai economic circle, while the cities of Beijing, Tianjin and Tangshan have very strong innovation linkage, and with strong outward radiation to the Changjiang River Delta economic circle. This article examines the general innovation linkage pattern among Chinese major cities considering two important elements of distance among cites and scale of urban innovation, but some elements, such institution and policies which may influence the innovation linkage have not been examined, it will be put consideration in future studies.</p>

26
Niu Fangqu, Liu Weidong, 2012. Relationships between scientific & technological resources and regional economic development in China.Progress in Geography, 31(2): 149-155. (in Chinese)The 21st century is an era of knowledge. In China, to increase the innovation capacity and accelerate the economic development, every province is now injecting a great deal of investment in scientific & technological resources (STR). But only when STR produces outputs can it increase the economic progress. Classifying the regional STR into three groups: national, regional, and enterprise scales, we quantify regional STR, and analyze its spatial distribution. Based on the evaluation of regional economic development, we study the relationship between regional economy and STR. As a whole, the STR has a positive correlation with the economy level. It is not the same in different provinces. So it remains to be solved on how to deploy scientific & technological resources according to economy level and how to make full use of investment to boost economy. There is a need for further research on the driving mechanism between STR and economy to make relevant policies.

DOI

27
Makkonen T, Inkinen T, 2014. Innovation quality in knowledge cities: Empirical evidence of innovation award competitions in Finland.Expert Systems with Applications, (41): 5597-5604.Innovation awards have for long attracted policy makers as a method for innovation promotion. Still, academic research on innovation awards has thus far received little attention. In particular, empirical studies on the motives to enter award competitions and the realized impacts of winning an innovation award are scarce. This study addresses this research gap. Firm-level evidence, questionnaire data on innovation award winning companies of the Finnish national Innofinland and Quality Innovation of the Year award competitions, indicate that the motives for companies to participate in award competitions and the realized impacts of winning an award are largely the same: media coverage and a credibility boost. The importance of innovation awards in innovation policy was, however, considered only as mediocre or modest. As a conclusion it can be stated that innovation awards are an additional tool for innovation promotion, alongside innovation inducement policies including tax reductions and direct funding, as they produce significant positive effects for the award winning companies, and an additional indicator of innovation quality in the context of knowledge cities. (C) 2014 Elsevier Ltd. All rights reserved.

DOI

28
Moreno R A, Paci R B, Usai S B, 2005. Spatial spillovers and innovation activity in European regions.Environment and Planning A, 37(10): 1793-1812.

29
Su Fanglin, 2006. Analysis on the spatial pattern of China’s provincial R&D spillovers.Studies in Science of Science, (5): 696-701. (in Chinese)

30
Tao Xuefei, 2013. Evaluation index system of a city’s comprehensive ability of S&T innovation.Economic Geography, 33(10): 16-19. (in Chinese)A city's scientific and technologic innovation system bridges the nation and the enterprise-the innovative body, integrating macroscopic and microscopic resources to promote innovation. There is not an appropriate index system yet to evaluate a city's comprehensive ability of scientific and technologic innovation. Therefore, the thesis expounds innovation related concepts. It defines a city's comprehensive ability of scientific and technologic innovation and then designs an evaluation system consisting of 5 first class indexes around technological innovation capacity as well as 13 second class indexes, for which the thesis finally provides empirical evidence.

31
Wang Bei, Liu Weidong, Lu Dadao, 2011. Allocation efficiency of science and technology resources in Jing-Jin-Ji, Yangtze River Delta and Pearl River Delta regions.Progress in Geography, 30(10): 1233-1239. (in Chinese)With the coming of knowledge economy age, science and technology (S&amp;T hereafter) innovation is becoming the impulse to economic sustainable development. Meanwhile, metropolitan area is the cluster of S&amp;T innovative activities. In China, Jing-Jin-Ji (JJJ) region, Yangtze River Delta (YRD) region and Pearl River Delta(PRD) region play the most important roles in the construction of national S&amp;T innovation system. Based on the main indicators in terms of the S&amp;T input-output system, this paper describes the development of S&amp;T resources in the JJJ, YRD and PRD regions, and evaluates the allocation efficiency of S&amp;T resources in the three metropolitan areas according to entropy method and DEA method. On this basis, the findings presented in this paper confirm the characteristics of the development and allocation efficiency of S&amp;T resources in the three regions as follows: 1) The JJJ, YRD and PRD regions are the major clusters of S&amp;T resources in China. 2) The innovative ability of JJJ region shows polarization, and the innovative units are not distributed evenly; in contrast, the YRD and PRD regions have stronger innovative ability and are likely to be the most dynamic regions in China; 3) The allocation efficiency of S&amp;T resources in the YRD and PRD regions is superior to that in JJJ region.

DOI

32
Wang Chunyang, Zhao Chao, 2014. Spatial-temporal pattern of prefecture-level innovation outputs in China: An investigation using the ESDA.Scientia Geographica Sinica, 34(12): 1438-1444. (in Chinese)lt;p>With the development of the new economic geography, spatial structure study of regional innovation becomes more and more important. Using the methods of exploratory spatial data analysis(ESDA)and spatial analysis software Geoda, the article analyzes the spatial distribution of innovation outputs in China, measured by the number of patent applications examined, throughout 341 prefecture-level cities from 1997 to 2009 of China. A significantly high level of spatial concentration and regional difference of innovation outputs among Chinese cities has been captured by the exploratory spatial data analysis, and the concentration level has increased steadily over the past years. Different from the significant polarization characteristics of innovation within the provincial spatial scale regions, prefecture level regional innovation showing a diversity local spatial dependent model. On the whole, the output of innovation in the prefecture level spatial scales naturally formed two distinct spatial clusters, named the eastern H-H cluster and the western L-L cluster. The eastern H-H cluster gradually transferred to the Shandong Peninsula, the Huanghe River Delta and the Zhujiang River Delta from the northeast and North China in the study period, while the western L-L cluster spatial development maintains relatively stable. The H-L clusters and L-H clusters are mainly distributed in the middle and join area, which shows an obvious characteristic of transition. This study can provide a scientific basis for the spatial correlation of innovation outputs among prefecture-level cities, and reflects the knowledge spillover and its spatial limitations of regional innovation which make a significant contribution to the evolution of Spatial- temporal pattern of innovation in China. Finally, on the basis of empirical analysis, policy suggestions and future research direction are proposed.</p>

33
Wang Jici, 1999. Knowledge innovation and regional innovation environment.Economic Geography, 19(1): 11-15. (in Chinese)

34
Yang Bixia, 2007. Research on the joint development of scientific and technological innovation and regional economy in Shanghai [D]. Shanghai: Tongji University. (in Chinese)

35
Yu Junbo, Shu Zhibiao, 2007. An empirical study on the relationship between enterprise scale and innovation output.Studies in Science of Science, 25(2): 373-380. (in Chinese)The evolution of theories regarding the relationship between enterprise scale and innovation output is presented in the beginning of this paper,indicating that the role Small and Medium-sized Enterprises(SMEs) played in innovation is increasingly getting acknowledged.Such theoretical progresses are subsequently interpreted from a dynamic perspective of how innovation output has been measured.Moreover,based on the surveyed data,this paper analyzed the relationship between enterprise scale and innovation output in China,revealing a positive correlation.Meanwhile,the adoption of more accurate indicators to evaluate innovation output surfaces SMEs' advantage in innovation efficiency as well as the aggregate contribution in particular industries.

DOI

36
Zhang H Y, 2015. How does agglomeration promote the product innovation of Chinese firms?China Economic Review, (35): 105-120.This study empirically analyzes the effect of agglomeration economies on firm-level product innovation (new products), using Chinese firm-level data from 1998 to 2007. In terms of new product introduction and new product output, I find that Chinese firms benefit from urbanization economies (as measured by the number of workers in other industries in the same city and by the diversity of industries in the same city). Conversely, I find no positive effects of localization economies (as measured by the number of other workers working for neighboring firms in the same industry and in the same city). These results suggest that in China, urbanization economies play an important role in fostering product innovation by urban size and diversity.

DOI

37
Zhang Yuming, Li Kai, 2007. Research on the spatial distribution and dependence of Chinese innovative output: Spatial econometrics analysis based on province-level patent data.China Soft Science, (11): 97-103. (in Chinese)

38
Zhang Zhanren, 2013. Regional linkage and spatial spillover effects on regional innovation development in China: A case study from the perspective of economic innovation transformation in China. Studies in Science of Science, (9): 1391-1398. (in Chinese)With the market-oriented reforms and the innovative transformation of China's economy,a province is likely to get access to development due to meet external demand for innovative services when the demand for innovative services is constantly increasing.Based on the ESDA method,this paper not only explores the feature of regional linkage and the spatial correlation among China's regional innovation output of patent from 1999 to 2010,but also try to explore the effect of the potential market on the regional innovation development or regional spillover in China with the help of the new-economy-geographical model.We find that there exists global spatial autocorrelation all over the country,and this kind of autocorrelation has been increasing since 1999.Meanwhile,the empirical analysis shows the potential market is important to the regional innovation growth and innovation spillover among regions.However the spatial spillover effect caused by the potential market will gradually vanish as the distance between regions increase.

39
Zhou Shangyi, Lyu Guowei, Dai Juncheng, 2011. An analysis of the relation between the enterprise network characteristics and their innovation capabilities in the space of DRC on Beijing.Economic Geography, 31(11): 1845-1850. (in Chinese)Many research works claim that interaction of enterprises foster their creative capability.The interest of geographers on this topic orientates to spatial factors related to creative capability.Many creative parks in China make the space that creative people there have lower cost of communication.This paper discusses if the communication is effective for innovation.This paper bases on a survey at DRC,a industrial design park in Beijing.It shows the characteristics of enterprises network and its aim is answering if the convenient communication benefit creative capability in such spatial scale.The characteristics come from the analysis result by UCINET,a social network analysis software.The correlation analysis result of network features of enterprises and their creative capability comes from SPSS.This paper concludes that:Firstly,the enterprises network developed in such size of creative park has both positive and negative effects.Secondly,the enterprise taking better location in the network has more capability of innovation.Two points need to be discussed in the future: First,the relation between the separated enterprises and enterprises hatched in the park and then moved out. Second,how large of a creative park would increase the communication cost of enterprises within the park obviously.

40
Zhu Huasheng, Wu Junyi, Wei Jiali et al., 2010. Creative networking in developing countries: A case study of design industry in Shanghai, China.Acta Geographica Sinica, 65(10): 1241-1252. (in Chinese)<p>Creative products are considered as the outcome of a series of interactive processes, covering creation, production, distribution and consumption. The role of intermediary organizations such as distribution channels in establishing the linkages between creators and consumers are valued highly. With a primary purpose of examining whether or not it is true in design industry in developing countries like China, the authors take the design industry of Shanghai as an example, collect data from questionnaires and in-depth interviews which were carried out in nine creative industrial agglomerations in 2007 and 2008 respectively, and use SPSS as an analysis tool to explore the effects of networking relationship on the creativity of design firms. The results show that the design industry in Shanghai does tap into creative energies of other industries through inter-industrial division based on input-output relationship. Undoubtedly, companies from the downstream industries are the key actors in the networking, and their effects on creativity depend more on content of linkages than on intensity of linkages. A couple of universities in Shanghai are also important actors on the basis of the commercial tradition with strong entrepreneurship. Actually, they are incubators of creative firms and sources of talents rather than just providers of professional services. However, unlike developed countries, there are relatively few intermediary organizations linking creators with consumers in China, and the importance of cooperation between design firms cannot be overemphasized.</p>

41
Zhu Ying, Du Debin, 2005. The spatial organization of R&D globalization by multinational corporations.Economic Geography, 25(5): 620-623. (in Chinese)

Outlines

/