Orginal Article

Reconstructing the historical spatial land use pattern for Jiangsu Province in mid-Qing Dynasty

  • JIN Xiaobin , 1, 2 ,
  • PAN Qian 1 ,
  • YANG Xuhong 1 ,
  • BAI Qing 2 ,
  • ZHOU Yinkang 1, 2
Expand
  • 1. School of Geographic and Oceanographic Sciences, Nanjing University, Nanjing 210023, China
  • 2. Natural Resources Research Center of Nanjing University, Nanjing 210023, China

Author: Jin Xiaobin (1974-), specialized in land use and land planning. E-mail:

Received date: 2016-03-31

  Accepted date: 2016-04-30

  Online published: 2016-12-20

Supported by

National Natural Science Foundation of China, No.41671082

Copyright

Journal of Geographical Sciences, All Rights Reserved

Abstract

This study is proposed to reconstruct a high-resolution spatial distribution of historical land use pattern with all land use types to overcome low-accuracy and/or the monotonic land use type in current historical land use reconstruction studies. The year of 1820 is set as the temporal section and the administrative area of Jiangsu Province is the study area. Land use types being reconstructed include farmland, residential land (including both urban land and rural residential land), water body, and other land (including forest land, grassland, and unused land). Data sources mainly refer to historical documents, historical geographic research outcomes, contemporary statistics, and natural environmental data. With great considerations over regional natural resources and social and economic conditions, a few theoretical assumptions have been proposed to facilitate the adjustment on prefecture farmland, urban land, and rural residential land. Upholding the idea that the contemporary land use pattern has been inherently in sequence with the historical land use pattern as well as the land use pattern shall be consistent to its accessibility, this study reconstructs the land use pattern in Jiangsu Province in 1820 with 100 m*100 m grids based on accessibility analysis and comprehensive evaluation. The outcome has been tested as valid by regionalization and correlation analysis. The resulted spatial distribution shows that back in 1820 in Jiangsu Province: (1) farmland, urban land, rural residential land, water body, and other land take about 48.49%, 4.46%, 0.16%, 15.03%, and 31.86% of the total land area respectively; (2) the land use pattern features high proportion of land in farming while low-proportion land in non-farming uses while population, topography, and the density of water body lead to great spatial variations; and (3) the reconstruction methodology has been tested as reasonable based on significant positive correlations between 1820 data and 1985 for both farmland and rural residential land at the prefecture level.

Cite this article

JIN Xiaobin , PAN Qian , YANG Xuhong , BAI Qing , ZHOU Yinkang . Reconstructing the historical spatial land use pattern for Jiangsu Province in mid-Qing Dynasty[J]. Journal of Geographical Sciences, 2016 , 26(12) : 1689 -1706 . DOI: 10.1007/s11442-016-1353-5

Land cover is the most obvious landscape indicator of terrestrial ecosystems. It is jointly affected by human land-use activities and natural processes (Li, 1996). Meanwhile, land cover serves as the most direct signal for characterizing the influence of human activities on terrestrial ecosystems. Land cover provides a link between human economic activities and natural ecologies and can aid in the understanding of these interactions (Sterling et al., 2013; Liu et al., 2014).
Land cover change motivated by human activities has been influencing the weather and ecosystem globally and regionally, which becomes a hot spot of international attentions. As an essential aspect of research on Land Use and Cover Change (LUCC) (Turner et al., 1995; Steffen et al., 2005; Voldoire et al., 2007), historical LUCC can supplement contemporary remote sensing data with reconstructed historical information to facilitate the identification of LUCC progress, which may provide credible reference/evidence support to simulate land use and weather changes and draft a sustainable development strategy.
Up to now, the subject of most researches on historical LUCC has steadily been farmland. In terms of the spatial scale, both global and regional have been covered. Specifically, researches at the global scale focus on characteristics and trends of global land use change and are of low accuracy, which is typically represented by SAGE (Ramankutty and Foley, 1998; Ramankutty and Foley, 1999; Ramankutty and Foley, 2010), HYDE (Goldewijk, 2001; Goldewijk and Van, 2006; Goldewijk et al., 2011), Pongratz et al. (2008) etc.; researches at the regional scale are more likely to be interested in exploring the utilization pattern of national/regional land use, emphasize data accuracy and methodology suitability, which can further be divided into continental/national (Ge et al., 2008; Ge, 2008; Hall et al., 1995; He et al., 2007; Kaplan et al., 2009; Liu and Tian, 2010; Steyaert and Knox, 2008), provincial/regional (Ge et al., 2003; He et al., 2012; Li et al., 2011; Li et al., 2012; Li et al., 2014; Lin et al., 2009; ; Ye et al., 2009a; Ye et al., 2009b; Zhang and Chen, 2007; Zhang et al., 2015), and prefecture/county levels (Bai et al., 2007; Lu et al., 2010; Wang et al., 2013).
In terms of the organization of spatial data, these researches have been carried out based on either the administrative setting or the spatial grid. The administrative setting includes the boundary at provincial, prefecture or county levels (Ge et al., 2008a; He et al., 2007; Lu et al., 2010; Wang et al., 2013; Ye et al., 2009a; Ye et al., 2009b). The grid is more about the data application and of the accuracy such as 0.5° * 0.5° (Goldewijk et al., 2011; Pongratz et al., 2008; Ramankutty and Foley, 1999; Zhang and Chen, 2007), 5′ * 5′ (Goldewijk and Van, 2006; Goldewijk et al., 2011), 60 km*60 km (He et al., 2012; Lin et al., 2009), 20 km*20 km (Steyaert and Knox, 2008), 10 km*10 km (Li et al., 2012; Liu and Tian, 2010), 2 km*2 km (Luo et al., 2014), 1 km*1 km (Jiang et al., 2016; Long et al., 2014; Yang et al., 2015a, 2015b; Zhang et al., 2015), 90 m*90 m (Li et al., 2011) etc. Regarding of the duration of the interested historical period, most research concentrates on the past 300 year while some international studies may trace back till 3000 (Kaplan et al., 2009) or even 12000 years ago (Goldewijk et al., 2011) and a few research related to China recovers some details about 1000 years ago (He et al., 2012; Wang et al., 2013).
As for the methodology, most of the studies summarize natural and human factors such as regional natural resource condition, population growth, and contemporary land use structure. Taking “cultivation suitability” or “reclamation availability” as core indicators, the transition probability and change rate were set for certain types of land use over specific time periods, thereby achieving “top-down” spatial distribution of corresponding land use types. The effectiveness of the reconstruction results depends upon the richness and veracity of historical data (i.e., accuracy of the number of land use types and the level of details for basic elements in data acquisition) as well as the rationality of spatial boundary control (level of details in regional division for reconstruction and availability of historical assessment indicators). For example, contemporary population density was taken as the base map of land use pattern distribution in the global data product HYDE versions 1.1 and versions 2.0, and spatial distribution of a certain land use type was based on historical population density. The SAGE data set collected historical land statistics at a national scale. Using land use pattern interpreted from contemporary remote sensing images as a base map, the ratio of historical statistics and area data from remote sensing interpretation was used to assign historical land use types onto the base map.
Current researches have been keeping forward to reveal the spatial distribution of historical LUCC but may contain some shortcomings, for example, the reconstructed subject itself is not comprehensive, data accuracy is not thoroughly tested, spatial resolution may be too coarse, spatial variation has been neglected, etc. This study chooses Jiangsu Province in 1820 as the research subject for its detailed data records and advanced agricultural production at the time. Based on calibrated historical provincial data, characteristics of regional natural resources, research outcomes of historical geography, relationships between human and nature, and contemporary land use pattern, a comprehensive analytical framework for historical LUCC has been proposed with a resolution of 100 m*100 m to reconstruct sectional LUCC pattern for Jiangsu Province in 1820 and validate it. The ultimate goal is to provide credible reference for future studies related to LUCC and global changes.

1 Overview of the study area

Jiangsu Province is located in East China, down streams of the Yangtze River and Huaihe River, and borders the Yellow Sea. The area has been ranked among top regions for agricultural production in the past several centuries for its mild temperature and moisture conditions, plain territories, thick soil layers, fertile soil conditions, abundant water bodies, etc. It possesses a long coast line along which land use changes significantly. The distribution of residential land varies significantly across regions. Specifically, residential land concentrates in the South along water bodies while it is relatively loosely distributed in the North. Topography effects as well so that residential lots are more likely to locate in plains rather than hilly areas (Zhai, 2008).
Jiangsu was first ever administratively as a province in 1667 (Fu, 2009) and came into its current shape by 1767 (LCCCJP, 1999). Its name, administrative boundaries, controlling areas, and location of provincial government kept changing ever since. In 1820, the time section that this study has been proposed with, there were total 12 prefectural units and these units were of three administrative ranks, i.e., eight are of “Fu”, three are of “Zhou” and one is of “Ting.” Specifically, eight units of “Fu” refer to Jiangning, Suzhou, Songjiang (i.e., current Shanghai), Changzhou, Zhenjiang, Yangzhou, Huaian, Xuzhou; three units of “Zhou” include Tongzhou, Haizhou, and Taicang, and one unit of “Ting” is Haimen. The administrative area of Jiangsu Province in 1820 covers the main body of current Jiangsu Province, the whole body of current Shanghai, Dangshan county, Xiao county and some minor parts of Weishan county, Suzhou, Laian county within current Anhui Province, and Chengsi county within current Zhejiang Province. For the sake of the continuity in data, this study mainly focuses on the part covered by current Jiangsu Province but with the administrative framework back in 1820. Therefore, the adjusted 12 administrative units in Jiangsu Province can be derived for the year 1820 (Figure 1).
Figure 1 The location of the study area

2 Data and methodology

2.1 Data

Data in this study are of three categories: land use data, maps, and other data including population, topography and soil conditions. Some well-acknowledged historical geography research outcomes are used to avoid the statistical inconsistency or errors in recording historical data. Considering the difficulty in obtaining natural resources data in historic period, this study assumes that the status of natural factors, such as topography, soil, etc., has been stable within a century, therefore the contemporary data can be applied as an effective proxy.
2.1.1 Land use data
Provincial land use data for the year 1820 are from the research outcomes of Ge et al. (2003) while county-level land use data in 1932 are based on the research of Zhao (2005). Land use data in 1985 at a 100-m spatial resolution are research outcomes of land use classification based on TM image interpretation fulfilled by the Resources and Environmental Science Data Center of Chinese Academy of Sciences. Urban land use data for the year 1820 are based on research outcomes of He et al. (2002) with minor adjustments.
2.1.2 Research units
The vector data of historical prefecture administrative boundaries, administration centers, and water bodies are drawn from the Chinese Historical Geographic Information System (http://www.fas.harvard.edu/~chgis/). County-level administrative boundaries in 1820 (Niu, 1990) are obtained by adjusting data in 1911 considering few changes during 1820 and 1911 in county settings. Contemporary administrative boundaries are extracted from the National Primary Geographic Information System (http://nfgis.nsdi.gov.cn/nfgis/chinese/c_xz.htm).
2.1.3 Other data
1) Demographic data for individual administrative units in 1820 are obtained from the Chinese Demographic History (the 5th volume.) (Cao, 2005). City-level demographic data and non-farming population data during 1984 and 1986 are from Fifty Years of Jiangsu Province: 1949-1999. Urban population data in 1820 are adjusted once based on research outcomes of Cao (2002), Fan (1990), and Wang (1984).
2) Topographic data, i.e., elevation and slope, are from the ASTER GDEM V1 with a 30-m spatial resolution accuracy provided by the International Scientific Data Mirror Site (http://datamirror.csdb.cn).
3) Soil data are acquired from the Chinese Soil Information System (SIS China) with a 2-km spatial resolution based on results of the Second National Soil Survey (1980).
Because these multi-source data are differentiated with each other in terms of scope, scale and coordinate, some pre-adjustments, such as projection conversion, stitching and cutting, resampling, raster and vector data conversions, and spatial interpolation are necessary. Finally, all data are re-projected into the WGS-84 coordinate system and all raster data are resampled into 100 m* 100 m grids.

2.2 Spatial specification for reconstruction and land use classification

2.2.1 Spatial specification for reconstruction
To effectively representing the historical characteristics of rural residential areas, considering the average area of rural residential units in contemporary Jiangsu Province (Tian et al., 2002), as well as in combination with the contemporary land use data accuracy for inversion, this study specifies the grid dimension to be 100 m*100 m.
2.2.2 Reconstructed land use classification
With references to land use data in Jiangsu Province in 1985, research outcomes of previous urban studies (Wang, 1984), characteristics of local land use status (Lu and Ma, 2009; Shen and Ma, 1994; Wang 2009; Wu and Guo, 1994), and limitations of data, this study classifies, by integrating contemporary land use classes (Liu, 1996), the reconstructed land into four integrative primary categories, namely, farmland, residential land, water body, and other land. Specifically, residential land can be further divided into urban land and rural residential land, where urban land only covered the land within the wall of prefecture and county units. “Other land” includes forest land, grass land and unused land.

2.3 Methodology

Technically, the methodology includes quantitative reconstruction, spatial reconstruction, and result verification. This study mainly focuses on methodology in reconstructing farmland and residential land (including urban land and rural residential land). The overall framework of research methodology is illustrated in Figure 2.
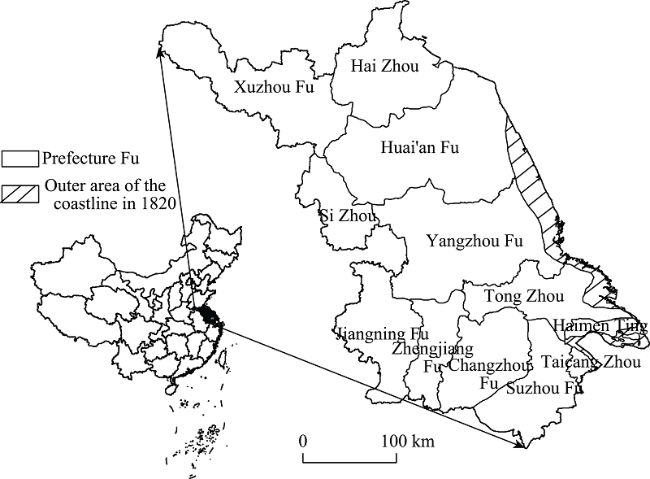
Figure 2 The technical route chart

3 Quantitative reconstruction

3.1 Quantitative calibration and reconstruction of residential land

3.1.1 Calibration of demographic data
We take the quantitative calibration and reconstruction as the basis and control for spatial reconstruction of historical land use pattern. The quantitative calibration and reconstruction includes both demographic and land use data. The calibration of demographic data targets at population in urban and rural areas, and the reconstruction of historical land use data covers urban land, rural residential land and farmland.
1) The data of urban residents in 12 administrative units in 1820 can be selected and calibrated from outcomes of research on ancient urban studies and demography within Jiangsu Province (Cao, 2002; Fan, 1990; Wang, 1984) based on the desired time section and scope.
2) The data of rural residents in an administrative unit in 1820 are defined as the difference between its total population and its urban population in 1820.
3) The number of urban residents for an administrative unit in 1985 can be defined as the product of the unit’s total population and the proportion of rural residents. To reduce the randomness, the proportion of rural residents is defined as the average value from the year 1984 to the year 1986.
4) Data of rural residents in an administrative unit with adjusted administrative boundaries can be calculated based on population density weighted by unit area as shown by the following formulas:
where
PRi(1820) is the number of rural residents in unit i in 1820;
PTi(1820) is the total population in unit i in 1820;
PUi(1820) is the number of urban residents in unit i in 1820;
PRi(1985) is the number of rural residents in unit i in 1985;
PTi(j) is the total population in unit i in the year j;
PUi(j) is the number of rural residents in unit i in the year j;
t indicates the study year, either 1820 or 1985;
RPRi(t) is the number of rural residents in unit i in the year t;
PRij(t) is the number of rural residents in unit j which shares common space with unit i the in the year t;
Sij is the amount of area in unit j;
Sijk is the amount of area of k in unit i but shall be readjusted to unit j;
m is the number of polygons located within unit i but shall be adjusted to unit j;
n is the number of units which share some space with unit i.
3.1.2 Quantitative reconstruction of rural residential land
Very few studies have ever been conducted to reveal the amount of historical rural residential areas. Before the 1980s, social and economic development in China had been with low growth rates (Tang and Yao, 1999); confined by both the economic conditions and strict restriction on population mobility, urban development and urbanization had been progressed slowly and therefore the rural residential pattern had been of little change. In this case, it is reasonable to assume that per capita rural residential land in a unit had been stable between 1820 and 1985 and the area of rural residential land in 1820 can be calculated based on the formula below:
where
Gi (t) is the amount of rural residential land area in unit i in the year t;
RPRi (t) is the number of rural residents in unit i in the year t; and
t indicates the study year, either 1820 or 1985.
3.1.3 Quantitative reconstruction of urban residential land
Historically, urban land was recorded based on the periphery of a city or an inner city of a county in China. Few specific studies have ever been conducted on the area of urban land. Therefore, He et al. (2002) is of significant reference value in terms of quantitatively reconstructing urban land at province, prefecture, county, i.e., three administrative levels. Moreover, the per capita urban land maintains the same at each administrative level across provinces. Considering differences in urban population across prefectures or counties or provinces, upholding the positive relationship between the scope of urban land and the size of its population, this study adjusts the amount of urban land in conformation to the proportion of urban residents. The method can be detailed in two steps:
1) Amounts of urban land in Jiangning Fu, Sizhou county in Anhui Province, and Xuyi county are directly drawn from the research outcome of He et al. (2002).
2) Amounts of urban land uses in the prefectures and counties can be derived based on the adjustments on research outcomes of He et al. (2002).
where
Ui, Vj are amounts of urban land in unit i and county j respectively;
A and b are per capita urban land areas at prefecture- and county-level respectively;
m and n are numbers of prefectures and counties respectively;
Xi and Yj are values of urban population for prefecture i and county j respectively.

3.2 Quantitative calibration and reconstruction of farmland

Most of current available researches on historical farmland quantity focus on provincial units and employ quantitative adjustment method or estimation based on per capita farmland amount. These methods may lead to significant estimation errors due to great variations in terms of farmland quality and per capita farmland quantity within Jiangsu Province. With respect to the consistency in historical farmland changes across prefectures and counties within Jiangsu Province, this study adopts the equal-proportion method in reconstructing prefecture farmland quantity.
It is assumed that the proportion of prefecture farmland had been stable within Jiangsu Province from 1820 through 1932, which enables this study to derive the prefecture farmland quantities for individual administrative units in 1820 based on documented farmland quantity of Jiangsu Province (including Shanghai) in 1820 and county-level farmland statistics in 1932. It is necessary to have these prefecture farmland amounts adjusted according to changes of administrative boundaries. Especially, farmland area may change in some areas in the process of adjusting historical administrative boundaries to current prefecture administrative boundaries. These areas are so called adjusted areas in this study.
Therefore, the reconstruction of prefecture farmland quantity can be inferred as:
(1) Prefecture farmland amount before adjusting administrative boundaries can be calculated by formula 7.
where
h = 1 refers to Sizhou city in Anhui Province while h = 2 refers to cities in Jiangsu Province in 1820;
Yh,i is the amount of farmland in 1820 in city i;
Xh,i is the amount of farmland in 1932 in city i;
Yh is the farmland amount in province h in the year 1820; and
n is the number of administrative units in this study.
(2) Farmland quantity adjusted upon administrative boundaries can be calculated by the following formulas:
where
Ri is an adjustment parameter;
αj is the proportion that an adjusted area takes in the county it locates;
βk is the proportion that the farmland in an adjusted area takes in the county’s total farmland it locates;
YRh,i is the adjusted farmland quantity in city i, province h;
Yh,i is the amount of farmland in 1820 in city i, province h; and
λ indicates the direction of adjustment, i.e., λ = 1 if the administrative boundaries expanded outwards since 1820 or λ = -1 is the administrative boundaries of area shrinks inwards.

4 Spatial reconstruction

4.1 Spatial reconstruction of urban land

Considering the contiguity of land uses, this study proposes three assumptions underlining spatial reconstruction for urban land.
1) Historical provincial capital, prefectures, and counties are mostly located within contemporary urban land areas and these contemporary urban lands should be continuous rather than isolated.
2) For a prefecture or county that is defined based on current administrative settings in current Jiangsu Province, its historical administrative boundaries in 1820 may be different and needs to be adjusted. In this study, we add all governed urban land up as a quantitative control tool and choose the closest units to current urban centers as possible historical urban land locations.
3) A few counties actually are located outside the contiguity of current urban land and need to be dealt with specifically. Referring to historical urban centers, being controlled by the quantity of corresponding urban area, current rural residential land is assumed to be possible locations for historical urban land.

4.2 Spatial reconstruction of rural residential land

It is rational to assume that people tend to live in the most suitable places and farm high-quality land. Therefore, this study proposes to conduct the spatial reconstruction for rural residential land and farmland based on land suitability evaluation, weighted method and quantity control.
4.2.1 The maximum spatial distribution
(1) Rural residential land
In this study, the contemporary setting of rural residential land and urban land (excluding areas for urban redevelopment and historical water bodies) has been assumed to be the maximum spatial distribution for historical rural residential areas, i.e., “potential rural residential areas.” As to Jiangning and Suzhou where were of high-level urbanization and of great rural population density, historical rural residential areas were even beyond current residential distribution, which directly requires some data manipulations such as deletion beyond farming radius, focus statistics, general selection, random selection, and so on, to expand the maximum spatial distribution for historical rural residential areas.
(2) Farmland
The data of farmland in 1985, i.e., the time exactly before the large-scale urbanization taking place, has been assumed to be the maximum spatial distribution for historical farmland. To eliminate some gaps between residential land and farmland, unused grids after urban redevelopment have been assigned to be farmland.
(3) Hypothesis testing
All assumptions about the maximal spatial distribution of historical farmland and residential land have been tested to be valid based on the comparison between Corona images taken in the 1960s and remote sensing images (Landsat MMS) in the 1970s.
4.2.2 Evaluation criteria
The spatial distribution of rural residential land and farmland has been shaped by both natural conditions and human activities. With reference to outcomes of previous related studies (Jin, 1988; Lin et al., 1946; Xie and Li, 2008), evaluation criteria have been selected as listed in Table 1.
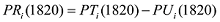
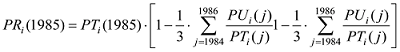
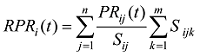
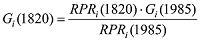
Table 1 Suitability evaluation indices for rural residential land and farmland
Target layer Index layer Property Weight
(Rural residential land)
Weight
(Farmland)
Natural
conditions
Elevation Interval value 0.256 0.408
Slope Interval value 0.114 0.168
Distance to the nearest river Negative index 0.100 0.133
Soil texture Interval value / 0.031
pH value Interval value / 0.015
Total nitrogen Positive index / 0.024
Total phosphorus Positive index / 0.019
Total potassium Positive index / 0.006
Soil organic matter Positive index / 0.029
Social and economic
conditions
Distance to the nearest town Negative index 0.112 0.151
Distance to the nearest county Negative index 0.077 /
The hierarchy of rural residential land Positive index 0.340 /
The concentration of farmland Positive index / 0.017
4.2.3 Normalization of all criteria data
The normalization method has been applied to all criteria data to eliminate dimensional effect and nonlinear effect. In case where the data will be normalized to zero, the value is actually assigned as one tenth of its minimum to facilitate the weighted calculation afterwards.
(1) For rural residential land
1) Elevation
The suitability for rural residential use for grids with the same elevation value is used to construct the normalization function. Meanwhile, the elevation value has been related to suitability scores and probability distribution (Yi et al., 2013). The greater the probability, the greater the suitability score. The normalization method can be illustrated by formula 10 as below.
where
yi is the normalized value;
N(xi) is the number of contemporary rural residential land with a certain elevation value;
N(xmin) is the minimum number of contemporary rural residential land with a certain elevation value; and
N(xman) is the maximum number of contemporary rural residential land with a certain elevation value.
2) Slope
Slope has been classified for each degree (i.e., 1°) and then normalized by a similar method as in dealing with elevation values.
3) Distances
Among our selected suitability evaluation items, three are distance-related indicators: the distance to the nearest village, the distance to the nearest town that a county government locates, and the distance to the nearest water bodies.
Since the distance variable may change very little when it is within a certain buffer, these three distance-related indicators are re-classified before being normalized. The re-classification buffer has been determined based on the average radius of villages, the average radius of towns where county governments were located, and the density of water bodies in 1820 in Jiangsu Province. The re-classified map was overlaid onto the contemporary rural residential land to derive numbers of grids within each buffer. For a village or a town, buffers are ordered incrementally and the value of buffer where the cumulative number of grids reaches 95% of the total will be set as the influence radius. For grids within such an influence radius, the distance to the nearest village, the distance to the nearest town, and the distance to the nearest water bodies will be re-classified based on intervals of 500 m, 5 km, and 500 m respectively. For grids outside of an influence radius, a distance-related indicator will be assigned to a category that has been indexed as the maximal index within the influence radius plus one. After all these re-classification work, three distance-related indicators can be normalized.
4) Residential land grade
The residential land grade is defined by the area of continuous rural residential land and the distance of the grid to the geometric center of continuous rural residential land, as shown in formula (11) below.
where
S is the area of continuous contemporary rural residential land;
L is the distance of the grid to the geometric center of continuous rural residential land; and
M is the minimum distance of the grid to the geometric center of its nearest rural residential land.
The addition of 100 to both L and M is to diminish the deviation in case the grid is too close to the geometric center of continuous rural residential land.
Such calculated G values are sorted incrementally and the G value where the cumulative 95% locates will be assigned to the grid as its highest residential land grade.
The similar method will be carried on in all grids within the maximum spatial distribution for rural residential land. Whereas the calculated G value is greater than its highest residential land grade, the grid will be assigned with its highest residential land grade plus one as its residential land grade. Finally, all G values will be normalized.
(2) For farmland
Elevation, slope, and distance-related indicators are all dealt with applying the similar methods as for rural residential land. The only difference is that maximum and minimum values are all based on contemporary farmland data.
The normalization of soil components such as N, P, K, and soil texture is directed by Dang et al. (2000) while the normalization of pH value and soil organic matter refers to Zhou et al. (2004).
The continuity of farmland is defined by focal statistics function with 8 peripheral areas and normalized based on the number of contiguous grids.
4.2.4 Weights
Weights have been determined by applying the entropy weight method to reflect the magnificence of a variable based on the difference in its observations (Guo, 2007). Weights of all indicators for rural residential land and farmland are listed side by side in table 1.
The weighted score for a grid can be calculated by applying formula 12.
where
yi is the value of index i;
wi is the weight of index i calculated by the entropy weight method; and
n is the total units of residential land or farmland.
The grid can be labeled as “rural residential land” if its weighted score is greater with weights for rural residential land than that with weights for farmland, otherwise “farmland”, and vice versa.

4.3 Overlay

Finally, the spatial distribution of rural residential land and farmland is derived. By overlaying related maps, the spatial land use pattern in Jiangsu Province in 1820 can be produced with a resolution of 100 m*100 m as shown in Figures 3 and 4.
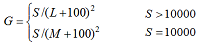
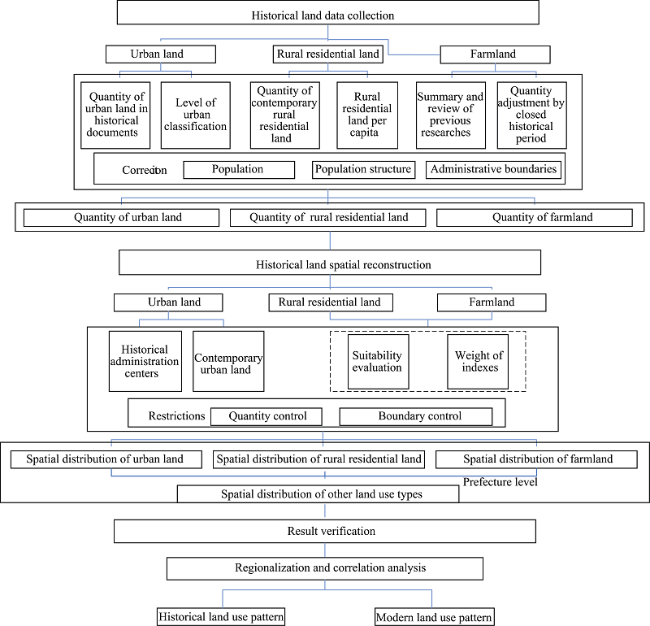
Figure 3 Rural residential land (a), urban land (b), and farmland (c) area of the study area in 1820
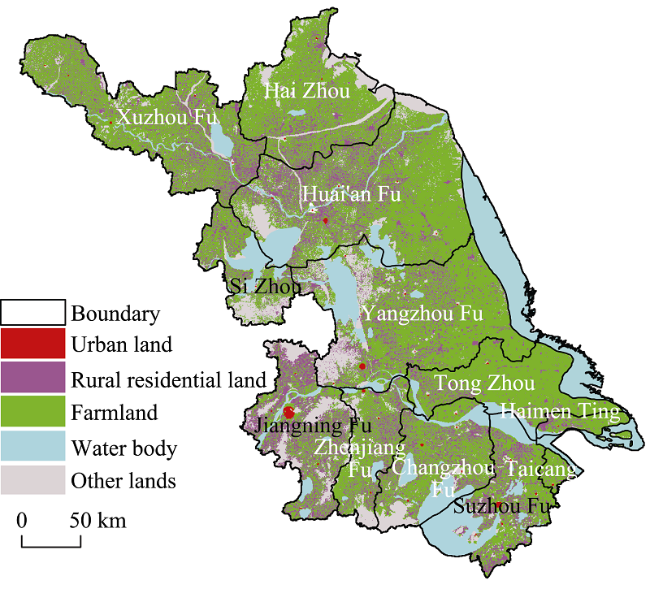
Figure 4 Spatial pattern of land use of the study area in 1820

5 Results

In general, land use in Jiangsu Province in 1820 features high proportion in farming while low-proportion in non-farming uses. Meanwhile, population, topography, and the density of water bodies lead to great spatial variations in land use (Figure 5). Specifically, farmland and other non-residential uses are the main land use types in Ning-Zhen-Yang hilly area, Xu-Huai plain area, Lixia River plain area; farmland and water bodies are the main land use types in coastal plain area, plain along the Yangtze River, Taihu Lake plain area. As to the non-farmland, the proportions of urban land use in Ning-Zhen-Yang hilly and Taihu plain areas are much higher, being 0.49% and 0.27% respectively, and the proportions of rural residential land are also high, being 6.94% and 5.21%. Both the minimum proportion of urban land (i.e., 0.02%) and the minimum proportion of rural residential land (0.94%) occur in the coastal plain area.
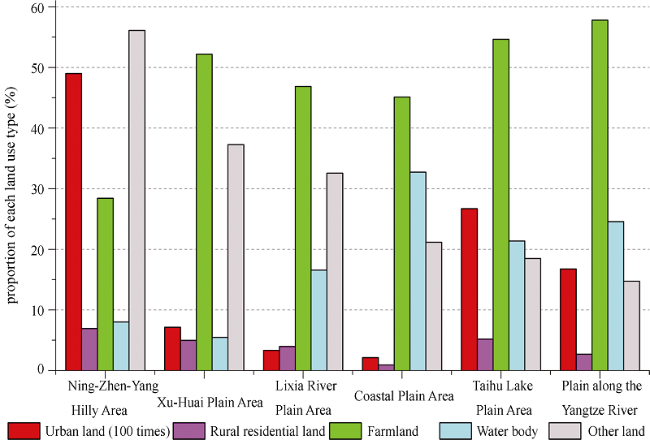
Figure 5 The land use structure of the study area in 1820
The effectiveness of these reconstructed historical data cannot be directly obtained by comparing grid by grid due to the availability of historical land use spatial distribution. With this study which focuses on reconstructing farmland and rural residential land based on the contemporary administrative setting of prefecture- and county-level spatial data in both 1820 and 1985 can be grouped into prefecture-level to facilitate the correlation analysis. The reconstructed land use data would be effective if farmland and rural residential land data in two groups, i.e., one in the year 1820 and the other in the year 1985, are significant positively correlated. It would be highly preferred to conduct a frequency test upon the county-level growth rate across counties to eliminate the possibility that farmland and rural residential land grow at the similar rate in all counties. In this study, such frequency analysis shows that the mean standard deviation and the variance all changes greatly across counties and excludes the consistency or similarity hypotheses.
As in Figure 6, the correlation analysis demonstrates that farmland and rural residential land in 1820 are significantly correlated to their counterparts in 1985 with R2 at 0.772 and 0.822, i.e., R is greater than 0.8 for both land use types. This implies the effectiveness of our reconstruction methodology and outcome.
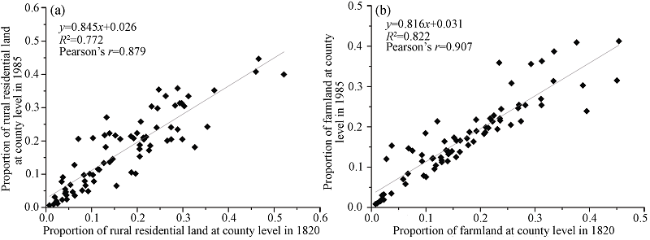
Figure 6 Correlation analysis for both rural residential land (a) and farmland (b)

6 Conclusions

Focusing on a certain historical period (i.e., 1820-1985), referring to the contemporary natural, social and economic conditions, this study reconstructs 100 m*100 m grids of land use spatial distribution in Jiangsu Province in 1820 with four land use types, i.e., farmland, residential land, water body, and other land by setting a few theoretical assumptions and applying appropriate statistical methods. Methodology has been described in detail and has been improved by (1) incorporating a few unusual indicators, such as residential land grade, continuity of farmland; (2) integrating the effect of contiguous grids into suitability evaluation; (3) normalizing individual indicators to eliminate measurement or dimensional differences and handling maximum and minimum data specifically. Finally, the outcome has been confirmed to be an effective reconstruction attempt by applying correlation analysis with the unavailability of historical land use grids.
Restricted by the incomprehensiveness of historical data and the accuracy, this study may be not a perfectly objective attempt to reconstruct the land use pattern in 1820. However, it is of credible reference to simulate potential historical land use spatial distribution and regional land use changes. In future, such attempts could be updated and supplemented with daily renewed historical geographic research outcomes, integrating regional development stage theories, urban-rural revolution, regionalization of land use patterns, etc. Methodology may evolve to deal with generalization, scope sensitivity, and diverse temporal features. Errors, especially sources and effects of errors, may be another critical issue to be addressed by future studies.

The authors have declared that no competing interests exist.

1
Bai S Y, Zhang S W, Zhang Y Z, 2007. Digital rebuilding of LUCC spatial-temporal distribution of the last 100 years: Taking Dorbod Mongolian Autonomous County in Daqing City as an example.Acta Geographica Sinica, 62(4): 427-436. (in Chinese)<p>The Yangtze River Delta is one of the economically developed coastal areas. From the late 1970s, its urbanization process has been quickened greatly, which resulted in the number increase and the spatial expansion of urban areas. The Landsat MSS, TM/ETM satellite images, which were respectively acquired in 5 periods of 1979, 1990, 1995, 2000 and 2005, were used to extract urban land information and analyze urban growth data with the help of remote sensing and GIS softwares. We analyzed the spatio-temporal characteristics including urban growth speed, growth intensity, fractal dimension and urban growth pattern. Additionally, dynamics of urban expansion in the Yangtze River Delta were also analyzed. The results are drawn as follows: (1) From 1979 to 2005, the growth speed of urbanization area was accelerating obviously. The quantities of increasing area of urbanized land were 37.66 km<sup>2</sup> 112.43 km<sup>2</sup> 274.86 km<sup>2</sup> and 421.73 km<sup>2</sup> in the past four periods (1979-1990, 1990-1995, 1995-2000 and 2000-2005), respectively. Meanwhlie, the growth intensities of urbanized land enhanced gradually. From 1979 to 1990, the growth intensity was only 0.03, then reaching 0.10, 0.24 and 0.37 in the following three periods. (2) The spatial structure of urbanization area in the Yangtze River Delta was fractal. The fractal dimension and stability coefficient of urbanized land structure fluctuated to a certain extent. From 1979 to 2000, the fractal dimension of urbanized land structure decreased yearly. The shape of urbanized land tended to be regular. After 2000, the area increase of urbanized land on a large scale led to more complicated shape of urbanized land. The stability coefficient also had similar characteristics to that of fractal dimension. So the change of urbanized land in spatial structure was relating to the growth process of urbanized land. (3) The growth process of urban agglomeration in the Yangtze River Delta was from one pole and two belts to five poles and five belts. From 1979 to 1990, Shanghai was the only first-grade growth pole of urbanized land and Shanghai-Nanjing railway and Shanghai-Hangzhou railway were the two first-grade growth belts of urbanized land in the Yangtze River Delta. At the latest period (from 2000 to 2005), the first-grade growth poles included 5 cities, i.e., Shanghai, Nanjing, Hangzhou, Suzhou and Ningbo. Besides Shanghai-Nanjing railway and Shanghai-Hangzhou railway, Shanghai-Jingjiang railway, Hangzhou-Ningbo railway and the highway linking Nanjing to Gaochun also became growth belts of urbanized land in the Yangtze River Delta in that period.</p>

2
Cao S J, 2002. Urban population of Jiangsu Province in the Qing Dynasty.Journal of Hangzhou Normal University (Social Sciences), (4): 50-56. (in Chinese)According to the data and materials of gazetteers, this paper is trying to build models of City\|Population Degree of Jiangsu and points out that the percentage of city population, which is partly dependent on the number of city population, is mainly determined by the number of the total population in the area. In the period of 1776-1893, the percentage of city population in Jiangsu was on a lower increase because the city\|population was stable, but the total population was on decline.

3
Cao S J, 2005. Population History of China (Volume 5). Shanghai: Fudan University Press. (in Chinese)

4
Dang A R, Yan S Y, Wu H Q et al., 2000. A GIS based study on the potential land productivity of China.Acta Ecologica Sinica, 20(6): 910-915. (in Chinese)On the basis of a previous research on potential agricultural productivity, the potential land productivity of China was studied with geographic information system (GIS) and national agricultural databases which include spatial databases and attribute databases The method of GIS based study on the potential land productivity was discussed A computing method and model were put forward after stressed research on soil effective coefficient By using the mechanism methodology and relative computing models , China's national potential land productivity was computed according to the factors such as radiation, temperature, precipitation, and soil in county unit The characteristics of numeric value disperse and spatial distribution of potential land productivity in China were analyzed through classification statistics and classification mapping

5
Editorial Board of Fifty Years of Jiangsu Province, 1999. Fifty Years of Jiangsu Province: 1949 to 1999. Beijing: China Statistics Press. (in Chinese)

6
Fan S Z, 1990. A Study on the Cities in the South of the Yangtze River during the Ming and Qing Dynasties. Shanghai: Fudan University Press. (in Chinese)

7
Fu L X, 2009. A new study on the establishment of Jiangsu Province in the Qing Dynasty.Studies in Qing History, 2009, (2): 23-31. (in Chinese)When Jiangsu Province was established in the Qing Dynasty, and when Jiangnan Province was divided into Jiangsu and Anhui Provinces, are the most important questions in the study of the local history of Jiangsu and Anhui Provinces and have always been topics of concern within academic circles. Based on textual analysis on the related historical materials from around 1667, this article argues that the process of establishing Jiangsu Province began in 1661 ( the 18th year of the Shunzhi reign) when &ldquo;Left&rdquo; and &ldquo;Right&rdquo; Provincial Administrative Commissioners were divided and ended in 1667 ( the 6th year of Kangxi reign) when the newly established Provincial Governors were named. The Qing court and local highranking provincial officials both played a role in this process. The related issues regarding the establishment of Jiangsu Province can be only clarified based on a comprehensive and deep study of the related historical data.

8
Ge Q S, Dai J H, He F N et al., 2003. Analysis of cropland quantity change and driving factors of some provinces of China over the past 300 years.Progress in Natural Science, 13(8): 825-832. (in Chinese)

9
Ge Q S, 2008. Land Use Change and Terrestrial Carbon Budget of China over the Past 300 Years. Beijing: Science Press. (in Chinese)Land use and land cover in China have changed greatly during the past 300 a, indicated by the rapid abrupt decrease of forest land area and the rapid increase of cropland area, which can affect terrestrial carbon cycle greatly. The first-hand materials are used to analyze main characteristics for land use and land cover changes in China during the study period. The following conclusions can be drawn from this study. The cropland area in China kept increasing from 60.78 106 hm2 in 1661 to 96.09 106 hm2 in 1998. Correspondingly, the forest land area decreased from 248.13 106 hm2 in 1700 to 109.01 106 hm2 in 1949. Affected by such changes, the terrestrial ecosystem carbon storage decreased in the mean time. Car-bon lost from land use and land cover changes mainly consist of the loss from vegetation biomass and soil. In the past 300 a, about 3.70 PgC was lost from vegetation biomass, and emissions from soil ranged from 0.80 to 5.84 PgC. The moderate evaluation of soil losses was 2.48 PgC. The total loss from vegetation and soil was between 4.50 and 9.54 PgC. The moderate and optimum evaluation was 6.18 PgC. Such carbon losses distribution varied spatially from region to region. Carbon lost more significantly in Northeast China and Southwest China than in other regions, because losses of forest land in these two regions were far greater than in the other regions during the past 300 a. And losses of carbon in the other regions were also definite, such as Inner Mongolia, the western part of South China, the Xinjiang Uygur Autonomous Region, and the Qinghai-Tibet Plateau. But the carbon lost very little from the traditional agricultural regions in China, such as North China and East China. Studies on the relationship between land use and land cover change and carbon cycle in China show that the land use activities, especially those related to agriculture and forest management, began to affect terrestrial carbon storage positively in recent years.

DOI

10
Ge Q S, Dai J H, He F N et al., 2008. Land use, land cover change and carbon cycle research of China over the past 300 years.Science in China Series D: Earth Sciences, 38(2): 197-210. (in Chinese)Land use and land cover in China have changed greatly during the past 300 a, indicated by the rapid abrupt decrease of forest land area and the rapid increase of cropland area, which can affect terrestrial carbon cycle greatly. The first-hand materials are used to analyze main characteristics for land use and land cover changes in China during the study period. The following conclusions can be drawn from this study. The cropland area in China kept increasing from 60.78 106 hm2 in 1661 to 96.09 106 hm2 in 1998. Correspondingly, the forest land area decreased from 248.13 106 hm2 in 1700 to 109.01 106 hm2 in 1949. Affected by such changes, the terrestrial ecosystem carbon storage decreased in the mean time. Car-bon lost from land use and land cover changes mainly consist of the loss from vegetation biomass and soil. In the past 300 a, about 3.70 PgC was lost from vegetation biomass, and emissions from soil ranged from 0.80 to 5.84 PgC. The moderate evaluation of soil losses was 2.48 PgC. The total loss from vegetation and soil was between 4.50 and 9.54 PgC. The moderate and optimum evaluation was 6.18 PgC. Such carbon losses distribution varied spatially from region to region. Carbon lost more significantly in Northeast China and Southwest China than in other regions, because losses of forest land in these two regions were far greater than in the other regions during the past 300 a. And losses of carbon in the other regions were also definite, such as Inner Mongolia, the western part of South China, the Xinjiang Uygur Autonomous Region, and the Qinghai-Tibet Plateau. But the carbon lost very little from the traditional agricultural regions in China, such as North China and East China. Studies on the relationship between land use and land cover change and carbon cycle in China show that the land use activities, especially those related to agriculture and forest management, began to affect terrestrial carbon storage positively in recent years.

DOI

11
Goldewijk K K, 2001. Estimating global land use change over the past 300 years: the HYDE database.Global Biogeochemical Cycles, 15(2): 417-433.Testing against historical data is an important step for validating integrated models of global environmental change. Owing to long time lags in the climate system, these models should aim the simulation of the land use dynamics for long periods, i.e., spanning decades up to a century. Developing such models requires understanding of past and current trends and is therefore strongly data dependent. For this purpose, a history database of the global environment has been developed: HYDE. This paper describes and analyzes parts of HYDE version 2.0, presenting historical population and land use patterns for the past 300 years. Results suggest, among other things, a global increase of cropland area from 265 million ha in 1700 to 1471 million ha in 1990, while the area of pasture has increased more than six fold from 524 to 3451 million ha. In general, the increase of man-made agricultural land took place at the expense of natural grasslands and to a lesser extent of forests. There are differences between the several regions in the temporal pace of these land use conversions. The temperate/developed regions of Canada, United States, USSR, and Oceania appear to have had their strongest increase during the 19th century, while most of the tropical/developing regions witnessed the largest land use conversions at the end of the last century. Results of this analysis can be used to test integrated models of global change and are available at http://www.rivm.nl/env/int/hyde/.

DOI

12
Goldewijk K K, Beusen A, Van Drecht G et al., 2011. The HYDE 3.1 spatially explicit database of human-induced global land-use change over the past 12,000 years.Global Ecology and Biogeography, 20(1): 73-86.ABSTRACT Aim68 This paper presents a tool for long-term global change studies; it is an update of the History Database of the Global Environment (HYDE) with estimates of some of the underlying demographic and agricultural driving factors. Methods68 Historical population, cropland and pasture statistics are combined with satellite information and specific allocation algorithms (which change over time) to create spatially explicit maps, which are fully consistent on a 5′ longitude/latitude grid resolution, and cover the period 10,000bctoad2000. Results68 Cropland occupied roughly less than 1% of the global ice-free land area for a long time untilad1000, similar to the area used for pasture. In the centuries that followed, the share of global cropland increased to 2% inad1700 (. 3 million km) and 11% inad2000 (15 million km), while the share of pasture area grew from 2% inad1700 to 24% inad2000 (34 million km) These profound land-use changes have had, and will continue to have, quite considerable consequences for global biogeochemical cycles, and subsequently global climate change. Main conclusions68 Some researchers suggest that humans have shifted from living in the Holocene (emergence of agriculture) into the Anthropocene (humans capable of changing the Earth's atmosphere) since the start of the Industrial Revolution. But in the light of the sheer size and magnitude of some historical land-use changes (e.g. as result of the depopulation of Europe due to the Black Death in the 14th century and the aftermath of the colonization of the Americas in the 16th century) we believe that this point might have occurred earlier in time. While there are still many uncertainties and gaps in our knowledge about the importance of land use (change) in the global biogeochemical cycle, we hope that this database can help global (climate) change modellers to close parts of this gap.

DOI

13
Goldewijk K K, Van Drecht G, 2006. HYDE 3: Current and historical population and land cover//Bouwman A F, Kram T and Goldewijk K K. Integrated modelling of global environmental change. An overview of IMAGE 2.4. Bilthoven: Netherlands Environmental Assessment Agency.

14
Guo Y J, 2007. Comprehensive Evaluation Theory, Methods and Applications. Beijing: Science Press. (in Chinese)

15
Hall C A S, Tian H, Qi Y et al., 1995. Modelling spatial and temporal patterns of tropical land use change.Journal of Biogeography, 22(4): 753-757.ABSTRACT We developed two spatially explicit models to simulate rates and patterns of tropical land use change. These models also calculate total amounts and spatial distributions of the carbon content and carbon dioxide exchange resulting from deforestation and other land use changes. We use two basic approaches: hypothesis deduction (GEOMOD1) and statistical deduction (GEOMOD2). The hypothesis deduction approach for selecting pattern drivers is based on user-supplied assumptions about how people actually use land. The statistical deduction approach analyses historical patterns of land use change and compares them to user-supplied map layers of physical and cultural attributes. The model then chooses drivers based on the best fit of the patterns. We used digitized and remotely sensed data for Southeast Asia and Africa to test these models. We found that: (1) the variation in accuracy of the model predictions (74-96%) depends on the time scale used, the number of land classes modelled and the accuracy of initia

DOI

16
He F N, Ge Q S, Dai J H et al., 2007. Quantitative analysis on forest dynamics of China in recent 300 years.Acta Geographica Sinica, 62(1): 30-40. (in Chinese)<p>Based on historical documents, modern survey and statistics, as well as the result of predecessor studies, the trend and main process of forest dynamics are recognized. The forest area and forest coverage rates for each province of China from 1700 to 1949 are estimated backward by every 50 years. Linking the result with modern National Forest Inventory data, the spatial-temporal dynamics of Chinese forest in recent 300 years (A.D.1700-1998) is quantitatively analyzed. The study shows that in recent 300 years, the forest area in current territory of China has declined 0.95 &times;10<sup>8</sup> ha (or 9.2 percentage points of coverage rate) in total, with a trend of decrease and recovery. Before the 1960s, there was a trend of accelerated descending. The forest area was reduced 1.66&times;10<sup>8</sup> ha (or 17 percentage points of coverage rate) in 260 years. While after the 1960s, there has been a rapid increase. The forest area increased by 0.7&times;10<sup>8</sup> ha (or 8 percentage points of coverage rate) in 40 years. The study also shows that there is a significant spatial difference in the dynamics of forest. The amplitudes of increasing and decreasing in western China are both smaller than the ones in eastern China. During the rapid declining period 1700-1949, the most decrease appeared in the Northeast, the Southwest and the Southeast, where the coverage rate in most provinces dropped over 20 percentage points. In Heilongjiang Province, the coverage rate dropped 50 points. In Jilin Province, it dropped 36 points. In Sichuan Province and Chongqing Municipality, it dropped 42 points. In Yunnan Province, it dropped 35 points. During the recovery period 1949-1998, the western provinces, municipality and autonomous regions, including Ningxia, Gansu, Inner Mongolia, Sichuan-Chongqing, Yunnan, Tibet, Xinjiang and Qinghai, etc., the increase rates of the coverage are all below 5 percentage points, while the eastern provinces, municipality and autonomous regions (except Heilongjiang, Hubei and Jiangsu-Shanghai) have achieved an increase over 5 percentage points, among which the Guangdong-Hainan, Guangxi, Anhui, Beijing-Tianjin-Hebei, Shandong, Henan, Zhejiang and Fujian have an increase over 10 points.</p>

17
He F N, Ge Q S, Zheng J Y, 2002. Reckoning the areas of urban land use and their comparison in the Qing Dynasty in China.Acta Geographica Sinica, 57(6): 709-716. (in Chinese)<p>Based on the numerable and standardized data collected from historical documents, we reckoned the areas of urban land use for 18 provinces in the Qing Dynasty, analyzed the changing situation, regional differentiation, and contrasted them with those of the contemporary age. The results are shown in the following: (1) The method, by which the areas of urban land use in the Qing Dynasty are reckoned in light with at the administrative division levels, the number of towns and city wall perimeters, was provided with rationality to a certain degree. (2) The results showed that the area of urban land use was 1,987.44 km<sup>2</sup> in 18 provinces of the Qing Dynasty, merely 0.05% of the total land area in the region. Among which the scopes of Zhili and Jiangsu provinces were the greatest, being 316.34 km2 and 185.77 km<sup>2</sup> respectively 0.097% and 0.188% of the jurisdiction area, and Guangxi and Guizhou provinces were the smallest, 27.92 km<sup>2</sup> and 32.78 km<sup>2</sup> respectively (only 0.012% and 0.033% of the jurisdiction area). (3) There were obvious spatial differences in urban land use in the region. For the scale of urban land use, the northern provinces were greater than the southern provinces, the eastern provinces were greater than the western provinces, and southwest provinces were the smallest in all the provinces. The provinces of Zhili, Shaanxi, Sichuan, Jiangsu and Zhejiang were obviously greater than the other provinces.</p>

18
He F N, Li S C, Zhang X Z, 2012. Reconstruction of cropland area and spatial distribution in the mid-Northern Song Dynasty (AD1004-1085).Journal of Geographical Sciences, 22(2): 359-370.<p>To understand historical human-induced land cover change and its climatic effects, it is necessary to create historical land use datasets with explicit spatial information. Using the taxes-cropland area and number of families compiled from historical documents, we estimated the real cropland area and populations within each <em>Lu</em> (a province-level political region in the Northern Song Dynasty) in the mid-Northern Song Dynasty (AD1004-1085). The estimations were accomplished through analyzing the contemporary policies of tax, population and agricultural development. Then, we converted the political region-based cropland area to geographically explicit grid cell-based fractional cropland at the cell size of 60 km by 60 km. The conversion was based on calculating cultivation suitability of each grid cell using the topographic slope, altitude and population density as the independent variables. As a result, the total area of cropland within the Northern Song territory in the 1070s was estimated to be about 720 million <em>mu</em> (Chinese area unit, 1 <em>mu</em> = 666.7 m<sup>2</sup>), of which 40.1% and 59.9% occurred in the north and south respectively. The population was estimated to be about 87.2 million, of which 38.7% and 61.3% were in the north and south respectively, and per capita cropland area was about 8.2 <em>mu</em>. The national mean reclamation ratio (i.e. ratio of cropland area to total land area; RRA hereafter for short) was bout 16.6%. The plain areas, such as the North China Plain, the middle and lower reaches of the Yangtze River, Guanzhong Plain, plains surrounding the Dongting Lake and Poyang Lake and Sichuan Basin, had a higher RRA, being mostly over 40%; while the hilly and mountainous areas, such as south of Nanling Mountains, the southwest regions (excluding the Chengdu Plain), Loess Plateau and southeast coastal regions, had a lower RRA, being less than 20%. Moreover, RRA varied with topographic slope and altitude. In the areas of low altitude (&le;250 m), middle altitude (250-100 m) and high altitude (1000-3500 m), there were 443 million, 215 million and 64 million <em>mu</em> of cropland respectively and their regional mean RRAs were 27.5%, 12.6% and 7.2% respectively. In the areas of flat slope, gentle slope, medium slope and steep slope, there were 116 million, 456 million, 144 million and 2 million <em>mu</em> of cropland respectively and their regional mean RRAs were 34.6%, 20.7%, 8.5% and 2.3% respectively.</p>

DOI

19
Kaplan J O, Krumhardt K M, Zimmermann N, 2009. The prehistoric and preindustrial deforestation of Europe.Quaternary Science Reviews, 28(27): 3016-3034.Humans have transformed Europe's landscapes since the establishment of the first agricultural societies in the mid-Holocene. The most important anthropogenic alteration of the natural environment was the clearing of forests to establish cropland and pasture, and the exploitation of forests for fuel wood and construction materials. While the archaeological and paleoecological record documents the time history of anthropogenic deforestation at numerous individual sites, to study the effect that prehistoric and preindustrial deforestation had on continental-scale carbon and water cycles we require spatially explicit maps of changing forest cover through time. Previous attempts to map preindustrial anthropogenic land use and land cover change addressed only the recent past, or relied on simplistic extrapolations of present day land use patterns to past conditions. In this study we created a very high resolution, annually resolved time series of anthropogenic deforestation in Europe over the past three millennia by 1) digitizing and synthesizing a database of population history for Europe and surrounding areas, 2)developing a model to simulate anthropogenic deforestation based on population density that handles technological progress, and 3) applying the database and model to a gridded dataset of land suitability for agriculture and pasture to simulate spatial and temporal trends in anthropogenic deforestation. Our model results provide reasonable estimations of deforestation in Europe when compared to historical accounts. We simulate extensive European deforestation at 1000 BC, implying that past attempts to quantify anthropogenic perturbation of the Holocene carbon cycle may have greatly underestimated early human impact on the climate system.

DOI

20
Li X B, 1996. A review of the international research on land use/land cover change.Acta Geographica Sinica, 51(6): 553-558. (in Chinese)Land use and land cover change has aroused increasing attention of scientists worldwide since1990.Recognizing the importance of this change to other global environmental change and sustainable development issues,the International Geosphere-Biosphere ProgrammeIGBP)and the HumanDimensions of Global Environmental Change ProgrammeHDP)initiated a joint core projectLand Use and Land Cover Change(LUCC)and published a Science/Research Plan for the project.To promote the national LUCC projects,the paper presents a general review on the basic concepts,background,and Progress on the metnodologies of international LUCC researches.Land use/land cover is not a new research domain but is given new meanings and research contents in the context of global environmental change.Based on the definition of land cover given bythe IGBP/HDP and other international institutions,the author proposes a new translated term ofland cover in Chinese that matches the definition closely.This will avoid misunderstanding of thedomestic LUCC projects at early stages.Land cover changes refer to conversion and modification of vegetation,changes on biodiversity,soil quality,runoff,erosion,sedimentation and land productivity.International researches onLUCC involve:1)influence of LUCC on systematic global enviromental changes like biogeochemicalcircles and climatic variation,and cumulative global environmental changes like eforestation,biodiversity reduction and land degradation;2)response of LUCC to global environmental changes;3)LUCC and sustainable development including the sustainability of different land uses.The fundamental scientific issue of LUCC research is the dynamics of land use and coverchanges,which is extremely significant to the prediction of the global environmental change in thenext 50 to 100 years.The modedling of causes-use-cover system is challenge because of its inherentcomplexity.An integrated approach to the modeling is necessary that combines:1)large-scale onsite case study approach to land use dynamics;2)direct observation and measurement of land coverchange by using remote sensing images;and 3)regional and global modeling of economic processesrelated to LUCC.

21
Liu J Y, Kuang W H, Zhang Z X et al., 2014. Spatiotemporal characteristics, patterns and causes of land use changes in China since the late 1980s.Acta Geographica Sinica, 69(1): 3-14. (in Chinese)Land-use/land-cover 变化(LUCC ) 有连接到人和自然相互作用。瓷器 Land-Use/cover 数据集(CLUD ) 从 1980 年代末在 5 年的间隔定期被更新到 2010,与基于 Landsat TMETM+ 图象的标准过程。陆地使用动态区域化方法被建议分析主要陆地使用变换。在国家规模的陆地使用变化的空间与时间的特征,差别,和原因然后被检验。主要调查结果如下被总结。越过中国的陆地使用变化(LUC ) 在最后 20 年(19902010 ) 里在空间、时间的特征显示了一个重要变化。农田变化的区域在南方减少了并且在北方,而是仍然是的全部的区域增加了几乎未改变。回收农田从东北被转移到西北。布满建筑物陆地很快膨胀了,主要在东方被散布,并且逐渐地展开到中央、西方的中国。树林首先减少了,然后增加但是荒芜的区域是反面。草地继续减少。在中国的 LUC 的不同空间模式被发现在之间迟了第 20 世纪并且早第 21 世纪。原版 13 个 LUC 地区在一些地区被边界的变化由 15 个单位代替。包括的这些变化(1 ) 的主要空间特征加速的扩大布满建筑物在 Huang-Huai-Hai 区域,东南的沿海的区域,长江的中流区域,和四川盆登陆;(2 ) 从东北中国和东方内部蒙古在北方转移了陆地开垦到绿洲在西北中国的农业区域;(3 ) 从在到稻的东北中国的喂雨的农田的连续转变回答;并且(4 ) 为在内部蒙古,黄土高原,和西南的多山的区域的南部的农业牧剧的交错群落的格林工程的谷物的有效性。在最后二十年,尽管在北方的气候变化在农田影响了变化,政策规定和经济驱动力仍然是越过中国的 LUC 的主要原因。在第 21 世纪的第一十年期间,在陆地使用模式驾驶了变化的人为的因素从单程的陆地开发转移了强调到开发和保存。动态区域化方法被用来在单位的 zoning 边界,地区的内部特征,和生长和减少的空间17

DOI

22
Liu M, Tian H.2010. China’s land cover and land use change from 1700 to 2005: Estimations from high-resolution satellite data and historical archives.Global Biogeochemical Cycles, 24(3): B3003.One of the major limitations in assessing the impacts of human activities on global biogeochemical cycles and climate is a shortage of reliable data on historical land cover and land use change (LCLUC). China had extreme discrepancies in estimating contemporary and historical patterns of LCLUC over the last 3 centuries because of its geographical complexity, long history of land use, and limited national surveys. This study aims to characterize the spatial and temporal patterns of China's LCLUC during 1700-2005 by reconstructing historical gridded data sets from high-resolution satellite data and long-term historical survey data. During this 300 year period, the major characteristics of LCLUC in China have been shrinking forest (decreased by 22%) and expanding cropland (increased by 42%) and urban areas (including urban and rural settlements, factories, quarries, mining, and other built-up land). New cropland areas have come almost equally from both forested and nonforested land. This study also revealed that substantial conversion between forest and woodland can be attributed to forest harvest, forest regeneration, and land degradation. During 1980-2005, LCLUC was characterized by shrinking cropland, expanding urban and forest areas, and large decadal variations on a national level. LCLUC in China showed significant spatial variations during different time periods, which were caused by spatial heterogeneity in vegetation, soils, and climate and regional imbalance in economy development. During 1700-2005, forests shrunk rapidly while croplands expanded in the northeast and southwest of China. During 1980-2005, we found a serious loss of cropland and urban sprawl in the eastern plain, north, and southeast regions of China and a large increase in forested area in the southeast and southwest regions. The reconstructed LCLUC data sets from this study could be used to assess the impacts of land use change on biogeochemical cycles, the water cycle, and the regional climate in China. To further eliminate uncertainties in this data set and make reliable projections of LCLUC for the future, we need to improve our understanding of the drivers of LCLUC and work toward developing an advanced, spatially explicit land use model.

DOI

23
Lin S S, Zheng J Y, He F N, 2009. Gridding cropland data reconstruction over the agricultural region of China in 1820.Journal of Geographical Sciences, 19(1): 36-48.<a name="Abs1"></a>Recent studies have demonstrated the importance of LUCC change with climate and ecosystem simulation, but the result could only be determined precisely if a high-resolution underlying land cover map is used. While the efforts based satellites have provided a good baseline for present land cover, what the next advancement in the research about LUCC change required is the development of reconstruction of historical LUCC change, especially spatially-explicit historical dataset. Being different from other similar studies, this study is based on the analysis of historical land use patterns in the traditional cultivated region of China. Taking no account of the less important factors, altitude, slope and population patterns are selected as the major drivers of reclamation in ancient China, and used to design the HCGM (Historical Cropland Gridding Model, at a 60 km×60 km resolution), which is an empirical model for allocating the historical cropland inventory data spatially to grid cells in each political unit. Then we use this model to reconstruct cropland distribution of the study area in 1820, and verify the result by prefectural cropland data of 1820, which is from the historical documents. The statistical analyzing result shows that the model can simulate the patterns of the cropland distribution in the historical period in the traditional cultivated region efficiently.

DOI

24
Jiang L Q, Zhang L J, Zang S Y et al., 2016. Accuracy assessment of approaches to spatially explicit reconstruction of historical cropland in Songnen Plain, Northeast China.Journal of Geographical Sciences, 26(2): 219-229.<p>To understand historical human-induced land use/cover change (LUCC) and its climatic effects, it is essential to reconstruct historical land use/cover changes with explicit spatial information. In this study, based on the historically documented cropland area at county level, we reconstructed the spatially explicit cropland distribution at a cell size of 1 km × 1 km for the Songnen Plain in the late Qing Dynasty (1908 AD). The reconstructions were carried out using two methods. One method (hereafter, referred to as method I) allocated the cropland to cells ordered from a high agricultural suitability index (ASI) to a low ASI, but they were all within the domain of potential cropland area. The potential cropland area was created by excluding natural woodland, swamp, water bodies, and mountains from the study area. The other method (hereafter, method II) allocated the cropland to cells in the order from high ASI to low ASI within the domain of cropland area in 1959. This method was based on the hypothesis that the cropland area domain in 1959 resulted from enlargement of the cropland area domain in 1908. We then compared these two reconstructions. We found that the cropland distributions reconstructed by the two methods exhibit a similar spatial distribution pattern. Both reconstructions show that the cropland was mostly found in the southern and eastern parts of the Songnen Plain. The two reconstructions matched each other for about 68% of the total cropland area. By spatially comparing the unmatched cropland cells of the two reconstructions with the settlements for each county, we found that unmatched cropland cells from method I are closer to settlements than those from method II. This finding suggests that reconstruction using method I may have less bias than reconstruction with method II.</p>

DOI

25
Jin Q M, 1988. Rural Settlement Geography. Beijing: Science Press. (in Chinese)In ancient China, there was no systematic research on rural settlement. What we can see today on ancient rural settlement is the general description in local records, novels and travels. Xu Xiake the great ancient geographer, born 400 years ago, was the first one who began the research and record of rural settlement in China. The systematic research on rural settlement was initiated in 1930's when French scholar Jean Brunhes' a Geographie Humaine?was translated into Chinese, which had a fundamental influence on the circle of geographical science in China. . Before the foundation of the People's Republic of China, the Chinese ge 'graphers had carried out some geographical researches on rural settlement, including: (1) research on the theory of settlement geography; (2) the systematic research on rural settlement in a given region; (3) studies on towns; (4) rural settlement research as apart of regional geography. So far as contents concerned, all the recesarches made then put emphasis on the explanation of the cause-effect relationship between scitlement and its environments. Since the foundation of the People's Republic of China, the research on rural settlement geography has experienced three main phases: (1) In the early 1950's, because of the improper treatment of human geography in China, fewer and fewer geographers were engaged in the field; (2) During 1958-1959, a large number of geographers participated in the planning of People's Commune, meanwhile, the rural settlement planning, as a part of the People's Com-mune Planning, was emphasized; (3) Since the hate oof 1970's, with the improvement of rural ceonomy and the new coming phase of town-village construction, the importance of research on rural settlement geography has been recognized. Meanwhile, the new research fields, such a. territorial management, have provided rural settlement geography with a wide range of research projects. Moreover, the focus of rural s-'ttleinent geography has been shifting from the explanation of relationship between settlement a .d its environments to predicting, planning and designing of rural settlement for future development. The current trends of research on rual set dement geography in China are as following: (1) to serve the reform, management, rational distribution and planning of rural settlement; (2) researches on the tran,formastion, migration of rural population and the trends, sizes and processes of rural urbanization; (3) the theoretical synthesis of rural settlement geography; ( 4) the quantitative approach: (5) the analysis of new types of man-land relationship, in or-dcr to harmonize the settlement with economic development and its environments: (6) enhan-cement of the research on rural settlement geography within regional geography.

26
Li K, He F N, Zhang X Z, 2011. An approach to reconstructing historical cropland spatial distribution with grid-boxes by utilizing MODIS land cover dataset: A case study of Yunnan Province in the Qing Dynasty.Geographical Research, 30(12): 2281-2288. (in Chinese)Highly precise Land Use and Cover Change(LUCC) dataset plays a key role in improving simulations of effects of LUCC on climate and ecosystem.Historical LUCC usually has no precise spatial location information.This shortage limited usage of historical LUCC dataset in the global environmental changes simulations.So,it is needed to develop an effective way to reconstruct historical cropland spatial distribution with grid-boxes.In this study,we develop a new way in which the spatial distribution of historical cropland was reconstructed effectively.This approach was built on a reasonable hypothesis that historical cropland was located in the domain of present cropland area.This hypothesis was derived from a feature that cropland area increased all the time generally in the past 300 years.This approach includes two steps:(1) estimating the easiness for reclamation one pixel by one pixel within the cropland domain determined by MODIS land cover product;(2) by descending order of easiness for reclamation,filling in the pixels with cropland from historical inventories;it would not stop until the total area of cropland pixels was equal to inventory cropland area.As a case study,we reconstructed the spatial distribution with a 90-m resolution of cropland in the Yunnan Province in 1671 and 1827 by using this approach.The results show this approach could reconstruct the historical cropland spatial distribution with high resolution.

DOI

27
Li S C, He F N, Chen Y S, 2012. Gridding reconstruction of cropland spatial patterns in Southwest China in the Qing Dynasty.Progress in Geography, 31(9): 1196-1203. (in Chinese)On the basis of modern cropland spatial pattern, we designed a method to quantify the relationship among topography (including altitude and slope), production potential of climate (including light, temperature and water), population density and cropland spatial pattern. Then the method was used to reconstruct cropland spatial pattern with a resolution of 10 km by 10 km in Southwest China for 6 periods between 1661 and 1784 in the Qing Dynasty. The results are shown as follows. (1) As a whole, the changes of cropland spatial pattern in Southwest China can be described in two respects. One is the expansion of cultivated area, which are mainly distributed in the Sichuan Basin and the Yunnan-Guizhou Plateau. The grid cells with small cropland fractions (0~10%) decreased by 24.0% during the past 250 years. The other is enhancement of cultivation intensity, which are obvious in the Sichuan Basin and the central-eastern parts of Yunnan Province. The grid cells whose cropland fractions are relatively large (&gt;30%) increased by 10.3% during the past 250 years. (2) The process of cropland change in Southwest China in the Qing Dynasty can be divided into three periods. The cultivation recovery period (1661-1724)--the grid cells whose cropland fractions are small (0~10%) decreased by 11.4%; the slow cultivation expansion period (1724-1820)-the grid cells whose cropland fractions are small (0~10%) decreased by 7% while the grid cells with relatively large cropland fractions (&gt;30%) increased by 7%. The postwar abandonment of cropland in some parts of the study area and recovery period (1820-1911)-the grid cells whose cropland fractions are small (0~10%) decreased from 75.0% to 72.2% while the grid cells whose cropland fractions are relatively large (&gt;30%) increased from 9.1% to 10.9%. The results of correlation analysis indicate that the reconstruction is reasonable to some degree.

DOI

28
Li S C, He F N, Zhang X Z, 2014. An approach to spatially explicit reconstruction of historical forest in Northeast China.Journal of Geographical Sciences, 24(6): 1022-1034.<p>The spatially explicit reconstruction of historical land-cover datasets plays an important role in studying the climatic and ecological effects of land-use and land-cover change (LUCC). Using potential natural vegetation (PNV) and satellite-based land use data, we determined the possible maximum distribution extent of forest cover in the absence of human disturbance. Subsequently, topography and climate factors were selected to assess the suitability of land for cultivation. Finally, a historical forest area allocation model was devised on the basis of the suitability of land for cultivation. As a case study, we used the historical forest area allocation model to reconstruct forest cover for 1780 and 1940 in Northeast China with a 10-km resolution. To validate the model, we compared satellite-based forest cover data with our reconstruction for 2000. A one-sample t-test of absolute bias showed that the two-tailed significance was 0.12, larger than the significant level 0.05, suggesting that the model has strong ability to capture the spatial distribution of forests. In addition, we calculated the relative difference of our reconstruction at the county scale for 1780 in Northeast China. The number of counties whose relative difference ranged from -30% to 30% is 99, accounting for 74.44% of all counties. These findings demonstrated that the provincial forest area could be transformed into forest cover maps well using the model.</p>

DOI

29
Lin C, Lou T M, Wang C J et al., 1946. Geographical survey of the Jialing River Basin (Volume 2).Geographical Special Issue, (1): 105-135. (in Chinese)

30
Liu J Y, 1996. Macro-scale Survey and Dynamic Study of Natural Resources and Environment of China by Remote Sensing. Beijing: China Science and Technology Press. (in Chinese)

31
Local Chronicles Compilation Committee of Jiangsu Province (LCCCJP), 1999. Jiangsu Provincial Annals: Geography Annals. Nanjing: Jiangsu Ancient Book Press. (in Chinese)

32
Long Y, Jin X B, Yang X H et al., 2014. Reconstruction of historical arable land use patterns using constrained cellular automata: A case study of Jiangsu, China.Applied Geography, 52: 67-77.The reconstruction of arable land patterns over historical periods is one of critical research issues in the study of land use and land cover change (LUCC). Taking into account the continuous distribution of arable land and spatial constraints, this paper proposes a constrained cellular automata model to reconstruct historical arable land patterns. The paper describes model establishment, parameter calibration, and results validation in detail. The model was applied to Jiangsu Province, China, and was compared with a conventional spatial allocation method. The results showed that the methodology developed in this study can more objectively reflect the evolution of the pattern of arable land over historical periods, in terms of similarity with contemporary pattern, than the spatial allocation methods and can provide an effective basis for the historical study of arable land. (C) 2014 Elsevier Ltd. All rights reserved.

DOI

33
Lu X Q, Ma J, 2009. City within the city walls: Rethinking the seat city form of ancient China.Social and Economic History of China, (2): 7-16. (in Chinese)

34
Lu Y, Zhang S W, Yang J C, 2010. Application of toponymy to the historical LUCC researches in Northeast China: Taking Zhenlai County of Jilin Province as an example.Geo-information Science, 12(2): 174-179. (in Chinese)Researches on historical land use and land cover change(LUCC) have important significance for the future human activities.In this paper,taking Zhenlai County of Jilin Province as the study area,the application of toponymy and other correlative historical data to acquire the beginning period of large-scale land reclamation in Northeast China was discussed.And integrating with reclassification methods,centroid transfer analysis and overlay analysis,the characteristics of residential area evolvement and land development in Zhenlai County were analyzed according to the historical records in the toponymy and so on.It was documented that during the Kangxi Period in Qing Dynasty or 1853,there were small-scale of land reclamation along with the settlement activities in Zhenlai County.From about 1875 on,the land reclamation became continuous,while it was almost in a natural state before.In the early days,with lagging techniques,the evolution of villages and land development process were interactional.Therefore,from the view of village evolution,we could deduce it was the most prominent period for land reclamation during 1907-1912;and by 1975,the village pattern in Zhenlai County was formed and stable,at the same time the land reclamation activities has transformed from individual behavior into the collective and mechanized farming.In brief,under the influences of various policies in Northeast China and natural disasters and wars,land development in Zhenlai County expanded from the eastern and central flat regions to the western high-lying areas.

35
Luo J, Zhang Y L, Liu F G et al., 2014. Reconstruction of cropland spatial patterns for 1726 on Yellow River-Huangshui River Valley in northeast Qinghai-Tibet Plateau.Geographical Research, 33(7): 1285-1296. (in Chinese)In this study, first we revised the taxes-cropland area data in historical documents and estimated the cropland area in 1726(the fourth year of Emperor Yongzheng's Reign in the Qing Dynasty) of Yellow River-Huangshui River Valley(YHV) which is located in northeast of Qinghai-Tibet Plateau. Subsequently, the cropland area was allocated into grids with a resolution of 2 km by 2 km under the help of GIS technology. The results show that the cropland area of YHV in 1726 was 1.427脳103km2, among which, 64.7% was cultivated by the minority as well as 35.3% was cultivated by soldiers and chieftain. The arable land of YHV is little due to the harsh natural environment. Crops can be found in some 47% of all grids and these grids were distributed in the Huangshui River basin, Beichuan River basin, the mid-lower reaches of the Datong and Yellow River. In terms of intensity of land use, the YHV had a low reclamation index in 1726. The reclamation index of 68.3% of all grids was less than 10% and only 1.4% of all grids had a reclamation index greater than 40%, which was attributed to the harsh environment and governmental policy. In addition, the spatial difference of the land use intensity was obvious. The reclamation index of Xining County was great on the whole and the mean value reached 13.5% at grid scale.

DOI

36
Niu P H, 1990. Comprehensive Table of Administrative Evolution of the Qing Dynasty. Beijing: Sinomaps Press. (in Chinese)

37
Pongratz J, Reick C, Raddatz T et al., 2008. A reconstruction of global agricultural areas and land cover for the last millennium. Global Biogeochemical Cycles, 22: GB3018. doi: 10.1029/2007GB003153.Humans have substantially modified the Earth's land cover, especially by transforming natural ecosystems to agricultural areas. In preindustrial times, the expansion of agriculture was probably the dominant process by which humankind altered the Earth system, but little is known about its extent, timing, and spatial pattern. This study presents an approach to reconstruct spatially explicit changes in global agricultural areas (cropland and pasture) and the resulting changes in land cover over the last millennium. The reconstruction is based on published maps of agricultural areas for the last three centuries. For earlier times, a country-based method is developed that uses population data as a proxy for agricultural activity. With this approach, the extent of cropland and pasture is consistently estimated since AD 800. The resulting reconstruction of agricultural areas is combined with a map of potential vegetation to estimate the resulting historical changes in land cover. Uncertainties associated with this approach, in particular owing to technological progress in agriculture and uncertainties in population estimates, are quantified. About 5 million kmof natural vegetation are found to be transformed to agriculture between AD 800 and 1700, slightly more to cropland (mainly at the expense of forested area) than to pasture (mainly at the expense of natural grasslands). Historical events such as the Black Death in Europe led to considerable dynamics in land cover change on a regional scale. The reconstruction can be used with global climate and ecosystem models to assess the impact of human activities on the Earth system in preindustrial times.

DOI

38
Ramankutty N, Foley J A, 1998. Characterizing patterns of global land use: An analysis of global croplands data.Global Biogeochemical Cycles, 12(4): 667-685.Human activities have shaped significantly the state of terrestrial ecosystems throughout the world. One of the most direct manifestations of human activity within the biosphere has been the conversion of natural ecosystems to croplands. In this study, we present an analysis of the geographic distribution and spatial extent of permanent croplands. This analysis represents the area in permanent croplands during the early 1990s for each grid cell on a global 5 min ( 10 km) resolution latitude-longitude grid. To create this data set, we have combined a satellite-derived land cover data set with a variety of national and subnational agricultural inventory data. A simple calibration algorithm was used so that the spatial land cover data were generally consistent with nonspatial agricultural inventory data. The spatial distribution of croplands represented in this analysis presents a quantitative depiction of global agricultural geography. The regions of the world known to have intense cultivation (e.g., the North American corn belt, the European wheat-corn belt, the Ganges floodplain, and eastern China) are clearly portrayed in this analysis. It also captures the less intensely cultivated regions of the world, usually surrounding the regions mentioned above, and regions characterized by subsistence agriculture (e.g., Sahelian Africa). Data generated from this kind of analysis can be used within global climate models and global ecosystem models to assess the importance of permanent croplands on environmental processes. In particular, these data, combined with models, could help evaluate the role of changing land cover on regional climate and carbon cycling. Future efforts will need to concentrate on other land use systems, including pastures and regions of shifting cultivation. Furthermore, land use and land cover data must be extended to include an historical dimension so as to evaluate the changing state of the biosphere over time. This article contains supplementary material.

DOI

39
Ramankutty N, Foley J A, 1999. Estimating historical changes in global land cover: Croplands from 1700 to 1992.Global Biogeochemical Cycles, 13(4): 997-1027.Baethge C, Marx C.

DOI

40
Ramankutty N, Foley J A.ISLSCP II Historical Croplands Cover, 1700-1992. In: Hall F G, Collatz G, Los S et al. (eds.). ISLSCP Initiative II Collection. Data set. Available on-line [http://daac.ornl.gov/] from Oak Ridge National Laboratory Distributed Active Archive Center, Oak Ridge, Tennessee, USA, 2010.

41
Shen W X, Ma T L, 1994. Utilization, problems and solutions of forest resources of Jiangsu Province.Forest Resources Management, (4): 50-53. (in Chinese)

42
Steffen W, Sanderson R A, Tyson P D et al., 2005. Global Change and the Earth System: A Planet under Pressure. New York: Springer-Verlag.

43
Sterling S. M., Ducharne A., Polcher J.2013. The impact of global land-cover change on the terrestrial water cycle.Nature Climate Change, 3(4): 385-390.Floods and droughts cause perhaps the most human suffering of all climate-related events; a major goal is to understand how humans alter the incidence and severity of these events by changing the terrestrial water cycle. Here we use over 1,500 estimates of annual evapotranspiration and a database of global land-cover change(1) to project alterations of global scale terrestrial evapotranspiration (TET) from current anthropogenic land-cover change. Geographic modelling reveals that land-cover change reduces annual TET by approximately 3,500 km(3) yr(-1) (5%) and that the largest changes in evapotranspiration are associated with wetlands and reservoirs. Land surface model simulations support these evapotranspiration changes, and project increased runoff (7.6%) as a result of land-cover changes. Next we create a synthesis of the major anthropogenic impacts on annual runoff and find that the net result is an increase in annual runoff, although this is uncertain. The results demonstrate that land-cover change alters annual global runoff to a similar or greater extent than other major drivers, affirming the important role of land-cover change in the Earth System(2-4). Last, we identify which major anthropogenic drivers to runoff change have a mean global change statistic that masks large regional increases and decreases: land-cover change, changes in meteorological forcing, and direct CO2 effects on plants.

DOI

44
Steyaert L T, Knox R G.2008. Reconstructed historical land cover and biophysical parameters for studies of land-atmosphere interactions within the eastern United States.Journal of Geophysical Research: Atmospheres, 113. doi: 10.1029/2006JD008277.Over the past 350 years, the eastern half of the United States experienced extensive land cover changes. These began with land clearing in the 1600s, continued with widespread deforestation, wetland drainage, and intensive land use by 1920, and then evolved to the present-day landscape of forest regrowth, intensive agriculture, urban expansion, and landscape fragmentation. Such changes alter biophysical properties that are key determinants of land-atmosphere interactions (water, energy, and carbon exchanges). To understand the potential implications of these land use transformations, we developed and analyzed 20-km land cover and biophysical parameter data sets for the eastern United States at 1650, 1850, 1920, and 1992 time slices. Our approach combined potential vegetation, county-level census data, soils data, resource statistics, a Landsat-derived land cover classification, and published historical information on land cover and land use. We reconstructed land use intensity maps for each time slice and characterized the land cover condition. We combined these land use data with a mutually consistent set of biophysical parameter classes, to characterize the historical diversity and distribution of land surface properties. Time series maps of land surface albedo, leaf area index, a deciduousness index, canopy height, surface roughness, and potential saturated soils in 1650, 1850, 1920, and 1992 illustrate the profound effects of land use change on biophysical properties of the land surface. Although much of the eastern forest has returned, the average biophysical parameters for recent landscapes remain markedly different from those of earlier periods. Understanding the consequences of these historical changes will require land-atmosphere interactions modeling experiments.

DOI

45
Tang M L, Yao S M, 1999. On the development of urbanization in Jiangsu Province: Process and characteristics.Economic Geography, 19(4): 117-122. (in Chinese)This paper begins with the concept, manifest and measurement indices of urbanization. Then it analyzes the problems in our current statistics about urban population and insists that urban population should include other types of population.who lives in the designated cities and towns, such ae the agricultural populatuion,the temporary population,commute population and mobile population.The historical development of urbanization in Jiangsu province can be divided into several periods during which the economic development,the development of urbanization and their relationship are discussed.The process of urbanization is analogous to the whole country in terms urban development and urbanization in Jiangsu are analyzed in detail.Since reform and open door policy,Jiangsu province has withessed a rapid growth of the number of cities and towns and urban population,but the current level of urbanization is still low.The regional difference of urbanization is remarkable among the regions.The growth rates of cities and towns of different scale and rank is different in population and number.The development of nonagriculturalization of the rural labor force the cryptic urbanization continuing.

46
Tian G J, Liu J Y, Zhang Z X et al., 2002. The scale distribution characteristics of Chinese rural settlements by remote sensing and GIS.Journal of Remote Sensing, 6(4): 307-312. (in Chinese)The rural settlements of China are picked up from the land use vector map by interpreting the Thermatic Map of 2000.About 9.57*105rural seyylements are calculated by the GIS software.The rural settlements density in the eastern area is larger than provinces are higher while sparse in Tibet and Qinghai provinces.The average area of the rural settlement is 16.27hm2.The regional disparity of the rural,settlement scale is apparent.The average area of Northern China is biggee than that of Southern China.Those in the plain area is bigger than in the mountain area and those in the developed area is bigger than in the developing area.Chinese rural settlements are smaller and about 50.09% is between 2―9hm229.92% 10―21hm2,10.32% 22―34hm2,8.67% 35―104hm2and only 1% more than 104hm2.From the Lorenz curve we can see that about 80% of the rural settlements are 10―21hm2 and the number of 2―34hm2takes up about 90%.When the scale is 34hm2,the slope of the curve is lowest and nearly smooth.In Hunan province whose average acrage is smaller about 84.76% of the rural settlements are 10―21hm2.In Hebei province about 21.51% of the rural settlements are 10―21hm2.The expotential distribution is calculated and the relevant equation between the area and the numbei of settlements at least a hm2N(a)=ca-1.865 is obtained by the log regression.B of Hunan province is the largest in the selective cases and that of Guangdong is the smallest.Although B of Shandong and Guangdong provinces is of little difference,the number of the settlements between 2―10hm2.In North province-Shandong takes up 35.91% while that of South province-Guangdong takes up 35.91%.The spatial distribution of the rural settlements is measured by the lacunarity index.The lacunarity index correlates with the rural settlement dendity.In the area where the rural settlement density is high the lacunarity is low,the distribution is even and the gap batween the settlements is low.On the contrary,in the area that the rural settlement density is low the lacunarity is high,the distribution is uneven and the gap is high.

DOI

47
Turner B L, Skole D L, Sanderson S et al., 1995. Land-use and Land-cover Change Science/Research Plan. Stochkholm: IGBP.

48
Voldoire A, Eickhout B, Schaeffer M et al., 2007. Climate simulation of the twenty-first century with interactive land-use changes.Climate Dynamics, 29(2): 177-193.To include land-use dynamics in a general circulation model (GCM), the physical system has to be linked to a system that represents socio-economy. This issue is addressed by coupling an integrated assessment model, IMAGE2.2, to an ocean atmosphere GCM, CNRM-CM3. In the new system, IMAGE2.2 provides CNRM-CM3 with all the external forcings that are scenario dependent: greenhouse gas (GHGs) concentrations, sulfate aerosols charge and land cover. Conversely, the GCM gives IMAGE changes in mean temperature and precipitation. With this new system, we have run an adapted scenario of the IPCC SRES scenario family. We have chosen a single scenario with maximum land-use changes (SRES A2), to illustrate some important feedback issues. Even in this two-way coupled model set-up, land use in this scenario is mainly driven by demographic and agricultural practices, which overpowers a potential influence of climate feedbacks on land-use patterns. This suggests that for scenarios in which socio-economically driven land-use change is very large, land-use changes can be incorporated in GCM simulations as a one-way driving force, without taking into account climate feedbacks. The dynamics of natural vegetation is more closely linked to climate but the time-scale of changes is of the order of a century. Thus, the coupling between natural vegetation and climate could generate important feedbacks but these effects are relevant mainly for multi-centennial simulations.

DOI

49
Wang G S, Jie Y W, Wang X Q et al., 2013. Data reconstruction of Heihe River Basin cultivated land area prior to the Ming Dynasty.Resources Science, 35(2): 362-369. (in Chinese)As an important agricultural grain base in northwest China and one of the earliest regions with large-scale oasis agricultural development,the Heihe River basin has undergone much change since ancient times.Due to the limitations and omissions of historical records on agricultural production,analysis of changes in cultivated land area before the Ming Dynasty is lacking.Selecting the Han,Tang and Yuan Dynasties with relatively rich historical documents as research periods,two different reconstruction methods based on per person cultivated land area and grain yield were used to reconstruct the quantity of cultivated land area across the Heihe River basin prior to the Ming Dynasty.Results show that the area of cultivated land reached maximal value during the Western Han Dynasty(from 16.30 × 10 4 hm 2 to 19.49 × 10 4 hm 2).Following this dynasty,cultivated land area declined during the Eastern Han,Tang and Yuan Dynasties,with areas from 9.57×10 4 hm 2 to 11.80×10 4 hm 2,from 3.59×10 4 hm 2 to 3.93×10 4 hm 2 and 3.19×10 4 hm 2 in each period.Comparing the two reconstruction methods showed that the former one is largely in line with the latter one,and confirms the reliability of reconstruction results and changes in cultivated land.

50
Wang S H, 1984. Regional studies of China’s modernization: Jiangsu Province (1860-1916). Taipei: Institute of Modern History, Academia Sinica. (in Chinese)

51
Wang S S, 2009. Study on the structure of construction land in Chinese ancient city based on the analysis of Hejin and Hancheng.Journal of Xi’an University of Architecture & Technology (Natural Science Edition), 41(3): 391-396. (in Chinese)The structure of urban land can reflect resident's social life order and the character of a city in a given period.This article sums up the structure of construction land for two sample cities,Hejin and Hancheng through quantitative analysis.Furthermore,in comparison with the investigation on the modern city,this article discovers fundamentals of changes in urban land structure from the period of agricultural civilization to industrial civilization.While the percentage of residential land remains stable,the civic culture land reduces suddenly and a boom in industrial land is ongoing.This will contribute a lot to our further understanding of deep structure and social concepts of ancient cities.What is more,the historical intelligence revealed in this article maybe helpful to current urban planning.

52
Xie H L, Li B, 2008. Driving forces analysis of land-use pattern changes based on logistic regression model in the farming-pastoral zone: A case study of Ongiud Banner, Inner Mongolia.Geographical Research, 27(2): 294-304. (in Chinese)本文以农牧交错带的典型区域——内蒙古翁牛特旗为例,考虑土地利用变化过程的空间变量,建立了不同土地利用变化过程的logistic回归模型。结果表明:模型中转为耕地的主要解释变量是到农村居民点的距离和农业气候区;转为草地的主要解释变量是到农村居民点的距离、土壤表层有机质含量和到乡镇中心的距离;转为林地的主要解释变量是到农村居民点的距离和海拔;空间异质性和土地利用变化过程的时间变量共同影响着使用logistic回归模型来解释土地利用变化驱动力的能力;通过对草地logistic回归模型的检验,得出空间统计模型能较好地揭示不同土地利用变化过程的主要驱动力及其作用机理。

DOI

53
Yang X H, Jin X B, Guo B B et al., 2015a. Research on reconstructing spatial distribution of historical cropland over 300 years in traditional cultivated regions of China.Global and Planetary Change, 128: 90-102.Constructing a spatially explicit time series of historical cultivated land is of upmost importance for climatic and ecological studies that make use of Land Use and Cover Change (LUCC) data. Some scholars have made efforts to simulate and reconstruct the quantitative information on historical land use at the global or regional level based on “top–down” decision-making behaviors to match overall cropland area to land parcels using land arability and universal parameters. Considering the concentrated distribution of cultivated land and various factors influencing cropland distribution, including environmental and human factors, this study developed a “bottom–up” model of historical cropland based on constrained Cellular Automaton (CA). Our model takes a historical cropland area as an external variable and the cropland distribution in 1980 as the maximum potential scope of historical cropland. We selected elevation, slope, water availability, average annual precipitation, and distance to the nearest rural settlement as the main influencing factors of land use suitability. Then, an available labor force index is used as a proxy for the amount of cropland to inspect and calibrate these spatial patterns. This paper applies the model to a traditional cultivated region in China and reconstructs its spatial distribution of cropland during 6 periods. The results are shown as follows: (1) a constrained CA is well suited for simulating and reconstructing the spatial distribution of cropland in China's traditional cultivated region. (2) Taking the different factors affecting spatial pattern of cropland into consideration, the partitioning of the research area effectively reflected the spatial differences in cropland evolution rules and rates. (3) Compared with “HYDE datasets”, this research has formed higher-resolution Boolean spatial distribution datasets of historical cropland with a more definitive concept of spatial pattern in terms of fractional format. We conclude that our reconstruction is closer to the actual change pattern of the traditional cultivated region in China.

DOI

54
Yang X H, Guo B B, Jin X B et al., 2015b. Reconstructing spatial distribution of historical cropland in China’s traditional cultivated region: Methods and case study.Chinese Geographical Science, 25(1): 1-15.As an important part of land use/cover change (LUCC), historical LUCC in long time series attracts much more attention from scholars. Currently, based on the view of combining the overall control of cropland area and 'top-down' decision-making behaviors, here are two global historical land-use datasets, generally referred as the Sustainability and the Global Environment datasets (SAGE datasets) and History Database of the Global Environment datasets (HYDE datasets). However, at the regional level, these global datasets have coarse resolutions and inevitable errors. Considering various factors that influenced cropland distribution, including cropland connectivity and the limitation of natural and human factors, this study developed a reconstruction model of historical cropland based on constrained Cellular Automaton (CA) of 'bottom-up'. Then, an available labor force index is used as a proxy for the amount of cropland to inspect and calibrate these spatial patterns. Applied the reconstruction model to Shandong Province, we reconstructed its spatial distribution of cropland during 8 periods. The reconstructed results show that: 1) it is properly suitable for constrained CA to simulate and reconstruct the spatial distribution of cropland in traditional cultivated region of China; 2) compared with 'SAGE datasets' and 'HYDE datasets', this study have formed higher-resolution Boolean spatial distribution datasets of historical cropland with a more definitive concept of spatial pattern in terms of fractional format.

DOI

55
Ye Y, Fang X Q, Ren Y Y et al., 2009a. Coverage changes of cropland in northeastern China during the past 300 years.Science in China Series D: Earth Sciences, 39(3): 340-350. (in Chinese)Land use/cover change induced by human activities has emerged as a "global" phenomenon with Earth system consequences. Northeast China is an area where the largest land cultivation activities by migrants have happened in China during the past 300 years. In this paper, methods including documentary data calibration and multi-sourced data conversion model are used to reconstruct historical cropland cover change in Northeast China during the past 300 years. It is concluded that human beings have remarkably changed the natural landscape of the region by land cultivation in the past 300 years. Cropland area has increased almost exponentially during the past 300 years, especially during the past 100 years when the ratio of cropland cover changed from 10% to 20%. Until the middle of the 19th century, the agricultural area was still mainly restricted in Liaoning Province. From the late 19th century to the early 20th century, dramatic changes took place when the northern boundary of cultivation had extended to the middle of Heilongjiang Province. During the 20th century, three agricultural regions with high ratio of cropland cover were formed after the two phases of spatial expansion of cropland area in 1900s-1930s and 1950s-1980s. Since 1930s-1940s, the expansion of new cultivated area have invaded the forest lands especially in Jilin and Heilongjiang Provinces.

DOI

56
Ye Y, Fang X Q, Zhang X Z et al., 2009b. Coverage changes of forestland and grassland in northeastern China during the past 300 years.Journal of Beijing Forestry University, 31(5): 137-144. (in Chinese)Abstract Northeastern China is one of the regions having the most abundant forest and grass resources in China. During the past 3 centruries(1700-2000), land cover changes, such as deforestation, grass degeneration, etc., have influenced the climate system by changing surface albedo and carbon flux between land and atmosphere. This paper uses historical document analysis and reconstruction of original potential vegetation cover combined with driving force analysis to reconstruct forest and grassland cover changes over the past 3 centruries in northeastern China. The authors hope to provide forest and grassland coverage data on spatial resolution of county level and time resolution of approximately 100 years, and also provide real historical data for climate models, carbon emission estimates, and other relative research. Furthermore, greater knowledge was sought about the characteristics of forest and grassland cover changes in northeastern China over the past 300 years: the proportions of forestland and grassland in northeastern China were reduced by approximately 15% and 10%; during 18-19 centuries, natural vegetation coverage in northeastern China was still nearly at the initial state, the area where the forest and grassland reduced mainly concentrated in agriculture and reclamation areas of eastern and western Liaoning Province; 1900-1950 is the most rapid time of reduction, natural vegetation in eastern and western Liaoning Province was almost completely destroyed, forest reduction in the Yalu River Basin and the Changbai Mountain area was extremely obvious, the grassland distribution flinched obviously to the west; in late half of the 20th century, forest cover showed a trend of spatial expansion except that the part of area was still decreasing, but the grassland cover showed reduction tendency continuously.

DOI

57
Yi H M, Zhou S L, Wu S H et al., 2013. An integrated assessment for regional heavy metal contamination in soil based on normal fuzzy number.Acta Scientiae Circumstantiae, 33(4): 1127-1134. (in Chinese)Due to the uncertainty of assessment of heavy metal contaminations in soils, an integrated approach for evaluation of heavy metals contamination in regional soil based on normal fuzzy number was established. This evaluation method was applied to evaluate the soil contamination of heavy metals in T City of Jiangsu Province. The result showed that most of heavy metals were at clean level except As at slight contamination level. Hg, Cu, Zn were also at slight contamination level in parts of the study area. Enrichment contamination degree of heavy metal was in the order of As>Cu>Hg>Zn>Ni>Cr>Cd>Pb. Although most of heavy metals was at clean level, As, Hg, Cu, Zn were in the edge of contamination level and much attention should be paid on controlling those elements. Compared with the result of triangular fuzzy number method, this method described the membership degree of each heavy metal more precisely and provided more comprehensive and accurate evaluation information.

58
Zhai L S, 2008. Integrated Natural Zoning and Architecture Systems of Provincial Town Architecture of China: Theory and Practice of Jiangsu, Guizhou and Hebei Provinces. Beijing: Geological Press. (in Chinese)

59
Zhao Y, 2005. Land use and driving force of the Region of Su-Wan (1500-1937) [D]. Shanghai: Fudan University. (in Chinese)

60
Zhang J, Chen X, 2007. The historical land use and vegetation cover change in eastern China.Journal of Nanjing University (Natural Sciences), 43(5): 544-555. (in Chinese)The research on land use and vegetation cover change is one of the leading fields of the contemporary international science research,and the important basis of the climate change.Especially,how to get the quantitative information on the change of the vegetation cover in the past is crucial for simulating the climate.However,among the numerical simulation researches on the regional climate change in the past 300 years,we lack the grid data which reflect the vegetation cover change reselting from the land use in the east of China.On the basis of reclamation ratio distribution of the land use in some provinces in eastern China resumed by the former researches,we get the figures on the changing distribution of the land use and vegetation cover in some provinces in the east of China in the past 300 years,of which the spatial resolution is 0.5 0.5 by analyzing the records of the history during the periods of Qing Dynasty and Republic of China and comparing and contrasting the distribution maps of the contemporary land use.The results show that in the past 300 years,the land in provinces in the middle and lower reaches of Yangtze River and in northern China are mainly farming land;while that of other provinces are mainly covered by woods,and can be divided into different forest types according to some geographical and climatic factors.Furthermore,lawn and land used for transportation and living are subordinate on the change of land cover types because of their small percentages in land use.This quantitative result will provide essential vegetation fields for regional climate simulation.

DOI

61
Zhang L J, Jiang L Q, Zhang X Z, 2015. Spatially precise reconstruction of cropland areas in Heilongjiang Province, Northeast China during 1900-1910.Journal of Geographical Sciences, 25(5): 592-602.<p>It is necessary to reconstruct past changes in land use and land cover to understand the historical effects of humans on climate and the local environment. We collected information from historical documents on the cropland area at the county level for Heilongjiang Province, northeast China during 1900-1910. The original records from different historical documents were calibrated with each other. We then defined an agricultural suitability index quantified by the distance from settlements, the slope and complexity of the topography, and the distance from rivers. Following the order of the agricultural suitability index from high to low values, the documented areas of cropland at the county level were then allocated into 1 km &#x000D7; 1 km cells. The area of cropland in 2009 was then retrieved from Landsat ETM+ images and compared with the areas of cropland during 1900-1910 to determine the human-induced changes in land use and land cover. In this period, the total area of cropland was about 25,397 km<sup>2</sup> and this mainly occurred in the mid-southern part of Heilongjiang, in particular the six counties of Hailun, Bayan, Wuchang, Hulan, Shuangcheng and Wangkui. In 2009, the total area of cropland had increased to about 163,808 km<sup>2</sup> and had spread over the southwestern part to the central and northeastern parts of Heilongjiang. The area of cropland had therefore increased by about 138,411 km<sup>2</sup> during the 20th century. The proportion of land used as cropland increased from about 5.6% during 1900-1910 to about 36.2% in 2009, indicating that about 30.6% of the natural land surface in Heilongjiang was replaced by cropland. A total of about 44% (60,962 km<sup>2</sup>) of the cropland was converted from forest, mainly on the western edge and in the northeastern part of the present-day agricultural area. These areas of cropland reconstructed from historical records for the period 1900-1910 could be used as a basic data set to study the effects of agricultural development on climate and the local environment.</p>

DOI

62
Zhou R, 2001. A general inspection and re-appraise on area under cultivation in the early period of the Qing.The Journal of Chinese Social and Economic History, (3): 39-49. (in Chinese)

63
Zhou Shenglu, Li Ruhai, Wang Liyang et al., 2004. Farmland Classification Research of Jiangsu Province. Nanjing: Southeast University Press. (in Chinese)Scientific determination of index areas and participating factors is the premise and foundation for accurate farmland gradation. On the basis of the analysis of the purposes, principles and requirements of the determination of index areas and participating factors for farmland gradation, Yixing County of Jiangsu Province was cited as a case study. Division of index areas for farmland gradation and determination of the principal gradation participating factors for every index area were attempted by the cluster analysis method and the principal component analysis method. The results indicated that with the quantitative analysis method, gradation index areas could be divided and their gradation principal participating factors determined objectively and scientifically, which made the final gradation more accurate.

Outlines

/