Orginal Article

Accuracy assessment of approaches to spatially explicit reconstruction of historical cropland in Songnen Plain, Northeast China

  • JIANG Lanqi , 1 ,
  • ZHANG Lijuan 1 ,
  • *ZANG Shuying , 1 ,
  • ZHANG Xuezhen 2, 3
Expand
  • 1. Key Laboratory of Remote Sensing Monitoring of Geographic Environment, Harbin Normal University, Harbin 150025, China
  • 2. Key Laboratory of Land Surface Pattern and Simulation, Institute of Geographic Sciences and Natural Resources Research, CAS, Beijing 100101, China
  • 3. Jiangsu Collaborative Innovation Center for Climate Change, Nanjing 210093, China

Author: Jiang Lanqi (1988-), PhD Candidate, specialized in land use/cover change. E-mail:

*Corresponding author: Zang Shuying (1963-), Professor, specialized in integrated and applying researches in 3S and land use/cover change. E-mail:

Received date: 2015-08-07

  Accepted date: 2015-09-20

  Online published: 2016-02-25

Supported by

National Natural Science Foundation of China, No.42171217, No.41471171

Doctorial Innovation Fund, No.HSDBSCX 2015-12

Natural Science of Foundation of Heilongjiang Province, No.ZD201308

Copyright

Journal of Geographical Sciences, All Rights Reserved

Abstract

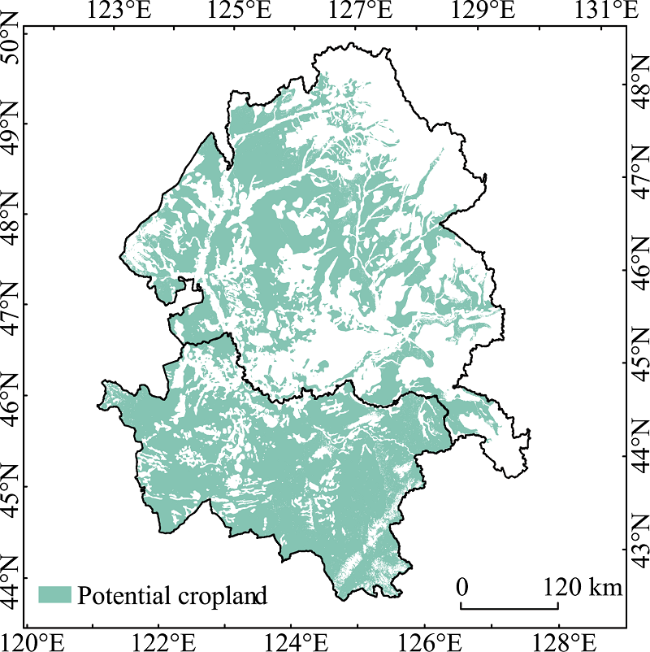
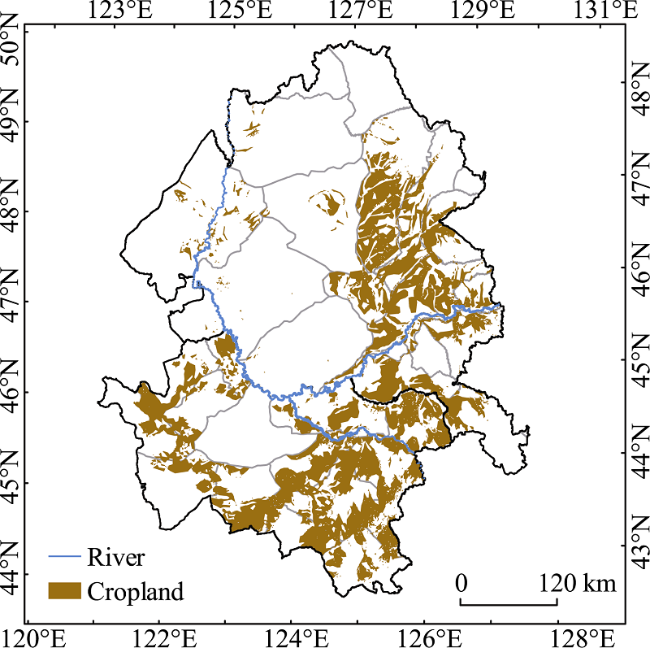
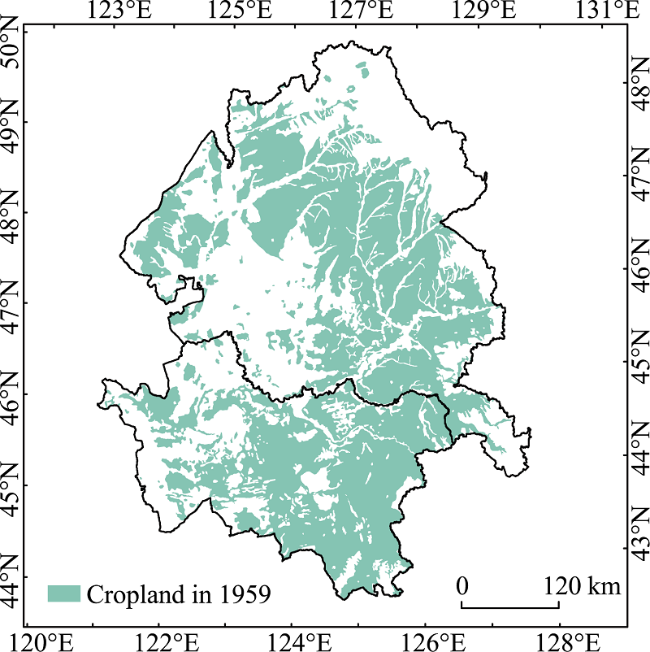
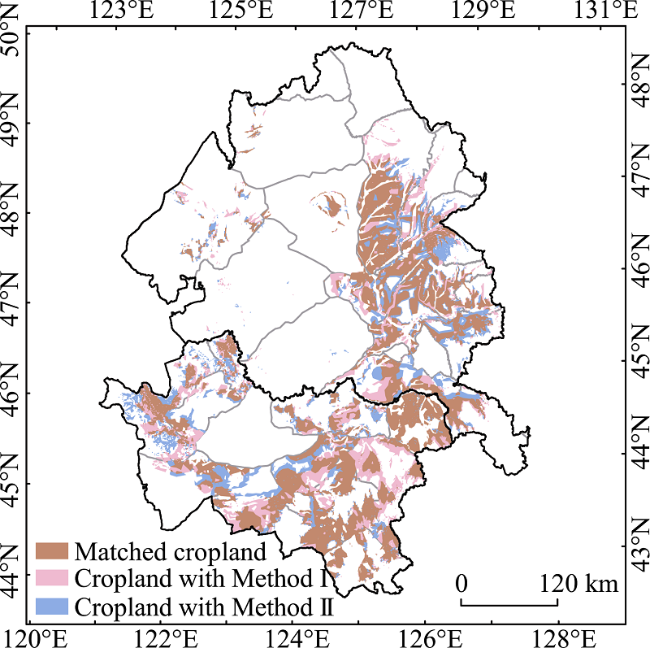
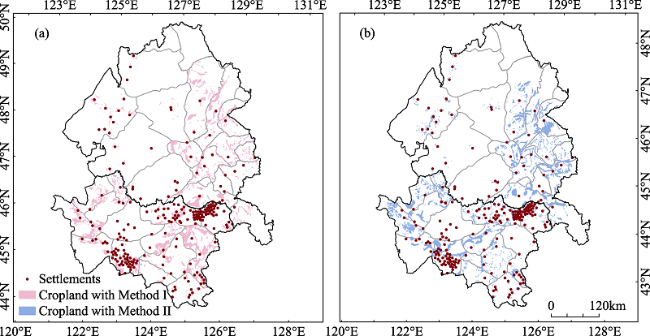
To understand historical human-induced land use/cover change (LUCC) and its climatic effects, it is essential to reconstruct historical land use/cover changes with explicit spatial information. In this study, based on the historically documented cropland area at county level, we reconstructed the spatially explicit cropland distribution at a cell size of 1 km × 1 km for the Songnen Plain in the late Qing Dynasty (1908 AD). The reconstructions were carried out using two methods. One method (hereafter, referred to as method I) allocated the cropland to cells ordered from a high agricultural suitability index (ASI) to a low ASI, but they were all within the domain of potential cropland area. The potential cropland area was created by excluding natural woodland, swamp, water bodies, and mountains from the study area. The other method (hereafter, method II) allocated the cropland to cells in the order from high ASI to low ASI within the domain of cropland area in 1959. This method was based on the hypothesis that the cropland area domain in 1959 resulted from enlargement of the cropland area domain in 1908. We then compared these two reconstructions. We found that the cropland distributions reconstructed by the two methods exhibit a similar spatial distribution pattern. Both reconstructions show that the cropland was mostly found in the southern and eastern parts of the Songnen Plain. The two reconstructions matched each other for about 68% of the total cropland area. By spatially comparing the unmatched cropland cells of the two reconstructions with the settlements for each county, we found that unmatched cropland cells from method I are closer to settlements than those from method II. This finding suggests that reconstruction using method I may have less bias than reconstruction with method II.

Cite this article

JIANG Lanqi , ZHANG Lijuan , *ZANG Shuying , ZHANG Xuezhen . Accuracy assessment of approaches to spatially explicit reconstruction of historical cropland in Songnen Plain, Northeast China[J]. Journal of Geographical Sciences, 2016 , 26(2) : 219 -229 . DOI: 10.1007/s11442-016-1264-5

1 Introduction

In recent times, nearly 40% of the Earth’s land (excluding ice shell) cover has been substantially modified by human activities, primarily by the expansion of agriculture (Ramankutty et al., 2008; Ellis et al., 2010; Ye et al., 2009). Agricultural developments modify the physical properties of the Earth’s surface (e.g. surface albedo, roughness, transpiration, carbon fixation), thereby affecting regional and global climates (Bonan, 2008; Pielke et al., 2002; Brovkin et al., 2006; Pitman et al., 2011; Houghton et al., 2012). The global climate implications of changes in land cover are controversial; however, it is generally accepted that changes in land cover may regulate the climate at the local or regional levels as important as CO2 emissions from burning fossil fuels (Forster et al., 2007; Findell et al., 2009). It is therefore necessary to reconstruct historical land cover datasets to improve our understanding of climatic effects. Furthermore, studying the regional climatic effects of changes in land cover can contribute to understanding the dynamics of climate change.
Many historical land cover datasets have been established on global and regional scales. Among them, two representative global land use datasets have been produced by the Center for Sustainability and the Global Environment (SAGE 2010), University of Wisconsin (Ramankutty et al., 2010) and the History Database of the Global Environment (HYDE 3.1), Netherlands Environmental Assessment Agency (Goldewijk et al., 2011). The spatial resolution of SAGE is 0.5º latitude by longitude grid cells, and the time resolution is 10 years from 1700 to 1992. HYDE has a higher spatial resolution of 5 minute grid cells, and the time resolution is 10 years from 1700 to 2005. However, both the SAGE and the HYDE datasets were only applied to research on a global, rather than a regional, scale (Li et al., 2011). Li et al. (2010) pointed out that both SAGE and HYDE had obvious errors in the historical reconstruction of cropland area and spatial distribution in Northeast China. In China, there are also numerous published reconstructions, such as those of Lin et al. (2008), He et al. (2011), Li et al. (2012) and Ye et al. (2009). Lin et al. (2008) selected slope, altitude and population density as the main factors determining land-use suitability. These factors were used to design an empirical model for allocating the historical cropland inventory data spatially to grid cells in each political unit (at 60 km × 60 km resolution). The study then reconstructed the gridding spatial distribution pattern of cropland in the traditional cultivated region in China in 1820. He et al. (2011) reconstructed the gridding spatial distribution pattern of cropland in the Northern Song Dynasty (at 60 km × 60 km resolution), and the approach was also used in Lin et al. (2008). Li et al. (2012) designed a method to quantify the relationship between topography, production potential of climate, population density and cropland spatial pattern. The method was used to reconstruct cropland spatial patterns with a resolution of 10 km × 10 km in Southwest China for six periods between 1661 and 1784 in the Qing Dynasty. Ye et al. (2009) reconstructed historical cropland cover change in Northeast China over the last 300 years (hereafter, CNEC) through unification processes including documentary data calibration and a multi-sourced data conversion model.
The above studies are characterized by imprecise results that croplands occupy a certain fraction of each grid cell rather than there being accurate spatial location information about cropland. Furthermore, several previous studies have attempted to reconstruct spatially explicit cropland through infrared remote sensing images. Bai et al. (2007) developed a digital rebuilding of the LUCC spatial-temporal distribution model, wherein several land use rules are used, along with several remote sensing images, to estimate the spatial distribution of land cover in Dorbet Mongolian Autonomous County in Daqing city in the 1930s and 1950s. Li et al. (2011) proposed the hypothesis that historical cropland was located in the domain of the present cropland area. They took account of the limiting factors (slope and elevation), then reconstructed the spatial distribution of cropland (at 90 m × 90 m resolution) in Yunnan province in 1671 and 1827, within the cropland domain determined by the MODIS land cover product. These studies are based on current land use/cover information abstracted from remote sensing images, and have high-resolution spatial location information. However, these studies failed to deal adequately with developments and changes in LUCC in each period of history, and have various limitations.
All the aforementioned studies on the reconstruction of historical cropland spatial patterns can be summarized as two methods. One method (methodⅠ) was based on historical data (e.g. official data, documentary records, survey data), then combined with an empirical model for allocating the historical cropland inventory data to reconstruct cropland distribution. The other method (methodⅡ) was based on modern remote sensing data, and the hypothesis that the historical cropland area is all included in the modern area. This was then used to reconstruct the cropland spatial pattern with models. In this study, we selected Songnen Plain in Northeast China as a case study area to reconstruct the spatially explicit cropland distribution in the late Qing Dynasty (1908 AD) at a pixel size of 1 km in two ways. Then, we compared the results with the method of average coordinates of settlements, and set out to assess the validity of applying the spatially explicit reconstruction of cropland.

2 Study area

The study area was located in the Songnen Plain between 42°30´-51°20´N and 121°40´-128°30´E in Northeast China, covering an area of about 23.75×10⁴ km2 (approximately 2.47% of China’s total: Figure 1). This study area has a temperate continental monsoon climate, characterized by significant winds, four seasons, and a hot and rainy summer and a cold and dry winter. The Songnen Plain is mostly flat with few hills, and is an average of 202 m above sea level. The soil is fertile in the Songnen Plain, and black soil, meadow soil and chernozem are widely distributed in this region.
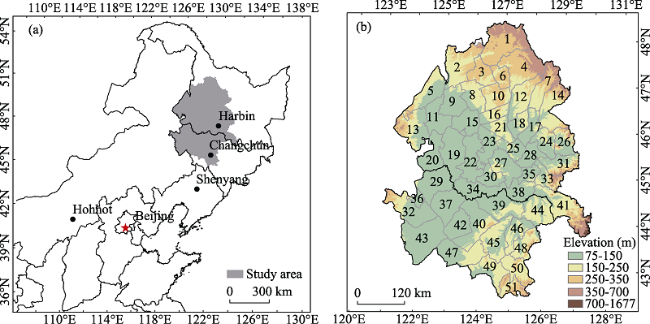
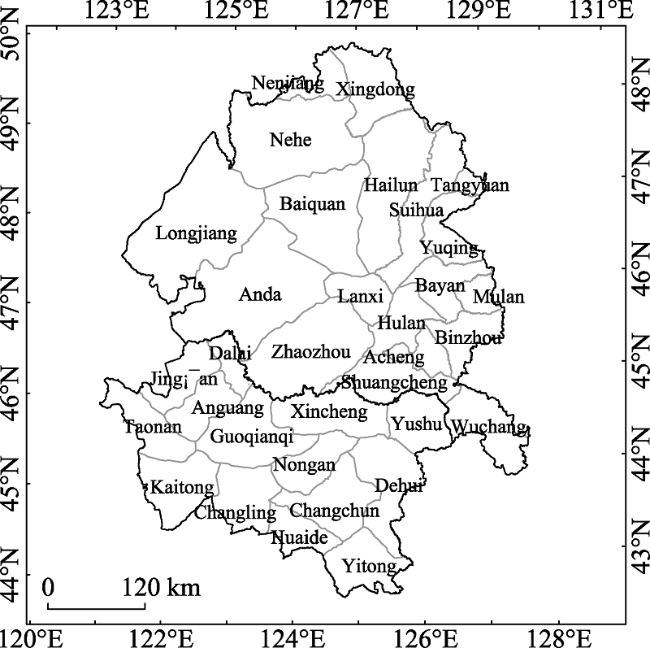
Figure 1 Location of the Songnen Plain (a) and the distribution of counties (b)
Counties: 1. Wudalianchi, 2. Nehe, 3. Keshan, 4. Beian, 5. Gannan, 6. Kedong, 7. Suiling, 8. Yian, 9. Fuyu, 10. Baiquan, 11. Qiqihar, 12. Hailun, 13. Longjiang, 14. Qing’an, 15. Lindian, 16. Mingshui, 17. Suihua, 18. Wangkui, 19. Dorbot, 20. Tailai, 21. Qinggang, 22. Daqing, 23. Anda, 24. Bayan, 25. Lanxi, 26. Mulan, 27. Zhaodong, 28. Hulan, 29. Zhenlai, 30. Zhaozhou, 31. Binxian, 32. Taonan, 33. Acheng, 34. Zhaoyuan, 35. Harbin, 36. Baicheng, 37. Da’an, 38. Shuangcheng, 39. Fuyu, 40. Guoqianqi, 41. Wuchang, 42. Qian’an, 43. Tongyu, 44. Yushu, 45. Nongan, 46. Dehui, 47. Changling, 48. Jiutai, 49. Gongzhuling, 50. Changchun, 51. Yitong

3 Methods

3.1 Estimation of cropland area in the late Qing Dynasty

The work reported here aimed to compare the accuracy of reconstruction by two ways. Both methodⅠ and methodⅡ are based on historical cropland area, and the late Qing Dynasty cropland area data are used as an initial condition for spatially identifying historical croplands in the past for each political unit. We retried the cropland area in 1908 through documentary data calibration and a multi-sourced data conversion model. In 1908, the cropland area data were compiled from the Survey Report of Manchurian Railway (LPA, 2008) and the Local Gazette of Manchu-Mongolia (CSMR, 1923). The two sources partly overlapped with each other and could therefore be compared.
We first converted the traditional units of historical cropland area into square kilometers (km2). Then, we estimated the area of cropland, based on the population by regression, the area of cropland at county level against population, and on the basis of historical documents, by regression of cropland areas from LPA (2008) against cropland areas from CSMR (1923). We finally obtained the cropland area of each county in the Songnen Plain in 1908 (Table 1). The total area of cropland was about 49175.98 km2 in 1908. Zhang et al. (2014) introduced the design step and concrete process making it possible to retrieve cropland area.
Table 1 Cropland area (km2) of each county in the Songnen Plain in the late Qing Dynasty (1908)
County Area County Area County Area County Area
Hailun 5043.00 Changling 2198.51 Huaide 2381.91 Mulan 530.84
Dehui 4035.59 Hulan 2180.84 Yitong 1214.34 Tangyuan 265.42
Changchun 3538.94 Suihua 2087.98 Kaitong 1159.68 Nehe 176.95
Binzhou 2927.03 Xincheng 1821.08 Wuchang 1069.06 Anda 60.65
Yushu 2775.49 Lanxi 1602.72 Anguang 926.96 Nenjiang 30.79
Nongan 2770.65 Yuqing 1494.73 Dalai 912.20 Zhaozhou 26.54
Shuangcheng 2390.08 Jing’an 1451.42 Longjiang 814.36 Guoqianqi
Bayan 2300.59 Taonan 1405.50 Baiquan 582.15 Acheng
Xingdong Binjiang Total 49175.98

3.2 Allocation of cropland area to grid cells

There is a noticeable correlation between historical population and agricultural development (Zhu et al., 2012; Ye et al., 2009). The history of agricultural exploitation demonstrates that people always cultivate land that is flat and fertile, rather than land with complicated shapes, steep slopes and poor soil fertility (Li et al., 2011). Water is the prerequisite for human survival. This paper therefore assumes that the agricultural suitability index (ASI) is closely related to settlements, water sources and topography. The ASI is quantified as in Eq. (1):
where R is the ASI and α, β and γ represent the human dimension factor (settlements), the water resource factor and the topography complexity factor, respectively. A higher value of ASI indicates greater agricultural development, and vice versa.
To determine a, b and c, we used the broadly accepted analytical hierarchy process (AHP) method. This is a useful method for complex decision making (Xu, 2009). We used a decision scale of 2, calculated the value of the weight of each index, through the consistency examination. As a consequence, Eq. (1) can be given as:
The spatial distribution of settlements in Heilongjiang province was taken from the 8th volume of the Atlas of Historical Geography (Tan, 1987); the spatial distribution of settlements in Jilin province was taken from Zeng et al. (2011). The spatial distribution of water resources (rivers) was taken from the National Geomatics Center of China. The surface elevation data were taken from the Bureau of Survey and Geo-information of Heilongjiang and Jilin Province (at 90 m × 90 m resolution).
Figure 2 shows the spatial distribution of ASI of land for agricultural development at a cell size of 1 km ×1 km in the Songnen Plain in the late Qing Dynasty.
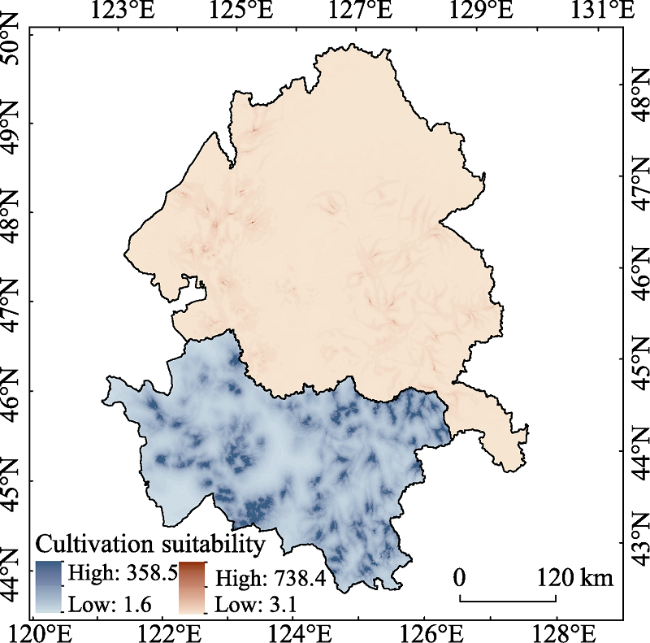
Figure 2 Spatial distribution of ASI of the Songnen Plain in the late Qing Dynasty (1908)

4 Results

4.1 Reconstruction of cropland based on methodⅠ

Historical documents generally record cropland area at county level. As administrative boundaries significantly changed over the last century, it is necessary to locate the historical records in the contemporary counties (Ye et al., 2006). Figure 3 shows the distribution of the counties of the Songnen Plain in the late Qing Dynasty, based on the New Area Map of the Republic of China (Tong, 1917). Then, we quantified the potential area of cultivation, excluding forests, wetlands, rivers, lakes and mountains (Figure 4). We defined mountains as elevations higher than 200 m and slopes greater than 3°. The map of forest distribution in 1896 was taken from the Map of Forest in Heilongjiang Province (Li, 1993); the map of wetlands and lake distribution in the 1950s was taken from the Map of Land Use in Northeast China, which was produced by the Economics Section of the Institute of Geography (Sun, 1959).
Figure 3 Administrative divisions in the Songnen Plain in the late Qing Dynasty
Figure 4 Potential cropland area of the Songnen Plain in the late Qing Dynasty
Finally, we quantified agricultural suitability just within the potential area. Following the order of the ASI from high to low, we assigned the area of cropland cell by cell. The process continued until all the cropland area had been allocated. Figure 5 shows the reconstructed spatially precise area of cropland in 1908 identified by method I.
Figure 5 Spatial distribution of cropland in the Songnen Plain in 1908 reconstructed by allocating cropland within the potential cropland area

4.2 Reconstruction of cropland based on method II

Method II was based on the reasonable assumption that historical cropland was located in the domain of the present cropland area (Li et al., 2011). This assumption derived from the fact that cropland area has constantly increased over the past 300 years. In this study, we used spatial data on arable land resources in 1959 as potential cropland area. We used the spatial analysis function of ArcGIS to extract the spatial distribution of cropland from the Map of Land Use in Northeast China (Sun, 1959), which has a scale of 1:300,000 (Figure 6). These 1959 cropland data are some years away from the most recent information on the late Qing Dynasty that can be obtained. We then quantified agricultural suitability within the spatial distribution of cropland in 1959. The detailed calculation process was virtually identical to that of methodⅠ. Figure 7 shows the results for spatial distribution of cropland in the Songnen Plain in 1908 found with methodⅡ.
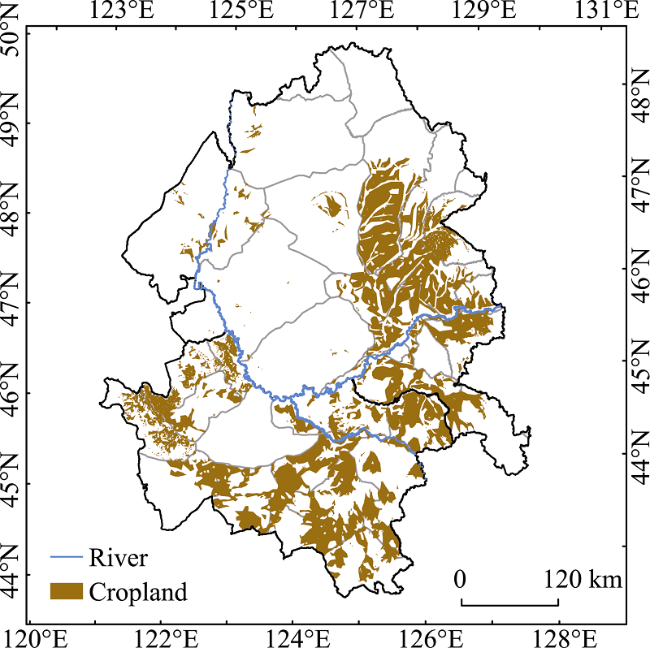
Figure 6 Spatial distribution of cropland in the Songnen Plain in 1959
Figure 7 Spatial distribution of cropland in the Songnen Plain in 1908 reconstructed by allocating cropland within the cropland area in 1959

4.3 Comparison of the two methods of reconstructing cropland

By overlaying the analysis of the layer of cropland spatial patterns found with methodⅠ (Figure 5) and found with methodⅡ (Figure 7) in ArcGIS, the similarities and differences of cropland spatial patterns yielded by the two methods are thus made apparent (Figure 8). In Figure 8, brown represents matched cropland reconstructed by the two different methods; pink and blue represent unmatched cropland reconstructed by methodⅠ and methodⅡ, respectively. It can be seen that the cropland spatial distribution reconstructed using the two methods exhibits a similar spatial pattern. The regions where the two methods matched cover an area of 33,428 km2 (about 68% of the total cropland area). Moreover, both of the methods show that the cropland lay mostly in the southern and eastern parts of the Songnen Plain in 1908.
Figure 8 Spatial distribution of the unmatched cropland pixels in the Songnen Plain for late Qing Dynasty (1908) reconstructed using the two different methods
As much of the research shows, the process of formation and evolution of ancient settlements (historic towns and villages) was closely related to agricultural reclamation (Ye et al., 2009; Lin et al., 2008; Zeng et al., 2011). Cropland spatial patterns were reconstructed using two methods in this paper, with the accuracy of this being verified by reference to settlements. This paper holds that the less distance there is between settlements and unmatched cropland spatial patterns, the more accurate a method is. Figure 9 shows the spatial distribution of settlements in the Songnen Plain in the late Qing Dynasty and the mismatch of cropland reconstructed by each method. However, it is not possible to tell which method is better just by studying Figure 9. Therefore, we calculated the average coordinates of settlements and average coordinates of unmatched cropland pixels of two reconstructions for each county in the Songnen Plain, and compared their accuracy and efficiency (Table 2). Table 2 indicates that the distance between the average coordinates of settlements and unmatched cropland pixels of methodⅠ is closer than that of methodⅡ, in most counties. In view of the arguments set out above, we can safely conclude that reconstruction using methodⅠmay have less bias than that using methodⅡ.
Figure 9 Spatial distribution of settlements in the Songnen Plain for the late Qing Dynasty and mismatch of cropland pixels reconstructed (a) by allocating cropland area within the potential cropland area and (b) by allocating cropland area within cropland area in 1959
Table 2 Average coordinates of settlements and average coordinates of unmatched cropland pixels of two reconstructions for each county in the Songnen Plain (°E,°N)
County Settlement Method I Method II County Settlement Method I Method II
Wuchang 127.1, 44.8 127.3, 44.8 127.4, 44.9 Longjiang 124.0, 47.5 124.0, 47.5 124.1, 47.5
Yuqing 127.5, 46.9 127.7, 46.9 127.5, 46.9 Yitong 125.2, 43.5 125.2, 43.5 125.2, 43.5
Lanxi 126.2, 46.3 127.7, 46.9 127.5, 46.9 Nongan 124.7, 44.6 124.9, 44.7 125.1, 44.7
Shuangcheng 126.6, 45.3 126.4, 45.4 126.3, 45.4 Dalai 123.9, 45.8 123.8, 45.9 123.8, 45.9
Hulan 126.6, 46.1 126.8, 46.0 126.7, 45.9 Anguang 123.3, 45.5 123.3, 45.5 123.3, 45.5
Anda 124.2, 46.6 124.3, 46.7 124.0, 46.6 Kaitong 122.9, 44.8 123.0, 44.9 122.7, 44.9
Binzhou 127.5, 45.8 127.6, 45.7 127.7, 45.8 Dehui 125.8, 43.9 125.7, 43.9 125.9, 44.1
Bayan 127.4, 46.1 127.4, 46.3 127.6, 46.3 Huaide 124.6, 43.8 124.4, 44.0 124.3, 44.0
Baiquan 125.9, 47.4 126.0, 47.5 125. 7, 44.4 Xincheng 125.6, 45.1 125.3, 45.1 125.3, 45.1
Mulan 128.2, 46.0 127.9, 46.1 127.9, 46.1 Yushu 126.5, 45.0 126.6, 45.0 126.6, 44.8
Hailun 126.7, 47.1 126.8, 47.2 128.0, 47.6 Taonan 122.7, 45.4 122.5, 45.4 122.6, 45.3
Suihua 127.1, 46.9 127.0, 46.8 127.2, 47.1 Changling 123.6, 44.4 123.6, 44.4 123.5, 44.4
Zhaozhou 125.0, 45.7 125.5, 45.8 124.7, 45.9 Changchun 124.9, 44.2 125.0, 44.2 124.8, 44.3
Nehe 124.9, 48.5 124.9, 48.4 125.0, 48.4 Jing’an 122.8, 45.7 123.2, 45.9 122.9, 45.8
Acheng 127.0, 45.6 126.9, 45.8 127.0, 45.7 Average 125.5, 45.7 125.5, 45.7 125.5, 45.8

5 Conclusions

This paper reconstructed spatially precise areas of cropland in the Songnen Plain in the late Qing Dynasty using two methods. We compared the results obtained from the two methods. The major conclusions are as follows:
(1) Analysis of these two methods yielded approximately the same results as the cropland spatial patterns. Agricultural development mostly occurred in the eastern and southern parts of the Songnen Plain. Other areas, especially the northern and western parts of the study area, were less developed. The total area of cropland in the Songnen Plain was 49,175.95 km2 in 1908. Both methods matched each other for about 68% of the total cropland area. No evident regularity was found in the area where the two methods did not match.
(2) By spatially comparing the unmatched cropland pixels of the two methods with the settlements for each county, this study found that the unmatched cropland pixels yielded by methodⅠ were closer to settlements than those yielded by methodⅡ. The results indicate that reconstruction with methodⅠ may have less bias than that with methodⅡ.

6 Discussion

(1) Most recent research has reconstructed historical cropland distribution using methodⅡ because historical data were scarce. Thus the accuracy of the results may be reduced. It is therefore suggested that historical cropland distribution should be reconstructed using methodⅠ. MethodⅠ is generally applicable, and the prediction results will be more accurate if there are sufficient historical data.
(2) Three datasets provide spatially precise cropland data for the Songnen Plain in the late Qing Dynasty: SAGE, HYDE and CNEC. However, the quality of the SAGE and HYDE datasets is poor in Northeast China (Li et al., 2010). Therefore, we did not further compare the results of this study with the HYDE and SAGE datasets.
The CNEC dataset (Ye et al., 2009) has reconstructed the spatial distribution of cropland at the county level, based on the present county boundaries. To compare our results with those of CNEC, we recalculate the fraction of cropland area at the county level based on the present counties, using our reconstructed data with each of the two methods. Table 3 indicates that our estimations with methodⅠ and methodⅡ are in the same range as that of CNEC for 34 and 28 counties, respectively, and about 67% and 55% of the total number of counties, accordingly. This further confirms that our results with the two methods are convincing, and that spatially explicit reconstruction of cropland with methodⅠ is more accurate than that with methodⅡ.
Table 3 Cropland area fraction in 1908 for each modern county
County R1 R2 R3 County R1 R2 R3 County R1 R2 R3
Nongan 0.60 0.47 0.6-1 Bayan 0.63 0.63 0.1-0.2 Lindian 0.00 0.00 0-0.05
Beian 0.07 0.02 0.2-0.6 Hulan 0.52 0.52 0.1-0.2 Tailai 0.01 0.00 0-0.05
Hailun 0.58 0.60 0.2-0.6 Shuangcheng 0.46 0.43 0.1-0.2 Zhenlai 0.29 0.27 0-0.05
Suiling 0.20 0.13 0.2-0.6 Wuchang 0.20 0.24 0.1-0.2 Zhaoyuan 0.03 0.01 0-0.05
Qing’an 0.21 0.28 0.2-0.6 Gannan 0.03 0.01 0.05-0.1 Anda 0.05 0.00 0-0.05
Wangkui 0.60 0.77 0.2-0.6 Longjiang 0.01 0.01 0.05-0.1 Zhaodong 0.10 0.09 0-0.05
Lanxi 0.46 0.53 0.2-0.6 Fuyu 0.09 0.08 0.05-0.1 Zhaozhou 0.00 0.01 0-0.05
Suihua 0.49 0.60 0.2-0.6 Taonan 0.35 0.37 0.05-0.1 Acheng 0.03 0.07 0-0.05
Mulan 0.26 0.24 0.2-0.6 Qian’an 0.05 0.08 0.05-0.1 Binxian 0.31 0.51 0-0.05
Da’an 0.09 0.09 0.2-0.6 Qianguo 0.28 0.40 0.05-0.1 Tongyu 0.18 0.18 0-0.05
Fuyu 0.25 0.23 0.2-0.6 Changling 0.51 0.41 0.05-0.1 Daqing 0.00 0.00 0-0.05
Yushu 0.57 0.56 0.2-0.6 Nehe 0.03 0.03 0-0.05 Baicheng 0.36 0.50 0-0.05
Dehui 0.52 0.26 0.2-0.6 Keshan 0.00 0.00 0-0.05 Gongzhuling 0.50 0.52 0.2-0.6
Jiutai 0.48 0.03 0.2-0.6 Kedong 0.00 0.00 0-0.05 Harbin 0.26 0.28 0-0.05
Changchun 0.52 0.48 0.2-0.6 Yian 0.00 0.00 0-0.05 Qiqihar 0.06 0.09 0.05-0.1
Yitong 0.14 0.14 0.2-0.6 Baiquan 0.12 0.13 0-0.05 Dorbot 0.01 0.00 0-0.05
Qinggang 0.15 0.14 0.1-0.2 Mingshui 0.03 0.03 0-0.05 Wudalianchi 0.00 0.00 0-0.05

Note: R1 stands for the results of method I; R2 stands for the results of method II; R3 stands for the results of CNEC

(3) The administrative boundaries of the Songnen Plain have changed since the late Qing Dynasty. This paper reconstructed the administrative boundaries of the Songnen Plain in the late Qing Dynasty, and in some areas, this could produce a smaller real cropland area than that found in historical documents. In this study, the potential cultivation area was estimated by excluding forests, wetlands, rivers, lakes and mountains. As these geographical features did not co-occur temporally with the historical cropland, there may be some uncertainty regarding the estimated area of cultivation. It should be noted that ‘2’ was used as the decision scale in the AHP model. This value still requires further verification.

The authors have declared that no competing interests exist.

1
Bai S Y, Zhang S W, Zhang Y Z, 2007. Digital rebuilding of LUCC spatial-temporal distribution of the last 100 years.Acta Geographica Sinica, 62(4): 427-436. (in Chinese)lt;p>The Yangtze River Delta is one of the economically developed coastal areas. From the late 1970s, its urbanization process has been quickened greatly, which resulted in the number increase and the spatial expansion of urban areas. The Landsat MSS, TM/ETM satellite images, which were respectively acquired in 5 periods of 1979, 1990, 1995, 2000 and 2005, were used to extract urban land information and analyze urban growth data with the help of remote sensing and GIS softwares. We analyzed the spatio-temporal characteristics including urban growth speed, growth intensity, fractal dimension and urban growth pattern. Additionally, dynamics of urban expansion in the Yangtze River Delta were also analyzed. The results are drawn as follows: (1) From 1979 to 2005, the growth speed of urbanization area was accelerating obviously. The quantities of increasing area of urbanized land were 37.66 km<sup>2</sup> 112.43 km<sup>2</sup> 274.86 km<sup>2</sup> and 421.73 km<sup>2</sup> in the past four periods (1979-1990, 1990-1995, 1995-2000 and 2000-2005), respectively. Meanwhlie, the growth intensities of urbanized land enhanced gradually. From 1979 to 1990, the growth intensity was only 0.03, then reaching 0.10, 0.24 and 0.37 in the following three periods. (2) The spatial structure of urbanization area in the Yangtze River Delta was fractal. The fractal dimension and stability coefficient of urbanized land structure fluctuated to a certain extent. From 1979 to 2000, the fractal dimension of urbanized land structure decreased yearly. The shape of urbanized land tended to be regular. After 2000, the area increase of urbanized land on a large scale led to more complicated shape of urbanized land. The stability coefficient also had similar characteristics to that of fractal dimension. So the change of urbanized land in spatial structure was relating to the growth process of urbanized land. (3) The growth process of urban agglomeration in the Yangtze River Delta was from one pole and two belts to five poles and five belts. From 1979 to 1990, Shanghai was the only first-grade growth pole of urbanized land and Shanghai-Nanjing railway and Shanghai-Hangzhou railway were the two first-grade growth belts of urbanized land in the Yangtze River Delta. At the latest period (from 2000 to 2005), the first-grade growth poles included 5 cities, i.e., Shanghai, Nanjing, Hangzhou, Suzhou and Ningbo. Besides Shanghai-Nanjing railway and Shanghai-Hangzhou railway, Shanghai-Jingjiang railway, Hangzhou-Ningbo railway and the highway linking Nanjing to Gaochun also became growth belts of urbanized land in the Yangtze River Delta in that period.</p>

DOI

2
Bonan G B, 2008. Forests and climate change: Forcings, feedbacks, and the climate benefits of forests.Science, 320(5882): 1444-1449.The world's forests influence climate through physical, chemical, and biological processes that affect planetary energetics, the hydrologic cycle, and atmospheric composition. These complex and nonlinear forest-atmosphere interactions can dampen or amplify anthropogenic climate change. Tropical, temperate, and boreal reforestation and afforestation attenuate global warming through carbon sequestration. Biogeophysical feedbacks can enhance or diminish this negative climate forcing. Tropical forests mitigate warming through evaporative cooling, but the low albedo of boreal forests is a positive climate forcing. The evaporative effect of temperate forests is unclear. The net climate forcing from these and other processes is not known. Forests are under tremendous pressure from global change. Interdisciplinary science that integrates knowledge of the many interacting climate services of forests with the impacts of global change is necessary to identify and understand as yet unexplored feedbacks in the Earth system and the potential of forests to mitigate climate change.

DOI PMID

3
Brovkin V, Claussen M, Driesschaert Eet al., 2006. Biogeophysical effects of historical land cover changes simulated by six Earth system models of intermediate complexity.Climate Dynamics, 26(6): 587-600.<a name="Abs1"></a>Six Earth system models of intermediate complexity that are able to simulate interaction between atmosphere, ocean, and land surface, were forced with a scenario of land cover changes during the last millennium. In response to historical deforestation of about 18&nbsp;million&nbsp;sq&nbsp;km, the models simulate a decrease in global mean annual temperature in the range of 0.13&#8211;0.25°C. The rate of this cooling accelerated during the 19th century, reached a maximum in the first half of the 20th century, and declined at the end of the 20th century. This trend is explained by temporal and spatial dynamics of land cover changes, as the effect of deforestation on temperature is less pronounced for tropical than for temperate regions, and reforestation in the northern temperate areas during the second part of the 20th century partly offset the cooling trend. In most of the models, land cover changes lead to a decline in annual land evapotranspiration, while seasonal changes are rather equivocal because of spatial shifts in convergence zones. In the future, reforestation might be chosen as an option for the enhancement of terrestrial carbon sequestration. Our study indicates that biogeophysical mechanisms need to be accounted for in the assessment of land management options for climate change mitigation.

DOI

4
Course on the Survey of Manchurian Railway (CSMR), 1923. Local Gazette of Manchu-Mongolian. Manchuria Riri Press. (in Chinese)

5
Ellis E C, Goldewijk K K, Siebert Set al., 2010. Anthropogenic transformation of the biomes, 1700 to 2000. Global Ecology and Biogeography, 19(5): 589-606.Aim: To map and characterize anthropogenic transformation of the terrestrial biosphere before and during the Industrial Revolution, from 1700 to 2000. Location: Global. Methods: Anthropogenic biomes (anthromes) were mapped for 1700, 1800, 1900 and 2000 using a rule-based anthrome classification model applied to gridded global data for human population density and land use. Anthropogenic transfo...

DOI

6
Findell K L, Pitman A J, England M Het al., 2009. Regional and global impacts of land cover change and sea surface temperature anomalies.Journal of Climate, 22(12): 3248-3269.The atmospheric and land components of the Geophysical Fluid Dynamics Laboratory's (GFDL's) Climate Model version 2.1 (CM2.1) is used with climatological sea surface temperatures (SSTs) to investigate the relative climatic impacts of historical anthropogenic land cover change (LCC) and realistic SST anomalies. The SST forcing anomalies used are analogous to signals induced by El Ni o-Southern O...

DOI

7
Goldewijk K K, Beusen A, Drecht G Vet al., 2011. The HYDE 3.1 spatially explicit database of human-induced global land-use change over the past 12,000 years.Global Ecology and Biogeography, 20(1): 73-86.Aim68 This paper presents a tool for long-term global change studies; it is an update of the History Database of the Global Environment (HYDE) with estimates of some of the underlying demographic and agricultural driving factors. Methods68 Historical population, cropland and pasture statistics are combined with satellite information and specific allocation algorithms (which change over time) to create spatially explicit maps, which are fully consistent on a 5′ longitude/latitude grid resolution, and cover the period 10,000bctoad2000. Results68 Cropland occupied roughly less than 1% of the global ice-free land area for a long time untilad1000, similar to the area used for pasture. In the centuries that followed, the share of global cropland increased to 2% inad1700 ( c . 3 million km 2 ) and 11% inad2000 (15 million km 2 ), while the share of pasture area grew from 2% inad1700 to 24% inad2000 (34 million km 2 ) These profound land-use changes have had, and will continue to have, quite considerable consequences for global biogeochemical cycles, and subsequently global climate change. Main conclusions68 Some researchers suggest that humans have shifted from living in the Holocene (emergence of agriculture) into the Anthropocene (humans capable of changing the Earth's atmosphere) since the start of the Industrial Revolution. But in the light of the sheer size and magnitude of some historical land-use changes (e.g. as result of the depopulation of Europe due to the Black Death in the 14th century and the aftermath of the colonization of the Americas in the 16th century) we believe that this point might have occurred earlier in time. While there are still many uncertainties and gaps in our knowledge about the importance of land use (change) in the global biogeochemical cycle, we hope that this database can help global (climate) change modellers to close parts of this gap.

DOI

8
He F N, Li S C, Zhang X Z, 2011. The reconstruction of cropland area and its spatial distribution pattern in the mid-northern Song Dynasty.Acta Geographica Sinica, 66(11): 1531-1539. (in Chinese)To simulate land cover change process and its climate effects, it is significant to construct historical land use and land cover change dataset with spatial information. According to &quot;Cropland Taxes&quot; and &quot;the Number of Households&quot; data recorded in historical documents, this paper speculates cropland area and population of each Lu (administrative region of the Northern Song Dynasty) during the mid-Northern Song Dynasty by analyzing some society factors of the Northern Song Dynasty, including land-use practices, taxation system, reclamation policies. Besides, this study selects slope, altitude and population density as the main driving factors of land use suitability degree and reconstructs the gridding spatial distribution pattern of cropland of the Northern Song Dynasty (at a 60 km&times;60 km resolution). The results are shown as follows. (1) The cropland area of the whole country in the mid- and late Northern Song Dynasty is about 720 million Mu, accounted for 40.1% of the north and 59.9% of the south; the population is 87.2 million, accounting for 38.7% of the north and 61.3% of the south; the territory cropland fraction is 16.6%, and per capita cropland area is 8.2 Mu. (2) The cropland fraction of the North China Plain, the Yangtze River Plain, the Guanzhong Plain, the plains of Hunan and Hubei, and the Sichuan Basin are larger while the that of the south of Nanling Ridges, Southwest China (except the Chengdu Plain) and southeast coastal regions of China are lower. (3) In terms of altitudes, we conclude that the cropland areas of low altitude, middle altitude, high altitude are 443 million Mu, 215 million Mu, and 64 million Mu respectively, and the corresponding mean cropland fraction are 27.5%, 12.6% and 7.2%. (4) As for slopes, we conclude that the cropland area of flat slope, slow slope, slope, steep slope are 116 million Mu, 456 million Mu, 144 million Mu and 2 million Mu respectively, and the corresponding mean cropland fraction are 34.6%, 20.7%, 8.5% and 2.3%.

9
Houghton R A, van der Werf G R, DeFries R Set al., 2012. Chapter G2 carbon emissions from land use and land-cover change.Biogeosciences Discussions, 9(1): 835-878.The net flux of carbon from land use and land-cover change (LULCC) is significant in the global carbon budget but uncertain, not only because of uncertainties in rates of deforestation and forestation, but also because of uncertainties in the carbon density of the lands actually undergoing change. Furthermore, there are differences in approaches used to determine the flux that introduce variability into estimates in ways that are difficult to evaluate, and there are forms of management not considered in many of the analyses. Thirteen recent estimates of net carbon emissions from LULCC are summarized here. All analyses consider changes in the area of agricultural lands (croplands and pastures). Some consider, also, forest management (wood harvest, shifting cultivation). None of them includes the emissions from the degradation of tropical peatlands. The net flux of carbon from LULCC is not the same as "emissions from deforestation", although the terms are used interchangeably in the literature. Means and standard deviations for annual emissions are 1.14±0.23 and 1.13±0.23 PgCyr-1 (1 Pg=1015 g carbon) for the 1980s and 1990s, respectively. Four studies also consider the period 2000-2009, and the mean and standard deviations for these four are 1.14±0.39, 1.17±0.32, and 1.10±0.11 PgCyr-1 for the three decades. For the period 1990-2009 the mean global emissions from LULCC are 1.14±0.18 PgCyr-1. The errors are smaller than previously estimated, as they do not represent the range of error around each result, but rather the standard deviation across the mean of the 13 estimates. Errors that result from data uncertainty and an incomplete understanding of all the processes affecting the net flux of carbon from LULCC have not been systematically evaluated but are likely to be on the order of ±0.5 PgCyr-1.

DOI

10
Intergovernmental Panel on Climate Change, 2007. Climate Change 2007: The Physical Science Basis: Working Group I Contribution to the Fourth Assessment Report of the IPCC. UK: Cambridge University Press.

11
Liaoning Provincial Archives (LAP), 2008. Survey of Manchurian Railway (Vol 3). Nanning: Guangxi Normal University Press. (in Chinese)

12
Li B B, Fang X Q, Ye Yet al., 2010. Accuracy assessment of global historical cropland datasets based on regional reconstructed historical data: A case study in Northeast China.Science China Earth Sciences, 53(11): 1689-1699.

13
Li J W, 1993. Forest in Heilongjiang. Beijing: China Forestry Publishing House. (in Chinese)

14
Li K, He F N, Zhang X Z, 2011. An approach to reconstructing spatial distribution of historical cropland with grid-boxes by utilizing MODIS land cover dataset: A case study of Yunnan Province in the Qing Dynasty.Geographical Research, 30(12): 2281-2288. (in Chinese)Highly precise Land Use and Cover Change(LUCC) dataset plays a key role in improving simulations of effects of LUCC on climate and ecosystem.Historical LUCC usually has no precise spatial location information.This shortage limited usage of historical LUCC dataset in the global environmental changes simulations.So,it is needed to develop an effective way to reconstruct historical cropland spatial distribution with grid-boxes.In this study,we develop a new way in which the spatial distribution of historical cropland was reconstructed effectively.This approach was built on a reasonable hypothesis that historical cropland was located in the domain of present cropland area.This hypothesis was derived from a feature that cropland area increased all the time generally in the past 300 years.This approach includes two steps:(1) estimating the easiness for reclamation one pixel by one pixel within the cropland domain determined by MODIS land cover product;(2) by descending order of easiness for reclamation,filling in the pixels with cropland from historical inventories;it would not stop until the total area of cropland pixels was equal to inventory cropland area.As a case study,we reconstructed the spatial distribution with a 90-m resolution of cropland in the Yunnan Province in 1671 and 1827 by using this approach.The results show this approach could reconstruct the historical cropland spatial distribution with high resolution.

DOI

15
Li S C, He F N, Chen Y S, 2012. Gridding reconstruction of cropland spatial patterns in Southwest China in the Qing Dynasty.Progress in Geography, 31(9): 1196-1203. (in Chinese)On the basis of modern cropland spatial pattern, we designed a method to quantify the relationship among topography (including altitude and slope), production potential of climate (including light, temperature and water), population density and cropland spatial pattern. Then the method was used to reconstruct cropland spatial pattern with a resolution of 10 km by 10 km in Southwest China for 6 periods between 1661 and 1784 in the Qing Dynasty. The results are shown as follows. (1) As a whole, the changes of cropland spatial pattern in Southwest China can be described in two respects. One is the expansion of cultivated area, which are mainly distributed in the Sichuan Basin and the Yunnan-Guizhou Plateau. The grid cells with small cropland fractions (0~10%) decreased by 24.0% during the past 250 years. The other is enhancement of cultivation intensity, which are obvious in the Sichuan Basin and the central-eastern parts of Yunnan Province. The grid cells whose cropland fractions are relatively large (&gt;30%) increased by 10.3% during the past 250 years. (2) The process of cropland change in Southwest China in the Qing Dynasty can be divided into three periods. The cultivation recovery period (1661-1724)--the grid cells whose cropland fractions are small (0~10%) decreased by 11.4%; the slow cultivation expansion period (1724-1820)-the grid cells whose cropland fractions are small (0~10%) decreased by 7% while the grid cells with relatively large cropland fractions (&gt;30%) increased by 7%. The postwar abandonment of cropland in some parts of the study area and recovery period (1820-1911)-the grid cells whose cropland fractions are small (0~10%) decreased from 75.0% to 72.2% while the grid cells whose cropland fractions are relatively large (&gt;30%) increased from 9.1% to 10.9%. The results of correlation analysis indicate that the reconstruction is reasonable to some degree.

DOI

16
Lin S S, Zheng J Y, He F N, 2008. The approach for gridding data derived from historical cropland records of the traditional cultivated region in China.Acta Geographica Sinica, 63(1): 83-92. (in Chinese)lt;p>Recent studies have demonstrated the importance of LUCC change with climate and ecosystem simulation, but the result could only be determined precisely if a high-resolution underlying land cover map is used. While the efforts based on satellites have provided a good baseline for present land cover, what the next advancement in the research about LUCC change required is the development of reconstruction of historical LUCC change, especially spatially-explicit historical dataset. Being different from other similar studies, this study is based on the analysis of historical land use patterns in the traditional cultivated region of China. Taking no account of the less important factors, slope and population patterns were selected as the major drivers of reclamation in ancient China, and were used to design the Chinese Historical Cropland Data Gridding Model (at a 60 km&times;60 km resolution), which is an empirical model for allocating the historical cropland inventory data spatially to grid cells in each political unit. Then we use this model to reconstruct the cropland distribution of the study area in 1820, and test the result by prefectural cropland data of 1820, which is from the historical documents. The statistical analyzing result shows that the model can simulate the patterns of the historical cropland's distribution in the traditional cultivated region efficiently.</p>

DOI

17
Pielke R A, Marland G, Betts R Aet al., 2002. The influence of land-use change and landscape dynamics on the climate system: Relevance to climate-change policy beyond the radiative effect of greenhouse gases.Philosophical Transactions A, 360(1797): 1705-1719.

18
Pitman A J, Avila F B, Abramowitz Get al., 2011. Importance of background climate in determining impact of land-cover change on regional climate.Nature Climate Change, 1(9): 472-475.ABSTRACT Humans have modified the Earth’s climate through emissions of greenhouse gases and through land-use and land-cover change (LULCC)1. Increasing concentrations of greenhouse gases in the atmosphere warm the mid-latitudes more than the tropics, in part owing to a reduced snow–albedo feedback as snow cover decreases2. Higher concentration of carbon dioxide also increases precipitation in many regions1, as a result of an intensification of the hydrological cycle2. The biophysical effects of LULCC since pre-industrial times have probably cooled temperate and boreal regions and warmed some tropical regions3. Here we use a climate model to show that how snow and rainfall change under increased greenhouse gases dominates how LULCC affects regional temperature. Increased greenhouse-gas-driven changes in snow and rainfall affect the snow–albedo feedback and the supply of water, which in turn limits evaporation. These changes largely control the net impact of LULCC on regional climate. Our results show that capturing whether future biophysical changes due to LULCC warm or cool a specific region therefore requires an accurate simulation of changes in snow cover and rainfall geographically coincident with regions of LULCC. This is a challenge to current climate models, but also provides potential for further improving detection and attribution methods

DOI

19
Ramankutty N, Evan A, Monfredaet al., 2008. Farming the Planet: The geographic distribution of global agricultural lands in the year 2000. Global Biogeochemical Cycles, 22(1): GB1003.

20
Ramankutty N, Foley J A, 2010.

21
Sun J Z, 1959. The Regional Economic Geography Science in Northeast. Beijing: Science Press. (in Chinese)

22
Tan Q X, 1987. Historical Atlas of China: The Eighth Book. Beijing: China Cartographic Publishing House, 12-15. (in Chinese)

23
Tong S H, 1917. New Area Map of the Republic of China. Shanghai: Department of Home and Aboard Maps. (in Chinese)

24
Xu J H, 2009. Mathematical Methods in Contemporary Geography. Beijing: Higher Education Press. (in Chinese)

25
Ye Y, Fang X Q, Dai Y Jet al., 2006. Comparisons of cultivated land data in Three Provinces in Northeast in Republic of China and reconstruction of cropland area fraction.Progress in Natural Science, 16(11): 1419-1427. (in Chinese)

26
Ye Y, Fang X Q, Ren Y Yet al., 2009. Cropland cover change in Northeast China during the past 300 years. Science China: Earth Science, 39(3): 340-350. (in Chinese)Land use/cover change induced by human activities has emerged as a "global" phenomenon with Earth system consequences. Northeast China is an area where the largest land cultivation activities by migrants have happened in China during the past 300 years. In this paper, methods including documentary data calibration and multi-sourced data conversion model are used to reconstruct historical cropland cover change in Northeast China during the past 300 years. It is concluded that human beings have remarkably changed the natural landscape of the region by land cultivation in the past 300 years. Cropland area has increased almost exponentially during the past 300 years, especially during the past 100 years when the ratio of cropland cover changed from 10% to 20%. Until the middle of the 19th century, the agricultural area was still mainly restricted in Liaoning Province. From the late 19th century to the early 20th century, dramatic changes took place when the northern boundary of cultivation had extended to the middle of Heilongjiang Province. During the 20th century, three agricultural regions with high ratio of cropland cover were formed after the two phases of spatial expansion of cropland area in 1900s—1930s and 1950s—1980s. Since 1930s—1940s, the expansion of new cultivated area have invaded the forest lands especially in Jilin and Heilongjiang Provinces.

DOI

27
Zeng Z Z, Fang X Q, Ye Y, 2011. The process of land cultivation based on settlement names in Jilin Province in the past 300 years.Acta Geographica Sinica, 66(7): 985-993. (in Chinese)Settlements, as a land-use type, can reflect the interaction between human activities and natural environment. In a new cultivation area, establishment of new settlements and agricultural land cultivation were carried out simultaneously, which made it possible to identify the process of land cultivation through studying the temporal and spatial growth of settlements. Settlement names, which recorded the actual situation when people migrated to a new cultivated area, have very important values in research on land exploitation and historical process of land use/cover change. Based on the chorography of toponym in Jilin, this paper studied settlement names according to different types of land cultivation, and developed a method of classification for land cultivation-settlements. Then it identified two types of land cultivation-settlement, which were governmental cultivation-settlements and individual cultivation-settlements. Furthermore the latter could also be divided into two sub-types, individual migration-settlements and governmental recruitment-settlements. In this paper, the process of temporal-spatial distribution of land cultivation in Jilin Province in the past 300 years has been recognized, which may be helpful to study the land use/cover change in Jilin, and also provide an attempt to conduct research on land cultivation based on toponym, or settlement names.

28
Zhang L J, Jiang L Q, Zhang X Z, et al., 2014. Reconstruction of cropland over Heilongjiang Province in the late 19th century.Acta Geographica Sinica, 69(4): 448-458. (in Chinese)To understand human effects on climate and environment in the historical times, it is primary to reconstruct land use/cover changes over the past centuries. In this study, based on the previous studies, we collected county level-based cropland area from the multiple historical documents. The original records from different historical documents were calibrated with each other. The area units were also converted to present square kilometers. As a consequence, we obtained one integrated dataset which is one county level-based cropland area dataset. Next, we defined an agricultural suitability index (ASI) calculated by using distance from settlements, slope and complex of topography, and distance from rivers. The documental county level-based cropland area was spatially distributed into 1 km by 1 km size of pixels in the order of high ASI to low ASI. Then, we retrieved cropland of 2009 at a resolution of 1 km by 1 km using Landsat ETM+ imageries. We found that total cropland area in the late 19th century was 25397.0 km<sup>2</sup>. The cropland was mainly found in centralsouthern part of Heilongjiang Province, especially in the counties of Hailun, Bayan, Wuchang, Hulan, Shuangcheng and Wangkui. In 2009, the total cropland area increased to 163808.7 km<sup>2</sup> which spread over the southwestern to the central and northeastern parts of Heilongjiang. In the 20th century, cropland increased by 138411.7 km<sup>2</sup>. The cropland area fraction increased from 5.6% in the late 19th century to 36.2% in 2009. This implicates that 30.6% of natural land surface of Heilongjiang was replaced by anthropogenic cropland. Some 60962 km<sup>2</sup> (accounting for 44%) of increased cropland was derived from deforestation, which was mainly distributed in the western edge and northeastern part of the present agricultural area. The reconstructed cropland in the late 19th century supplies a basic dataset for studies on effects of agricultural development on climate and environment in the future.

DOI

29
Zhu F, Cui X F, Miao L J, 2012. China’s spatially-explicit historical land use data and its reconstruction methodology.Progress in Geography, 31(12):1563-1573. (in Chinese)To facilitate the study of spatiotemporal dynamics of land-use and its impacts on climate and ecology, it is crucial to reconstruct the historical land-use in long time series. Some scholars have made efforts to reconstruct the quantitative information on China&rsquo;s historical land-use, but the results were presented as statistical information in the administrative units without geographical distribution characteristics, which limits their applications in climatic and ecological models. Thus it is necessary to discuss the ways to reconstruct spatially-explicit historical land-use data. This paper presents a review, from a methodological point of view, on the historical land-use databases with spatial-explicit characteristics such as SAGE and HYDE, hoping to come up with better ways to reconstruct China&rsquo;s spatial historical land-use data and to provide data-support for the simulations of land-use change and its impacts on regional climate and ecology. The authors expound the relationship between different materials and their roles in historical reconstruction; emphasize the dual functions of population data in quantitative reconstruction and spatial allocation as well as its limitations; analyze the hypothesis of spatial allocation methods and the degree of dependency of different methods on current land-use patterns. In final discussions, the authors argue that more attention needs to be paid to the historical reconstruction of forest for the sake of the study on historical terrestrial carbon cycle, recommend to use the method of&lsquo;typical year control&rsquo;to deal with the impacts of unquantifiable socio-economic factors on historical land-use patterns, and propose to make separate reconstructions for different regions and put more focus on the integrated regional studies in the future.

DOI

Outlines

/