Orginal Article

Construction area expansion in relation to economic-demographic development and land resource in the Pearl River Delta of China

  • LIU Zhijia , 1, 2 ,
  • *HUANG Heqing , 1 ,
  • Saskia E. WERNERS 3 ,
  • YAN Dan 3
Expand
  • 1. Institute of Geographic Sciences and Natural Resources Research, CAS, Beijing 100101, China
  • 2. University of Chinese Academy of Sciences, Beijing 100049, China
  • 3. Earth Systems Science - Climate Change Group, Wageningen University and Research Centre, Box 47, 6700 AA Wageningen, The Netherlands

Author: Liu Zhijia (1986-), PhD Candidate, specialized in simulation of land use and cover change (LUCC). E-mail:

*Corresponding author: Huang Heqing (1962-), PhD and Professor, E-mail:

Received date: 2015-04-03

  Accepted date: 2015-08-27

  Online published: 2016-02-25

Supported by

China-Netherlands Joint Research Project of Chinese Academy of Sciences, No.GJHZ1019

National Natural Science Foundation of China, No.41330751

Copyright

Journal of Geographical Sciences, All Rights Reserved

Abstract

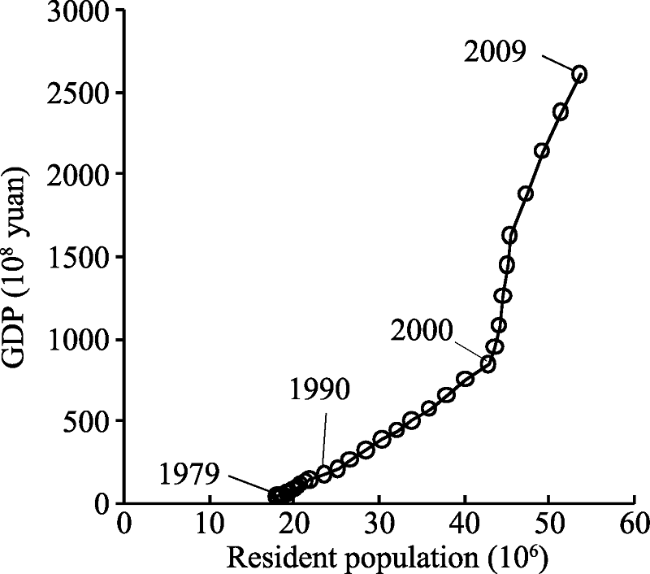
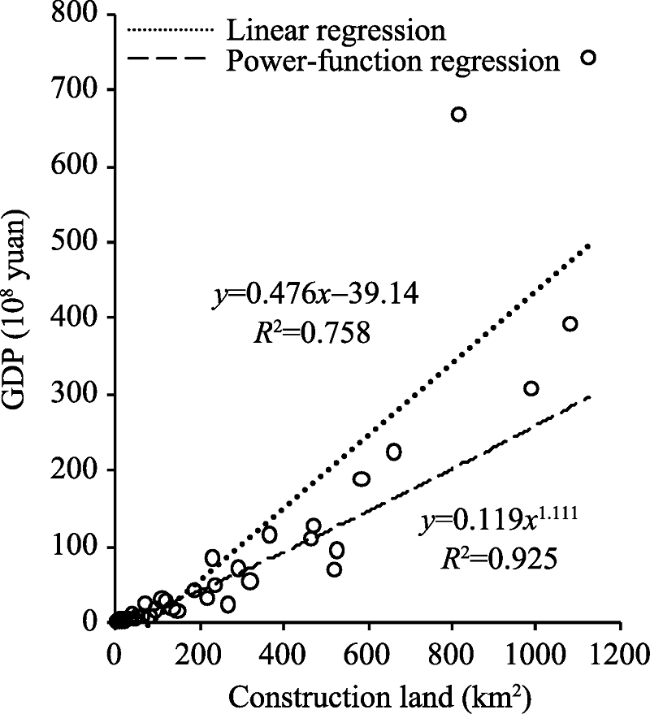
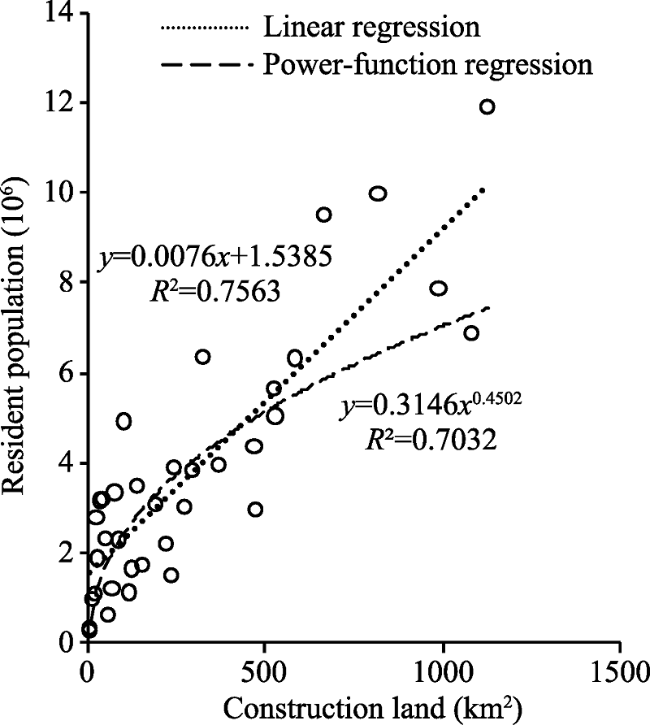
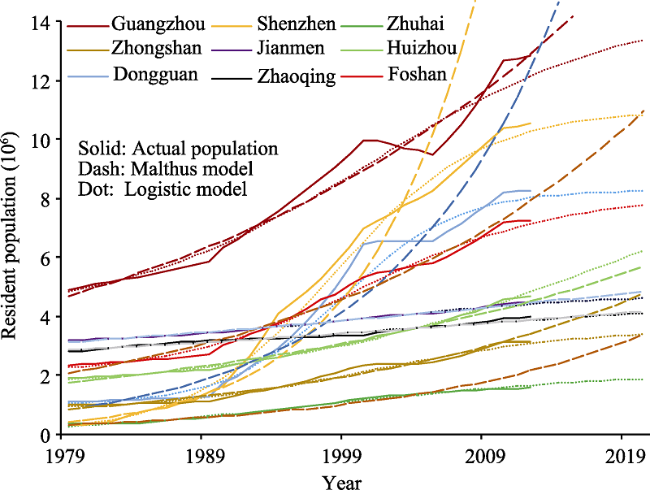
Since 1979, the Pearl River Delta (PRD) of China has experienced rapid socio- economic development along with a fast expansion of construction area. Affected by both natural and human factors, a complex interdependency is found among the regional changes in construction area, GDP and population. A quantitative analysis of the four phases of the regional land use data extracted from remote sensing images and socioeconomic statistics spanning 1979 to 2009 demonstrates that the proportion of construction area in the PRD increased from 0.5% in 1979 to 10.8% in 2009, accompanied with a rapid loss of agricultural land. An increase of one million residents was associated with an increase of GDP of approximately 32 billion yuan before 2000 and approximately 162 billion yuan after 2000. Because the expansion of construction area has approached the limits of land resource in some cities of the PRD, a power function is found more suitable than a linear one in describing the relationship between GDP and construction area. Consequently, the Logistic model is shown to provide more accurate predictions of population growth than the Malthus model, particularly in some cities where a very large proportion of land resource has been urbanized, such as Shenzhen and Dongguan.

Cite this article

LIU Zhijia , *HUANG Heqing , Saskia E. WERNERS , YAN Dan . Construction area expansion in relation to economic-demographic development and land resource in the Pearl River Delta of China[J]. Journal of Geographical Sciences, 2016 , 26(2) : 188 -202 . DOI: 10.1007/s11442-016-1262-7

As a hub of human population, urban land is strongly affected by the socioeconomic activities of the residents. Since the mid-20th century, the global expansion of urban land has exhibited an accelerating trend, especially in developing countries and regions (Davis 1966; Hance, 1970; World Resources Institute, 1996; Seto et al., 2003; Deng et al., 2008). Influenced by population growth, economic development, natural environment and their interactions, urban land expansion exhibits characteristics of complex systems (Li et al., 2000; Portugali, 2000; Filatova et al., 2009; Bettencourt, 2013).
Among the contributing factors, socioeconomic development plays a dominant role in urban land expansion (World Resources Institute, 1996; Henderson, 2003; Seto et al., 2011). In most cases, urban land expansion is closely related to economic growth (Zhou 1982; Moomaw et al., 1996; Henderson, 2003; Tan et al., 2003; Bertinelli et al., 2004; Liu et al., 2005; Seto et al., 2011; Chen, 2011). Nevertheless, this relationship differs from one place to another and in some regions urban land expansion is not always synchronized with economic growth. There are many cases in which construction area expansion continues while the regional economy stagnates or declines (Fay et al., 2000; Chang et al., 2006). In addition, population growth and concentration have dual effects on construction area expansion. At a lower population density, increasing population can accelerate construction area expansion. When the population density increases to a certain degree, urban congestion and environmental degradation appear, leading to a negative effect on construction area expansion (Davis, 1966; Hance, 1970; Ottensmann, 1977; Oucho et al., 1993; Sato et al., 2005; Deng et al., 2008). This complex feedback effect of construction area expansion on economic and population growth makes it difficult to predict the future of urban development (Hu, 2003; Sato et al., 2005; Cheng, 2007; Shen et al., 2007).
Having been experiencing more than 30 years of rapid development, the Pearl River Delta (PRD) becomes one of the most developed regions in China. To understand the interrelationships among economic development, population growth and construction area expansion in the region will help to enhance our knowledge on the mechanisms and trends of the regional urban land expansion, and consequently provide a sample and reference for sustainable urban development in other regions.

1 The study area

The Pearl River Delta (PRD) is located in the central and southern Guangdong Province of China, including nine prefecture-level cities: Guangzhou, Shenzhen, Zhuhai, Dongguan, Foshan, Zhongshan, Jiangmen, Huizhou, and Zhaoqing (Figure 1). The total area of the PRD is approximately 5.49×10⁴ km2. With a subtropical monsoon climate and fertile soil, crops are harvested two or three times each year, making the PRD an important crop production base of China. The dominant crop in the region is rice, and the other major crops are sugar cane, peanuts, soybeans, bananas, oranges and lychees.
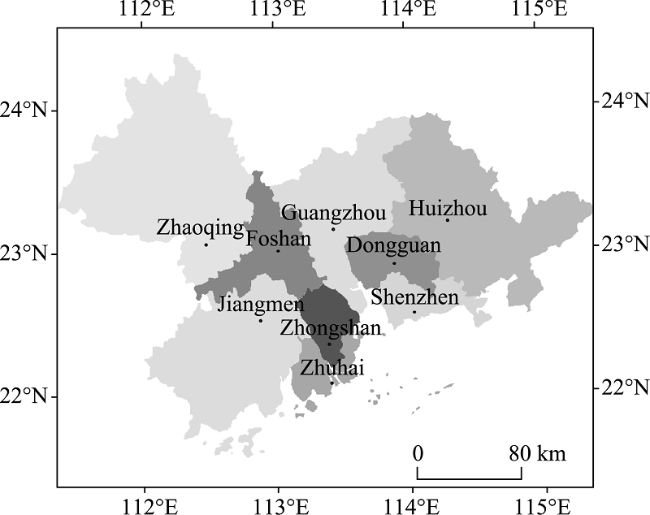
Figure 1 Location of the Pearl River Delta of China
Shortly after China’s economic reform at the beginning of the 1980s, with an attempt to attract foreign investment and accelerate economic development, two special economic zones, Shenzhen and Zhuhai, adjacent to Hong Kong and close to Macao respectively, were established in the PRD. With preferential tax policies and other favorable policies, the economy of the two special zones has grown at a high speed over the last 30 years, stimulating the economic development of the entire PRD. As a result, the GDP in the PRD grew more than 70 times from 1979 to 2009, at an annual average growth rate of 15.36% (at comparable prices in 2000). Along with the economic growth, a large number of employment opportunities have been created, attracting a large migrant population into the PRD. There were more than 23 million migrants living in the PRD in 2009, accounting for more than 40% of the total resident population in the region. Most migrants are concentrated in Shenzhen, Guangzhou, Dongguan and Foshan. At the same time, the industrial structure in the PRD has undergone great changes. From 1979 to 2009, the proportion of the primary industry dropped to 2.3% from 26.8%, and the proportion of the tertiary industry increased from 27.6% to 49.8%, although the proportion of the secondary industry remained relatively stable, fluctuating between 45%-50%. Along with the rapid economic and population growth, land use in the PRD has undergone a tremendous change and the dominant form is the rapid expansion of construction area (Seto and Kaufmann 2003).

2 Spatiotemporal expansion of construction area in the PRD

2.1 Data sources and preprocessing

To generate the time-series of land use data in the PRD, we selected Landsat images taken in an approximate 10-year interval from 1979. The earliest images taken in 1979 have a 57-m spatial resolution acquired with the Landsat Multispectral Scanner (MSS), while the other images taken in 1990, 1999 and 2009 have a 30-m spatial resolution acquired with the Landsat Thematic Mapper (TM) or Enhanced Thematic Mapper (ETM). The images in 1989 have a high degree of cloud cover and so they are replaced by the images in 1990. All images were downloaded from the U.S. Geological Survey (USGS) website (USGS 2012).
The main reference for the classification of the remote sensing images is the China’s national standard of “Current Land Use Classification” (General Administration of Quality Supervision 2007). In the classification, residential land, transportation land, warehouse land for mines, and land for public administration and public services are merged into construction land, forming the metric of urban area change in the PRD.
The images were interpreted in ENVI by a supervised classification method, in which the training samples were defined by a visual interpretation based on the pseudo-color display (RGB = 5, 4 and 3). To aid the visual interpretation, high-resolution images from Google Earth were used. In the selection of the training samples from the images taken in 1999 and 2009, we found many available Google Earth images, which are beneficial to improve the reliability of the samples. However, only a small number of Google Earth images are available in 1979 and 1990, and so the classification result obtained for 1999 were used as a reference. These classification results are presented in Figure 2.
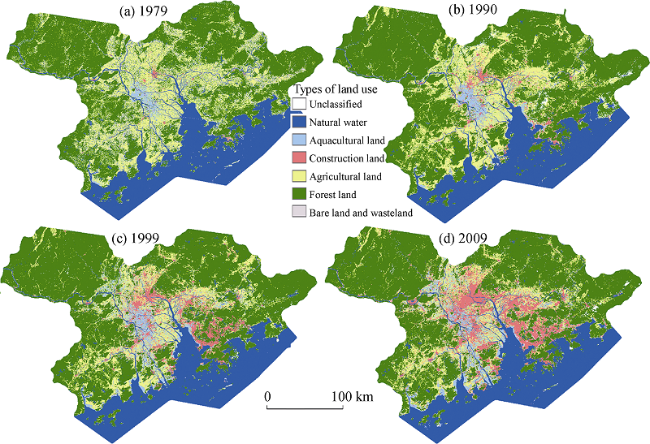
Figure 2 Land use changes in the Pearl River Delta during 1979-2009
Commission and omission errors are inevitable in remote sensing classifications. To obtain the actual ROI (Region of Interest) in each land use classification, both field validation and visual interpretation based on Google Earth high-resolution images were conducted. A field survey was implemented in the representative sites of Guangzhou, Foshan, Zhongshan and Zhaoqing to verify the classification, in addition to the verification with Google Earth images that have a resolution of up to 1 m. Based on the ROIs of actual land use types and the classification results, the corresponding confusion matrixes were calculated in ENVI.
It is noticeable in Table 1 that the degree of commission errors in construction land is lower, but the degree of omission errors is higher. This is due to the difficulty in distinguishing the area of green belt. The green belt in construction land is very close to agriculture land and forestry in spectrum and prone to being classified as farmland or forestry by mistake. In the other parts of construction land, both commission and omission errors are much lower, and so the user accuracy of construction land in 2009 and 1999 reaches as high as about 93%. In 1990, the clouds in the images descend the user accuracy of construction land to 89%. Because of the concentration of construction land, the accuracy loss of construction land classification caused by the lower resolution of images in 1979 is smaller than that of other land use type, and the user accuracy of construction land still reaches 82% in 1979.
Table 1 Confusion matrix of classification for the Pearl River Delta in 2009
Pixel count Actual land use
Natural
water
Aquacultural land Construction land Agricultural land Forest land Bare land and wasteland
Classification Unclassified 1 1 166 9 84 25
Natural water 35491 5333 7 2 6 0
Aquacultural land 2366 10739 71 125 19 0
Construction land 135 331 21579 650 359 135
Agricultural land 21 248 2532 19798 3060 108
Forest land 0 2 94 504 39705 8
Bare land andwasteland 0 3 1793 59 221 2614
Percentage (%) Actual land use
Natural water Aquacultural land Construction land Agricultural land Forest land Bare land and wasteland
Classification Unclassified 0 0.01 0.63 0.04 0.19 0.87
Natural water 93.36 32.02 0.03 0.01 0.01 0
Aquacultural land 6.22 64.47 0.27 0.59 0.04 0
Construction land 0.36 1.99 82.23 3.07 0.83 4.67
Agricultural land 0.06 1.49 9.65 93.62 7.04 3.74
Forest land 0 0.01 0.36 2.38 91.37 0.28
Bare land and waste land 0 0.02 6.83 0.28 0.51 90.45
User accuracy 86.90 80.62 93.06 76.83 98.49 55.74

2.2 Spatiotemporal characteristics of construction area expansion

A detailed statistical analysis of the land use data in the four phases (1979, 1990, 1999 and 2009) reveals that the area of construction land in the PRD was 246.58 km2 in 1979, accounting for only approximately 0.5% of the total land area. In 2009, the area of construction land expanded to 5844.58 km2, and its proportion in the total land area rose to 10.8%. However, this significant expansion of construction area has taken different paces during the three periods, with an expansion of 986.00 km2 in 1979-1990, 1886.25 km2 in 1990-1999, and 2725.75 km2 in 1999-2009, respectively.
As shown in Figures 3 and 4, the areas and proportions of construction land vary significantly with time in different cities. In Shenzhen and Dongguan, the proportions of construction land were less than 1% before the economic reform. Since then, the areas of construction land in the two cities have expanded much more sharply than in the other cities, and the construction land proportions in both cities rose to more than 40% in 2009, much higher than in the other cities. In Guangzhou and Foshan, the areas and proportions of construction land were significantly higher than in the other cities in 1979, and the areas of their construction land were still the top two among the nine cities in 2009. However, the overall proportions of their construction land were significantly lower than in Shenzhen and Dongguan due to the relatively slower rates of construction land expansion and the imbalanced internal development in the two cities. For small cities in the PRD, typically Zhuhai and Zhongshan, their construction land areas were relatively smaller, while the proportions of their construction land were close to Guangzhou and Foshan. Because Jiangmen, Huizhou and Zhaoqing are located at the edge of the region, the areas of their construction land were approximately equivalent to those in Zhuhai and Zhongshan, and yet the proportions of their construction land were much smaller than in the other six cities.
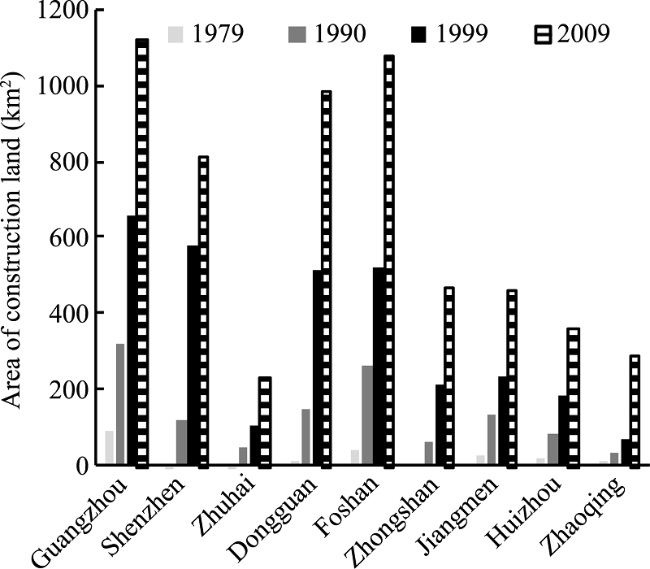
Figure 3 Construction area changes in each city of the Pearl River Delta (1979-2009)
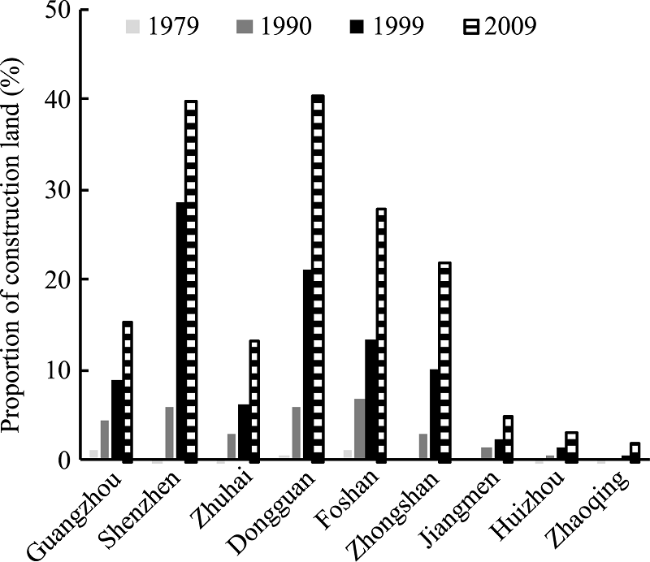
Figure 4 Changes in the proportion of construction land in each city of the Pearl River Delta (1979-2009)
It can also be noticed in Figures 3 and 4 that the rapid expansion of construction land in Shenzhen and Dongguan has changed the distributing pattern of construction land in the entire PRD region. In 1979, 57.33% of the construction land in the region was concentrated in Guangzhou and Foshan. In 2009, the proportions of the total construction land in the two cities fell to 37.78%, while the proportions of the total construction land in Shenzhen and Dongguan rose from 7.26% in 1979 to 30.90% in 2009.

3 Spatiotemporal characteristics of economic and population changes

3.1 Changes in GDP and resident population

The statistics on the GDP and resident population in the PRD mainly came from the statistical yearbook of each city and the Guangdong Province Statistical Yearbook. Before 1990, there was no resident population data for some cities, and so the household population data are used to approximate the resident population data. All of the GDP data are adjusted according to the comparable prices in 2000. Based on the comparable prices, GDP of the PRD has grown 71.73 times from 1979 to 2009, at an annual average rate of 15.36% (Figure 5). The resident population in the same period has grown 1.96 times, at an annual average rate of 3.69% (Figure 6).
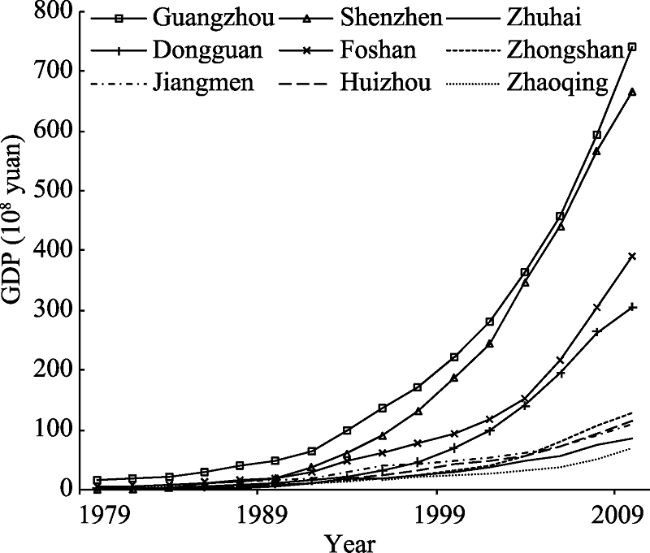
Figure 5 Changes of GDP in each city of the Pearl River Delta (1979-2009)
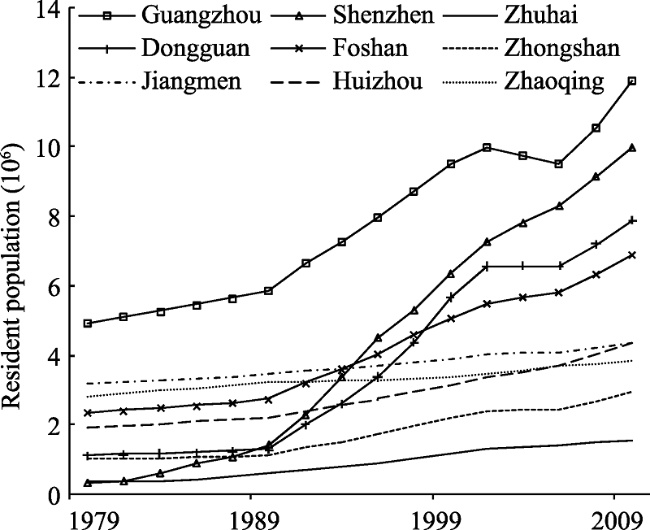
Figure 6 Resident population changes in each city of the Pearl River Delta (1979-2009)
During 1979 to 2009, the annual GDP growth rate in the PRD remained predominantly above 10%, with only a few exceptions, while the annual population growth rate in the region was relatively lower and varied in different stages. In the 1980s, the growth rate of resident population was approximately 2%. In the 1990s, driven by the rapid growth of resident population in Shenzhen and Dongguan, the annual growth rate of resident population in the entire region increased to 6-8%, and the total resident population nearly doubled within a decade. From 2000 to 2005, the annual growth rate of resident population decreased significantly except in Shenzhen, with the population growth rate in the whole PRD region falling below 2%. It was only after 2005 that the growth rate of resident population in the region began to recover gradually to over 4%.
The annual average growth rates of GDP and resident population in each city of the PRD have also varied significantly. Shenzhen and Dongguan have experienced the most rapid increases in the past three decades, while the annual growth rates of GDP and resident population in Guangzhou, Foshan, Zhuhai, and Zhongshan were close to the average growth rates of the whole region. In contrast, Jiangmen, Huizhou and Zhaoqing took significantly lower rates than the regional averages in both GDP and resident population.

3.2 Correlation between GDP and resident population

Economic development and population growth are related closely. Rapid economic development attracts migrants and the influx of migrants provides cheap labor for economic development, promoting economic prosperity in return (Yang 1995; Chen 2008). The growth of GDP in relation to the increase of resident population in the PRD is shown in Figure 7. It can be noticed that the relationship between GDP and resident population in the region is not a simple linear relationship; there was a clear turning point around 2000. Before 2000, GDP increased by approximately 32 billion yuan with each increase of one million in the resident population. After 2000, an equivalent increase of resident population contributed to an increase of approximately 162 billion yuan in GDP. As a result, the per capita GDP increased year by year in the PRD. In 1979, the per capita GDP was approximately 2,000 yuan; it increased to 19,600 yuan in 2000. Since 2000, the per capita GDP has accelerated significantly and reached 48,700 yuan in 2009.
Figure 7 Relationship between GDP and resident population in the Pearl River Delta (1979-2009)

4 Relationships between construction area, GDP and resident population

4.1 Linear relationships

To quantitatively understand the relationships between construction area expansion with changes in GDP (at comparable prices in 2000) and resident population, a linear regression model is applied to all cities in the PRD during 1979-2009 and the results are presented in Table 2. It is noticeable from Table 2 that the linear relationships between construction area, GDP and resident population are both significant. The value of coefficient b1 means that for 1 km2 of the construction area expansion, the regional GDP increases by approximately 0.4761 billion yuan and the resident population increases by approximately 7600. These significant correlations between construction area, GDP and resident population are closely related to the constitution of construction land. According to the statistics, the shares of industrial land and residential land are the two highest in the construction land (Deng et al., 2008). The expansion of industrial land, accompanying with expansion of industrial production scale and growth of industrial output, can promote significantly a city’s growth in GDP. In the same tune, the growth of resident population generates a significant demand for residential land, stimulating the development of more residential land.
Table 2 Regression relationships of construction area with GDP and population in the Pearl River Delta
Linear regression model Power function regression model
GDP (109 yuan) Resident population (106) Log (GDP) Log (resident population)
b0 -39.1430 1.5385 -2.1228 -1.1565
b1 0.4761 0.0076 1.1119 0.4502
R² 0.7585 0.7563 0.9257 0.7032
F 106.78 94.24 423.80 80.55
F(0.05) 4.13 4.13 4.13 4.13
Standard coefficient 0.87 0.87 0.96 0.84
T test value 10.48 10.42 20.89 9.11
t(0.05) 2.03 2.03 2.03 2.03

4.2 Nonlinear relationships

Figure 8 is plotted with the data of construction area against GDP data in all nine cities of the PRD and it is clear that the plots are not evenly distributed along both sides of the linear regression curve. Figure 9 presents the regression relationship between construction area and resident population in all nine cities of the PRD and it can be noticed that the data points are relatively evenly distributed along both sides of the linear regression curve. To improve the accuracy of the relationships, several nonlinear regression models are examined and it is found that the value of R2 of the power-function regression model between GDP and construction area reaches 0.9257, much higher than the linear regression model (Table 2 and Figure 8). Hence, the power-function regression model provides a significant improvement to the linear regression model for the relationship between construction area and resident population. This indicates that, compared to the linear model, the power-function model is more suitable for describing the relationship between construction area and GDP in the nine cities of the PRD. The regression equation for the power- function model between GDP and construction area in the PRD takes a form of:
where y is the value of GDP (billion yuan) and x represents the construction area (km2).
Figure 8 Relationship between GDP and construction land area in the Pearl River Delta
Figure 9 Relationship between resident population and construction area in the Pearl River Delta
In contrast, it can be noticed in Table 2 and Figure 9 that the application of a power-function regression model between the construction area and resident population cannot generate a significant improvement. Although the linear regression model remains suitable for illustrating the relationship, it is necessary to point out that the growth of resident population in the PRD is already subject to the constraints of land resource.

5 Land resource constraint on resident population growth

5.1 Limit of land resource

Land resource, the material foundation of human survival, provides an indispensable space for inhabitation, transportation and other human activities. Due to the rapid growth of population in the PRD, construction area expanded sharply and the limits of land resource have nearly been reached in some cities. Considering topographical constraints, land with slopes of 10% or less and elevations of 100 m or lower is regarded as flatland suitable for development (Ye et al., 2003). We also examined the land use data obtained in this study and the DEM data downloaded from the USGS with the tool of Overlay Analysis in ArcGIS, and found that more than 98% of the construction land in the region is concentrated in the flatland. Subtracting water area and prime cropland preservation area from the flatland yields the limit of land resource suitable for development for each city in the PRD (Table 3). It can be seen from Table 3 that there is still plenty of flatland suitable for development in the region overall, but more than a half of the flatland is concentrated in Jiangmen, Huizhou and Zhaoqing, where construction areas have been expanding relatively slowly. For the cities expanding at high speeds, such as Shenzhen and Dongguan, construction areas are approaching to the limits.
Table 3 Distribution of land resource and population in the Pearl River Delta in 2009
City Flatland
(km2)
Water
(km2)
Primary
cropland
(km2)
Limit of land resource
(km2)
Construction land (km2) Non-agricultural population
(million)
Population density (km-2)
Guangzhou 4310.17 447.8 1123.45 2738.93 1125.77 11.06 9827.55
Shenzhen 1165.9 127.49 20.00 1018.42 817.35 9.95 12173.61
Zhuhai 1024.31 104.54 244.08 675.69 232.94 1.54 6618.71
Dongguan 1961.4 206.85 279.22 1475.33 988.52 6.89 6968.09
Foshan 3319.85 347.4 486.63 2485.83 1082.2 5.13 4739.78
Zhongshan 1421.01 148.37 438.67 833.97 472.17 2.27 4809.71
Jiangmen 5823.99 624.74 1721.8 3477.45 466.22 2.65 5693.02
Huizhou 4395.16 473.49 1267.22 2654.45 367.12 2.98 8111.52
Zhaoqing 3589.52 379.12 1495.11 1715.3 292.3 0.88 3007.54
PRD 27011.32 2859.79 7076.18 17075.36 5844.58 43.36 7418.00
The distribution of the remaining flatland is also unbalanced in each city of the PRD (Figure 10). Although large areas suitable for development remain in Guangzhou and Zhuhai, most of them are distributed far from the centers of the two cities. As shown in Figure 10, the remaining flatland in Guangzhou is concentered in the northeast (Zengcheng District and Conghua District) and the south (Nansha District). In Zhuhai, the remaining flatland is mainly distributed in the west (Doumen District and Jinwan District). As a whole, the supply of new flatland for further development has been lowered down gradually in these cities. In the absence of sufficient suitable land, population density in these cities has gradually approached to saturation. To meet transportation, housing and other needs for urban life, the lowest per capita construction land needs to be approximately 140-200 m2, or 5000-7140 person﹒km-2 in population density (Zhou et al., 2003). According to this criterion, Shenzhen and Guangzhou are apparently already over-populated.
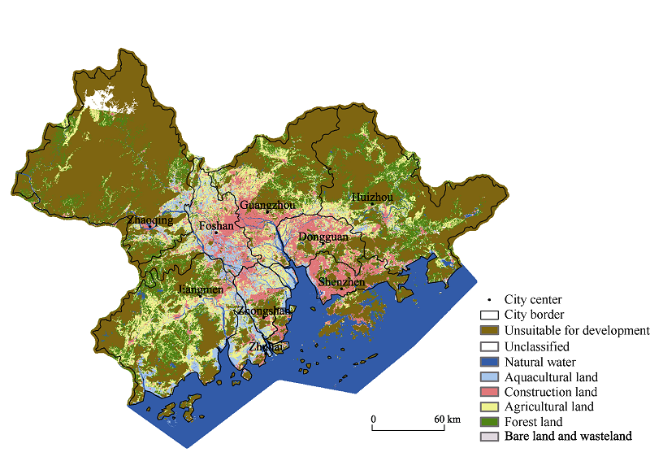
Figure 10 The distribution of remaining flatland in the Pearl River Delta in 2009
It is interesting to note in Eq. (1) that the increase of construction area takes a rate slower than the increase in GDP. Due to the limit of land resource and the associated expansion of construction area, land resource suitable for development becomes less and less, leading to the continuous rise of land price, more intensive development of land resource and a higher production per unit construction land. This trend can be clearly seen from the change in the GDP per unit construction land. As shown in Figure 11, the GDP per unit construction land in most cities of the PRD has increased significantly since 1999, with Shenzhen and Guangzhou being the fastest.
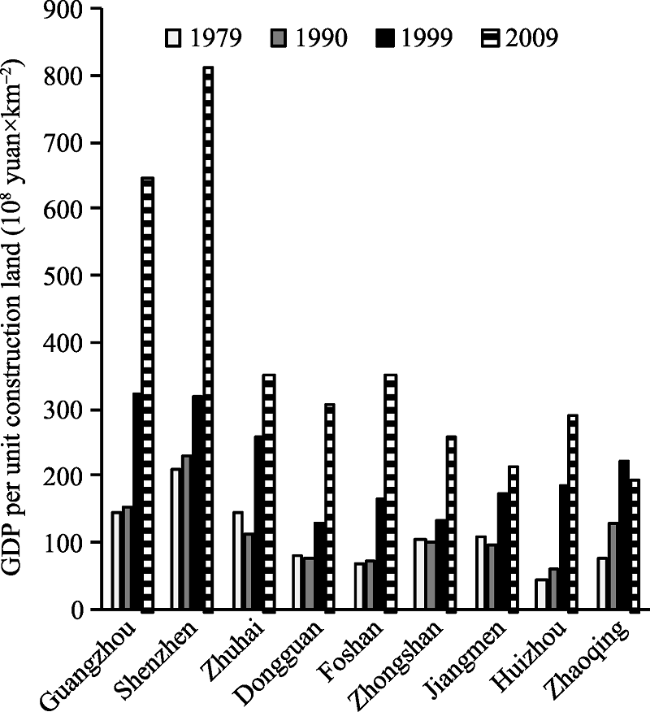
Figure 11 Changes of GDP in unit construction land in each city of the Pearl River Delta

5.2 Resident population change under land resource constraints

To examine the influence of land resource constraint on population growth in the PRD, both Malthus and Logistic models are applied to illustrate the dynamic change of resident population in each city of the PRD. The Malthus model assumes that population grows exponentially (Malthus, 1798), so the following function is applied:
where t represents time, P0 is the initial population at t=0, and r is an undetermined coefficient associated with the population growth in the concerned field.
Equivalently, Eq. (2) can be transformed into the linear form with a logarithmic transformation:
By applying the least-squares regression method, parameters P0 and r can be obtained from Eq. (3). Under the constraint of physical environment, typically land resource, population growth normally cannot sustain in the exponential form of Eq. (2) in the long term. To address this problem, the Logistic model has been proposed (Verhulst, 1838; Pearl et al., 1920). In the initial stage, the growth of population in the Logistic model is approximately exponential; then as population approaches saturation, its growth slows down gradually and eventually remains almost unchangeable. As a whole, the Logistic model takes an “S”- shaped curve, with the equation of:
where K is a constant representing the upper limit of population growth; α and β are both undetermined parameters. By applying a logarithmic transformation, Eq. (4) can be converted into the following form:
With Eq. (5) and by assuming that K is known, α and β can be determined by using the least-squares regression method. The value of K can be determined by using an enumeration method: assigning different values to K, calculating the corresponding values of R2 and giving the value that maximizes R2 to K.
Table 4 presents the results of the population changes for each city in the PRD during 1979-2009 predicted by both Malthus and Logistic models. According to the values of R2 obtained by applying the two models to each city in the PRD, the fit of the Logistic model to the population data is better than the Malthus model except in Zhaoqing (Table 4).
Table 4 Population growth rates obtained from the Malthus and Logistic models in terms of Eqs. (2) and (4) for each city in the Pearl River Delta
City Malthus model Logistic model
Growth rate (%) R2 K α β R2
Guangzhou 3.12 0.9641 1450 12.3677 0.1108 0.9700
Shenzhen 13.12 0.9432 1090 46.3464 0.1934 0.9941
Zhuhai 5.78 0.9762 210 6.8164 0.0973 0.9889
Dongguan 8.49 0.9383 830 138.8710 0.2408 0.9696
Foshan 4.13 0.9719 810 24.8648 0.1444 0.9855
Zhongshan 4.24 0.9595 360 21.5043 0.1346 0.9715
Jiangmen 1.08 0.9942 480 9.5208 0.1059 0.9967
Huizhou 2.90 0.9848 1080 3.2335 0.0780 0.9970
Zhaoqing 0.93 0.9726 460 4.8575 0.0659 0.9658
In addition, it can be seen from Table 4 that the Logistic model yields more accurate predictions of population growth than the Malthus model. Based on our collected demographic statistics for the PRD during 2010-2012, the errors between the actual data and the predictions of population growth using the Logistic model are generally smaller except in Zhuhai (Figure 12). By 2020, the predictions of population growth with the Logistic model are still in an acceptable range, while the predictions with the Malthus model significantly fall far away from the acceptable range, typically in Shenzhen and Dongguan. According to the Malthus model, the population of Shenzhen will reach more than 60 million before 2020, which obviously exceeds the population carrying capacity of Shenzhen.
Figure 12 Predictions of both Malthus and Logistic models against statistical data for each city in the Pearl River Delta
However, the difference between the predictions with both Logistic and Malthus models is very small prior to 2000. In fact, the two curves of population growth predicted with the two models for each city are essentially coincident before 2005 except for Shenzhen and Dongguan (Figure 12). In the early phase of population growth, the constraint of land resource on population growth is not significant, so the population growth is approximately exponential; as the population approaches the limit of land resource, the Logistic model yields a slower growth of population and the difference between the predictions from the models becomes larger and larger.
For cities subject to the severe constraint of land resource, the significant difference between the predictions from the two models arises earlier. For example, the difference between the predictions from the two models became larger and larger since 2003 in Shenzhen, while such a change in the difference arose later in Dongguan and Guangzhou. In other cities subject to the less server constraint of land resource, such as Zhuhai, Foshan and Zhongshan, the significant difference in the population predictions arose even later and was more inconspicuous. In cities with relatively abundant land resource, including Jiangmen, Huizhou and Zhaoqing, there was no significant difference between the population predictions from both Malthus and Logistic models.

6 Discussion and conclusions

6.1 Discussion

Since 1979, the PRD has undergone tremendous changes in economy, population and land use. A detailed analysis of the regional economic and demographic data from 1979 to 2009 reveals that the economic growth in the PRD is related to the growth of resident population in a complex form. Before 2000, an increase of one million resident population corresponded to an increase of approximately 32 billion yuan in GDP, whereas after 2000, the same increase in resident population corresponded to an increase of approximately 162 billion yuan in GDP.
By applying a linear regression method, it is found that the change in the regional construction area during 1979-2009 is linearly linked significantly with GDP and resident population in all nine cities of the PRD. According to these linear regressions, 1 km2 of the construction area expansion can make the regional GDP increase by approximately 0.4761 billion yuan and the resident population grow by approximately 7600. However, the rapid expansion of construction area over the course of more than 30 years has approached the limits of land resource in some cities of the PRD and the constraint of land resource has made the linear relationships between construction land, GDP and resident population change into nonlinear forms.
In the early developmental stage of the PRD, land resource was abundant and it is found that the expansion of construction area contributes to economic growth in a linearly proportional form. When the limit of land resource was approached, the expansion of construction area took a slower pace, while the GDP per unit area of construction area increased still at a much faster speed. This made a power function more suitable than a linear one in illustrating the relationship between GDP and construction area.
In parallel with the change in GDP per unit area, population density in the PRD also increased under the constraint of land resource. However, the population density cannot grow indefinitely in consideration of the suitability of living. Hence, there is an upper limit of population growth for each city. In some cities where most of land resource has been urbanized, such as Shenzhen and Dongguan, their populations are close to their limits and their population growths have been slowing down. As a result, the Logistic model is able to provide more accurate predictions of population growth than the Malthus model in these cities.
Due to the unbalanced economic development, there are large differences in the pressures of land resource in the nine cities of the PRD, making the relationships between economy, population and construction land exhibit different characteristics in different cities. For the six cities in the central region of the PRD, including Guangzhou, Shenzhen, Dongguan, Foshan, Zhuhai and Zhongshan, the GDP per unit construction area increased significantly at the later stage. Consequently, the linear relationship between economy and the construction area has been gradually weakening. Under the constraint of land resource, the population growth in these cities has been gradually slowing down, making the Logistic model more suitable to predict the population growth in the region. In the eastern and western parts of the PRD, including Huizhou, Jiangmen and Zhaoqing, the economic growth is still depending on land resource and the linear relationship between economy and the construction land is maintained. Due to the small pressures of land resource in Huizhou, Jiangmen and Zhaoqing, the Malthus model is suitable for the population prediction of the three cities.

6.2 Conclusions

In this paper, a quantitative analysis on the four phases of the regional land use data extracted from remote sensing images and socioeconomic statistics spanning 1979 to 2009 is applied to reveal the spatiotemporal characteristics of construction area expansion in relation to economic-demographic development and land resource in the PRD. The results showed that: (1) From 1979 to 2009, the proportion of construction area in the PRD increased from 0.5% in 1979 to 10.8% in 2009, accompanied with a rapid loss of agricultural land. (2) According to the linear regressions, each km2 of the construction area expansion can make the regional GDP increase by approximately 0.4761 billion yuan and the resident population grow by approximately 7600. (3) Constrained by the limits of land resource in some cities of the PRD, a power function is more suitable than a linear one in describing the relationship between GDP and construction area, while the Logistic model provides more accurate predictions of population growth than the Malthus model in some cities where a very large proportion of land resource has been urbanized, such as Shenzhen and Dongguan.

The authors have declared that no competing interests exist.

1
Bertinelli L, Black D, 2004. Urbanization and growth.Journal of Urban Economics, 56(1): 80-96.<h2 class="secHeading" id="section_abstract">Abstract</h2><p id="">In a simple urban economics framework, we aim at highlighting how the trade-off between optimal and equilibrium city size behaves when introducing dynamic human capital externalities in addition to the classical congestion externalities. Our purpose is to show that there are dynamic gains from statically oversized cities. To this end, we assume that productivity depends on human capital, which is solely accumulated in cities, such that urbanization is the engine of growth.</p>

DOI

2
Bettencourt L M A, 2013. The origins of scaling in cities.Science, 340(6139): 1438-1441.Abstract Despite the increasing importance of cities in human societies, our ability to understand them scientifically and manage them in practice has remained limited. The greatest difficulties to any scientific approach to cities have resulted from their many interdependent facets, as social, economic, infrastructural, and spatial complex systems that exist in similar but changing forms over a huge range of scales. Here, I show how all cities may evolve according to a small set of basic principles that operate locally. A theoretical framework was developed to predict the average social, spatial, and infrastructural properties of cities as a set of scaling relations that apply to all urban systems. Confirmation of these predictions was observed for thousands of cities worldwide, from many urban systems at different levels of development. Measures of urban efficiency, capturing the balance between socioeconomic outputs and infrastructural costs, were shown to be independent of city size and might be a useful means to evaluate urban planning strategies.

DOI PMID

3
Chang G H, Brada J C, 2006. The paradox of China’s growing under-urbanization.Economic Systems, 30(1): 24-40.<h2 class="secHeading" id="section_abstract">Abstract</h2><p id="">It is commonly believed that China began the socialist era as a very under-urbanized country relative to its level of development and that it has been eliminating this urbanization gap during the post-1978 period as a result of its economic reforms. Our reexamination of the relationship between per capita income and urbanization that underpins the conventional view suggests that China was not under-urbanized before or during the early period of the reform. Actually, China's urbanization gap appeared and grew in the late period of reform despite mass migration from rural to urban areas. This growing urbanization lag is mainly due to the slow pace in eliminating restrictions on rural&ndash;urban migration during a period of rapid economic growth. We call attention to this emerging urbanization lag as it entails significant economic costs in employment and retards economic growth.</p>

DOI

4
Chen Na, 2008. Study on the interactive relationship between migrant labor and economic development of the Pearl River Delta [D]. Guangzhou: Jinan University. (in Chinese)

5
Chen Yanguang, 2011. Modelling the relationships between urbanization and economic development levels with three functions.Scientia Geographica Sinica, 31(1): 1-6. (in Chinese)Three functions can be employed to model the relations between the level of urbanization and that of economic development.The first is a logarithmic function,the second is the power function,and the third is the logistic function.The logistic model of the relationships between urbanization and economic development levels is equivalent in mathematics to the exponential model of the relationships between urban-rural ratio(URR) and per capita products such as GDP and GNP.The exponential model is a logit model since URR is defined as the ratio of the urban to the rural population.The logarithmic model suggests that economic variables are control variables of urbanization associated with economic development,the logistic model indicates urban variables are control variables of evolution of regional systems,and the power-law model implies that the ratio of urban variables to economic variables control the system development.The basic dynamical equations of the three models are derived,and the results showed physical properties of the three kinds of systems.The similarities and differences between the different kinds of dynamics are revealed by drawing a comparison between the three models.Among these models,the logistic function presented in this work is applied to the 31 administrative areas of China including provinces,autonomous regions and municipalities directly under the Central Government.The examples based on the data from 2000 to 2008 illustrated how to estimate the parameters of the models for the aims of scientific explanation and prediction.In practice,the models can be used to judge whether or not urbanization keeps in step with economic development in a region.

DOI

6
Cheng Kaiming, 2007. A review of the mechanism and theoretical models on urbanization and economic growth.Economic Review, 28(4): 143-150. (in Chinese)

7
Davis K, 1966. The Urbanization of the Human Population. The City Reader. New York: Routledge, 1-14.

8
Deng Shiwen, Yan Xiaopei, Zhu Jincheng, 1999. Growth of urban and town construction land in the Pearl River Delta.Economic Geography, 19(4): 80-84. (in Chinese)The dynamic of the growth of urban and town construction land in the Pearl River Delta could be identified the demand of overdevelopment of the region's economy for the land. In this region,the land for the construction occupied large area of cultivated land, the growth rate of the total land use was very fast, the increased construction land was mainly used by industry and housing. In addition, the growth of construction land showed an obvious spatial difference, most of cities and towns saw an increase of construction land per capita, which, however, had not relaxed the tight land use in big cities, but expanded the construction land per capita in medium-sized and small cities with rich land. In terms of the current conditions and problems in the growth of urban and town construction land, some measures were put forward.

9
Deng Xiangzheng, Huang Jikun, Rozelle Set al., 2008. Growth, population and industrialization, and urban land expansion of China.Journal of Urban Economics, 63(1): 96-115.<h2 class="secHeading" id="section_abstract">Abstract</h2><p id="">China is experiencing urbanization at an unprecedented rate over the last two decades. The overall goal of this paper is to understand the extent of and the factors driving urban expansion in China from the late 1980s to 2000. We use a unique three-period panel data set of high-resolution satellite imagery data and socioeconomic data for entire area of coterminous China. Consistent with a number of the key hypotheses generated by the monocentric model, our results demonstrate the powerful role that the growth of income has played in China's urban expansion. In some empirical models, the other key variables in the monocentric model&mdash;population, the value of agricultural land and transportation costs&mdash;also matter. Adapting the basic empirical model to account for the environment in developing countries, we also find that industrialization and the rise of the service sector appear to have affected the growth of the urban core, but their role was relatively small when compared to the direct effects of economic growth. We also make a methodological contribution, demonstrating the potential importance of accounting for unobserved fixed effects.</p>

DOI

10
Fay M, Opal C, 2000. Urbanization without Growth: A Not So Uncommon Phenomenon. Vol. 2412. New York: World Bank Publications.

11
Filatova T, Parker D, van der Veen A, 2009. Agent-based urban land markets: Agent’s pricing behavior, land prices and urban land use change.The Journal of Artificial Societies and Social Simulation, 12(1): 1-31.

12
General Administration of Quality Supervision, Inspection and Quarantine of the People's Republic of China and Standardization Administration of the Peoples Republic of China. 2007. Current Land Use Classification GB/T21010-2007. (in Chinese)

13
Hance W A, 1970. Population, Migration, and Urbanization in Africa. Vol. 70: New York: Columbia University Press.

14
Henderson V, 2003. The urbanization process and economic growth: The so-what question.Journal of Economic Growth, 8(1): 47-71.lt;a name="Abs1"></a>There is an extensive literature on the urbanization process looking at both urbanization and urban concentration, asking whether and when there is under or over-urbanization or under or over urban concentration. Writers argue that national government policies and non-democratic institutions promote excessive concentration&#x2014;the extent to which the urban population of a country is concentrated in one or two major metropolitan areas&#x2014;except in former planned economies where migration restrictions are enforced. These literatures assume that there is an optimal level of urbanization or an optimal level of urban concentration, but no research to date has quantitatively examined the assumption and asked the basic <img src="/content/T317782VG206636L/xxlarge8220.gif" alt="ldquo" align="MIDDLE" border="0">so-what<img src="/content/T317782VG206636L/xxlarge8221.gif" alt="rdquo" align="MIDDLE" border="0"> question&#x2014;how great are the economic losses from significant deviations from any optimal degrees of urban concentration or rates of urbanization? This paper shows that (1) there is a best degree of urban concentration, in terms of maximizing productivity growth (2) that best degree varies with the level of development and country size, and (3) over or under-concentration can be very costly in terms of productivity growth. The paper shows also that productivity growth is not strongly affected by urbanization per se. Rapid urbanization has often occurred in the face of low or negative economic growth over some decades. Moreover, urbanization is a transitory phenomenon where many countries are now fully urbanized.

DOI

15
Hu Angang, 2003. Urbanization is the next major driver force of China’s economic development.Chinese Journal of Population Science, 17(6): 5-12. (in Chinese)

16
Li Xia, Yeh A G O, 2000. Modelling sustainable urban development by the integration of constrained cellular automata and GIS.International Journal of Geographical Information Science, 14(2): 131-152.Cellular Automata (CA) have attracted growing attention in urban simulation because their capability in spatial modelling is not fully developed in GIS. This paper discusses how cellular automata (CA) can be extended and integrated with GIS to help planners to search for better urban forms for sustainable development. The cellular automata model is built within a grid-GIS system to facilitate easy access to GIS databases for constructing the constraints. The essence of the model is that constraint space is used to regulate cellular space. Local, regional and global constraints play important roles in affecting modelling results. In addition, 'grey' cells are defined to represent the degrees or percentages of urban land development during the iterations of modelling for more accurate results. The model can be easily controlled by the parameter k using a power transformation function for calculating the constraint scores. It can be used as a useful planning tool to test the effects of different urban development scenarios.

DOI

17
Liu Jiyuan, Zhan Jinyan, Deng Xiangzheng, 2005. Spatio-temporal patterns and driving forces of urban land expansion in China during the economic reform era. AMBIO:A Journal of the Human Environment, 34(6): 450-455.Along with its economic reform, China has experienced a rapid urbanization. This study mapped urban land expansion in China using high-resolution Landsat Thematic Mapper and Enhanced Thematic Mapper data of 1989/1990, 1995/1996 and 1999/2000 and analyzed its expansion modes and the driving forces underlying this process during 1990-2000. Our results show that China's urban land increased by 817 thousand hectares, of which 80.8% occurred during 1990-1995 and 19.2% during 1995-2000. It was also found that China's urban expansion had high spatial and temporal differences, such as four expansion modes, concentric, leapfrog, linear and multi-nuclei, and their combinations coexisted and expanded urban land area in the second 5 y was much less than that of the first 5 y. Case studies of the 13 mega cities showed that urban expansion had been largely driven by demographic change, economic growth, and changes in land use policies and regulations.

DOI PMID

18
Malthus T R, 1798. An Essay on the Principle of Population 1998. Vol. 1. London: Electronic Scholarly Publishing Project.

19
Moomaw R L, Shatter A M, 1996. Urbanization and economic development: A bias toward large cities?Journal of Urban Economics, 40(1): 13-37.We find that a nations urban population percentage increases with GDP per capita; industrialization; export orientation; and possibly foreign assistance. It decreases with the importance of agriculture. Industrialization and agricultural importance have the same implications for the concentration of urban population in cities with 100000+ population as for the urban percentage. Greater export orientation reduces such concentration. Finally GDP per capita population and export orientation reduce primacy. Political factors such as whether a countrys largest city is also its capital affect primacy. Our results do not seem to imply that developing-country urbanization today differs fundamentally from urbanization in the past. (EXCERPT)

DOI PMID

20
Ottensmann J R, 1977. Urban sprawl, land values and the density of development.Land Economics, 53(4): 389-400.Our central paradigm for urban ecology is that cities are emergent phenomena of local-scale, dynamic interactions among socioeconomic and biophysical forces. These complex interactions give rise to a distinctive ecology and to distinctive ecological ...

DOI

21
Oucho J O, Gould W T, 1993. Internal Migration, Urbanization, and Population Distribution. Demographic Change in Sub-Saharan Africa. Washington, D.C.: National Academy Press, 256-296.

22
Pearl R, Reed L J, 1920. On the rate of growth of the population of the United States since 1790 and its mathematical representation.Proceedings of the National Academy of Sciences of the United States of America, 6(6): 275.Pearl and Reed begin their paper with a discussion of exponential and parabolic growth formulas for past U.S. population growth, which we have omitted.

DOI

23
Portugali J, 2000. Self-Organization and the City. Berlin: Springer.

24
Sato Y, Yamamoto K, 2005. Population concentration, urbanization, and demographic transition.Journal of Urban Economics, 58(1): 45-61.This paper investigates how urbanization and demographic transition interrelate with each other via merits (agglomeration economies) and demerits (congestion diseconomies) of population concentration. It reveals the mechanism by which agglomeration economies and congestion diseconomies affect the fertility rate. Furthermore, analysis also shows that by assuming declines in infant and child mortality rate, the model developed in this paper can replicate the following well-known historical patterns: (i) advances in urbanization, (ii) rises in the wage rate, (iii) declines in fertility, and (iv) rises followed by declines in the population growth rate (the inverted U-shaped demographic transition).

DOI

25
Seto K C, Kaufmann R K, 2003. Modeling the drivers of urban land use change in the Pearl River Delta, China: Integrating remote sensing with socioeconomic data.Land Economics, 79(1): 106-121.This paper estimates econometric models of the socioeconomic drivers of urban land use change in the Pearl River Delta, China. The panel data used to estimate the models are generated by combining high-resolution remote sensing data with economic and demographic data from annual compendium. The relations between variables are estimated using a random coef ficient model. Results indicate that urban expansion is associated with foreign direct investment and relative rates of productivity generated by land associated with agricultural and urban uses. This suggests that large-scale investments in industrial development, rather than local land users, play the major role in urban land conversion.

DOI

26
Seto K C, Fragkias M, Güneralp Bet al., 2011. A meta-analysis of global urban land expansion.PLoS ONE, 6(8): 1-9.The conversion of Earth's land surface to urban uses is one of the most irreversible human impacts on the global biosphere. It drives the loss of farmland, affects local climate, fragments habitats, and threatens biodiversity. Here we present a meta-analysis of 326 studies that have used remotely sensed images to map urban land conversion. We report a worldwide observed increase in urban land area of 58,000 km 2 from 1970 to 2000. India, China, and Africa have experienced the highest rates of urban land expansion, and the largest change in total urban extent has occurred in North America. Across all regions and for all three decades, urban land expansion rates are higher than or equal to urban population growth rates, suggesting that urban growth is becoming more expansive than compact. Annual growth in GDP per capita drives approximately half of the observed urban land expansion in China but only moderately affects urban expansion in India and Africa, where urban land expansion is driven more by urban population growth. In high income countries, rates of urban land expansion are slower and increasingly related to GDP growth. However, in North America, population growth contributes more to urban expansion than it does in Europe. Much of the observed variation in urban expansion was not captured by either population, GDP, or other variables in the model. This suggests that contemporary urban expansion is related to a variety of factors difficult to observe comprehensively at the global level, including international capital flows, the informal economy, land use policy, and generalized transport costs. Using the results from the global model, we develop forecasts for new urban land cover using SRES Scenarios. Our results show that by 2030, global urban land cover will increase between 430,000 km 2 and 12,568,000 km 2 , with an estimate of 1,527,000 km 2 more likely.

DOI PMID

27
Shen K R, Jiang R, 2007. How does urbanization affect economic growth in China.Statistical Research, 24(6): 9-15. (in Chinese)Research conclusions drawn in previous researches,urbanization exerts a positive influence on economic growth through two mechanisms as follows:Firstly,agglomeration of economies brought about by urbanization can acelerate the accumulation of capital,human resources,knowledge and other facts.Secondly,urbanization itself is a process of population migration,during which spare laborers move to cities from rural areas,so agriculture industry is optimized and non-agriculture industries are developed.At the same time,the development of the secondary and tertiary industries in urban areas upgrades the industrial structure and furthermore promotes economic growth.

28
Tan Minghong, Li Xiubing, Lv Changhe, 2003. An analysis of driving forces of urban land expansion in ChinaEconomic Geography, 23(5): 635-639.This paper analyzes the processes of urban expansion and quantifies its relationship with economic development and population growth during the last 15 years in China, using partial correlation and regression approaches. The results show that the total urban land areas are linearly increased in the last 15 years, and highly related to the growth of GDP and urban population of the whole country, and land requirement for the improvement of urban environment. The more detailed results include that: firstly, during the last 15 years, the land areas of urban built - up area annually go up in the speed of about 850km2; secondly, in the case of controlling for variable of ln( GDP) , the partial correlation coefficient between the areas of urban built - up area and urban population is only 0,0197; on the contrary, in the case of controlling for variable of urban population, the partial correlation coefficient between the land area of urban built - up areas and In( GDP) is 0.6335. So, development of economy can better explain the expansion of urban land use than urban population; thirdly, the economy development is the strongest driving force on the urban land expansion, it can not only directly drive the expansion of urban land use, but also indirectly affect it through urban population and urban environment.

29
USGS, 2012, 2012-05-17.

30
Verhulst P-F, 1838. Notice Sur La Loi Que La Population Suit Dans Son Accroissement. Correspondance Mathématique et Physique Publiée Par A.Quetelet, 10: 113-121.

31
World Resources Institute UNEP, United Nations Development Programme, the World Bank, 1996. World Resources 1996-97: The Urban Environment: New York.

32
Yang H S, 1995. An investigation and analysis on laborer tide in Pearl River Delta.Population Research, 19(02): 53-56. (in Chinese)

33
Ye Yuyao, Li Xiaobing, Zhang Hongou, 2008. Limits on construction land use in the Pearl River Delta.Resources Science, 30(5): 683-687. (in Chinese) This paper discusses the availability of land for construction use in the Pearl River Delta, with restrictions based on food security, use suitability and the need for an integrated life-support environment. Analysis based on food security restrictions shows that if land use conforms to the government-s Regulations on the Protection of Basic Farmland, then a baseline of farmland will be maintained. An analysis based on suitable use and integrated life-support environment factors shows that the maximum land area available for construction use in the Pearl River Delta is from 97.12×10⁴ hm<sup>2</sup> to 110.57×10<sup>4</sup>hm<sup>2</sup> 23.30 to 26.52 percent of the total area. The currently undeveloped portion totals 21.08×10<sup>4</sup>hm<sup>2</sup> to 34.53×10<sup>4</sup>hm<sup>2</sup>. Based on the rate of urban expansion from 1997 to 2004, unused construction land in the PRD will be used up in no more than 13 years. Depletion of available construction land is projected to occur in Zhuhai, Foshan and Zhongshan in 3 to 4 years, in Shenzhen and Dongguan in 7 to 8 years, and in Guangzhou in 13 years. Since land use and land supply are not perfectly matched, we assume that land supply will be depleted even more rapidly than estimated and cities in the PRD will soon experience a shortage of land. Although other cities in the Pearl River Delta, including Huizhou, Zhaoqing and Jiangmen, have a relatively abundant supply of land available for construction, there will also be conflicts over land resources due to rapid economic growth and the increasing use of land for construction. Overall, the supply of land for construction use in most cities of the Pearl River Delta is quite limited. There should be strict control of the land supply in order to improve the efficiency and quality of land use.

34
Zhou Chun, Shu Tingfei, Wu Renhai, 2003. A study of carrying capacity of land resources in Pearl River Delta. Scientific and Technological Management of Land and Resources, 20(6). (in Chinese)According to the features of Pearl River Delta, the essay puts forward a new conception of carrying capacity of land resources and establishes a new method to calculate the capacity. The new conception and the method are applied to the actual calculation of the carrying capacity of land resources in nine cities in Pearl River Delta, with a resul t that the nine cities possesses different carrying capacity.

35
Zhou Yixing, 1982. A research on the relationship between GNP and urbanization. Population & Economics, 3(1): 28-33. (in Chinese)

Outlines

/