Orginal Article

A comprehensive assessment of urban vulnerability and its spatial differentiation in China

  • FANG Chuanglin , 1 ,
  • *WANG Yan , 1 ,
  • FANG Jiawen 2
Expand
  • 1. Institute of Geographic Sciences and Natural Resources Research, CAS, Beijing 100101, China
  • 2. College of Urban and Environmental Sciences, Peking University, Beijing 100871, China

Author: Fang Chuanglin (1966-), Professor, specialized in land use and resources & urban geography.E-mail:

*Corresponding author: Wang Yan (1984-), PhD, specialized in economic geography, and urban & regional planning.E-mail:

Received date: 2015-07-16

  Accepted date: 2015-08-20

  Online published: 2016-02-25

Supported by

National Natural Science Foundation of China, No.41371177

Copyright

Journal of Geographical Sciences, All Rights Reserved

Abstract

The urban vulnerability poses a serious challenge to achieving sustainable development. With the concentration of the population and the economy, cities must manage the higher frequencies and risks of various hazards and are becoming more vulnerable. Research on the assessment and regulatory control of urban vulnerability is of great significance for both urbanization quality improvement and sustainable development in China or other countries in the world. Because of the complexity of cities and vulnerability concepts, existing studies have focused on different aspects of urban vulnerability. And the research content of urban vulnerability is scattered and relatively independent, leading to a lack of comparability among the research data and resulting in tremendous difficulties in summarizing the conclusions through comparison of independent research data. Therefore the goal of this study was to construct urban vulnerability index (UVI) from the perspective of sustainable development that could assess urban vulnerability comprehensively. In this study, we selected 10 subindexes involving 36 specific parameters from four aspects (resources, eco-environmental systems, economics, and social development) to construct a comprehensive index system. We also established the standard values of measurements. Then we take 288 prefecture-level cities in China as a study area and evaluate its overall urban vulnerability and its spatial differentiation. Results indicate that urban vulnerability of China has a remarkable spatial differentiation of both “gradient distribution” and “clustered distribution”; the extent of urban vulnerability corresponds to city size, the bigger the city, the lower its vulnerability; resource-based cities are more vulnerable than comprehensive cities; a city’s economic growth rate does not reflect the extent of its urban vulnerability. Further, we offer a few suggestions to cope with urban vulnerability in China.

Cite this article

FANG Chuanglin , *WANG Yan , FANG Jiawen . A comprehensive assessment of urban vulnerability and its spatial differentiation in China[J]. Journal of Geographical Sciences, 2016 , 26(2) : 153 -170 . DOI: 10.1007/s11442-016-1260-9

1 Introduction

1.1 Background

China is in a rapid urbanization stage: in the next 20 years, more than 60% of the population will live in the nation’s cities (Fang, 2009). With the concentration of the population and the economy, cities must manage the higher frequencies and risks of various hazards and are becoming more vulnerable. In addition, new-type urbanization requires the reduction of urban vulnerability and the improvement of urbanization quality. Therefore, research on urban vulnerability is an important scientific tool to explore the harmonious coexistence of the human-environmental systems, and urban vulnerability has become a key topic that needs to be strengthened in the forefront of research.
The concept of “vulnerability” originated from studies on natural disasters (Janssena et al., 2006). In the 1970s, White (1974) and Burton (1978) introduced this concept in their studies of natural disasters. Later, in the 1980s, this concept was expanded to research on starvation and food security, poverty, and development. For example, Sen (1981) adopted this concept in research on starvation and food security, and Chambers (1989) and Swift (1989) introduced it into the research field of poverty and development. In the 1990s, researchers concentrating on natural disasters began to pay attention to the effect of human activities on global environmental change, in particular, their effect on vulnerability to climate change. Liverman (1990) used the concept of “vulnerability” in research on global environmental change. During this period, a rapidly increasing number of studies in the field of human dimensions of global environmental change focused on vulnerability (Janssena et al., 2006; Janssen, 2007). In addition, research on vulnerability to climate change plays a pivotal role in the development of vulnerability research. Scholars have persistently tracked the studies of the Intergovernmental Panel on Climate Change (IPCC) on vulnerability to climate change and have analyzed the concept of vulnerability proposed by the IPCC (Watson et al., 1996; Watson et al., 1998; McCarthy et al., 2001). Moreover, research on poverty was also advanced during this period, which not only considered poverty caused by low income according to the traditional definition but also extended the research scope to the “poverty” of developmental capacity (Roberts and Yang, 2003). Referencing a power-losing theory emerging in food security research, developmental economic scholars conducted studies on vulnerability associated with sustainable livelihoods and poverty (Adger, 2006). In the 21st century, the vulnerability of coupled systems, particularly the coupled human-environment system and the coupled socio-ecological system, began to attract attention, leading to numerous studies on vulnerability on a specific spatial scale of coupled systems. In general, evolution of the “vulnerability” concept resulted from the processes of content extension and multidisciplinary comprehensive integration (Kelly and Adger, 2000). In particular, “vulnerability” in research on the human-environment system has become a collective concept (Newell et al., 2005), which includes the components of risk, fragility, marginalization, natural disaster, sensitivity, adaption and response, adaptive potential, resilience, etc. (Birkmann, 2007; Liverman, 2000). Humane studies have extended this concept to “vulnerability” in the pure sense of economic social systems (Adger et al., 2004; Adrianto and Matsuda, 2002). Related studies have emphasized the identification of vulnerable populations or groups and vulnerable regions and have focused on intraregional or interregional comparative analyses of vulnerability under the same disturbance background. These studies have generally been more focused on the economic, political, management system, and cultural factors that easily affect either human societies or groups, along with the sociocultural mechanisms and countermeasures that can be used to restore the resilience of both natural environmental systems and economic social systems (Li and Zhang, 2011).

1.2 Analysis of existing studies

Until now, domestic and international scholars have conducted both multidimensional and multilevel studies on urban vulnerability in different fields. In addition to a traditional risk-hazard research viewpoint, urban vulnerability research has achieved much in various fields, including sustainability science, socioecological resilience research, adaptability science, and complex human-environmental systems. The vulnerability studies in different fields are associated and have overlapped with each other, forming the core of vulnerability research. Urban vulnerability research has covered a broad range of topics, including social vulnerability to environmental hazards (Siagian et al., 2014; Cutter et al., 2003; Cutter, 1996), urban vulnerability to terrorist attacks (Walter et al., 2007), urban vulnerability to climate change (Grasso et al., 2014; Renaud and Perez, 2010; Hay and Mimura, 2006), urban internal vulnerability to heat (Joyce et al., 2014), urban vulnerability to natural disasters (Zhou et al., 2014; Usha, 2012), etc. Urban vulnerability research has involved cities in both developed and developing countries, such as the United States (Cutter et al., 2003), Australia (Abbas and Fahim, 2015), Chile (Muller et al., 2011), Kenya (Oluoko, 2011), South Korea (Koh, 2011), China (Yi et al., 2014), Bangladesh (Seraj et al., 1997), Vietnam (Nhuan et al., 2014), and Samoa (Grasso et al., 2014). The research methods used for urban vulnerability include data envelopment analysis (DEA), the geographic information system (GIS) ArcGIS, scenario analysis, the image-merging method, the vulnerability-function- based method, etc. As that research has become more profound, urban vulnerability research has evolved from the assessment of vulnerability associated with natural environmental deterioration to the investigation of the impact of human activities on vulnerability. In addition, the related research has also evolved from the simple assessment and passive acknowledgment of vulnerability-associated damage to the social economy to the active exploration of countermeasures for either coping with or avoiding vulnerability. Moreover, the focus of urban vulnerability research has shifted from traditional concepts, such as urban hazard vulnerability and eco-environmental vulnerability, to new concepts that are more closely associated with coupled systems, such as human-environment and socioecological systems (Fang et al., 2007).
Urban vulnerability research emerged in China more than two decades later than in other countries. However, with the acceleration of China’s rapid urbanization, chronic urban problems have become prominent, leading to an increasing number of urban vulnerability studies. According to the published data, China’s vulnerability research primarily focused on eco-environmental vulnerability and hazard vulnerability, which has made great progress in assessing eco-environmental vulnerability (Cai et al., 2009), classifying vulnerable eco-environmental systems (Liu and Li., 2007), and assessing vulnerability to natural disaster (Liu et al., 2010). Since the 21st century, scholars have attempted to investigate the socioeconomic vulnerability of a specific region under a specific disturbance, focusing on economic social vulnerability and sustainable development in special types of cities, including resource-based cities, coastal cities, and tourist cities (Su et al., 2008). However, the related studies primarily evaluated only the vulnerability of a single urban subsystem. In recent years, researchers began to pay attention to the vulnerability of urban complex systems, such as the vulnerability of urban economic social systems (Zhao and Zhang, 2006), the vulnerability of human-environment systems (Tian et al., 2013), urban vulnerability and sustainable development (Holling, 2007), and the vulnerability of urban and regional development (Zhang, 2006). However, until now, only a relatively small number of studies on the above aspects have been conducted.

1.3 Objectives and significance of this research

Because of the complexity of cities and vulnerability concepts, studies in different fields have focused on different aspects of urban vulnerability. Consequently, the research content of urban vulnerability is scattered and relatively independent, leading to a lack of comparability among the research data and resulting in tremendous difficulties in summarizing the conclusions through comparison of independent research data (Wang, 2013). Therefore, from the perspective of sustainable development, this paper proposes a comprehensive concept of urban vulnerability; according to this concept, urban vulnerability refers to the coping capacity to resist multiple aspects of disturbances from various internal and external natural and human factors—e.g., resources, ecological environmental, economic, and social development—during the urban development process. A city is considered vulnerable if its anti-disturbance capacity is below a threshold level. Urban vulnerability is generally a collective reflection of four types of vulnerability, namely, resource vulnerability, eco-environmental vulnerability, economic vulnerability, and social vulnerability (Figure 1). Based on the proposed concept of urban vulnerability, we attempted to construct a research framework and a comprehensive assessment system of urban vulnerability. A nation-scale comprehensive assessment was performed to clarify the overall status and spatial distribution pattern of urban vulnerability in China and to explore vulnerability characteristics in cities of different sizes. This study tries to provide the government with scientific evidence for the formulation and perfection of related policies and regulations for reducing and coping with
urban vulnerability and for creating sustainable development.
Figure 1 Basic framework for the urban vulnerability assessment

2 Study area and data sources

According to 2011 China City Statistical Yearbook, China includes 288 prefecture-level cities(In China, there are three types of cities: a municipality is a provincial-level division (e.g., Beijing); a prefecture-level city is governed by provinces or autonomous regions; and a county-level city is a sub-unit of a prefecture-level administrative division. Prefecture-level cities, the unit of analysis in this study, usually comprise an urban core surrounded by large stretches of rural areas. See Chan (2007) for an insightful discussion on the definition of cities in China and its implication on urbanization statistics.). For the convenience of data acquisition, 288 prefecture-level cities make up the study area for this study. And Hong Kong SAR, Macao SAR, or Taiwan Province were not included in this study because the relevant data were incomplete.
The data used in the calculations detailed in this section were collected from China City Statistical Yearbook, China Regional Economic Statistical Yearbook, China Urban Construction Statistical Yearbook,China Water Resources Bulletin, national economy and society developed statistical bulletin, and the statistical yearbooks of each city for the relevant years of this study.
In a comprehensive assessment of urban vulnerability, to eliminate the influence of data dimensional and size differences on the calculation results, it is necessary to first standardize the raw data. Because of the differences in the effect of sustainable development, parameters should be standardized with different methods. According to the relationship characteristics of vulnerability, each parameter was standardized using a different formula. With respect to their attributes, the objective assessment parameters in the systemic assessment system can be divided into three types:
Positive parameters: a larger value indicates higher vulnerability. The function is
Negative parameters: a larger value indicates lower vulnerability. The function is
Optimal parameters: this type of parameter has an optimal value, and neither a higher value nor a lower value than this optimal level is considered more beneficial (Duan, 2005). The function is
In the above functions, Xi is the nondimensionalized value of xi of the 36 parameters, which reflects the dispersion degree of all the parameters included in the concept of urban vulnerability; xi is the statistical value of a parameter; x0 is the standard value of a parameter; and xmax and xmin are the maximum and minimum values of the same parameter, respectively. i indicates the ith parameter in the equation, in which i=1, 2, …, 36 and n=288.

3 Methods

3.1 The index system for a comprehensive assessment of urban vulnerability

In this study, using 288 Chinese cities at the prefectural level and above as study subjects, an index system for a comprehensive assessment of urban vulnerability was established from four dimensions (urban resources, environment, economy, and society) that involved 36 corresponding parameters. Standard values of urban vulnerability parameters were determined using the following approaches: (1) directly adopting the standard values proposed in the international or national survey reports; (2) referencing the current actual values in the domestic and international advanced areas; (3) basing those values on the current calculation results; and (4) referencing the currently available data in authoritative literature. The weights of the urban vulnerability index (VI) and relevant parameters were calculated using the expert scoring method and analytic hierarchy process (AHP) with the support of entropy technology (Fang, 2000). Based on the obtained results, an index system and standard parameter values for comprehensive assessment of urban vulnerability were established (Table 1).
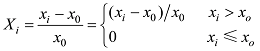
Table 1 Index system for the comprehensive assessment of urban vulnerability in China

3.2 The measurement model for the comprehensive assessment of urban vulnerability

3.2.1 The measurement model for subfactor indexes
Urban subfactor VIe are listed in the criteria hierarchy, which can be calculated based on the arithmetic mean values of corresponding parameters using the below equation:
where Xi is the standardized value of a parameter, m is the number of parameters included in a subfactor index, and UVIe is the subfactor index of urban vulnerability. There are 10 subfactor indexes, including urban resource utilization VI (RUVI), urban resource assurance VI (RTVI), urban ecological VI (ECVI), urban environmental VI (ENVI), urban economic structure index (ESI), economic efficiency index (EEI), urban economic innovation index (EII), urban human development index (HDI), urban infrastructure VI (IFVI), and urban social environmental VI (SEVI).
3.2.2 The measurement model for subsystem indexes
Urban subsystem VIs are listed in the target hierarchy, which can be calculated using a weighting method following the below equation:
where (UVIe)i is the subfactor VI; n is the number of subfactors included in a subsystem VI; Wi is the weight of a subfactor in the criteria hierarchy; and UVIs is the urban subsystem VI, including resource VI (URVI), eco-environmental VI (UEnVI), economic VI (UEcVI), and social VI (USVI). Because the urban economic structure index (ESI), economic efficiency index (EEI), urban economic innovation index (EII), and urban human development index (HDI) are negative parameters, they were calculated using the values of “1-ESI,” “1-EEI,” “1-EII,” and “1-HDI.”
3.2.3 The measurement model for comprehensive assessment
Urban comprehensive VI was calculated using the weighted summation of urban subsystem VIs following the below equation:
where (UVIs)i is the subsystem VI, Qi is the weight of each subsystem in the target hierarchy, p is the number of subsystem indexes included in the comprehensive VI, and UVI is the urban comprehensive VI.

3.3 Determination and grading of urban vulnerability

Based on the calculated values, urban comprehensive VI (UVI) was separated into five grades according to the natural breaking points, that is, lower vulnerability, low vulnerability, moderate vulnerability, high vulnerability, and higher vulnerability (Table 2).
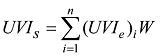
Table 2 Grading criteria for the comprehensive assessment of urban vulnerability in China
Grades of
urban
vulnerability
GradeⅠ GradeⅡ GradeⅢ GradeⅣ GradeⅤ
Lower
vulnerability
Low
vulnerability
Moderate
vulnerability
High
vulnerability
Higher
vulnerability
UVI <0.47 0.48-0.52 0.53-0.57 0.58-0.62 >0.63

4 Results

4.1 Urban vulnerability demonstrates a remarkable “grade-difference”-based differentiation feature, and overall vulnerability is moderate

The average UVI of 288 Chinese cities at the prefectural level and above is 0.5481, and their overall vulnerability is moderate. Shenzhen has the lowest UVI of 0.1221, followed by Beijing’s urban UVI of 0.3622. Baiyin City, a city facing resource exhaustion, has the highest UVI, 0.6762. There are remarkable differences in UVI among individual cities, as evidenced by the data indicating that the highest value is more than five times the lowest value. According to the UVI, urban vulnerability was divided into five grades based on the natural breaking points. The average UVIs of the five grades of cities are 0.4239, 0.5005, 0.5514, 0.5940, and 0.6462, and the average UVI of the high-vulnerability cities is 2.9 times the average UVI of the low-vulnerability cities, indicating distinct differences among cities at different vulnerability grades.
The hierarchical analysis of the number of cities demonstrated that the numbers of cities with low vulnerability, moderate vulnerability, and higher vulnerability are relatively large, accounting for 19.79%, 42.36%, and 26.04% of the total number of cities, respectively, and the sum of the cities at these three vulnerability grades accounted for 88.19% of the total number of cities. The numbers of the lower-vulnerability cities and the higher-vulnerability cities are comparable at 20 and 14, accounting for 7% and 5% of the total number of cities, respectively. In China, urban vulnerability shows a “more in the middle and fewer at the ends” distribution pattern. Various problems arose during rapid urbanization, and the cities have shown vulnerability to different extents.

4.2 Urban vulnerability demonstrates a “gradient-distribution”-based heterogeneous feature, as demonstrated by the higher urban vulnerability in the eastern region than in the central-western regions

The cities with lower or low vulnerability are mostly located in the eastern coastal zone, the moderate-vulnerability cities are mostly located in Central China, and the cities with high or higher vulnerability are mostly located in Western China. In terms of overall urban vulnerability, a statistical analysis of cities with different grades of vulnerability in Eastern, Central, and Western China(The region to which a city belongs is determined based on the region to which the corresponding provinces (or autonomous regions or municipalities directly under the Central Government) belongs. Eastern China includes Liaoning, Hebei, Beijing, Tianjin, Shandong, Jiangsu, Shanghai, Zhejiang, Fujian, Guangdong, and Hainan (11). Central China includes Heilongjiang, Jilin, Shanxi, Henan, Anhui, Hubei, Hunan, and Jiangxi (8). Western China includes Inner Mongolia, Shaanxi, Gansu, Ningxia, Qinghai, Xinjiang, Sichuan, Yunnan, Guizhou, Tibet, Chongqing, and Guangxi (12).) revealed significant interregional differences. The average UVI of the cities in Eastern, Central, and Western China is 0.5161, 0.5564 and 0.5911, respectively. In terms of the vulnerability grades, cities with GradeⅠ and GradeⅡ vulnerability were concentrated in the east and accounted for more than half of China’s cities with the same grade (85.00% and 68.42%, respectively).A larger number of cities with GradeⅢ and GradeⅣ vulnerability are distributed in Central China and accounted for 52.46% and 37.33% of those cities, respectively. The GradeⅤ cities are concentrated in the west (Figure 2). The analysis of the proportion of cities with different grades of vulnerability in each region shows that the proportion of Grade Ⅲ cities (40.86%) is the largest in Eastern China, followed by GradeⅡ and GradeⅠ, and GradeⅤ cities are scarce in the east. Central China is dominated by GradeⅢ and GradeⅣ cities, which account for 58.71% and 25.69%, respectively. Western China is dominated by GradeⅣ and GradeⅤ cities, which account for 56.25% and 18.75%, respectively (Figure 3).
Figure 2 Distribution of cities with different grades of vulnerability in Eastern, Central, and Western China
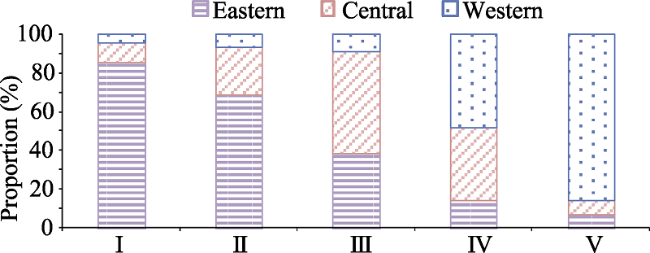
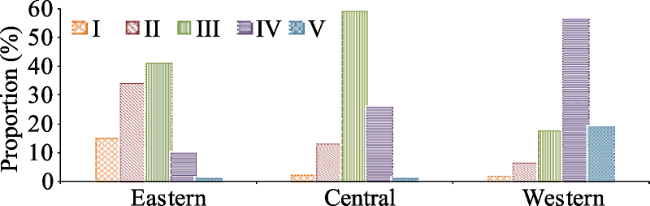
Figure 3 Proportions of cities with different grades of vulnerability in Eastern, Central, and Western China
Interregional differences are also demonstrated by Figure 4, in which urban vulnerability shows a westbound increasing trend. Moreover, urban resource vulnerability, eco-environmental vulnerability, economic vulnerability, and social vulnerability all show spatial differentiation consistent with that of urban overall vulnerability, showing a low-to-high order of Eastern China<Central China<Western China (Figure 5). In particular, there is a large difference in the vulnerabilities of resource utilization, environmental protection, and infrastructure (Table 3).
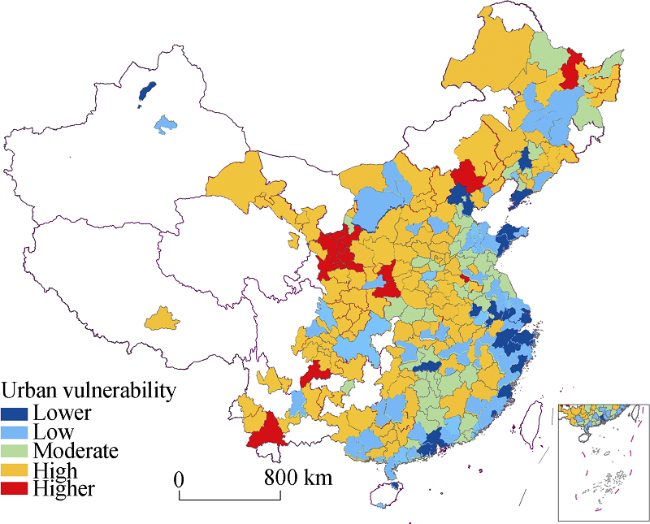
Figure 4 The spatial differentiation of urban synthetic vulnerability in China
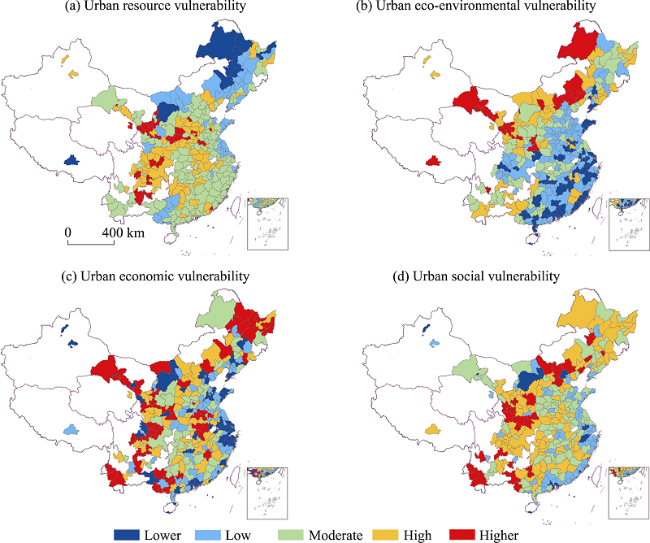
Figure 5 Spatial heterogeneous distribution of urban resource vulnerability, eco-environmental vulnerability, economic vulnerability, and social vulnerability in China
Table 3 Comparison of the assessment indexes of urban vulnerability in Eastern, Central, and Western China
Region Resource utilization VI Resource assurance VI Ecological protection VI Environmental protection VI Economic structure index Economic efficiency index Economic innovation index Human development index Socio-environmental VI Infrastructure VI
Eastern China 0.0798 0.0338 0.0202 0.0144 0.0307 0.0653 0.0490 0.0339 0.0368 0.0388
Central China 0.1256 0.0348 0.0221 0.0215 0.0440 0.0734 0.0619 0.0349 0.0379 0.0501
Western China 0.1586 0.0409 0.0281 0.0340 0.0452 0.0792 0.0697 0.0383 0.0490 0.0571
The spatial “gradient-distribution”-based heterogeneous feature of China’s urban vulnerability results from the impacts of multiple factors, both historical and environmental. From the perspective of natural conditions, compared to Eastern China, Western China has much poorer water and soil resources and climate conditions: the surface vegetation is mostly distributed among steppe and desert, and geologic and topographic features are complicated. In Western China, natural disasters frequently occur, environmental conditions are poor, and the eco-environment is vulnerable. These disadvantageous conditions are not conducive to human habitation and agricultural production, resulting in a poverty situation that has long existed in the region. Since the implementation of the reformation and opening-up policy, China’s unbalanced development strategy has drastically promoted the rapid growth of Eastern China, making this region a new economic growth point but further broadening the gap in economic development between the eastern and central-western regions. Moreover, differences in economic development have led to increased interregional differences in social development, such as education, medical care, and infrastructure. Since 2000, with the implementation of the Development Campaign of the Western Regions, economic growth in Western China has significantly accelerated, along with essential improvement in urban and rural living standards, along with education and infrastructure status. However, against the background of nationwide rapid economic growth, particularly that of Eastern China, the difference between the eastern and western regions did not decrease and instead increased in some aspects. During the period from 1979 to 2001, Eastern China contributed 57.8% and Central China contributed 27.9% toward GDP, whereas Western China contributed only 14.3%. Taken together, differences in natural conditions led to differences in economic development, and differences in the total economy and economic development led to differences in demographic and social development. Through this process, the combined effects of natural, economic, and social factors resulted in the spatial heterogeneous characteristics of urban vulnerability.

4.3 Urban vulnerability distribution shows a remarkable clustered spatial differentiation, and areas with concentrated cities have lower vulnerability than other areas

In Figure 4, the blank areas indicate the absence of cities at a prefectural level and above, such as autonomous prefectures. As shown in this figure, cities with low urban vulnerability are concentrated, showing a “clustered” distribution pattern. The areas with low urban vulnerability include the Harbin-Changchun area, the central and southern Liaoning area, the Beijing-Tianjin-Hebei area, the Shandong Peninsula, the Yangtze River Delta, the Pearl River Delta, the middle Yangtze River area, the western Taiwan Straits, and the Chengdu-Chongqing area. This distribution pattern is consistent with the spatial distribution of the major city clusters in China (Figure 6). In the areas with a clustered distribution, cities with a low UVI and low vulnerability include Changchun and Harbin (in the Harbin-Changchun area); Shenyang and Dalian in the central and southern Liaoning area; Beijing and Tianjin (in the Beijing-Tianjin- Hebei area); Qingdao, Yantai, and Jinan (in the Shandong Peninsula); Shanghai, Nanjing, Wuxi, Ningbo, Yangzhou, Suzhou, Changzhou, Taizhou, Zhoushan, and Zhenjiang (in the Yangtze River Delta); Shenzhen, Zhuhai, Xiamen, Guangzhou, Zhongshan, and Dongguan (in the Pearl River Delta); Wuhan and Changsha (in the middle Yangtze River area); Fuzhou and Xiamen (on the western Taiwan Straits); and Chengdu and Chongqing (in the Chengdu-Chongqing area). Clearly, the cities with lower or low vulnerability are mostly distributed within the city-cluster areas of Eastern China, and only a few are capital or major cities of the provinces in centralwestern China. Cities with high or higher vulnerability are primarily concentrated in the old industrial base of northeast China, the arid area of northwest China, and the southwest China (Figure 7). Developing and expanding city clusters are not only a major method of reducing urban vulnerability but are also an important approach to promoting healthy urbanization and improving the developmental level of urbanization.
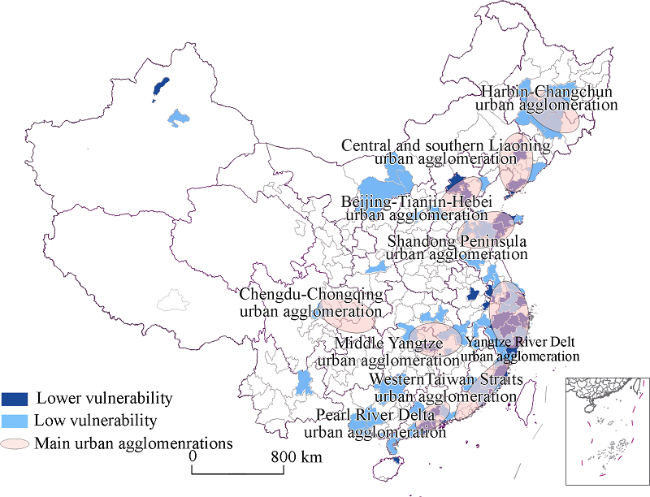
Figure 6 Distribution of cities with lower or low vulnerability
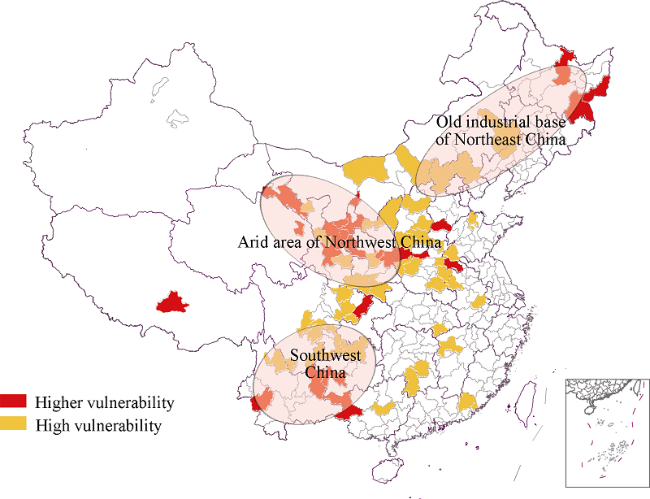
Figure 7 Distribution of the cities with high or higher vulnerability

4.4 Degree of urban vulnerability is associated with city size to a certain extent, and larger cities are less vulnerable

Using the metropolitan population as an indicator of city size, the relationship between city size and urban vulnerability was explored. From the perspective of individual cities (Figure 8), there is no definitive corresponding relationship observed between urban vulnerability and city size; that is, UVI does not significantly decrease with the increasing metropolitan population. However, if cities are divided into different levels based on metropolitan population, the average UVIs of small cities (below 200,000), medium-sized cities (200,000- 500,000), large cities (500,000-1000,000), very large cities (1-2 million), and super-large cities (more than 2 million) are 0.5717, 0.5697, 0.5625, 0.5461, and 0.4903, respectively, demonstrating a decreasing trend with increasing city size (Figure 9). However, the UVI differences among the small cities, medium-sized cities, and large cities are insignificant, whereas the difference between very large cities and small cities is relatively large. In other words, from the perspective of individual cities, larger cities do not necessarily have lower vulnerability, and both medium-sized and small cities are suitable for economic development and human life. Nevertheless, overall, the bigger the city size, the lower the urban overall vulnerability, which is conducive to urban sustainable development.
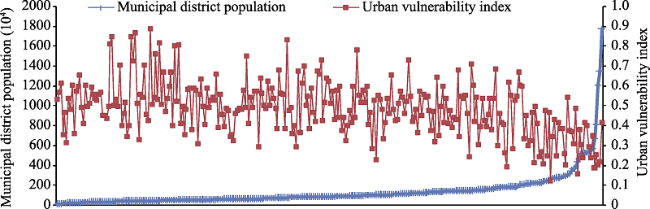
Figure 8 Relationship between city size and urban vulnerability in China
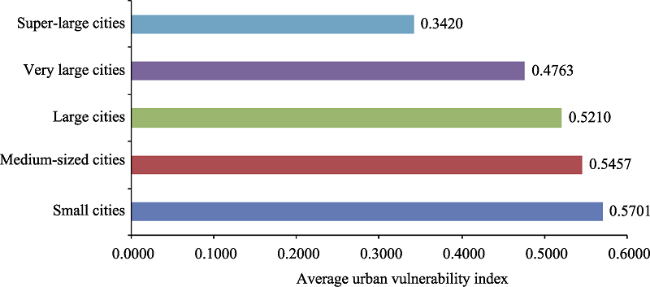
Figure 9 Average UVIs of cities with different sizes in China

4.5 Resource-based cities have significantly higher vulnerability than comprehensive cities, and cities with a higher functional comprehensiveness have lower urban vulnerability

China’s cities at a prefectural level and above were divided into two classes according to their urban functions: resource-based cities and comprehensive cities(As reported in “A Survey on Economic Structural Transformation of Resource-Based Cities in China,” published in 2002 by the Academy of Macroeconomic Research, State Development Planning Commission, China has 118 resource-based cities, including 47 prefectural-level cities and 71 county-level cities. Based on these data, the cities at a prefectural level and above in China can be roughly divided into two categories: resource-based cities and comprehensive cities. China has 47 resource-based cities and 241 comprehensive cities.). The average UVI is 0.5703 among the resource-based cities and 0.5440 among the comprehensive cities. Based on the grading criteria of the comprehensive assessment system of urban vulnerability, the resource-based cities overall have a relatively high vulnerability, whereas the comprehensive cities overall have a moderate vulnerability. In terms of resource types, the resource-based cities are further divided into coal-based cities, nonferrous-metallurgical-industry-based cities, ferrous-metallurgical-industry-based cities, petroleum-based cities, logging-industry- based cities, and other types of cities. The average UVIs of cities with different types of resources are in the descending order of coal-based cities>metallurgical-industry-based cities>logging-industry-based cities>other types of cities>petroleum-based cities (Figure 10). Moreover, compared with the comprehensive cities, the resource-based cities have significantly higher UVIs. In addition, among the resource-based cities, cities with different resource types have different vulnerability levels, and cities with a single type of resource are more vulnerable than cities with multiple types of resources.
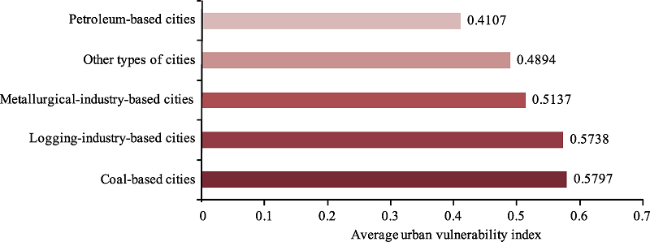
Figure 10 Average UVIs of different types of resource-based cities in China

4.6 The economic growth rate of cities does not necessarily correspond to the level of urban vulnerability, and cities with rapid economic growth might not have low vulnerability

To explore the relationship between urban economic growth and vulnerability, the metropolitan GDP growth rate was used as an indicator of cities’ economic growth. The GDP growth rate in 2011 was the slowest in Karamay City (3.5%), followed by Langfang (4.0%), whereas Qingyang had the fastest growth (30.3%), followed by Wuzhou (27.1%). Correspondingly, the urban VIs of these four cities is 0.4653, 0.5300, 0.5583, and 0.5550. Regardless of the large differences in the GDP growth rate among these four cities, their UVIs are not significantly different, indicating that economic growth does not necessarily correspond to the level of urban vulnerability. In addition, as shown in Figure 11, urban UVI irregularly fluctuates and does not decrease with the increase of the metropolitan GDP growth rate, suggesting that there is not necessarily a connection between the two. The correlation coefficient is only 0.15, indicating a low correlation between the two. Therefore, cities’ economic growth rate cannot reflect the level of urban vulnerability.
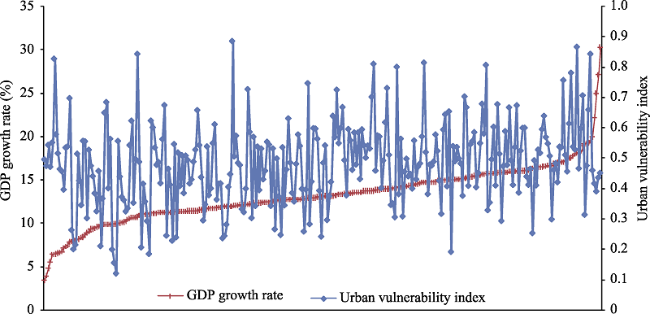
Figure 11 Relationships between urban vulnerability and economic growth in China

5 Conclusions

China is at a key historical stage of accelerating urbanization and improving the developmental quality of urbanization. Because the population is increasingly concentrated in cities and various “chronic urban diseases” are entering a saltation and high-incidence period, research on comprehensively measuring and assessing urban vulnerability is of great realistic significance. Such research is not only an important scientific tool to explore harmonious coexistence in the human-environment system but also meets the requirement for improving the developmental quality of urbanization against a new background of urbanization development.
(1) Urban vulnerability is a type of “chronic urban disease.” With the passage of time, the chronic deposition effect will be amplified to form a “cumulative” effect and a cumulative magnifying effect. Once this chronic cumulative and amplifying process leads to the vulnerability exceeding a certain threshold level, the city will be separated from sustainable development conditions, resulting in a gradual increase in vulnerability, which can be instantly amplified when “catalyzed” by external interfering factors, leading to an accelerated magnifying effect and even a saltation effect. Once a “critical stage” has been entered, if no action is taken to reverse the situation, this “chronic urban disease” can cause a crash of the entire urban system. The concept of “urban vulnerability” consists of urban resource vulnerability, urban eco-environmental vulnerability, urban economic vulnerability, and urban social vulnerability.
(2) This study constructed a comprehensive assessment system of urban vulnerability. Based on the existing research, we proposed a concept of urban vulnerability from the perspective of sustainable development based on the theory of coupled resources of environmental, economic, and social systems. Furthermore, a comprehensive measurement and assessment model of urban vulnerability was established.
(3) China’s urban vulnerability demonstrates a remarkable “grade-difference”-based heterogeneous characteristic, and overall, China’s cities have moderate vulnerability. All the components of resource vulnerability—eco-environmental vulnerability, economic vulnerability, and social vulnerability—demonstrate significant interregional differences. In terms of urban vulnerability differences, urban vulnerability in China was divided into five grades (lower vulnerability, low vulnerability, moderate vulnerability, high vulnerability, and higher vulnerability) based on their natural breaking points.
(4) China’s urban vulnerability demonstrates a remarkable spatial heterogeneity, showing a pattern of “gradient distribution” and “clustered distribution.” Urban vulnerability in Eastern China is significantly higher than in Western China, and areas with concentrated cities are significantly less vulnerable than other areas. Both urban overall vulnerability and subsystem vulnerabilities (i.e., resource vulnerability, eco-environmental vulnerability, and economic vulnerability, etc.) demonstrate an uneven distribution pattern with an increasing trend from the eastern coastal area to the northwestern inland area.
(5) Urban vulnerability has a corresponding relationship with city size and urban functions. Larger cities have a relatively lower vulnerability, resource-based cities have a higher vulnerability than comprehensive cities, and cities with a higher functional comprehensiveness have relatively lower vulnerability. Therefore, it is necessary to actively guide urban development and to formulate scientific policies for reasonable control of the urban developmental scale. In addition, multiplicity and comprehensiveness of urban functions should be emphasized; in particular, vulnerability mitigation for resource-based cities can be achieved only after transformation.
(6) No notable relationship between urban economic growth rate and vulnerability was observed. Cities with high economic growth do not necessarily have a low UVI. Thus, it is unreasonable to determine a city’s vulnerability level based on its economic growth rate.
(7) The purpose of this study was to address questions about how to scientifically measure overall urban vulnerability and how to cope with and regulate urban vulnerability. We attempted to explore methods and countermeasures for determining and reducing urban vulnerability through the establishment of a comprehensive index model. However, due to the limited number of studies on overall urban vulnerability and the difficulties pertaining to the acquisition of statistical data and information, we accomplished only a static horizontal comparison of urban vulnerability among China’s cities at the prefectural level and above. The dynamic vertical evolving process of urban vulnerability will be investigated in another study. Future research will focus on coping and regulatory control strategies related to urban vulnerability.

The authors have declared that no competing interests exist.

1
Abbas EL-Zein, Fahim N T, 2015. Assessment of vulnerability to climate change using a multi-criteria outranking approach with application to heat stress in Sydney. Ecological Indicators, 48(8): 207-217.

2
Adger W N, Brooks N, Bentham G, Agnew, Eriksen S, 2004. New Indicators of Vulnerability and Adaptive Capacity. Norwich: Tyndall Centre for Climate Change Research (Technical Report No.7).There is an increasing need to develop indicators of vulnerability and of adaptive capacity both to determine the robustness of response strategies over time and to understand better the underlying processes. The climate change policy process has increasingly focussed on the potential for adaptation. National level indicators of vulnerability or adaptive capacity directed towards the allocation of resources to support financial mechanisms of the UNFCCC, for example, will only find acceptance if based on agreed criteria that are transparent and robust. In this project we find that it is possible to compare the vulnerability of people and places across time and space at different scales. It is less meaningful to aggregate vulnerability across scales since the processes that cause vulnerability are different at each scale. We have explored issues of aggregation and construction of indices, weighting of indicators, and the efficacy of these to explain observed vulnerability to weather-related natural disasters. We are now in a better position to identify robust and transparent indicator sets. We find that national level adaptive capacity is dependent on social infrastructure and the accountability of institutions more than on the level of economic activity.

3
Adger W N, 2006. Vulnerability.Global Environmental Change, 16(3): 268-281.This paper reviews research traditions of vulnerability to environmental change and the challenges for present vulnerability research in integrating with the domains of resilience and adaptation. Vulnerability is the state of susceptibility to harm from exposure to stresses associated with environmental and social change and from the absence of capacity to adapt. Antecedent traditions include theories of vulnerability as entitlement failure and theories of hazard. Each of these areas has contributed to present formulations of vulnerability to environmental change as a characteristic of social-ecological systems linked to resilience. Research on vulnerability to the impacts of climate change spans all the antecedent and successor traditions. The challenges for vulnerability research are to develop robust and credible measures, to incorporate diverse methods that include perceptions of risk and vulnerability, and to incorporate governance research on the mechanisms that mediate vulnerability and promote adaptive action and resilience. These challenges are common to the domains of vulnerability, adaptation and resilience and form common ground for consilience and integration.

DOI

4
Adrianto L, Matsuda Y, 2002. Developing economic vulnerability indices of environmental disasters in small island regions.Environmental Impact Assessment Review, 22: 393-414.lt;h2 class="secHeading" id="section_abstract">Abstract</h2><p id="">We apply the gross island products (GIP) approach to assess the economic vulnerability of islands region to environmental disasters. In this study, two types of environmental disasters, sea level rise and natural disasters (typhoon, heavy rain and others), are identified and assessed.</p><p id="">By using the case of Amami Islands of Japan, the results show that the economic loss related to environmental disasters is relatively small, ranging from 0.17% to 2.27% of the GIP. The results of vulnerability analysis indicate that, in terms of GIP-based value, Kikaijima is the most vulnerable island with the composite vulnerability index (CVI) of 0.737. However, in terms of per capita-based value, Okinoerabujima has the highest vulnerability with CVI of 0.910.</p><p id="">We also found that these islands have relatively high income per capita, which may convey the impression of their strong economy (high resilience). However, the economies of such islands are highly exposed to the impacts of environmental disasters.</p>

DOI

5
Birkmann J, 2007. Risk and vulnerability indicators at different scales: applicability, usefulness and policy implications.Environmental Hazards, 7(1): 20-31.This paper outlines selected approaches to measuring risk and vulnerability to hazards of natural origin using indicators and indices. It discusses their applicability, usefulness and policy implications. Indicators and indices have been developed on different scales and for different purposes. The paper will briefly introduce three global approaches to disaster-risk identification and will juxtapose them with one local approach in order to examine the differences concerning the functions and the purpose of the assessment as well as their impact for policy development. In contrast to an earlier comparative analysis of the three global disaster-risk indicator programmes by Mark Pelling in 2004, which focused primarily on the methodologies used, this paper places more emphasis on aspects of applicability and policy implications and outlines challenges and limitations of the different approaches. Since the assessment and mapping of human vulnerability is less developed than hazard assessment work [Pelling M., 2004. Visions of Risk: A Review of International Indicators of Disaster Risk and its Management. UNDP ureau for Crisis Prevention and Recovery (BRCP), Geneva], this paper focuses in greater depth on how the approaches capture vulnerability. Conclusions will be formulated on how to further enhance vulnerability identification, particularly at the sub-national level.

DOI

6
Burton I, Kates R W, White G F, 1978. The Environment as Hazard. New York: Oxford University Press.

7
Cai Haisheng, Liu Musheng, Chen Meiqiuet al., 2009. Dynamic evaluation of ecological frangibility of Jiangxi Province based on GIS.Bulletin of Soil and Water Conservation, 29(5): 190-196. (in Chinese)Dynamic evaluation of ecological frangibility is not only important to understand,preserve,and improve ecological environment,but also essential to promote the harmony between man and nature.The characteristics of ecological environment frangibility in Jiangxi Province are analyzed.It is necessary to combine potential frangibility,intimidate frangibility,and realism frangibility together for the dynamic evaluation of ecological frangibility.The method and step of dynamic evaluation of ecological frangibility in Jiangxi Province are then presented.The analysis indicates that the eco-environmental frangibility in the province tends to relaxation.By comparing 1985 with 2000,the dynamic change of ecological frangibility is from high frangibility to low frangibility and the total area is 102 820.49 km2,which accounts to about 61.61% of the total area of Jiangxi Province.At the same time,the evolution process and developing trend of ecological frangibility are analyzed and the division of ecological frangibility and the management of the fragile ecological environment are discussed.

8
Chambers R, 1989. Editorial introduction: Vulnerability, coping and policy.Institute of Development Studies Bulletin, 20(2): 1-7.First page of article

DOI

9
Chan K W, 2007. Misconceptions and complexities in the study of China’s cities: Definitions, statistics, and implications.Eurasian Geography and Economics, 48: 383-412.A noted American authority on urbanization and the household registration system in China reviews and clarifies factors leading to misunderstanding and misconceptions regarding the number of inhabitants of China's major cities. Principal sources of confusion linked to reliance on official statistical sources are the multi-layered meanings of the term "city" and, consequently, simultaneous publication and use of a multitude of official population statistics for the country's "cities." Other complicating factors analyzed by the author include the effects of the Chinese (household registration) system and the rapid rate of urban growth and change over the last three decades. Systematic population and per capita GDP data for the years 2000 and 2005, all based on the multiple boundaries and systems for five major cities (Beijing, Shanghai, Chongqing, Guangzhou, and Shenzhen), are collected to illustrate both the countrywide situation and specific cases. Also included is a critique of several studies and popular accounts of Chinese cities to highlight misstatements and areas of misunderstanding based on inappropriate use of statistical data. , Classification Numbers: O18, O53, P20, R12. 2 figures, 6 tables, 130 references.

DOI

10
Chinese Architecture Bookstore LLC, 2008. National Urban Planning Norms. Beijing: China Building Industry Press. (in Chinese)

11
Cutter S L, 1996. Vulnerability to environmental hazards.Progress in Human Geography, 20(4): 529-539.

12
Cutter S L, Boruff B J, Shirley W L, 2003. Social vulnerability to environmental hazards.Social Science Quarterly, 84(2): 242-261.County-level socioeconomic and demographic data were used to construct an index of social vulnerability to environmental hazards, called the Social Vulnerability Index (SoVI) for the United States based on 1990 data. Copyright (c) 2003 by the Southwestern Social Science Association.

DOI

13
Duan Zhe, 2005. Regional sustainable development evaluation index system and comprehensive evaluation.Technoeconomics & Management Research, (3): 27-28. (in Chinese)

14
Fang Chuanglin, 2000. The Regional Development Planning. Beijing: Science Press. (in Chinese)

15
Fang Chuanglin, 2009. Issues of resources and environment protection in China’s rapid urbanization process and suggestions on countermeasures.Bulletin of Chinese Academy of Sciences, (5): 468-474. (in Chinese)

16
Fang Chuanglin, Liu Xiaoli, Lin Xueqin, 2008. Stages correction and regularity analysis of urbanization course of China.Arid Land Geography, 31(4): 512-523. (in Chinese)

17
Fang Chuanglin, Wang Deli, 2011. Comprehensive measures and improvement of Chinese urbanization development quality.Geographical Research, 30(11): 1931-1946. (in Chinese)Urbanization development quality(UDQ) is the integrity of economic urbanization quality,social urbanization quality and spatial urbanization quality. The improvement of urbanization development quality is the key to expedite and facilitate the sound development of urbanization process in China. With the help of quadrant graph,through the analysis of the interactive coordination relation between urbanization quality,speed and urbanization level,the paper proposes 3D index ball and discrimination standard value of comprehensive measures of urbanization development quality,which is composed of three categories of indexes and 12 detailed indexes. By introducing Atkinson model,the paper constructs the sub-element measure model and segmental measure model of urbanization development quality,and further makes an overall evaluation on the characteristic of China urbanization development quality and its spatial differentiation. Studies show that during 1980-2008,China's urbanization development quality reached a medium level generally,and was improving slowly. However,the speed of quality improvement is lower than that of speed improvement. The classified urbanization quality presents the stance of economic urbanization quality social urbanization quality spatial urbanization quality;provincial urbanization development quality improves in varying degrees throughout China and exhibits the spatial and spatiotemporal difference of "inland→coastal area→inland→coastal area→ improvement in general",thus urbanization quality in the east is higher than that in the middle,and that in the middle is higher than that in the west. There is no correspondent relation between urbanization development quality and city scale. It is not true that the bigger the city is,the better the urbanization quality is. The result shows that population urbanization level does not reflect the quality of urbanization development.

DOI

18
Fang Xiuqi, Yin Peihong, 2007. Review on the three key concepts of resilience, vulnerability and adaptation in the research of global environmental change.Progress in Geography, 26(5): 11-22. (in Chinese)<p>Efforts to improve the knowledge on the human dimensions of global environmental change and ensure relevance to society require periodical assessment of the conceptual frameworks used in the study of these complex issues. As one of the four cross- cutting themes of IHDP, resilience, vulnerability and adaptation are three key concepts in the research of the Human Dimensions of Global Environmental Change. However, these concepts are widely used in many fields, such as, economy, engineering, psychology and anthropology. For different research traditions these terms are used in different, sometimes incompatible, ways. In order to clarify the three key concepts, the Scientific Committee of IHDP organized a workshop in February 2005. A series of articles that resulted from the IHDP workshop were published on the journal of Global Environmental Change Issue No. 16 2006. Based on the above articles and the researches of UNU, this paper reviews research traditions of resilience, vulnerability and adaptation respectively, with focus on the current researches on the conceptual relations among these core concepts as cross- cutting themes in the field of global environmental change and disaster riskreduction.</p>

DOI

19
Grasso M, Moneo M, Arena M, 2014. Assessing social vulnerability to climate change in Samoa.Regional Environmental Change, 14: 1329-1341.Climate change severely impacts on the natural and socio-economic systems of the Pacific Islands. Samoa, a small insular state of the region, is characterized by widespread awareness of climate change reflected by its leading international role. This also makes Samoa a potentially exemplary reference for the Pacific Islands. Against this backdrop, the overall aim of this article is to investigate the notion of social vulnerability and measure its dimensions in Samoa through a specific index: the Samoa Social Vulnerability Index (SSVI). The SSVI may yield better understanding of the characteristics and dynamics of social vulnerability, as well as information for fostering adaptation strategies in Samoa and in the Pacific Islands. In particular, the article first outlines the major vulnerabilities to climate change in Samoa and then analyses the composite notion of social vulnerability. On this basis, the article methodologically specifies, designs and constructs the SSVI. Afterwards, it uses such index for measuring the dimensions of social vulnerability in Samoa districts. Finally, some considerations are made concerning the policy relevance of the SSVI and its potential regional role.

DOI

20
Holling C S, 2001. Understanding the complexity of economic, ecological, and social systems.Ecosystems, 4(5): 390-405.<a name="Abs1"></a><div class="AbstractPara"> <div class="">Hierarchies and adaptive cycles comprise the basis of ecosystems and social-ecological systems across scales. Together they form a panarchy. The panarchy describes how a healthy system can invent and experiment, benefiting from inventions that create opportunity while being kept safe from those that destabilize because of their nature or excessive exuberance. Each level is allowed to operate at its own pace, protected from above by slower, larger levels but invigorated from below by faster, smaller cycles of innovation. The whole panarchy is therefore both creative and conserving. The interactions between cycles in a panarchy combine learning with continuity. An analysis of this process helps to clarify the meaning of &#8220;sustainable development.&#8221; Sustainability is the capacity to create, test, and maintain adaptive capability. Development is the process of creating, testing, and maintaining opportunity. The phrase that combines the two, &#8220;sustainable development,&#8221; thus refers to the goal of fostering adaptive capabilities and creating opportunities. It is therefore not an oxymoron but a term that describes a logical partnership.

DOI

21
Huang Li, Shen Lianfeng, Wu Mingzuo, 2006.Analysis and assessment of the eco-environment frangibility of Henan Province.Henan Science, 24(4): 596-599. (in Chinese)Region's eco-environment frangibility shows its ability to resistant disturbance.A health eco-environment is the premises of sustainable development of a region.This paper analyzed and calculated the eco-environment frangibility of different region in Henan province,giving some advices to promote the eco-environment.The utilizing measurement was also put forward for a reference for corresponding department.

22
IMF, 2007. World Economic Outlook Database [DB/OL]. .

23
Janssen M A, 2007. An update on the scholarly networks on resilience, vulnerability, and adaptation within the human dimensions of global environmental change.Ecology and Society, 12(2): 9.

24
Janssena M A, Schoon M L, Ke Wet al., 2006. Scholarly networks on resilience, vulnerability and adaptation within the human dimensions of global environmental change.Global Environmental Change, 16(3): 240-252.

25
Rosenthal J K, Kinney P L, Metzger K B, 2014. Intra-urban vulnerability to heat-related mortality in New York City, 1997-2006.Health & Place, 30: 45-60.The health impacts of exposure to summertime heat are a significant problem in New York City (NYC) and for many cities and are expected to increase with a warming climate. Most studies on heat-related mortality have examined risk factors at the municipal or regional scale and may have missed the intra-urban variation of vulnerability that might inform prevention strategies. We evaluated whether place-based characteristics (socioeconomic/demographic and health factors, as well as the built and biophysical environment) may be associated with greater risk of heat-related mortality for seniors during heat events in NYC. As a measure of relative vulnerability to heat, we used the natural cause mortality rate ratio among those aged 65 and over (MRR 65+ ), comparing extremely hot days (maximum heat index 10002°F+) to all warm season days, across 1997–2006 for NYC’s 59 Community Districts and 42 United Hospital Fund neighborhoods. Significant positive associations were found between the MRR 65+ and neighborhood-level characteristics: poverty, poor housing conditions, lower rates of access to air-conditioning, impervious land cover, surface temperatures aggregated to the area-level, and seniors’ hypertension. Percent Black/African American and household poverty were strong negative predictors of seniors’ air conditioning access in multivariate regression analysis.

DOI PMID

26
Kelly P M, Adger W N, 2000. Theory and practice in assessing vulnerability to climate change and facilitating adaptation.Climatic Change, 47(4): 325-352.<a name="Abs1"></a>We discuss approaches to the assessment of vulnerability to climatevariability and change andattempt to clarify the relationship between the concepts of vulnerability andadaptation. In searchof a robust, policy-relevant framework, we define vulnerability in terms ofthe capacity ofindividuals and social groups to respond to, that is, to cope with, recoverfrom or adapt to, anyexternal stress placed on their livelihoods and well-being. The approach thatwe develop placesthe social and economic well-being of society at the centre of the analysis,focussing on thesocio-economic and institutional constraints that limit the capacity torespond. From thisperspective, the vulnerability or security of any group is determined byresource availability andby the entitlement of individuals and groups to call on these resources. Weillustrate theapplication of this approach through the results of field research in coastalVietnam, highlightingshifting patterns of vulnerability to tropical storm impacts at the household-and community-levelin response to the current process of economic renovation and drawingconclusions concerningmeans of supporting the adaptive response to climate stress. Four prioritiesfor action areidentified that would improve the situation of the most exposed members ofmany communities:poverty reduction; risk-spreading through income diversification; respectingcommon propertymanagement rights; and promoting collective security. A sustainable response,we argue, mustalso address the underlying causes of social vulnerability, including theinequitable distributionof resources.

DOI

27
Koh J, 2011. Local Vulnerability assessment of climate change and its implications: The case of Gyeonggi-Do, Korea.Local Sustainability, 1: 411-427.This paper provides a set of vulnerability indicators appropriate for municipalities and gives the results of their application to 31 municipalities in Gyeonggi-Do, the largest provincial government in Korea. The vulnerability assessment aims to identify relative vulnerability across municipalities. Expert consultations and the Analytic Hierarchy Process (AHP) was used to derive indicators and determine their weightings. The definition of vulnerability developed by the IPCC was used, which consists of three components - exposure, sensitivity and adaptive capacity. The vulnerability indices are composed of 3 categories, 11 sectors, and 35 indicators. The results of the AHP reveal that the weighting of adaptive capacity is highest, followed by sensitivity and then climatic stimuli in order of significance. The most vulnerable areas include Yeoju, Yangpyeong, Gimpo, Pocheon, Yeoncheon, and Hanam, which have higher sensitivity and lower adaptive capacity to climate change. The analysis shows that vulnerability indices are correlated negatively with economic capacity and positively with natural hazard damages. The results of the vulnerability assessment indicate the need for a differentiated approach to adaptation based on the local characteristics of the sectors. The study should be considered a first step in understanding vulnerability to climate change. A regional climate model and data collection system for vulnerability assessment should be developed. The indicators could be replicated for other local governments.

DOI

28
Li He, Zhang Pingyu, 2011. Research progress and prospective applications of vulnerability approach under global change.Progress in Geography, 30(7): 920-929. (in Chinese)Based on the analysis of existing literatures on the theme of vulnerability, this paper reviews the evolution and progress of vulnerability research, and analyzes the challenges facing present vulnerability research and the scientific implications of vulnerability approach in coupled human-environment system research. As a new research perspective in the arena of global environmental change and sustainability science, vulnerability approach has attracted extensive attention from scholars in geography and related disciplines, and is moving toward inter-disciplinary and comprehensive studies. Great progresses has been made in vulnerability conception, analytical frameworks, assessment methods and so on, but there is still lack of consummate vulnerability theoretical system and methodology on the basis of merging and crossing of different disciplines. With more and more attentions being paid to the vulnerability of coupled human-environment system under the interactions between human and natural factors, vulnerability approach has significant application value in analyzing the nested scale of human-environment interactions, promoting the integration study of key factors and processes, advancing the merging and crossing of related disciplines, and enhancing the decision support capacity of coupled human-environment system studies.

DOI

29
Liu Yi, Huang Jianyi, Ma Li, 2010. The assessment of regional vulnerability to natural disasters in China based on DEA model.Geographical Research, 29(7): 1153-1162. (in Chinese)As one of world's worst natural disasters inflicting countries,China is frequently suffered by the ravages of natural disasters,which have had a negative effect on people's lives and caused huge economic losses annually.Presently,the study of vulnerability has played an important part in the research on natural disasters,which emphasizes the relationship between human society and the effects of disasters,and measurement of the capability to overcome natural disasters in different regions with distinctive economy.The purpose of the vulnerability analysis is to identify appropriate actions that can be taken to reduce the potential natural disaster damages,so it is of great practical significance to study China's vulnerability to natural disasters.Traditional methods for vulnerability analysis calculate sub-indices based on disaster frequency,loss,the economic impact and the population of each region,and then use the sub-indices to obtain a composite index for regional vulnerability.However those methods has a shortcoming,which are sensitive to weight set for sub-indices and the selection of the vulnerability functions.As a result,the analytic results are less convincing,so a data envelopment analysis(DEA)-based model for analysis of regional vulnerability to natural disasters is presented here to improve the traditional methods,and data from 2001 to 2008 of China are analyzed.Under the framework of the regional natural disaster system,this paper firstly constructs an input-output DEA model for the regional disasters system from three aspects,including the danger of regional disasters,the exposure of regional soc-economy and the regional natural disaster losses,using the efficiency calculated by the DEA to imitate the regional vulnerability to natural disasters,and then it makes an analysis of the differentiation of the regional vulnerability to natural disasters.The result shows that the overall level of vulnerability to natural disasters of China is high,and the geographical pattern for vulnerability is Western Region Central Region Eastern Region.In addition,there is a negative correlation between the level of regional vulnerability and regional economic level,that is,the more economically developed regions has lower regional vulnerability.

DOI

30
Liu Yanhua, Li Xiubin, 2010. Fragile Ecological Environment and Sustainable Development. Beijing: The Commercial Press. (in Chinese)

31
Liverman D M, 1990. Vulnerability to global environmental change. In: Kasperson, R E, Dow, D G, Kasperson J X (eds.), Understanding Global Environmental Change: The Contributions of Risk Analysis and Management. Worchester: Clark University.

32
Liverman D M, 2008. Assessing impacts, adaptation and vulnerability: Reflections on the Working Group Ii Report of the Intergovernmental Panel on Climate Change.Global Environmental Change, 18: 4-7.

33
McCarthy J J, Canziani O F, Leary N Aet al., 2001. Climate Change 2001: Impacts, Adaptation, Vulnerability. Cambridge: Cambridge University Press.

34
Muller A, Reiter J, Weiland U, 2011. Assessment of urban vulnerability towards floods using an indicator-based approach: A case study for Santiago de Chile.Natural Hazards & Earth System Sciences & Discussions, 11(8): 2107-2123.Regularly occurring flood events do have a history in Santiago de Chile, the capital city of Chile and study area for this research. The analysis of flood events, the resulting damage and its causes are crucial prerequisites for the development of risk prevention measures. The goal of this research is to empirically investigate the vulnerability towards floods in Santiago de Chile as one component of flood risk. The analysis and assessment of vulnerability is based on the application of a multi-scale (individual, household, municipal level) set of indicators and the use of a broad range of data. The case-specific set of indicators developed in this study shows the relevant variables and their interrelations influencing the flood vulnerability in the study area. It provides a decision support tool for stakeholders and allows for monitoring and evaluating changes over time. The paper outlines how GIS, census, and remote sensing data as well as household surveys and expert interviews are used as an information base for the derivation of a vulnerability map for two municipalities located in the eastern part of Santiago de Chile. The generation of vulnerability maps representing the two different perspectives of local decision makers (experts) and affected households is exemplified and discussed using the developed methodology.

DOI

35
Newell B, Crumley C L, Hassan N, 2005. A conceptual template for integrative human-environment research.Global Environmental Change, 15: 299-307.Knowledge integration, the blending of concepts from two or more disciplines to create innovative new worldviews, is a key process in attempts to increase the sustainability of human activities on Earth. In this paper, we describe a ‘conceptual template’ that can be used to catalyse this process. The template comprises (a) a list of high-level concepts that capture the essential aspects of any significant human–environment problem, plus (b) broad lists of low-level basic concepts drawn from a range of disciplines. Our high-level concepts, which we call ‘conceptual clusters’, are labelled Dynamics & System , Organisation & Scale , Controlling Models , Management & Policy , Adaptation & Learning , and History . Many of the clustered, lower-level concepts are synonyms and thus provide possible connections between disciplines—for this reason we call them ‘nexus concepts’. We suggest that a conceptual template like that presented here can provide strong support to the initial phases of integrative research programs.

DOI

36
Nhuan M T, Hien L T T, Ha N T Het al., 2014. An integrated and quantitative vulnerability assessment for proactive hazard response and sustainability: A case study on the Chan May-Lang Co Gulf area, Central Vietnam.Sustainability Science, 9: 399-409.

37
Oluoko-Odingo AA, 2011. Vulnerability and adaptation to food insecurity and poverty in Kenya.Annals of the Association of American Geographers, 101(1): 1-20.Poor and hungry populations are less resilient to stress and disasters and rely a great deal on the natural environment, as they lack the capacity and the resources required to recover from disasters. The current projected climatic change is likely to have a great impact among food-insecure and poor populations due to the projected effects on food availability, water resources, and health, as well as accessibility to infrastructural services, which is minimal, if not lacking completely, among vulnerable and poor households. This article discusses livelihoods and ways of reducing vulnerability to climate change-related disasters to increase adaptation to future impacts of climate change in Nyando and similar medium potential areas of Kenya, where major impacts are expected. The study used both primary and secondary data; used various sampling techniques; and employed analytical techniques such as multiple correlation and regression analysis, stepwise multiple regression analysis, principal components analysis, factor analysis, and cluster analysis. The findings of this research revealed that in terms of food security, poverty was the main contributor to food insecurity, although climate complicated the issue, with the health of the farmer and her experience emerging as the most important in the fight against food insecurity among smallholder farmers. As part of the conclusion, it was recommended that to deal with food insecurity and poverty, policies must emphasize increased food production using suitable environmental conservation techniques to adapt to climate change while also encouraging sustainable livelihood systems.

DOI

38
Piegorsch W W, Cutter S L, Hardisty F, 2007. Benchmark analysis for quantifying urban vulnerability to terrorist incidents.Risk Analysis, 27(6): 1411-1425.We describe a quantitative methodology to characterize the vulnerability of U.S. urban centers to terrorist attack, using a place-based vulnerability index and a database of terrorist incidents and related human casualties. Via generalized linear statistical models, we study the relationships between vulnerability and terrorist events, and find that our place-based vulnerability metric significantly describes both terrorist incidence and occurrence of human casualties from terrorist events in these urban centers. We also introduce benchmark analytic technologies from applications in toxicological risk assessment to this social risk/vulnerability paradigm, and use these to distinguish levels of high and low urban vulnerability to terrorism. It is seen that the benchmark approach translates quite flexibly from its biological roots to this social scientific archetype.

DOI PMID

39
Renaud F, Perez R, 2010. Climate change vulnerability and adaptation assessments.Sustainability Science, 5: 155-157.

DOI

40
Roberts M G, Yang Guoan, 2003.The international progress of sustainable development research: A comparison of vulnerability analysis and the sustainable livelihoods approach.Progress in Geography, 22(1): 12-21.

41
Seraj S M, Badruzzaman A B M, 1997.Potential hazards and vulnerability in urban development of Dhaka city, Bangladesh. Engineering Geology and the Environment, 1-3: 1487-1492.

42
Siagian T H, Purhadi P, Suhartono S, Ritonga H, 2014. Social vulnerability to natural hazards in Indonesia: Driving factors and policy implications. Natural Hazards, 70(2): 1603-1617.Indonesia is located in the Pacific Ring of Fire and situated at the joining point of four major world tectonic plates. Regions of Indonesia are highly prone to various natural hazards such as earthquakes, tsunamis and volcanic eruptions. Some recent major natural hazard events are the 2004 tsunami in Aceh and Nias and the 2010 Mount Merapi volcanic eruptions in Central Java. In parallel with advancement in knowledge of the existing hazards, the importance of social aspects of vulnerability in mitigating natural hazards has been acknowledged by the Indonesian government. However, to date, there is no institutionalized effort for assessing social vulnerability to natural hazards that would cover all the districts of Indonesia. Accordingly, no comprehensive profile of social vulnerability is available as basis information for developing strategies to prevent larger risk and losses and reduce vulnerability of communities in Indonesia. Only a few studies have been conducted in Indonesia on this field. This study attempts to fill this gap by quantifying the social vulnerability of Indonesian districts to natural hazards, determining its driving factors and mapping its variations. The social vulnerability index (SoVI) approach is utilized in this study. Three main driving factors affecting social vulnerability in Indonesia are found: ‘socioeconomic status and infrastructure,’ ‘gender, age and population growth’ and ‘family structure.’ The combination of SoVI with thematic map utilizing ArcView GIS can be used to identify districts with relative high social vulnerability level. The results can support the prevention, mitigation, preparedness, response and recovery programs of the impacts of natural hazards in Indonesia. Copyright Springer Science+Business Media Dordrecht 2014

DOI

43
Su Fei, Zhang Pingyu, Li He, 2008.Vulnerability assessment of coal-mining cities’ economic systems in China.Geographical Research, 27(4): 907-916. (in Chinese)Coal-mining cities are confronted with a lot of serious social,economic and eco-environmental problems.Though extensive research on coal-mining cities are from many relevant disciplines,few are from the coupled human-environment system.There are obvious socio-economic and eco-environmental vulnerability characteristics on coal-mining cities.Vulnerability analysis framework in sustainability science has many properties of multi-scale,multi-element,multi-flow and multi-cycle,which presents a new research paradigm for coal-mining city.Based on a detailed discussion about the conception of economic system vulnerability(ESV),the essay establishes an economic vulnerability assessment model of coal-mining cities from the aspects of exposure-sensitive to and response capacity for the gradual depletion of the regional minable coal resources.The conditions of minable resources,industrial and employment structures,which determine their exposure-sensitivity to the depletion of regional minable coal resources,create an exposure-sensitivity index.From the angles of urban economic strength,industrial state,regional and infrastructure conditions,the degree to open up and economic conditions of urban and rural residents,it constructs a coping capacity index.According to the model,the economic system vulnerability of 25 typical coal-mining cities is evaluated and divided into three categories by principal components analysis.The results show that economic system vulnerability of coal-mining cities differs significantly in different development stages,city sizes and regions.The ESV of old coal-mining cities is generally high;the ESV of middle-aged is almost in 3 vulnerability grades,especially concentrated on medium grade;the ESV of young is low.The ESV of coal-mining cities presents obvious regional differences,including north to south and east to west.The high economic system vulnerability of coal-mining cities mainly concentrates on Northeast China.The average score of ESV shows a trend of NortheastCentralWestEast.The ESV of southern coal-mining cities is medium,while the northern region is distributed in three grades.The ESV of different size coal-mining cities shows a trend of big citiesmedium-sized citiesmega-citiessmall cities.The study provides some lessons for the vulnerability assessment of other subsystems and human-environment coupled system,and also gives a basis for relevant departments to adopt some policies for economic transformation.

DOI

44
Swift J, 1989. Why are rural people vulnerable to famine?IDS Bulletin, 20(2): 8-15.SUMMARY Vulnerability to famine has been generally explained by reference to failures of production and to failures of exchange, but neither is adequate to explain key aspects of the vulnerability of rural people to famine. Some of these problems are resolved by an analysis of the status and trends in household assets — investments and stocks of food and of value, and claims households and communities can exert on others, including the state. Taken together with production and exchange issues, the analysis points to better policies to reduce vulnerability. Resumé Pourquoi les populations rurales sont-elles plus vulnérables aux famines? La vulnérabilité aux famines a été généralement expliqueé en référence aux échecs dans le domaine de la production et de la distribution, mais aucune de ces explications ne s'est prouvée adéquate lorsque l'on veut expliquer certains aspects de la vulnérabilité des populations rurales aux amines. Certains de ces problèmes sont résolus par une analyse d'une part de la valeur des biens en possession dans les familles d'exploitants agricoles et d'autre part les variations qui existent entre-elles — investissements et stocks de denrées alimentaires et leur valeur, ainsi que les dus, ces familles et leurs communautés sont en droit de réclamer de leurs semblables, y compris l'Etat. Liée aux problèmes de la production et de la distribution, cette analyse offre des mesures plus satisfaisantes afin de réduire cette vulnérabilité. Resumen Causas de la vulnerabilidad de la población rural al hambre La vulnerabilidad al hambre se ha atribuido generalmente a fallas de la producción o del intercambio, aunque ninguna de ellas explica adecuademente sus aspectos claves. Algunos de estos problemas son resueltos por medio de un análisis del estado y la tendencas de las posesiones hogare09as, tales como inversiones y existencias de alimentos y valores, así como de las reivindicaciones hogare09as a la comunidad y al estado. En conjunto con la producción y el intercambio, el análisis conduce hacia mejores políticas para reducir esta vulnerabilidad.

DOI

45
Tian Yaping, Xiang Qingcheng, Wang Ping, 2013. Regional coupled human-natural systems vulnerability and its evaluation indexes.Geographical Research, 32(1): 55-63. (in Chinese)Unclear concept and scale positioning as well as imperfect evaluation system are the main obstacles of vulnerability evaluation.Starting from the concept,factor and scale of the coupled human-natural systems vulnerability,this article made it clear that the evaluation objective is in regional scale and the analysis framework is composed by climate change and system structural elements.Based on expounding the features of the coupled human-natural systems vulnerability,the authors established firstly an evaluation system of the coupled human-natural systems vulnerability,including the three series factor indexes of sensitivity,exposure and the adaptability,and three evaluation levels of background vulnerability,potential vulnerability and realistic vulnerability according to system relations of the three series factor indexes.Secondly,taking the hilly areas in southern China as an example,the authors established an evaluation index system of coupled human-environment interaction systems vulnerability in the erosion-prone region,which includes regional natural disasters such as debris flow,landslide,drought and flood,and which relies on the principles including the scientific principle,dominant factors principle,pertinence principle,applied principle and operability principle.Finally,the authors concluded that:(1) the regional coupled human-environment interaction systems vulnerability concerns with natural disasters under global climate change disturbance;(2) the sensitivity and damageability are the essential attribute of the vulnerability,while the sensitivity,exposure and adaptability are system factors of the vulnerability;(3) the natural disaster frequency can be seen as the location exposure indexes to reflect the space concentricity of disaster occurences,while the real disaster degree,as a reference value,can be provided to verify the results of the vulnerability evaluation indexes screening,index weights determinating,model validation and threshold value analysis.The research has some references for improving the theory and method of the research on regional coupled human-environment interaction systems vulnerability in different regions under the consistent framework.

DOI

46
Urban Social and Economic Survey Team of National Bureau, 2004. China Urban Development Report. Beijing: China Statistics Press. (in Chinese)

47
Usha T, Murthy M V R, Reddy N T, Mishra P, 2012. Tsunami vulnerability assessment in urban areas using numerical model and GIS.Natural Hazards, 60(1): 135-147.Abstract<br/>Natural disasters can neither be predicted nor prevented. Urban areas with a high population density coupled with the construction of man-made structures are subjected to greater levels of risk to life and property in the event of natural hazards. One of the major and densely populated urban areas in the east coast of India is the city of Chennai (Madras), which was severely affected by the 2004 Tsunami, and mitigation efforts were severely dampened due to the non-availability of data on the vulnerability on the Chennai coast to tsunami hazard. Chennai is prone to coastal hazards and hence has hazard maps on its earth-quake prone areas, cyclone prone areas and flood prone areas but no information on areas vulnerable to tsunamis. Hence, mapping has to be done of the areas where the tsunami of December 2004 had directly hit and flooded the coastal areas in Chennai in order to develop tsunami vulnerability map for coastal Chennai. The objective of this study is to develop a GIS-based tsunami vulnerability map for Chennai by using a numerical model of tsunami propagation together with documented observations and field measurements of the evidence left behind by the tsunami in December 2004. World-renowned and the second-longest tourist beach in the world “Marina” present in this region witnessed maximum death toll due to its flat topography, resulting in an inundation of about 300 m landward with high flow velocity of the order of 2 m/s.<br/>

DOI

48
Wang Yan, Fang Chuanglin, 2013. Urban vulnerability: Progress and prospect.Progress in Geography, 32(5): 755-768. (in Chinese)In the process of rapid urbanization, cities are facing more and more conflicts between the use of natural resources and the protection of ecological environment,which hinder the sustainable urban development. As one of the core issues in sustainability studies, vulnerability research has always been a subject that receives extensive attention. In this paper, we discussed the progress of urban vulnerability research, reviewed the concept, classification, analysis framework, dynamic mechanism and evaluation method in the studies of urban vulnerability. Urban vulnerability research addresses mainly two types of vulnerability: internal vulnerability (urban ecology, economy, society, population) and external vulnerability (global climate change and natural disaster). Urban vulnerability analysis frameworks include risk and disaster framework (RH), pressure release framework (PAR), local disaster vulnerability framework, and vulnerability framework under the background of global change. Urban vulnerability assessment methods mainly include comprehensive index method, functional model, set pair analysis, data envelopment analysis, scenario analysis and layer stacking method. Current studies on urban vulnerability still have the following problems: (1) a unified conceptual framework or a comprehensive evaluation index system have not been yet formed; (2) studies on the mechanism and countermeasures are not sufficient; (3) there are very few studies on vulnerabilities of urban coupling system. In the future, efforts need to be made to establish a unified conceptual framework and a comprehensive evaluation system. After constructing a comprehensive evaluation model, it is necessary to choose particular areas for vulnerability assessment. We hope urban vulnerability research can provide the scientific basis for sustainable economic and social development.

DOI

49
Watson R T, Zinyowera M C, Moss R H, 1996. Climate Change 1995: Impacts, Adaptations, and Mitigation of Climate Change. Cambridge: Cambridge University Press.

50
White G F, Haas J E, 1975. Assessment of Research on Natural Hazards. Cambridge: MIT Press.

51
Yang Haijun, Xiao Lingji, Zou Zeqing, 2008. On judgment standard of industrialization stage, the flaw and revision of Hoffman coefficiency: Evidence from Jiangxi & Jiangsu.Collected Essays on Finance and Economics, (2): 7-14. (in Chinese)

52
Ye Yuming, 2001. Approach on China’s urbanization quality. China Soft Science, (7): 27-31. (in Chinese)

53
Yi Lixin, Zhang Xi, Ge Linglinget al., 2014. Analysis of social vulnerability to hazards in China.Environmental Earth Sciences, 71: 3109-3117.To improve natural disaster management, it is important to recognize the variability of the vulnerable populations exposed to hazards and to develop location-based emergency plans accordingly. This paper presents a mathematical model to establish a model of social vulnerability index (SoVI), which includes 12 social variables, and the regional social vulnerability to natural hazards was formulated by them. Taking a city as statistical unit, the variability of vulnerability to natural hazards was explored among the 323 cities based on the SoVI. The results indicate that vulnerability is a location-based regional phenomenon, with the most vulnerable cities being located in the southwest of China and the eastern areas being generally less vulnerable. The results will be helpful for policy makers to formulate disaster management plans, which can be beneficial for people in more vulnerable areas who are responding to, coping with, and recovering from natural disasters.

DOI

54
Zhang Weixi, 2006. A study and assessment on vulnerability of the regional development [D]. Tianjin: Tianjin University. (in Chinese)

55
Zhao Guojie, Zhang Weixi, 2006. A study on vulnerability of the region economy and society-Hebei. Shanghai Economy Research,(1): 65-69, 96. (in Chinese)

56
Zhou Yang, Li Ning, Wu Wenxianget al., 2014. Assessment of provincial social vulnerability to natural disasters in China.Natural Hazards, 71(3): 2165-2186. (in Chinese)Assessment of social vulnerability has been recognized as a critical step to understand natural hazard risks and to enhance effective response capabilities. Although significant achievements have been made in social vulnerability researches, little is know about the comprehensive profile of regional social vulnerability in China. In this study, the social vulnerability to natural hazards was firstly divided into socioeconomic and built environmental vulnerability. Then, using factor analysis, we identified the dominant factors that influence the provincial social vulnerability in China to natural hazards based on the socioeconomic and built environmental variables in 2000 and 2010 and explored the spatial patterns of social vulnerability. The results indicated that the provincial social vulnerability in China showed significant regional differences. The social vulnerability in the southeastern and eastern regions of China was greater than its northern and central parts over the past decade. Economic status, rural (proportion of agricultural population and percentage of workers employed in primary industries), urbanization, and age structure (children) were the dominant driving forces of variations in provincial socioeconomic vulnerability in two studied years, while lifelines and housing age could explain most of changes in built environmental vulnerability in 2000 and 2010. There were no statistically significant correlations between social vulnerability and disaster losses (p > 0.05), indicating the impact of disasters was also related to the intensity of hazards and exposure. Disaster relief funds allocated to each province of China depended more on its disaster severity than the regional integrated social vulnerability over the past decade. These findings would provide a scientific base for the policy making and implementation of disaster prevention and mitigation in China.

DOI

Outlines

/