
Journal of Geographical Sciences >
Water level changes in Polish lakes during 1976-2010
Author: Dariusz WRZESIŃSKI, e-mail: darwrze@amu.edu.pl
*Corresponding author: Mariusz PTAK, e-mail: marp114@wp.pl
Received date: 2015-02-25
Accepted date: 2015-06-09
Online published: 2016-01-25
Copyright
The paper presents the analysis of tendencies in water level changes in 32 lakes in Poland during 1976-2010. Series of monthly, seasonal, and annual precipitation and air temperature for 9 meteorological stations were also studied. The trend analysis for all of the studied series of water levels in lakes showed high spatial and temporal variability. Series of annual water levels in the case of 6 lakes showed statistically significant increasing tendencies, and in 7 lakes, significant decreasing trends. Series of annual amplitudes in the majority of lakes (22) showed a decreasing trend, but they were statistically significant only in three cases. The tendencies for air temperature fluctuations are more statistically significant than precipitation. The key role in determining water level changes is played by local factors, particularly including human economic activity, obscuring the effect of natural factors on water level changes. The paper describes cases of changes in water levels in lakes under anthropopressure related to among others: agricultural irrigations, hydropower infrastructure, water transfers, navigation, or mining.
Dariusz WRZESIŃSKI , *Mariusz PTAK . Water level changes in Polish lakes during 1976-2010[J]. Journal of Geographical Sciences, 2016 , 26(1) : 83 -101 . DOI: 10.1007/s11442-016-1256-5
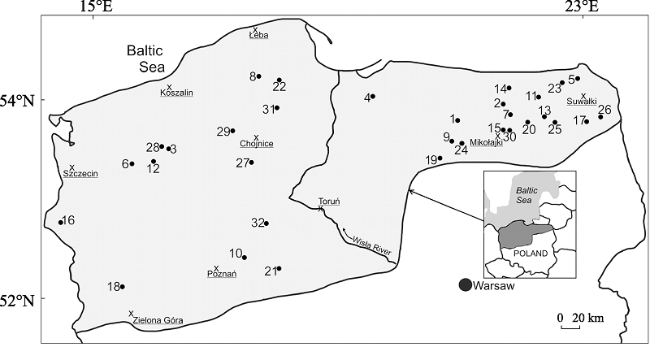
Figure 1 Location of the lakes and meteorological stations |
Table 1 Morphometric data of the studied lakes (numbering in accordance with Figure 1) |
| No | Lake | Area (ha) | Volume (thous m3) | Average depth (m) | Maximum depth (m) |
|---|---|---|---|---|---|
| 1 | Dadaj | 978.0 | 120784.2 | 12.0 | 39.8 |
| 2 | Dejguny | 762.5 | 92617.4 | 12.0 | 45.0 |
| 3 | Drawsko | 1797.5 | 331443.4 | 17.7 | 82.2 |
| 4 | Druzno | 1147.5 | 17352.0 | 1.2 | 2.5 |
| 5 | Hańcza | 291.5 | 120364.1 | 38.7 | 106.1 |
| 6 | Ińsko | 529.0 | 65182 | 11.0 | 41.7 |
| 7 | Jagodne | 872.5 | 82705.2 | 8.7 | 37.4 |
| 8 | Jasień | 575.0 | 48048 | 8.3 | 32.2 |
| 9 | Kalwa | 561.0 | 39468.6 | 7.0 | 31.7 |
| 10 | Lednica | 325.0 | 24397 | 7.0 | 15.1 |
| 11 | Litygajno | 154.5 | 9763.9 | 6.0 | 16.4 |
| 12 | Lubie | 1487.5 | 169880.5 | 11.6 | 46.2 |
| 13 | Łaśmiady | 940.0 | 84607.8 | 9.6 | 43.7 |
| 14 | Mamry | 9851.0 | 1003367.5 | 9.8 | 43.8 |
| 15 | Mikołajskie | 424.0 | 55739.7 | 11.2 | 25.9 |
| 16 | Morzycko | 317.5 | 49826.9 | 14.5 | 60.7 |
| 17 | Necko | 400.0 | 40561.4 | 10.1 | 25.0 |
| 18 | Niesłysz | 526.0 | 34457.6 | 6.9 | 34.7 |
| 19 | Omulew | 504.0 | 22172.7 | 4.3 | 32.5 |
| 20 | Orzysz | 1012.5 | 75326.2 | 6.6 | 36.0 |
| 21 | Powidzkie | 1097.5 | 134776.2 | 11.5 | 46.0 |
| 22 | Raduńskie Górne | 362.5 | 60158.7 | 15.5 | 43.0 |
| 23 | Rospuda Filipowska | 323.5 | 49731.8 | 14.5 | 38.9 |
| 24 | Sasek Wielki | 866.0 | 71194.8 | 8.2 | 38.0 |
| 25 | Selmęt Wielki | 1207.5 | 99463.9 | 7.8 | 21.9 |
| 26 | Serwy | 438.5 | 67181.5 | 14.1 | 41.5 |
| 27 | Sępoleńskie | 157.5 | 7501.6 | 4.8 | 10.9 |
| 28 | Siecino | 740.0 | 104441.7 | 14.1 | 44.2 |
| 29 | Szczytno Wielkie | 565.0 | 51762.5 | 8.0 | 21.4 |
| 30 | Śniardwy | 11487.5 | 660211.8 | 5.8 | 23.4 |
| 31 | Wdzydze | 1417.0 | 220800.0 | 1.2 | 69.5 |
| 32 | Żnińskie Duże | 420.5 | 29492.6 | 6.8 | 11.1 |
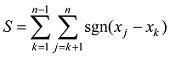
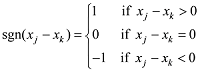
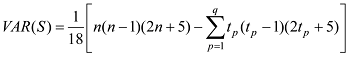
Table 2 Results of the Z Mann-Kendall test of monthly and annual water stages in the year 1976-2010 |
 |
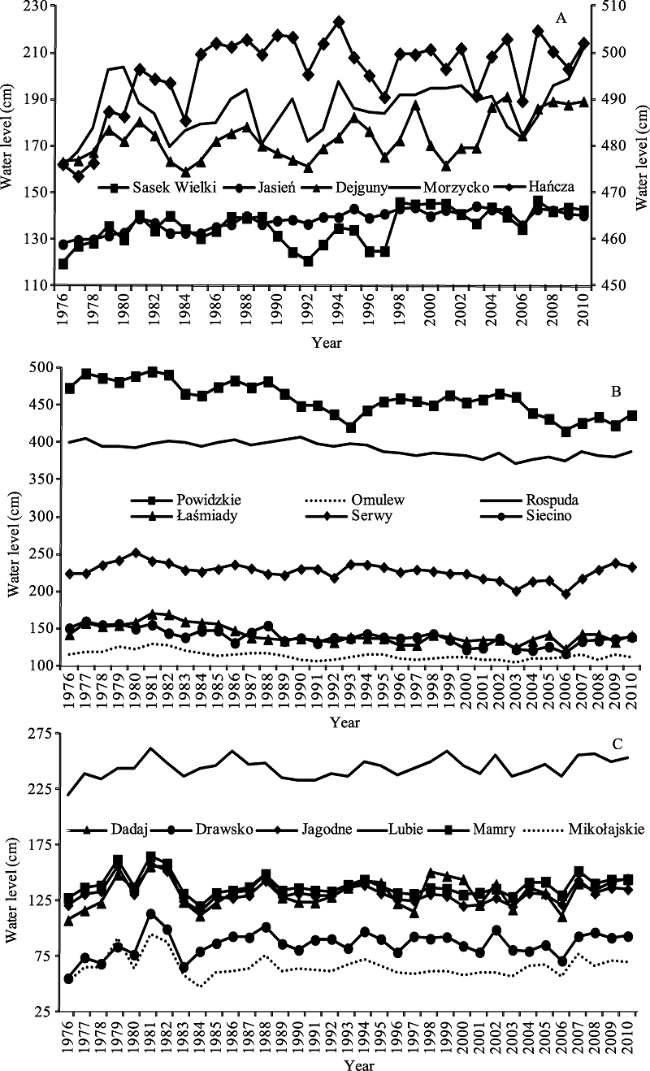
Figure 2 Multiannual course of mean annual water levels in selected lakes in the years 1976-2010 |
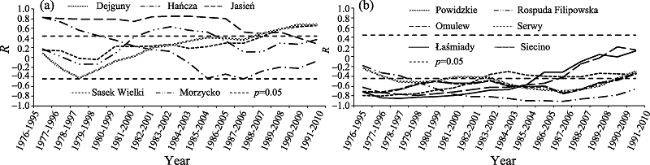
Figure 3 Changes in correlation coefficients of water levels in 20-year terms |
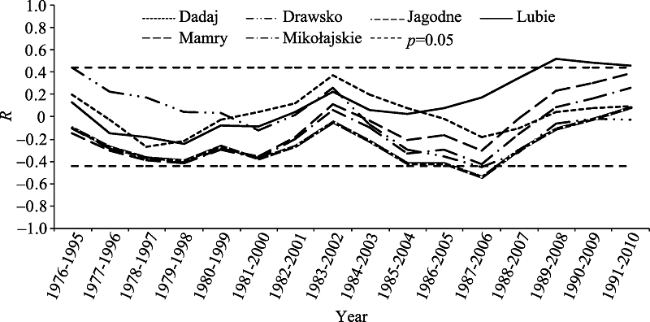
Figure 4 Changes in correlation coefficients of water levels in 20-year terms for selected lakes not showing statistically significant trends in annual water levels |
Table 3 Results of the Z Mann-Kendall test for annual precipitation totals and air temperatures in 1976-2010 |
 |
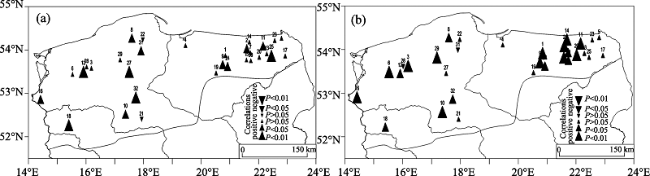
Figure 5 Statistical significance of coefficients of correlation of mean annual water levels in lakes with the annual precipitation total |
Table 4 Coefficients of correlation of water stages in lakes with precipitation amount and air temperature |
 |
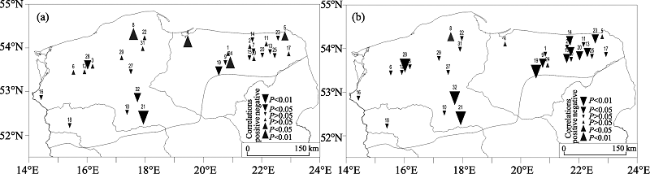
Figure 6 Statistical significance of coefficients of correlation between mean annual water levels in lakes and mean annual air temperature |
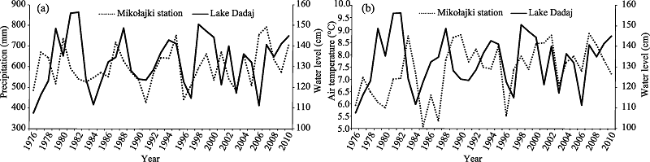
Figure 7 Course of water levels in Lake Dadaj and atmospheric precipitation (a) and air temperature (b) at Mikołajki station in 1976-2010 |
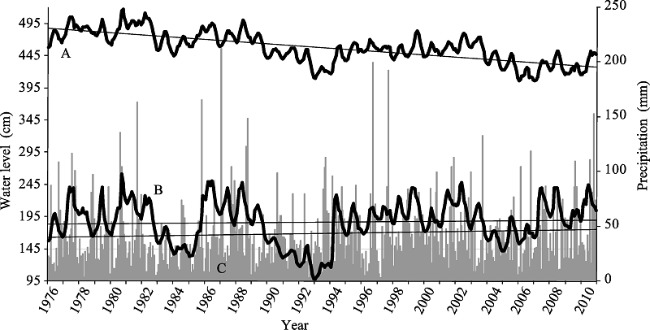
Figure 8 Course of monthly water levels in selected lakes and precipitation in the years 1976-2010 |
The authors have declared that no competing interests exist.
| 1 |
|
| 2 |
|
| 3 |
|
| 4 |
|
| 5 |
|
| 6 |
|
| 7 |
|
| 8 |
|
| 9 |
|
| 10 |
|
| 11 |
|
| 12 |
|
| 13 |
|
| 14 |
|
| 15 |
|
| 16 |
|
| 17 |
|
| 18 |
|
| 19 |
|
| 20 |
|
| 21 |
|
| 22 |
|
| 23 |
|
| 24 |
|
| 25 |
|
| 26 |
|
| 27 |
|
| 28 |
|
| 29 |
|
| 30 |
|
| 31 |
|
| 32 |
|
| 33 |
|
| 34 |
|
| 35 |
|
| 36 |
|
| 37 |
|
| 38 |
|
| 39 |
|
| 40 |
|
| 41 |
|
| 42 |
|
| 43 |
|
| 44 |
|
| 45 |
|
| 46 |
|
| 47 |
|
| 48 |
|
| 49 |
|
| 50 |
|
| 51 |
|
| 52 |
|
| 53 |
|
| 54 |
|
| 55 |
|
| 56 |
|
| 57 |
|
| 58 |
|
| 59 |
|
/
| 〈 |
|
〉 |