Orginal Article

Spatial-temporal variations of lake ice phenology in the Hoh Xil region from 2000 to 2011

  • YAO Xiaojun , 1 ,
  • LI Long 1, 2 ,
  • ZHAO Jun 1 ,
  • SUN Meiping 1, 3 ,
  • LI Jing 1 ,
  • GONG Peng 1 ,
  • AN Lina 1
Expand
  • 1. College of Geography and Environment Sciences, Northwest Normal University, Lanzhou 730070, China
  • 2. Lanzhou Resources & Environment Voc-Tech College, Lanzhou 730021, China
  • 3. State Key Laboratory of Cryosphere Sciences, Cold and Arid Regions Environmental and Engineering Research Institute, CAS, Lanzhou 730000, China

Author: Yao Xiaojun (1980-), PhD and Associate Professor, specialized in the research of GIS and lake evolution. E-mail:

Received date: 2015-09-01

  Accepted date: 2015-10-03

  Online published: 2016-01-25

Supported by

National Natural Science Foundation of China, No.41261016

Scientific Research Project of Higher Learning Institution in Gansu Province, No.2014A-001, No.2013A-018

Copyright

Journal of Geographical Sciences, All Rights Reserved

Abstract

Lake ice phenology, i.e. the timing of freeze-up and break-up and the duration of the ice cover, is regarded as an important indicator of changes in regional climate. Based on the boundary data of lakes, some moderate-high resolution remote sensing datasets including MODIS and Landsat TM/ETM+ images and the meteorological data, the spatial-temporal variations of lake ice phenology in the Hoh Xil region during the period 2000-2011 were analyzed by using RS and GIS technology. And the factors affecting the lake ice phenology were also identified. Some conclusions can be drawn as follows. (1) The time of freeze-up start (FUS) and freeze-up end (FUE) of lake ice appeared in the late October-early November, mid-November - early December, respectively. The duration of lake ice freeze-up was about half a month. The time of break-up start (BUS) and break-up end (BUE) of lake ice were relatively dispersed, and appeared in the early February - early June, early May - early June, respectively. The average ice duration (ID) and the complete ice duration (CID) of lakes were 196 days and 181 days, respectively. (2) The phenology of lake ice in the Hoh Xil region changed dramatically in the last 10 years. Specifically, the FUS and FUE time of lake ice showed an increasingly delaying trend. In contrast, the BUS and BUE time of lake ice presented an advance. This led to the reduction of the ID and CID of lake. The average rates of ID and CID were -2.21 d/a and -1.91 d/a, respectively. (3) The variations of phenology and evolution of lake ice were a result of local and climatic factors. The temperature, lake area, salinity and shape of the shoreline were the main factors affecting the phenology of lake ice. However, the other factors such as the thermal capacity and the geological structure of lake should not be ignored as well. (4) The spatial process of lake ice freeze-up was contrary to its break-up process. The type of lake ice extending from one side of lakeshore to the opposite side was the most in the Hoh Xil region.

Cite this article

YAO Xiaojun , LI Long , ZHAO Jun , SUN Meiping , LI Jing , GONG Peng , AN Lina . Spatial-temporal variations of lake ice phenology in the Hoh Xil region from 2000 to 2011[J]. Journal of Geographical Sciences, 2016 , 26(1) : 70 -82 . DOI: 10.1007/s11442-016-1255-6

1 Introduction

Climate change is an important common subject around the world (Qin, 2012). According to the Intergovernmental Panel on Climate Change (IPCC), the average global temperature had risen by 0.89°C from 1951 to 2012 and showed a significant accelerated rising trend (Vaughan et al., 2013). There is a strong link between climate change and lake ice phenology (Benson et al., 2012; Kropáček et al., 2013; Zhang et al., 2015). Experience and model studies have indicated that the freeze-up duration and the break-up duration of lake ice are closely associated with the temperature change (Deguay et al., 2006). Analysis of ice phenology of numerous lakes in the Northern Hemisphere showed that a 1°C rise in mean air temperature corresponds to a reduction of 4-7 days in the duration of the ice cover season (Palecki and Barry, 1986).Thus, lake ice phenology is recognized and established as a tangible and technically feasible indicator of local climate change; it is used to support climate change research at all scales from local to global (Hodgkins et al., 2002; Gould and Jeffries, 2005; Johnson and Stefan, 2006; Marszelewski and Skowron, 2006; Qin, 2012; Vaughan et al., 2013). Despite recognizing the importance of lake ice monitoring, observations of lake ice freeze-up, break-up and ice thickness have dramatically declined. Costs involved in making observations as well as safety concerns for observers are suggested for the reduction (Lenormand et al., 2002).
Encouragingly, satellite remote sensing provides an alternative means to collect observations of lake ice phenology and has been used widely in North America and Europe (Hall and Riggs, 2002; Latifovic and Pouliot, 2007). For instance, Wang et al. (2012) found that there had been a significant downward trend in lake ice cover over the Great Lakes in North America over the 1973-2010 period based on AVHRR, GOES and MODIS satellite imagery. Benson et al. (2012) reported that ice phenology of 75 lakes in North America changed rapidly in the last 30 years, and the freeze-up and break-up of lake ice had a delay of 1.6 d/10a and an advance of 1.9 d/10a, respectively. They suggested that the freeze-up duration of lake ice was closely related to temperature in autumn, winter and spring. Comparatively, the study on ice phenology of lakes in China is seldom. Qinghai Lake and Nam Co are the few special cases. Che et al. (2009) established a complete sequence of Qinghai Lake ice phenology from 1978 to 2006 based on SSM/I data and found that the ice cover duration reduced by 14-15 days. The average freeze-up duration of Nam Co was 90 days and the timing of freeze-up and break-up happened in February and May, respectively (Qu et al., 2012). Experiments conducted in Nam Co showed that MODIS imagery could provide an accurate judgment on the timing of lake ice break-up start while AMSR-E did well in identifying the timing of lake ice freeze-up end and break-up end (Wei and Ye, 2010).
The Tibetan Plateau (TP) was identified as one of the most sensitive regions in the world to changes in climate because of its unique properties (Wu et al., 2005). The Hoh Xil region located in the hinterland of the TP spans the Yangtze River and the TP inland lake basins and includes numerous lakes (Figure 1). Most of the lakes are brackish or semi-brackish in the Hoh Xil region. Freshwater lakes and salt lakes are less distributed. There are 83 lakes with area more than 10 km2 each and the total area is about ~7747 km2 in the Hoh Xil region (Yao et al., 2014). The lakes have been expanding quickly since the early 1990s and some lakes (e.g. Huiten Nor and Hoh Sai Lake) spilled because of increased precipitation (Yao et al., 2012). Due to the hostile natural conditions and wildlife refuge establishment, the lakes in the Hoh Xil region are seldom influenced by human activities and remain in their naturally state. Therefore, studies on lakes in the Hoh Xil region can not only fill the lack of ice phenology on the TP, but also promote a deeper understanding of the TP’s climate change. In this study, the objective is to clarify the spatial-temporal variations of lake ice phenology in the Hoh Xil region based on long time series of remote sensing imagery.
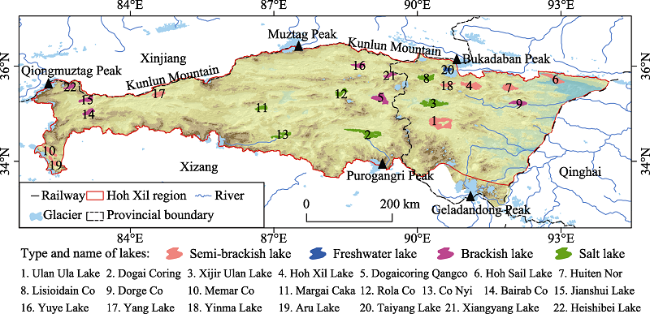
Figure 1 Names and locations for lakes analyzed in the Hoh Xil region

2 Data and methods

2.1 Selected lakes

All the 83 lakes had an area larger than 10 km2 each in the Hoh Xil region, of which 22 lakes greater than 100 km2 were selected as the studying objects. These lakes are distributed evenly in the study area. Figure 1 shows the geographical location of the lakes analyzed. The vector representation of 22 lakes was extracted from the Landsat TM/ETM+ imagery (Yao et al., 2014). The properties of lakes including the elevation and salinity were from the monograph of Records of Lakes in China (Wang and Dou, 1998).

2.2 Satellite data

In order to accurately obtain the timing of formation and decay of ice cover over lakes, MODIS MOD09GA data products with high temporal resolution (1 day) and moderate spatial resolution (250 m on bands 1 and 2, 500 m on bands 3 and 4) were adopted. In total 2816 scenes of MODIS MOD09GA from 2000 to 2011 with a storage of about 250 GB were used in this study and were downloaded from the website (http://www.gscloud.cn) of Computer Network Information Center, Chinese Academy of Sciences. Ground observations of lake ice phenology in the remote Hoh Xil region with harsh winter conditions are not available. As an alternative, 891 scenes of Landsat TM/ETM+ imagery with a spatial resolution of 30 m provided by the USGS/NASA (http://earthexplorer.usgs.gov) were processed to verify the accuracy of the lake ice phenology extracted from the MODIS MOD09GA data.

2.3 Meteorological data

Although there are only three national meteorological stations of Wudaoliang, Gerze and Shiquanhe around the Hoh Xil region, it is doubt that the observations from these stations can denote the meteorological conditions around the lakes due to the far distance. We used 0.5°×0.5° temperature grid data which was generated from observation data of all national meteorological stations and GTOPO30 DEM. This dataset was provided by the Chinese Meteorological Science Data Center (http://cdc.cma.gov.cn). The temperature of lakes was extracted from the neighbor grids.

2.4 Automated extraction of lake ice

Lake ice information is usually extracted by ground observing and remote sensing monitoring. The former is high-precision, but time-consuming and laborious. On the contrary, remote sensing monitoring method has a larger range of observation and a higher update speed. The remote sensing identification of lake ice is on the basis of the spectral characteristic of ice and water, mainly including artificial visual interpretation method, threshold method and index method (Reed et al., 2009; Choinski et al., 2010; Wei and Ye, 2010). The first method is usually laborious and needs rich experience and expertise. The index method distinguishes ice from water by band calculation. The threshold method synthetically considers the reflectivity, temperature, backward scattering coefficient and other characteristics of ice and water of the lakes. So it can provide a higher precision result and is widely applied. The threshold method was represented as follows:
where ρred and ρNIR denote the reflectance of red band and near-infrared band, respectively. They are corresponding to Band 1 and Band 2 of MODIS MOD09GA data. Two thresholds (a and b) are used to distinguish the lake ice from water body and are assigned to 0.02 and 0.05 proposed by Wei and Ye (2010).
Figure 2 shows the Hoh Sai Lake status in Landsat TM and MODIS imagery on November 28, 2001. The area of ice cover was 175.41 km2 based on the artificial visual interpretation of Landsat TM imagery (see Figure 2a). It was 178.01 km2 extracted from the threshold method applying to MODIS MOD09GA data. The difference was 2.61 km2 (1.48%) indicating that the threshold method performed much better.
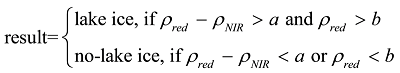
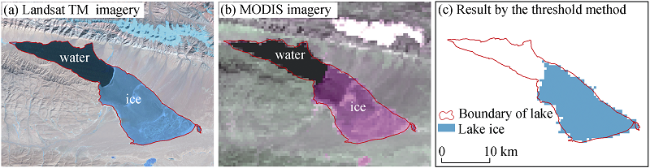
Figure 2 The status of the ice cover of the Hoh Sail Lake on November 28, 2001

2.5 Automated identification of lake ice phenology

The lake ice phenology deals with periodic formation and decay of ice cover over lake water bodies and changes in timing as a result of seasonal and inter-annual variations in climate (Kropáček et al., 2013). It is characterized with the following four events in the profile: 1) ice break-up start (BUS), 2) ice break-up end (BUE), 3) freeze-up start (FUS) and freeze-up end (FUE). Freeze-up date is defined to occur when ice cover is ≥90% of the lake area; break-up date is when ice cover is ≤10% (Reed et al., 2009). Therefore, the parameters of lake ice phenology can be automatically extracted by the calculation as below:
where IA and LA refer to the ice area and lake area, respectively. The value of IA can be calculated based on the automated extraction of the lake ice mentioned in section 2.4 in the GIS software. The value of LA is from the result of Yao et al. (2014).
Since there are discrepancies in the definition of variables describing the duration of lake ice cover, a comparison of ice phenology records for different regions is often biased. For instance, Reed et al. (2009) defined ice duration (ID) as the time interval from FUE to BUE, while Kropáček et al. (2013) thought ID as the duration from FUS to BUE and put forward a new variable: complete ice duration (CID) meaning the time interval from FUE to BUS. The CID was the same as the freeze-up days of the Qinghai Lake in the researches by Chen et al. (1995) and Che et al. (2009). Here we use ID and CID to describe the ice duration of lakes in the Hoh Xil region.

3 Results and discussion

3.1 The temporal characteristics of lake ice phenology

The lake ice phenology for 22 lakes during 2000-2010 from MODIS data in the Hoh Xil region was given in Table 1. It is evident that the occurring date of lakes’FUS are relatively concentrated, mainly appearing in late October and early November. Among all 22 lakes, the FUS date of Yuye Lake came earliest on October 9 (the 283rd day) and that of Lisioidain Co came latest on November 14 (the 319th day). The FUS duration was within one week except for Dogai Coring and Dogaicoring Qangco. The time of lakes’ FUE appeared in the period of mid-November and early December. The FUE came earliest in Yuye Lake (on October 30, the 304th day) and latest in Dogai Coring (on December 18, the 353rd day). Similarly, the FUE duration of most lakes fluctuated within one week. It was the exception for Xijir Ulan Lake and Dogaicoring Qangco which were more than half a month. The average duration from FUS to FUE of lakes was about 17 days. Only for Xijir Ulan Lake and Dogai Coring, their freeze-up duration was more than 40 days and fluctuated suddenly. For instance, the ice expansion of Xijir Ulan Lake lasted 104 days in 2004 while 21 days in 2009.
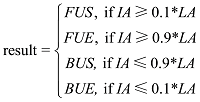
Table 1 The ice phenology of lakes in the Hoh Xil region
Lake Lake ice phenology
Name Area
(km2)
Elevation
(m a.s.l.)
FUS FUE BUS BUE CID
(days)
ID
(days)
Ulan Ula Lake 563.79 4854 297±2 321±4 116±23 164±8 160±23 208±11
Dogai Coring 459.62 4921 308±16 353±8 61±8 112±15 72±11 124±20
Xijir Ulan Lake 395.95 4769 301±8 350±18 34±23 127±15 49±33 142±19
Hoh Xil Lake 319.43 4878 300±3 318±3 161±4 174±6 208±4 221±7
Dogaicoring Qangco 313.08 4787 310±13 327±17 107±31 124±24 146±49 163±42
Hoh Sail Lake 268.01 4475 318±2 337±3 129±5 141±8 157±6 169±9
Huiten Nor 261.32 4751 312±5 326±2 146±6 160±7 185±7 198±9
Lisioidain Co 246.27 4867 319±6 334±6 109±17 126±12 140±22 158±18
Dorge Co 205.33 4688 300±7 310±8 116±13 147±9 171±16 202±14
Memar Co 147.77 4920 304±5 322±5 145±6 167±8 188±10 210±11
MargaiCaka 144.19 4785 300±6 310±5 137±7 153±8 192±10 208±12
Rola Co 142.63 4807 293±6 311±3 128±8 150±9 182±9 204±11
Co Nyi 137.73 4902 296±3 315±6 121±16 160±6 171±20 210±11
Bairab Co 136.25 4958 302±7 319±5 152±8 167±8 197±11 212±11
Jianshui Lake 129.65 4884 291±4 307±4 146±8 161±9 204±11 219±12
Yuye Lake 120.16 4850 283±2 304±7 153±15 166±12 214±18 227±16
Yang Lake 118.12 4778 296±3 315±6 148±5 161±4 198±10 210±9
Yinma Lake 107.41 4918 289±2 311±2 135±19 166±8 189±20 220±10
Aru Co 105.16 4940 313±5 331±6 81±17 134±12 115±15 168±13
Taiyang Lake 101.91 4882 316±4 329±3 145±11 164±9 181±13 201±10
Xiangyang Lake 100.58 4870 300±4 310±3 150±7 162±2 205±9 217±5
Heishibei Lake 100.55 5048 301±6 317±5 159±3 169±4 207±4 217±6
Comparatively, the date of lakes’ BUS in the Hoh Xil region was disperse, beginning in early February (Xijir Ulan Lake on the 34th day) until early June (Hoh Xil Lake on the 161st day). However the BUS time of about 4/5 of the lakes appeared in mid-April to early June. Except for Xijir Ulan Lake and Dogai Coring having a short CID (49 days and 72 days, respectively), the duration of complete ice cover for other lakes was about 180 days. It meant that the lakes were completely covered by ice for about half a year in the Hoh Xil region. The time of lakes’ BUE mainly appeared in early May to early June. The BUE date of Dogai Coring came earliest in late April (on the 112nd, April 21) and that of Hoh Xil Lake came latest in late June (on the 174th day, June 22). During the study period, the average ID of lakes was 196 days in the Hoh Xil region. Dogain Coring had a shortest ID (124 days) while Yuye Lake had the longest one (227 days). However, there were inevitably extreme cases in different years. For instance, the ID of Dogaicoring Qangco was only 55 days in 2000-2001 but was as long as 191 days in 2002-2003. As for the range of ID’s variations, Xiangyang Lake was the minimum (14 days) and Dogaicoring Qangco was the maximum (136 days).

3.2 The spatial characteristics of lake ice freeze-up and break-up

The spatial pattern of ice freeze-up and break-up can reflect the differences in depth and salinity of the lakes. Qinghai Lake and Nam Co begin to freeze up from the shallow water along the shoreline and gradually expand to the deep-water area (Che et al., 2009, Qu et al., 2012). The process of ice freeze-up and break-up of lakes in the Hoh Xil region presented obvious differences because of their complex shape and geological structure. Figure 3 shows the phases of ice freezing and melting of Hoh Sail Lake, Dorge Co and Ulan Ula Lake. For Hoh Sail Lake, it is apparent that ice firstly emerged on the southeast bank and then gradually extended to the northeast until covering the entire lake. Instead, the lake ice firstly formed on the northwest bank, then grew around the bank and extended into the central area on the Dorge Co water surface. The freeze-up process of Ulan Ula Lake was more complicated. The Ulan Ula Lake was composed of three parts blocked by Zhenghuridge. As shown in Figure 3, the southern part of Ulan Ula Lake was firstly covered by ice, followed by the northern part, and finally the eastern part. Moreover, the ice formed earlier at the joints area where lake was connected by the narrow waterway. Although the freeze-up process of three lakes was different, an obvious feature was that the spatial pattern of lake ice break-up was opposite to its freeze-up process. In other words, it was relatively late to break up in where lake ice formed earlier and vice versa.
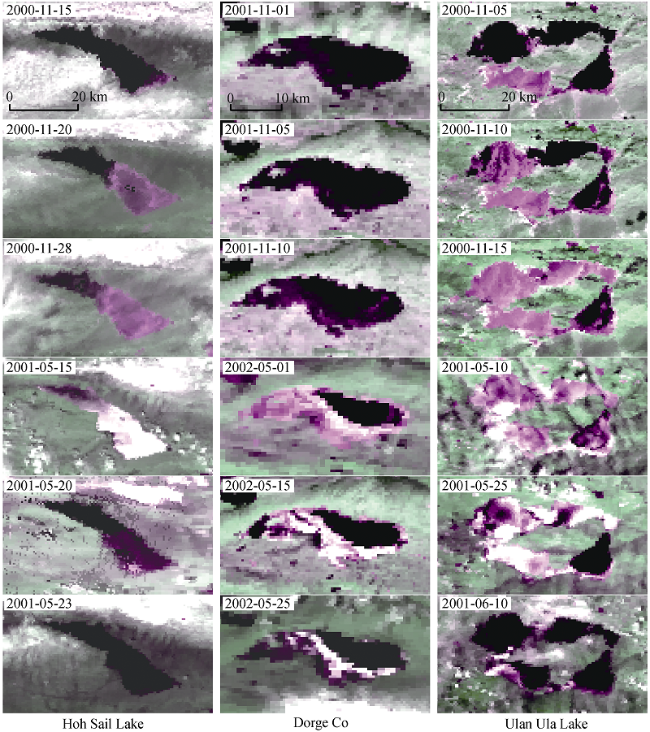
Figure 3 The process of lake ice freezing and melting (the purple or white region denotes lake ice and the black region represents lake water)
After inspecting the freeze-up process of these 22 lakes in the Hoh Xil region, we found that the spatial patterns of lake ice freeze-up could be classified into three types (Figure 4): 1) lake ice extending from one bank to the opposite side; 2) lake ice extending around the shoreline to the center of lake; 3) lake ice firstly emerging in sub-lake then expanding to the whole lake. Of the 22 lakes in the Hoh Xil region, 11 lakes belonged to the first type, followed by the second type (7 lakes). The third type only included four lakes of Ulan Ula Lake, Dogai Coring, Xijir Ulan Lake and Co Nyi. The spatial pattern of lake ice freeze-up was not only related to its shape but also had a possible relationship with its lakebed landform. In the case of Hoh Sail Lake, the studies of Luo et al. (2010) demonstrated that its bed inclined from southeast to northwest, meaning deeper water occurred in the northwestern part and narrow water in the southeastern. According to the spatial pattern of ice evolution, Hoh Sail Lake firstly froze up in the shallow area and gradually extending to the deep-water area. That is to say, the spatial pattern of lake freeze-up had a good consistency with the depth of a lake.
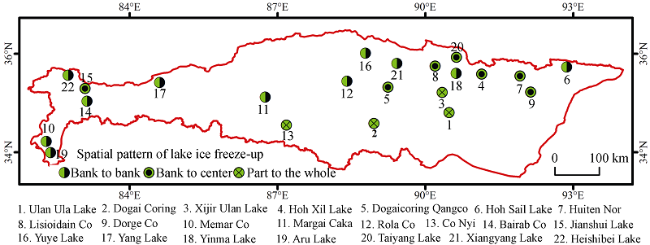
Figure 4 The spatial pattern of lake ice freeze-up in the Hoh Xil region

3.3 Changing trend of lake ice phenology

The phenology of lake ice had changed dramatically during the period of 2000 to 2011 in the Hoh Xil region (Figure 5). The FUS date of 20 lakes was delayed at an average rate of 0.73 d/a except for Lisioidain Co and Dogaicoring Qangco. Similarly, the FUE date of 18 lakes also presented a delayed trend at a rate of 0.34 d/a. The lakes showing an advance trend of the FUE date were Xijir Ulan, Dogaicoring Qangco, Lisioidain Co and Yuye Lake located in the middle of the study area. Although the FUS and FUE time of lakes was delayed, the freeze-up duration of most lakes had been reduced at a rate of 0.39 d/a, with exception of Co Nyi and Yang Lake, being at a rate of 1.11 d/a and 1.14 d/a, respectively.
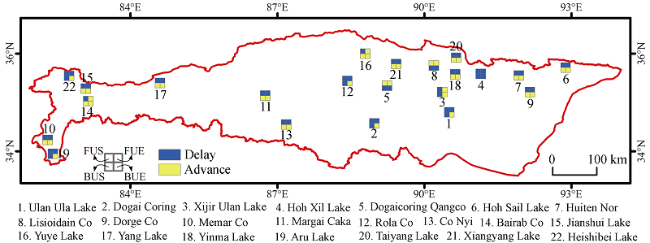
Figure 5 The variation trend of ice phenology of lakes in the Hoh Xil region from 2000 to 2011
The variations of lakes’ BUS date were relatively complex in the Hoh Xil region. The BUS time showed a trend of advance in 13 lakes (1.66 d/a) and a trend of delay in 9 lakes (3.26 d/a). Except for Aru Co and Heishibei Lake, other 7 lakes were in the middle of the Hoh Xil region. The variations of lakes’ BUE date showed an obvious advanced trend. Specifically, a total of 19 lakes represented an advance of BUE date at a rate of 0.81 d/a. Only three lakes including Xijir Ulan, Hoh Xil Lake and Yuye Lake showed a slight delay of BUE date. Due to the FUE delay and the BUS advance, the CID of 14 lakes had been reduced at an average rate of 2.21 d/a. Compared with Qinghai Lake (at a rate of -0.52 d/a), the variations of lakes’ CID in the Hoh Xil region were more significant. Except for Lisioidain Co and Dogaicoring Qangco, other 20 lakes with an area more than 100 km2 each also showed a reduction in ID at an average rate of 1.91 d/a in the Hoh Xil region.

3.4 Analysis on factors influencing ice conditions in lakes of the Hoh Xil region

The phenology of lake ice is not only affected by regional climate factors including temperature, wind speed, solar radiation and snow cover, but also related to the lake itself, such as the bathymetry, salinity, altitude, shape of the shoreline, area and thermal capacity of lake (Ménard et al., 2002; Barrie et al., 2006; Ghanbari et al., 2009). Air temperature has been suggested to be the most significant factor influencing the ice phenology, for instance by Livingstone (1997) and Kropáček et al. (2013). Being limited by the data available, this study was only focused on the relation of ice phenology to few factors: mean temperature, lake area, altitude, salinity and shape of the shoreline. The data of lake altitude and salinity were from Records of Lakes in China (Wang and Dou, 1998). The mean temperature of the lakes was extracted from the neighbor grids in the 0.5°×0.5° temperature interpolated data set. The shape of shoreline was defined as a ratio between perimeter and area suggested by Kropáček et al. (2013). This shape index and lake area could be easily retrieved from the GIS layer of lakes.
Table 2 provides the correlation statistics between lake ice phenology and local and climatic factors. Results of the analysis showed that there was a high negative correlation between the FUS and the shoreline shape. This indicates that the shape complexity significantly affects the ice phenology, in particular, the freeze-up process providing shallow bays for the development of early ice. And along with the longer freeze-up duration, the thickness of lake ice is much greater in areas where the earlier ice emerges (Chen et al., 1995). Lake area and salinity are key factors influencing the FUE time. Generally, the larger area of a lake implies a greater volume which can enhance vertical heat transfer, reduce water evaporation and heat consumption by water dynamics. The greater thermal capacity of a larger lake will lead to slower freeze-up process. The high salinity of the lakes means lower freeze-up temperature, which is as low as -2°C for salt lakes (Zheng et al., 1989). The main factors affecting lakes’ BUS and BUE are lake area, salinity and air temperature and there is a negative correlation among them. In other words, the greater area, higher salinity and air temperature of the lakes will accelerate the thawing of ice. Lake area and temperature have an effect on the CID and ID of the lakes. But the salinity of a lake is only associated with its ice duration. The analysis revealed much higher dependency of ice phenology on mean temperature, lake area, salinity and shape of the shoreline and each factor played a different role in the process of lake ice freeze-up and break-up cycle. Unlike the opinion of Kropáček et al. (2013), altitude is not a key factor affecting the lake ice phenology in the Hoh Xil region. This could have been likely caused by the lower differences of altitudes among most lakes.
Table 2 Correlationof lake ice phenology and local and climatic factors*
Lake ice phenology Lake area Lake shape index Altitude Salinity Annual temperature
FUS 0.22 -0.72** -0.24 0.03 0.26
FUE 0.59** -0.28 -0.15 0.55** 0.49*
BUS -0.53** -0.03 0.12 -0.65** -0.69**
BUE -0.43* 0.18 0.28 -0.62** -0.61**
CID -0.58** -0.25 0.26 -0.04 -0.75**
ID -0.53** 0.24 0.24 -0.63** -0.60**

Note: * * and * represent confidence (P value) at the level of 0.01 and 0.05, respectively.

3.5 Complexity of lake ice conditions

Some interesting phenomenon had been found when we examined ice cover evolution of lakes based on remote sensing imagery. For instance, Xijir Ulan Lake did not freeze up in December 2000 to January 2001 which was confirmed by the high resolution Landsat TM/ETM+ images (Figure 6). As shown in Table 1, the average CID of Xijir Ulan Lake was 49 days but had a great inter-annual fluctuation (33 days). It indicated that the ice phenology of Xijir Ulan Lake was not only affected by regional climate change but also was closely related to its own conditions. Xijir Ulan Lake was MgSO4-type with a high salinity of 256.73 g/L and the content of Na+ and Cl- being up to 92.98 g/L and 152.37 g/L, respectively (Wang and Dou, 1998). This might be the main cause resulting in the shorter CID of Xijir Ulan Lake and even no ice cover in some years.
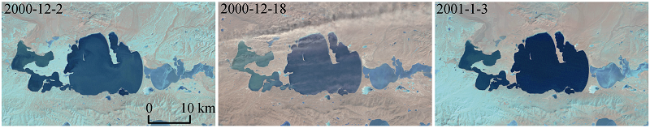
Figure 6 The status of Xijir Ulan Lake in the winter during 2000-2001
The other fascinating thing was that lakes spatially adjacent to each other had obvious differences in their ice cover conditions, such as Memar Co and Aru Co, Xijir Ulan Lake and Ulan Ula Lake (Figure 7). Memar Co (4920 m a.s.l.) is located at the north of Aru Co (4940 m a.s.l.). The water of the latter runs into the former by channel. As it is revealed in Figure 7, Memar Co was almost completely covered by ice on May 20, 2009 while Aru Co was fully melting. Owing to the approximate regional climate, the ice cover of Memar Co with larger area and higher salinity was theoretically easier to melt than Aru Co. The confusing reality made us suspect that the average water depth of Aru Co was greater than Memar Co. Thus the Aru Co with greater volume and thermal capacity began to thaw early. It suggested that the lake with a large area did not always have a large volume and thermal capacity. However this inference should be verified by the field work. Similarly, Xijir Ulan Lake and Ulan Ula Lake being spatially near each other were also melting and completely covered by ice on April 18, 2007. Both the area and water depth of the latter was greater than the former. The fact was Xijir Ulan Lake broke up in advance, which was most possibly caused by their huge difference in salinity. As mentioned in Records of Lakes in China (Wang and Dou, 1998), the salinity of Xijir Ulan Lake was as high as 256.73 g/L while that of Ulan Ula was only 10.92 g/L.
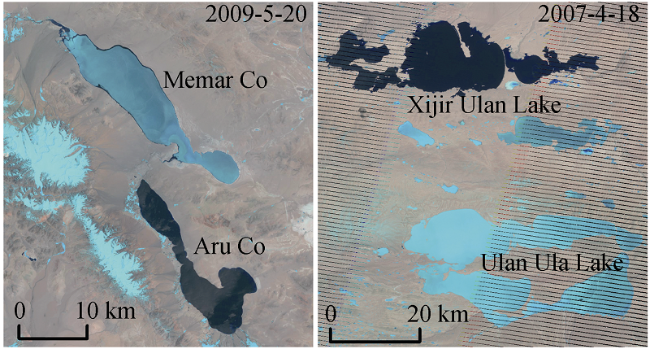
Figure 7 The ice cover of adjacent lakes in the Hoh Xil region
Co Nyi located in a fault basin of Nyima County was also a special case. It consists of eastern and western parts which are connected by a narrow waterway. As it is revealed in Figure 8, it was not frozen at the center of the joint and lake ice was gradually thawing towards the east in a fan shape. The previous field investigation found the vertical water temperature of Co Nyi presented an “S-shaped” pattern (Wang and Dou, 1998). In particular, the water temperature was gradually dropping at the depth of 0-15 m but rising under 15 m and going up to 16.3-17.3°C at 30-35 m, and thus it was believed that there was a hot spring in the bottom. Hence the hot spring should lie at east portion of the joint of Co Nyi, and it also suggested that the regional geothermal activity played an import role in the spatial evolution of lake ice.
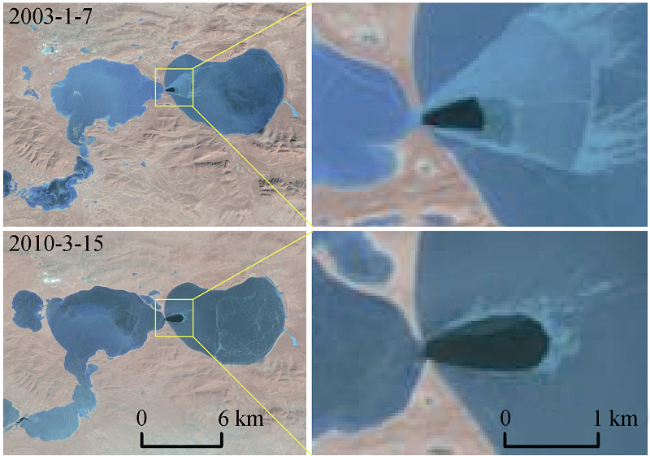
Figure 8 The ice cover of Co Nyi

4 Conclusions

In this paper, we studied the spatial-temporal variations of ice phenology of 22 lakes with area more than 100 km2 each in the Hoh Xil region during the period 2000-2011.
(1) The time of FUS and FUE of lake ice mainly appeared in the late October to early November and mid-November to early December, respectively. The duration from FUS to FUE was about half a month. The time of BUS and BUE of lake ice was relatively disperse and appeared in the early February to early June and early May to early June. The complete ice duration and average ice duration was 181 days and 196 days, respectively.
(2) The spatial process of lake ice freeze-up was contrary to its break-up process, and the spatial pattern of lake ice inter-annual cycle was well consistent with its bottom landform. There were three types of lake ice freeze-up and break-up spatial patterns in the Hoh Xil region. The dominant one is that lake ice extends from one bank to the opposite side, followed by the lakes with ice extending around the shoreline to the center of the lakes. The lakes with ice cover firstly emerging in sub-lake then expanding to the whole lake were the least.
(3) The phenology of lake ice had changed dramatically during the period of 2000 to 2011 in the Hoh Xil region. The FUS and FUE time of lake ice showed an increasingly delaying trend and the rates were 0.73 d/a and 0.34 d/a respectively. However, the BUS and BUE time of lake ice presented an opposite trend at an average rate of 1.66 d/a and 0.81 d/a, respectively. As a result, the CID and ID of lake ice were significantly reduced at an average rate of 2.21 d/a and 1.91 d/a, respectively.
(4) The correlation analysis revealed that lake ice phenology depended on mean temperature, lake area, salinity and shape of the shoreline and each factor played a different role in the lake ice freeze-up and break-up cycle. Moreover, the local factors such as geological structure and geothermal energy could also affect the evolution of lake ice. Meanwhile, more attention should be paid to some scientific researches in the coming time. For example, the reduction of lake ice duration in the wide range of Hoh Xil region certainly breaks the balance of heat budget, how this variation affects the evaporation of lake water and regional climate, etc.

The authors have declared that no competing interests exist.

1
Barrie R B, Terry D P, Claude R Det al., 2006. Impacts of large-scale teleconnections on freshwater-ice break/freeze-up dates over Canada.Journal of Hydrology, 330: 340-353.Freshwater ice affects several physical, chemical, and biological processes in cold regions. Its duration and break-up also has numerous economic implications ranging from transportation, to the occurrence and severity of ice-jam flooding. Recent evidence indicates a shortening of the freshwater-ice season over much of Canada with the reduction being mainly attributable to earlier break-ups. These trends match those in surface air temperature during the last 50 years. Several studies have shown significant relationships between Canadian temperature and large-scale atmospheric and oceanic oscillations (i.e. teleconnections) particularly, during the cold season. However, no investigations have analyzed relationships between several teleconnection indices and historical freshwater-ice durations over Canada. This paper examines the impacts of El Ni o/Southern Oscillation (ENSO), the Pacific Decadal Oscillation (PDO), the Pacific North American (PNA) pattern, the North Pacific (NP) index, the North Atlantic Oscillation (NAO), and the Arctic Oscillation (AO) on Canadian freshwater-ice break/freeze-up dates from 1950-1999. Composite and correlation analyses reveal strongest links between the Pacific-related PDO, PNA, NP, and ENSO indices and ice dates over western Canada. Lakes have stronger and more spatially coherent results than rivers, while break-up dates have higher correlations as compared to freeze-up. The NAO/AO results are less coherent with no discernible impacts over any region of the country. Results from this analysis improve the understanding of relationships between large-scale atmospheric and oceanic oscillations and past freshwater-ice durations over Canada. They also provide insight into future regional changes to lake and river ice given projected changes to teleconnection patterns.

DOI

2
Benson B J, Magnuson J J, Jensen O Pet al., 2012. Extreme events, trends, and variability in Northern Hemisphere lake-ice phenology (1855-2005).Climatic Change, 112: 299-323.Abstract<br/>Often extreme events, more than changes in mean conditions, have the greatest impact on the environment and human well-being. Here we examine changes in the occurrence of extremes in the timing of the annual formation and disappearance of lake ice in the Northern Hemisphere. Both changes in the mean condition and in variability around the mean condition can alter the probability of extreme events. Using long-term ice phenology data covering two periods 1855–6 to 2004–5 and 1905–6 to 2004–5 for a total of 75 lakes, we examined patterns in long-term trends and variability in the context of understanding the occurrence of extreme events. We also examined patterns in trends for a 30-year subset (1975–6 to 2004–5) of the 100-year data set. Trends for ice variables in the recent 30-year period were steeper than those in the 100- and 150-year periods, and trends in the 150-year period were steeper than in the 100-year period. Ranges of rates of change (days per decade) among time periods based on linear regression were 0.3−1.6 later for freeze, 0.5−1.9 earlier for breakup, and 0.7−4.3 shorter for duration. Mostly, standard deviation did not change, or it decreased in the 150-year and 100-year periods. During the recent 50-year period, standard deviation calculated in 10-year windows increased for all ice measures. For the 150-year and 100-year periods changes in the mean ice dates rather than changes in variability most strongly influenced the significant increases in the frequency of extreme lake ice events associated with warmer conditions and decreases in the frequency of extreme events associated with cooler conditions.<br/>

DOI

3
Che T, Li X, Jin R, 2009. Monitoring the frozen duration of Qinghai Lake using satellite passive microwave remote sensing low frequency data.Chinese Science Bulletin, 54: 2294-2299. (in Chinese)

4
Chen X Z, Wang G Y, Li W Jet al., 1995. Lake ice and its remote sensing monitoring in the Tibetan Plateau.Journal of Glaciology and Geocryology, 17(3): 241-246. (in Chinese)The annual and interannual. changes of lake ice following the climatic changes were stu-died and the Qinghai Lake in Plateau was taken as an example in this paper.Lake ice condi-tion, change and relation with air temperature were analysed based on the observed data ofmeteorological stations.The lower the temperature,the thicker the ice;lake ice changes lagsbehind temperature’s. The lake ice was monitored using NOAA/AVHRR data based on theimaging characteristics of lake ice, water and lake bank in the wavelengths of visible,nearinfrared and thennalinfrared from 1993 to 1994.The percentage of lake ice and the areawere caculated,and further analysis was made using observed data of meteorological station.

5
Choinski A, Kolendowicz L, Pociask K Jet al., 2010. Changes in lake ice cover on the Morskie Oko Lake in Poland (1971-2007).Advances in Climate Change Research, 1(2): 71-75.On the basis of data from the period 1971-2007, and by applying trend analysis, a study on formation, disappearance and duration of lake ice cover on the Morskie Oko Lake in the Tatra Mountains in southern Poland was carried out. The results show decreasing trends in the maximum thickness of winter lake ice cover and in duration of lake ice phenomena, while air temperature recorded at the same period at the foot of the Tatra Mountains shows increasing trend. There are strong relationships between the course of lake ice phenomena and air temperature.

DOI

6
Deguay C R, Prowse T D, Bonsal B Ret al., 2006. Recent trends in Canadian lake ice cover.Hydrology Process, 20: 781-801.Recent studies have shown that ice duration in lakes and rivers over the Northern Hemisphere has decreased over the 19th and 20th centuries in response to global warming. However, lake ice trends have not been well documented in Canada. Because of its size, considerable variability may exist in both freeze-up and break-up dates across the country. In this paper, results of the analysis of recent trends (1951-2000) in freeze-up and break-up dates across Canada are presented. Trends toward earlier break-up dates are observed for most lakes during the time periods of analysis which encompass the 1990s. Freeze-up dates, on the other hand, show few significant trends and a low degree of temporal coherence when compared with break-up dates. These results are compared with trends in autumn and spring 0 °C isotherm dates over the time period 1966-95. Similar spatial and temporal patterns are observed, with generally significant trends toward earlier springs/break-up dates over most of western Canada and little change in isotherm and freeze-up dates over the majority of the country in autumn. Strong correlations (r > 0.5) between 0 °C isotherm dates and freeze-up/break-up dates at many locations across the country reveal the high synchrony of these variables. These results are also consistent with more recent observations of other cryospheric and atmospheric variables that indicate, in particular, a general trend toward earlier springs in the latter part of the 20th century. The results of this study provide further evidence of the robustness of lake ice as a proxy indicator of climate variability and change.

DOI

7
Ghanbari R N, Bravo H R, Magnuson J Jet al., 2009. Coherence between lake ice cover, local climate and teleconnections.Journal of Hydrology, 374(3/4): 282-293.

8
Gould M, Jeffries M, 2005. Temperature variations in lake ice in central Alaska, USA.Annals of Glaciology, 40(1): 89-94.In winter 2002/03 and 2003/04, thermistors were installed in the ice on two shallow ponds in central Alaska, USA, in order to obtain data on ice temperatures and their response to increasing and decreasing air temperatures, and flooding and snow-ice formation. Snow depth and density, and ice thickness were also measured in order to understand how they affected and were affected by ice temperature variability. The lowest ice temperature (6115.5°C) and steepest temperature gradient (6139.8°C m) occurred during a 9 week period in autumn 2002/03 when there was no snow on the ice. With snow on the ice, temperature gradients were more typically in the range 6120 to 615°C m. Average ice temperatures were lower during the warmer, first winter, and higher during the cooler, second winter because of differences in the depth and duration of the snow cover. Isothermal ice near the freezing point resulted from flooding and snow-ice formation, and brief episodes of warm weather with freezing rain. Under these circumstances, congelation-ice growth at the bottom of the ice cover was interrupted, even reversed. It is suggested that the patterns in temperatures brought about by the snow-ice formation and rain events may become more prevalent due to the increase in frequency of these events in central Alaska if temperature and precipitation change as predicted by Arctic climate models.

DOI

9
Hall D K, Riggs G A, Salomonson V Vet al., 2002.MODIS snow-cover products.Remote Sensing of Environment, 83: 181-194.

10
Hodgkins A G, James I C, Huntington T G, 2002. Historical changes in lake ice-out dates as indicators of climate change in New England, 1850-2000.International Journal of Climate, 22: 1819-1827.Abstract Various studies have shown that changes over time in spring ice-out dates can be used as indicators of climate change. Ice-out dates from 29 lakes in New England (USA) with 64 to 163 years of record were assembled and analysed for this study. Ice-out dates have become significantly earlier in New England since the 1800s. Changes in ice-out dates between 1850 and 2000 were 9 days and 16 days in the northern/mountainous and southern regions of New England respectively. The changes in the ice-out data over time were very consistent within each of the two regions of New England, and more consistent than four air-temperature records in each region. The ice-out dates of the two regions had a different response to changes in air temperature. The inferred late winter arly spring air-temperature warming in both regions of New England since 1850, based on linear regression analysis, was about 1.5°C. Published in 2002 by John Wiley & Sons, Ltd.

DOI

11
Hu D S, 1992. Investigation and study on lake resources in Kekexili region.Arid Land Geography, 15(3): 50-58. (in Chinese)The last blank area in the central part of the Qinghai—Xizang plateau was filled up by the national synthetical investigation during the period from 1989. A lot of valuable primary scientific data were obtained by the investigation of 24 specialities. The lake resources and their distribution law have been found out basically in the Kekexili Region. The lake degrees is up to 0.047—0.053. Moreover, a peculiar natural landscape was found in this region. The study provides the scientific basis for revealing the temporal and spatial position of lakes during the evolution processes of natural environment, protecting, utilizing, exploiting and managing the lake resources rationally, renovating the land, etc.

12
Johnson S L, Stefan H G, 2006. Indicators of climate warming in Minnesota: Lake ice covers and snowmelt runoff.Climate Change, 75(4): 421-453.Records of hydrologic parameters, especially those parameters that are directly linked to air temperature, were analyzed to find indicators of recent climate warming in Minnesota, USA. Minnesota is projected to be vulnerable to climate change because of its location in the northern temperate zone of the globe. Ice-out and ice-in dates on lakes, spring (snowmelt) runoff timing. spring discharge values in streams, and stream water temperatures recorded up to the year 2002 were selected for study. The analysis was conducted by inspection of 10-year moving averages, linear regression on complete and on partial records, and by ranking and sorting of events. Moving averages were used for illustrative purposes only. All statistics were computed on annual data. All parameters examined show trends, and sometimes quite variable trends, over different periods of the record. With the exception of spring stream flow rates the trends of all parameters examined point toward a warming climate in Minnesota over the last two or three decades. Although hidden among strong variability from year to year, ice-out dates on 73 lakes have been shifting to an earlier date at a rate of -0.13 days/year from 1965 to 2002, while ice-in dates on 34 lakes have been delayed by 0.75 days/year from 1979 to 2002. From 1990 to 2002 the rates of change increased to -0.25 days/year for ice-out and 1.44 days/year for ice-in. Trend analyses also show that spring runoff at 21 stream gaging sites examined occurs earlier. From 1964 to 2002 the first spring runoff (due to snowmelt) has occurred -0.30 days/year earlier and the first spring peak runoff -0.23 days/year earlier. The stream water temperature records from 15 sites in the Minneapolis/St Paul metropolitan area shows warming by 0.11 °C/year, on the average, from 1977 to 2002. Urban development may have had a strong influence. The analysis of spring stream flow rates was inconclusive, probably because runoff is linked as much to precipitation and land use as to air temperature. Ranking and sorting of annual data shows that a disproportionately large number of early lake ice-out dates has occurred after 1985, but also between 1940 and 1950; similarly late lake ice-in has occurred more frequently since about 1990. Ranking and sorting of first spring runoff dates also gave evidence of earlier occurrences, i.e. climate warming in late winter. A relationship of changes in hydrologic parameters with trends in air temperature records was demonstrated. Ice-out dates were shown to correlate most strongly with average March air temperatures shifting by -2.0 days for a 1 °C increase in March air temperature. Spring runoff dates also show a relationship with March air temperatures; spring runoff dates shift at a rate of -2.5 days/1 °C minimum March air temperature change. Water temperatures at seven river sites in the Minneapolis/St Paul metropolitan area show an average rise of 0.46 °C in river temperature/I °C mean annual air temperature change, but this rate of change probably includes effects of urban development. In conclusion, records of five hydrologic parameters that are closely linked to air temperature show a trend that suggests recent climate warming in Minnesota, and especially from 1990 to 2002. The recent rates of change calculated from the records are very noteworthy, but must not be used to project future parameter values, since trends cannot continue indefinitely, and trend reversals can be seen in some of the long-term records.

DOI

13
Kropáček J, Maussion F, Chen Fet al., 2013. Analysis of ice phenology of lakes on the Tibetan Plateau from MODIS data.The Cryosphere, 7: 287-301.The Tibetan Plateau includes a large system of endorheic (closed basin) lakes. Lake ice phenology, i.e. the timing of freeze-up and break-up and the duration of the ice cover may provide valuable information about climate variations in this region. The ice phenology of 59 large lakes on the Tibetan Plateau was derived from Moderate Resolution Imaging Spectroradiometer (MODIS) 8-day composite data for the period from 2001 to 2010. Ice cover duration appears to have a high variability in the studied region due to both climatic and local factors. Mean values for the duration of ice cover were calculated for three groups of lakes defined by clustering, resulting in relatively compact geographic regions. In each group several lakes showed anomalies in ice cover duration in the studied period. Possible reasons for such anomalous behaviour are discussed. Furthermore, many lakes do not freeze up completely during some seasons. This was confirmed by inspection of high resolution optical data. Mild winter seasons, large water volume and/or high salinity are the most likely explanations. Trends in the ice cover duration derived by linear regression for all the studied lakes show a high variation in space. A correlation of ice phenology variables with parameters describing climatic and local conditions showed a high thermal dependency of the ice regime. It appears that the freeze-up tends to be more thermally determined than break-up for the studied lakes.

DOI

14
Latifovic R, Pouliot D, 2007. Analysis of climate change impacts on lake ice phenology in Canada using the historical satellite data record.Remote Sensing of Environment, 106: 492-507.Variability and trends in lake ice dynamics (i.e. lake ice phenology) are related to climate conditions. Climate influences the timing of lake ice melt and freeze onset, ice duration, and lake thermal dynamics that feedback to the climate system initiating further change. Phenology records acquired in a consistent manner and over long time periods are required to better understand variability and change in climate conditions and how changes impact lake processes. In this study, we present a new technique for extracting lake ice phenology events from historical satellite records acquired by the series of Advanced Very High Resolution Radiometer (AVHRR) sensors. The technique was used to extend existing in-situ measurements for 36 Canadian lakes and to develop records for 6 lakes in Canada's far north. Comparison of phenology events obtained from the AVHRR record and in-situ measurements show strong agreement (20 lakes, 180 cases) suggesting, with high confidence especially in the case of break-up dates, the use of these data as a complement to ground observations. Trend analysis performed using the combined in-situ and AVHRR record 1950-2004 shows earlier break-up (average 0.18days/year) and later freeze-up (average 0.12days/year) for the majority of lakes analyzed. Less confidence is given to freeze-up date results due to lower sun elevation during this period making extraction more difficult. Trends for the 20year record in the far north showed earlier break-up (average 0.99days/year) and later freeze-up (average 0.76days/year). The established lake ice phenology database from the historical AVHRR image archive for the period from 1985 to 2004 will to a certain degree fill data gaps in the Canadian in-situ observation network. Furthermore, the presented extraction procedure is not sensor specific and will enable continual data update using all available satellite data provided from sensors such as NOAA/AVHRR, MetOp/AVHRR, MODIS, MERIS and SPOT/VGT.

DOI

15
Lenormand F, Duguay C R, Gauthier R, 2002. Development of a historical ice database for the study of climate change in Canada.Hydrological Processes, 16(18): 3707-3722.

16
Livingstone D M, 1997. Break-up dates of alpine lakes as proxy data for local and regional mean surface air temperatures.Climatic Change, 37: 407-439.The calendar date of ice break-up on Lej da San Murezzan, a high-altitude (1768 m a.s.l.) lake in the Swiss Alps, has been recorded uninterruptedly since 1832. Based on this record and on shorter, int

DOI

17
Luo C G, Han F Q, Pang X Pet al., 2010. Study on sublacustrine morphology of main lakes in Hoh Xil region.Journal of Salt lake Research, 18(1): 1-8. (in Chinese)The threshold method was used to extract the information of lake water bodies in Hoh Xil region.Lake water bodies can be distinguished perfectly from other landforms in ETM+ 5 band,so the messages of main lakes in Hoh Xil region were extracted by remote sensing image and appropriate threshold values determined by threshold method.By visual interpretation and the comparison with topographic map,the lake water infermation was exactly gained.And by ENVI software image compounding,the pseudcolor images in combination with topographic data were chosen to interpret the lake bottom topography and lake water depth variation.It is shown that Cuodarima is not a deep-water lake as previous research,the ring structure in the bottom of Yonghong lake is a new discovery.

DOI

18
Marszelewski W, Skowron R, 2006. Ice cover as an indicator of winter air temperature changes: Case study of the Polish Lowland lakes.Hydrological Sciences Journal, 51(2): 336-349.Observations of ice cover and winter air temperature measurements were carried out on six lakes in northern Poland during the period 1961-2000. Detailed analyses of the dates of formation and termination of the ice cover, the duration of maximum thickness and ice-free period during winter were carried out. Various tendencies were found in the time series of the earliest freeze-up dates, whereas the latest ice break-up dates were recorded to occur much earlier than in the past on all the lakes, with time advance being on average from 0.6 to 0.8 day year. The period with ice cover has been getting shorter at the rate of 0.8 to 0.9 day year, with the exception of Lake Ha cza, the deepest lake in the European Lowland, where the rate of 0.4 day yearwas recorded. Similarly, there was a decreasing tendency in the maximum thickness of the ice cover, at the rate of 0.26 to 0.60 cm year. Despite similar tendencies, all those changes showed diverse dynamics in particular lakes. The proposed indicator of the ice cover stability confirms the above statements, and thus, the undergoing climatic changes.

DOI

19
Ménard P, Duguay C R, Flato G Met al., 2002. Simulation of ice phenology on Great Slave Lake, Northwest Territories, Canada.Hydrology Process, 16: 3691-3706.Abstract A one-dimensional thermodynamic lake ice model (Canadian Lake Ice Model or CLIMo) is used to simulate ice phenology on Great Slave Lake (GSL) in the Mackenzie River basin, Northwest Territories, Canada. Model simulations are validated against freeze-up and break-up dates, as well as ice thickness and on-ice snow depth measurements made in situ at three sites on GSL (Back Bay near Yellowknife, 1960–91; Hay River, 1965–91; Charlton Bay near Fort Reliance, 1977–90). Freeze-up and break-up dates from the lake ice model are also compared with those derived from SSM/I 85 GHz passive microwave imagery over the entire lake surface (1988–99). Results show a very good agreement between observed and simulated ice thickness and freeze-up/break-up dates over the 30–40 years of observations, particularly for the Back Bay and Hay River sites. CLIMo simulates the ice thickness and annual freeze-up/break-dates with a mean error of 7 cm and 4 days respectively. However, some limitations have been identified regarding the rather simplistic approach used to characterize the temporal evolution of snow cover on ice. Future model improvements will therefore focus on this particular aspect, through linkage or coupling to a snow model. Copyright 08 2002 John Wiley & Sons, Ltd.

DOI

20
Palecki M A, Barry R G, 1986. Freeze-up and break-up of lakes as an index of temperature changes during the transition seasons: A case study for Finland.Journal of Applied Meteorology and Climatology, 25: 893-902.

21
Qin D H, 2012. Climate and Environment Change in China: 2012 the Comprehensive Volume. Beijing: China Meteorological Press. (in Chinese)

22
Qu B, Kang S C, Chen Fet al., 2012. Lake ice and its effect factors in the Nam Co basin, Tibetan Plateau.Progressus Inquisitiones De Mutatione Climatis, 8(5): 327-333. (in Chinese)Lake ice is a good indicator of climate change.In order to analyse the impact of climate on lake ice,we use in situ data as well as remote sensing images to determine the dates of freeze-up and break-up,thickness of lake ice of the Nam Co(2000 km2) and Baima Nam Co(1.45 km2) in the Tibetan Plateau from 2006 to 2011.Combined with meteorological parameters,we found that lake ice in Nam Co is mainly influenced by air temperature,and wind speed also plays an important role in this process.Date of freeze-up and break-up for Nam Co is in February and mid-May,respectively,with an average of 90 days for freeze-up period.Lake ice exhibits relatively larger variability in Baima Nam Co with an average of 124 days for freeze-up period.There is a close relationship between freeze-up period and the negative accumulated temperature.Maximum thickness of the lake ice in the Nam Co occurs in March ranging 58-65 cm.

DOI

23
Reed B, Budde M, Spencer Pet al., 2009. Integration of MODIS-derived metrics to assess interannual variability in snowpack, lake ice, and NDVI in southwest Alaska.Remote Sensing of Environment, 113: 1443-1452.Throughout the observation period (2001–2007), snow cover duration was stable within ecoregions, with variable start and end dates. The start of the lake ice season lagged the snow season by 2 to 3months. Within a given lake, freeze-up dates varied in timing and duration, while break-up dates were more consistent. Vegetation phenology varied less than snow and ice metrics, with start-of-season dates comparatively consistent across years. The start of growing season and snow melt were related to one another as they are both temperature dependent. Higher than average temperatures during the El Ni09o winter of 2002–2003 were expressed in anomalous ice and snow season patterns. We are developing a consistent, MODIS-based dataset that will be used to monitor temporal trends of each of these seasonal metrics and to map areas of change for the study area.

DOI

24
Todd M C, Mackay A W, 2003. Large-scale climate controls on Lake Baikal ice cover.Journal of Climate, 16(19): 3186-3199.

25
Vaughan D G, Comiso J C, Allison I et al., 2013. Observations: Cryosphere. In: Stocker T F, Qin D, Plattner G K et al. ed. Climate Change 2013: The Physical Science Basis. Contribution of Working Group I to the Fifth Assessment Report of the Intergovernmental Panel on Climate Change. Cambridge: Cambridge University Press.

26
Wang J, Bai X, Hu Het al., 2012. Temporal and spatial variability of Great Lakes ice cover, 1973-2010.Journal of Climate, 25: 1318-1329.

27
Wang S M, Dou H S, 1998. Records of Lakes in China. Beijing: Science Press. (in Chinese)

28
Wei Q F, Ye Q H, 2010. Review of lake ice monitoring by remote sensing.Progress in Geography, 29(7): 803-810. (in Chinese)<p>This paper summarized and compared several methods of monitoring lake ice freezing-on and breaking up and ice thickness by multi-spectral and microwave remote sensing data. Finally, we monitored the lake ice in Nam Co by two methods during the winter half year of 2007/2008. Generally, researchers usually take threshold and index methods to monitor lake ice. According to the differences between ice and water, such as their reflectivity, temperature and backward scattering coefficients, the threshold model can distinguish ice and water directly. It has a high precision with an error of less than 5 days. While the index method recognizes ice and water indirectly by calculations based on spectral and polarization characteristics of ice and water. Additionally, researchers use empirical correlations between ice thickness and its reflectivity, polarization, temperature brightness or other properties to invert thickness. Ice thickness recognition is difficult in lake ice monitoring. Active microwave data is more suitable for ice thickness monitoring than multi-spectral data. Data with high time resolution such as thermal infrared and passive microwave data is more suitable for monitoring lake ice with large areas than the data with high spatial resolutions such as visible, near infrared and active microwave data. Based on multi-source remote sensing data, automatic inversion algorithm will be one of the development trends of lake ice monitoring by remote sensing.</p>

DOI

29
Wu S H, Yin Y H, Zheng Det al., 2005. Climate change in the Tibetan Plateau during the last three decades.Acta Geographica Sinica, 60(1): 3-11. (in Chinese)lt;p>The Tibetan Plateau is one of the best places to study global climate change. Aridity or humidity status of land surface is an important outcome that has close relations with a set of climatic factors such as precipitation, temperature, solar radiation, relative humidity and wind, but the relationship between them is complicated. This paper calculated potential evapotranspiration by applying Penman-Monteith model which was recommended by FAO in 1998, and aridity index by Vyshotskii model to indicate aridity or humidity status of the Tibetan Plateau during the period 1971-2000. Then it analyzed the changing trends of observed climatic factors (temperature and precipitation) and calculated factors (potential evapotranspiration and aridity index), and showed the spatial distribution of aridity/humidity status over the Tibetan Plateau during the period 1971-2000. Trends calculated by linear regression were tested through Mann-Kendall test. Results of 77 meteorological stations on the Tibetan Plateau showed that the main trends of climate change are temperature rise and precipitation increase; potential evapotranspiration decrease and most of the areas was ascending to more humid status. Results suggested that aridity or humidity status cannot be presented only with precipitation.</p>

DOI

30
Yao X J, Liu S Y, Li Let al., 2014. Spatial-temporal characteristics of lake area variations in Hoh Xil region from 1970 to 2011.Journal of Geographical Sciences, 24(4): 689-702.<p>As one of the areas with numerous lakes on the Tibetan Plateau, the Hoh Xil region plays an extremely important role in the fragile plateau eco-environment. Based on topographic maps in the 1970s and Landsat TM/ETM+ remote sensing images in the 1990s and the period from 2000 to 2011, the data of 83 lakes with an area above 10 km<sup>2</sup> each were obtained by digitization method and artificial visual interpretation technology, and the causes for lake variations were also analyzed. Some conclusions can be drawn as follows. (1) From the 1970s to 2011, the lakes in the Hoh Xil region firstly shrank and then expanded. In particular, the area of lakes generally decreased during the 1970s-1990s. Then the lakes expanded from the 1990s to 2000 and the area was slightly higher than that in the 1970s. The area of lakes dramatically increased after 2000. (2) From 2000 to 2011, the lakes with different area ranks in the Hoh Xil region showed an overall expansion trend. Meanwhile, some regional differences were also discovered. Most of the lakes expanded and were widely distributed in the northern, central and western parts of the region. Some lakes were merged together or overflowed due to their rapid expansion. A small number of lakes with the trend of area decrease or strong fluctuation were scattered in the central and southern parts of the study area. And their variations were related to their own supply conditions or hydraulic connection with the downstream lakes or rivers. (3) The increase in precipitation was the dominant factor resulting in the expansion of lakes in the Hoh Xil region. The secondary factor was the increase in meltwater from glaciers and frozen soil due to climate warming.</p>

DOI

31
Yao X J, Liu S Y, Sun M Pet al., 2012. Changes of Kusai Lake in Hoh Xil region and causes of its water overflowing.Acta Geographica Sinica, 67(5): 689-698. (in Chinese)Based on topographic maps, Landsat TM/ETM+ images, China Environment and Hazards Monitoring and Prediction Satellite (HJ1A/B) CCD images and meteorological materials observed at Wudaoliang meteorological station, we explore the change causes of Kusai Lake using geographical information techniques and mathematical statistics method. The results show that water overflowing Kusai Lake occurred in September 20-30 in 2011, and the direct reason was the flood from Zhuonai Lake flowing into Kusai Lake. In addition, Kusai Lake has been growing in recent decades; especially after 2006 it experienced a quick increase that formed the foundation of lake water overflow. The main factor resulting in the flood from Zhuonai Lake was the steady precipitation. Specifically, the heavy precipitation on August 17 and 21 made Zhuonai Lake water outflow on August 22, 2011; then continuous precipitation during August 31 to September 9, 16 and 17 subsequently formed a serious flood from September 14 to 21. Accordingly, there was a sudden drop in area of Zhuonai Lake. As of November 29, the lake decreased to 168.07 km<sup>2</sup> (a reduction of by 104.88 km<sup>2</sup>), accounting for 62% of the area on August 22. The outflow water from Kusai Lake flowed into Haidingnuoer Lake, then into Yanhu Lake. The latter occurred during October 6-20. Due to sudden rapid flow, both Haidingnuoer and Yanhu lakes suffered a quick expansion from October to November, 2011.

32
Zhang Z, Dong Z B, Yan C Zet al., 2015. Change of lake area in the southeastern part of China’s Badain Jaran Sand Sea and its implications for recharge sources.Journal of Arid Land, 7(1): 1-9.Understanding the relationship between the changes in lake water volume and climate change can provide valuable information to the recharge sources of lake water. This is particularly true in arid areas such as the Badain Jaran Sand Sea, an ecologically sensitive area, where the recharge sources of lakes are heatedly debated. In this study, we determined the areas of 50 lakes (representing 70% of the total permanent lakes in this sand sea) in 1967, 1975, 1990, 2000 and 2010 by analyzing remote-sensing images using image processing and ArGIS software. In general, the total lake area decreased from 1967 to 1990, remained almost unchanged from 1990 to 2000, and increased from 2000 to 2010. Analysis of the relationship between these changes and the contemporaneous changes in annual mean temperature and annual precipitation in the surrounding areas suggests that temperature has significantly affected the lake area, but that the influence of precipitation was minor. These results tend to support the palaeo-water recharge hypothesis for lakes of the Badain Jaran Sand Sea, considering the fact that the distribution and area of lakes are closely related to precipitation and the size of megadunes, but the contemporaneous precipitation can hardly balance the lake water.

DOI

33
Zheng M P, Xiang J, ZWei X J et al., 1989. Saline Lakes on the Qinghai-Xizang (Tibet) Plateau. Beijing: Science Press. (in Chinese)

Outlines

/