
Journal of Geographical Sciences >
Estimation of areal precipitation in the Qilian Mountains based on a gridded dataset since 1961
Author: Qiang Fang (1987-), MS Candidate, specialized in global change and sustainable development. E-mail: geoqiangfang@126.com
*Corresponding author: Zhang Mingjun, Professor, E-mail: mjzhang2004@163.com
Received date: 2015-07-29
Accepted date: 2015-08-30
Online published: 2016-01-25
Supported by
National Natural Science Foundation of China, No.41461003
National Basic Research Program of China (973Program), No.2013CBA01801
Copyright
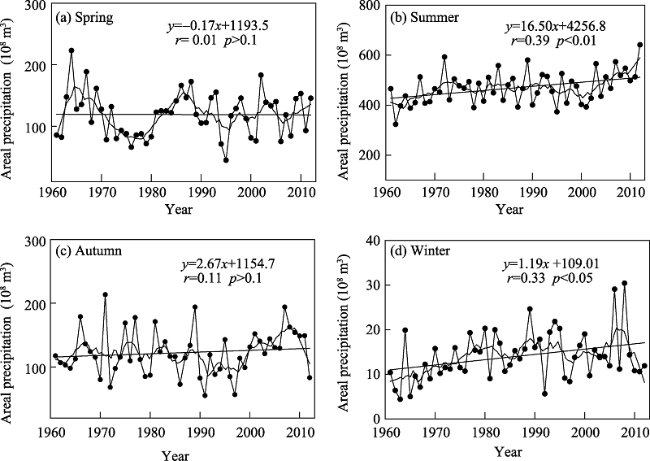
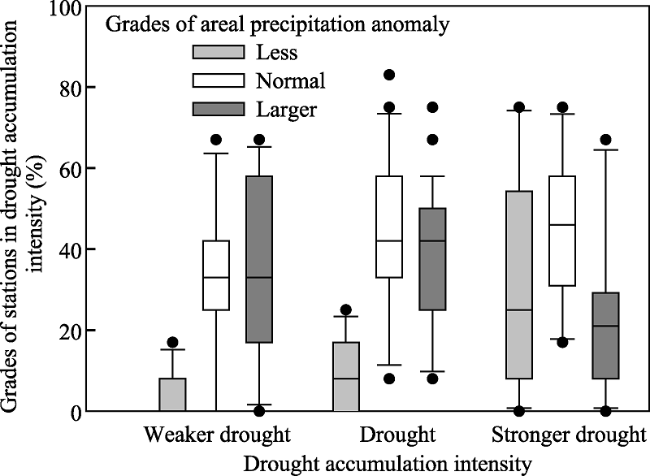
Based on a 0.5°×0.5° daily gridded precipitation dataset and observations in meteorological stations released by the National Meteorological Information Center, the interannual variation of areal precipitation in the Qilian Mountains during 1961-2012 is investigated using principal component analysis (PCA) and regression analysis, and the relationship between areal precipitation and drought accumulation intensity is also analyzed. The results indicate that the spatial distribution of precipitation in the Qilian Mountains can be well reflected by the gridded dataset. The gridded data-based precipitation in mountainous region is generally larger than that in plain region, and the eastern section of the mountain range usually has more precipitation than the western section. The annual mean areal precipitation in the Qilian Mountains is 724.9×10⁸ m3, and the seasonal means in spring, summer, autumn and winter are 118.9×10⁸ m3, 469.4×10⁸ m3, 122.5×10⁸ m3 and 14.1×10⁸ m3, respectively. Summer is a season with the largest areal precipitation among the four seasons, and the proportion in summer is approximately 64.76%. The areal precipitation in summer, autumn and winter shows increasing trends, but a decreasing trend is seen in spring. Among the four seasons, summer have the largest trend magnitude of 1.7×10⁸ m3×a-1. The correlation between areal precipitation in the mountainous region and dry-wet conditions in the mountains and the surroundings can be well exhibited. There is a negative correlation between drought accumulation intensity and the larger areal precipitation is consistent with the weaker drought intensity for this region.
QIANG Fang , *ZHANG Mingjun , WANG Shengjie , LIU Yangmin , REN Zhengguo , ZHU Xiaofan . Estimation of areal precipitation in the Qilian Mountains based on a gridded dataset since 1961[J]. Journal of Geographical Sciences, 2016 , 26(1) : 59 -69 . DOI: 10.1007/s11442-016-1254-7
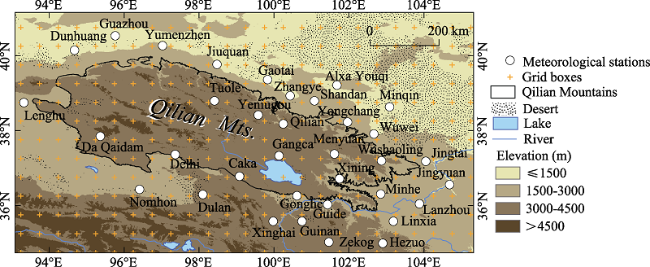
Figure 1 Distribution of observation stations and grid boxes around the Qilian Mountains |
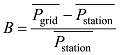
 is the mean value of interpolated data, and
  is the means of observed data.
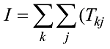
 Tkj|c) (2)
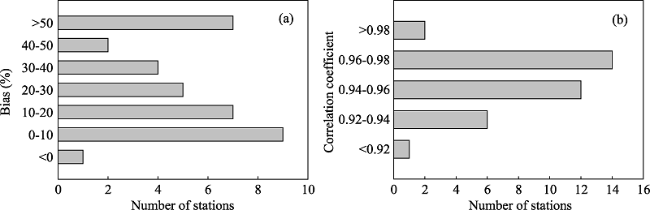
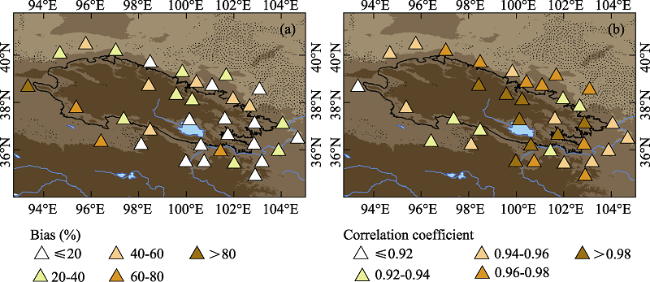
Figure 2 Numbers of stations for different ranges of bias for interpolated precipitation (a) and correlation coefficient between observed and interpolated precipitation (b) in the Qilian Mountains and the surroundings during 1961-2012 |
Figure 3 Spatial distribution of bias for interpolated precipitation (a) and correlation coefficient between observed and interpolated precipitation (b) in the Qilian Mountains and the surroundings during 1961-2012 |
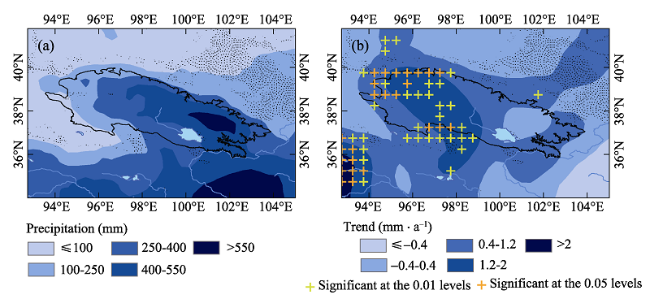
Figure 4 Spatial distribution of annual mean (a) and trend magnitude (b) of gridded precipitation in the Qilian Mountains and the surroundings during 1961-2012 |
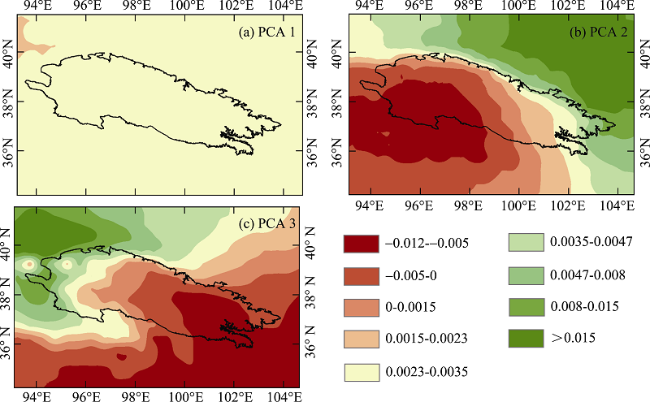
Figure 5 Spatial distribution of result for principal component analysis of gridded precipitation in the Qilian Mountains and the surroundings during 1961-2012 |
Table 1 Result for principal component analysis of gridded precipitation in the Qilian Mountains and the surroundings during 1961-2012 |
| Component | Initial eigen value | ||
|---|---|---|---|
| Amount | Variance contribution (%) | Accumulative (%) | |
| PCA1 | 279.99 | 68.96 | 68.96 |
| PCA2 | 27.42 | 6.75 | 75.72 |
| PCA3 | 25.54 | 6.29 | 82.01 |
Figure 6 Interannual variation of areal precipitation in the Qilian Mountains during 1961-2012 |
Table 2 Decadal mean of annual and seasonal areal precipitation in the Qilian Mountains during 1961-2012 |
| Decade | Areal precipitation (108 m3) | ||||
|---|---|---|---|---|---|
| Spring | Summer | Autumn | Winter | Annual | |
| 1961-1970 | 138.4 | 422.2 | 117.3 | 10.0 | 687.9 |
| 1971-1980 | 86.4 | 470.4 | 123.5 | 14.1 | 694.4 |
| 1981-1990 | 134.4 | 476.6 | 126.5 | 15.4 | 752.9 |
| 1991-2000 | 110.7 | 462.3 | 98.9 | 15.2 | 687.0 |
| 2001-2010 | 124.6 | 494.0 | 147.8 | 16.1 | 782.5 |
| 1961-1986 | 117.3 | 455.8 | 121.1 | 12.5 | 706.7 |
| 1987-2012 | 120.5 | 483.0 | 124.0 | 15.6 | 743.1 |
| 1961-2012 | 118.9 | 469.4 | 122.5 | 14.1 | 724.9 |
| Percentage (%) | 16.40 | 64.76 | 16.90 | 1.94 | |
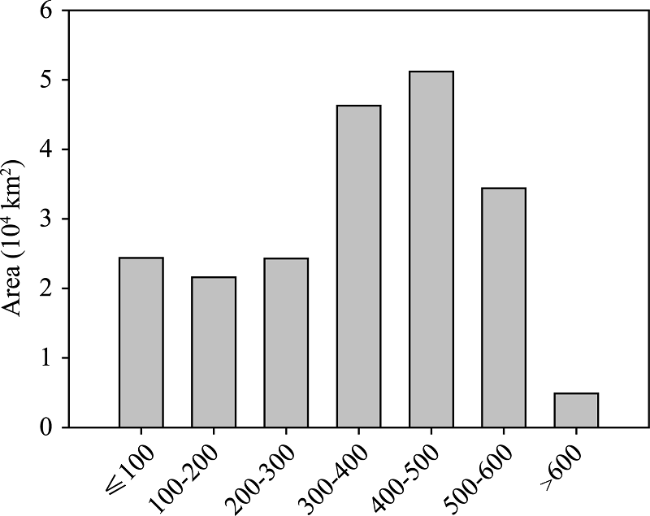
Figure 7 Area distributions for each grade of annual precipitation in the Qilian Mountains |
Figure 8 Relationship between areal precipitation anomaly and drought accumulation intensity in the Qilian Mountains and the surroundings |
The authors have declared that no competing interests exist.
| 1 |
|
| 2 |
|
| 3 |
|
| 4 |
|
| 5 |
|
| 6 |
|
| 7 |
|
| 8 |
|
| 9 |
|
| 10 |
|
| 11 |
|
| 12 |
|
| 13 |
|
| 14 |
|
| 15 |
|
| 16 |
|
| 17 |
|
| 18 |
|
| 19 |
|
| 20 |
|
| 21 |
|
| 22 |
|
| 23 |
|
| 24 |
|
| 25 |
|
| 26 |
|
| 27 |
|
| 28 |
|
| 29 |
|
| 30 |
|
| 31 |
|
| 32 |
|
/
| 〈 |
|
〉 |