
Journal of Geographical Sciences >
Vegetation dynamics in Qinling-Daba Mountains in relation to climate factors between 2000 and 2014
Author: Liu Xianfeng (1986-), PhD Candidate, specialized in resource and environmental remote sensing and disaster remote sensing. E-mail: liuxianfeng7987@163.com
*Corresponding author: Pan Yaozhong (1965-), PhD and Professor, specialized in statistics and disaster remote sensing research. E-mail: pyz@bnu.edu.cn
Received date: 2015-08-03
Accepted date: 2015-08-30
Online published: 2016-01-25
Supported by
Major Project of High-resolution Earth Observation System
Beijing Natural Science Foundation, No.8144052
Copyright
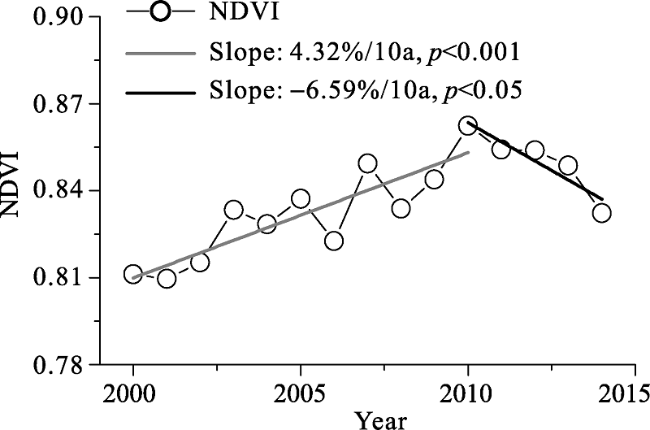
Using the Moderate Resolution Imaging Spectroradiometer-normalized difference vegetation index (NDVI) dataset, we investigated the patterns of spatiotemporal variation in vegetation coverage and its associated driving forces in the Qinling-Daba (Qinba) Mountains in 2000-2014. The Sen and Mann-Kendall models and partial correlation analysis were used to analyze the data, followed by calculation of the Hurst index to analyze future trends in vegetation coverage. The results of the study showed that (1) NDVI of the study area exhibited a significant increase in 2000-2014 (linear tendency, 2.8%/10a). During this period, a stable increase was detected before 2010 (linear tendency, 4.32%/10a), followed by a sharp decline after 2010 (linear tendency, -6.59%/10a). (2) Spatially, vegetation cover showed a “high in the middle and a low in the surroundings” pattern. High values of vegetation coverage were mainly found in the Qinba Mountains of Shaanxi Province. (3) The area with improved vegetation coverage was larger than the degraded area, being 81.32% and 18.68%, respectively, during the study period. Piecewise analysis revealed that 71.61% of the total study area showed a decreasing trend in vegetation coverage in 2010-2014. (4) Reverse characteristics of vegetation coverage change were stronger than the same characteristics on the Qinba Mountains. About 46.89% of the entire study area is predicted to decrease in the future, while 34.44% of the total area will follow a continuously increasing trend. (5) The change of vegetation coverage was mainly attributed to the deficit in precipitation. Moreover, vegetation coverage during La Nina years was higher than that during El Nino years. (6) Human activities can induce ambiguous effects on vegetation coverage: both positive effects (through implementation of ecological restoration projects) and negative effects (through urbanization) were observed.
LIU Xianfeng , ZHU Xiufang , *PAN Yaozhong , LI Shuangshuang , MA Yuqi , Nie Juan . Vegetation dynamics in Qinling-Daba Mountains in relation to climate factors between 2000 and 2014[J]. Journal of Geographical Sciences, 2016 , 26(1) : 45 -58 . DOI: 10.1007/s11442-016-1253-8
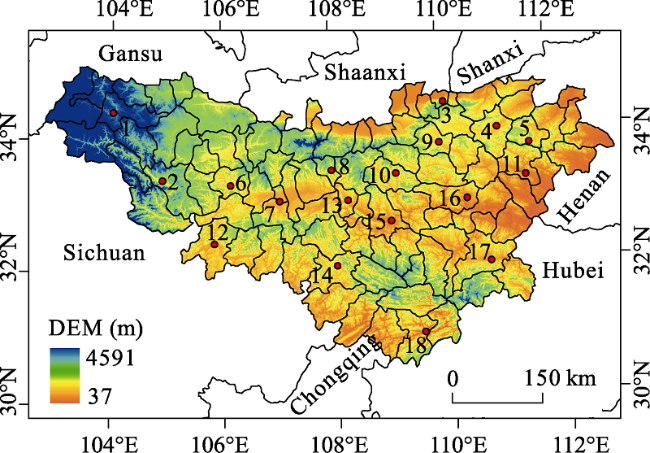
Figure 1 Study area and distribution of meteorological stations in the Qinba Mountains |
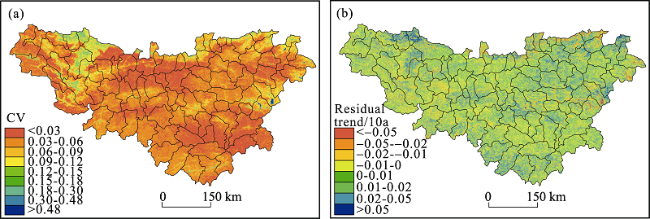
 denotes the average of NDVI during the study period. A higher Cv value denotes the existence of a large fluctuation in the time series and vice versa.
 τ=1, 2, (3)
 1≤t≤τ (4)
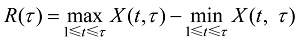 τ=1, 2, … (5)
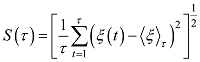 τ=1, 2, … (6)
Figure 2 Temporal variation in vegetation coverage in the Qinba Mountains during 2000-2014 |
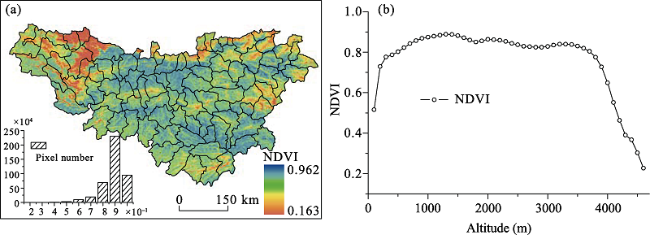
Figure 3 Spatial distribution (a) and altitude-dependent (b) of NDVI on the Qinba Mountains |
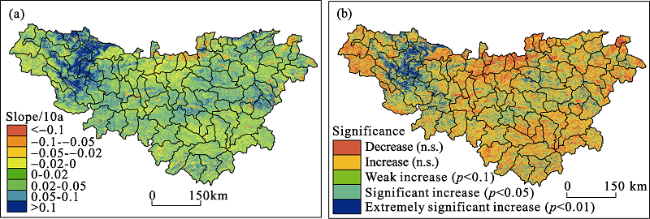
Figure 4 Trend and significance of NDVI on the Qinba Mountains in 2000-2014 |
Table 1 Area and proportion of different vegetation change types on the Qinba Mountains |
| Type | 2000-2014 | 2010-2014 | ||||
|---|---|---|---|---|---|---|
| Pixel number | Percentage/% | Cumulative percentage/% | Pixel number | Percentage /% | Cumulative percentage/% | |
| Decrease | 795821 | 18.68 | 18.68 | 2384471 | 55.96 | 55.96 |
| Weakly significantly decrease | - | - | - | 248378 | 5.83 | 61.78 |
| Significantly increase | - | - | - | 271746 | 6.38 | 68.16 |
| Extremely significantly decrease | - | - | - | 147003 | 3.45 | 71.61 |
| Increase | 1996785 | 46.86 | 65.53 | 1099103 | 25.79 | 97.40 |
| Weakly significantly increase | 474747 | 11.14 | 76.67 | 46298 | 1.09 | 98.49 |
| Significantly increase | 687832 | 16.14 | 92.82 | 43585 | 1.02 | 99.51 |
| Extremely significantly increase | 306127 | 7.18 | 100.00 | 20727 | 0.49 | 100.00 |
Figure 5 Trend and significance of NDVI on the Qinba Mountains in 2000-2014 |
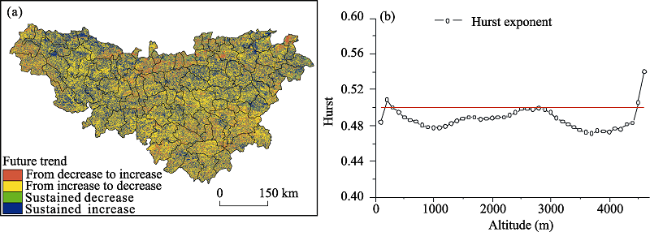
Figure 6 Future trend of NDVI and its difference with altitude on the Qinba Mountains |
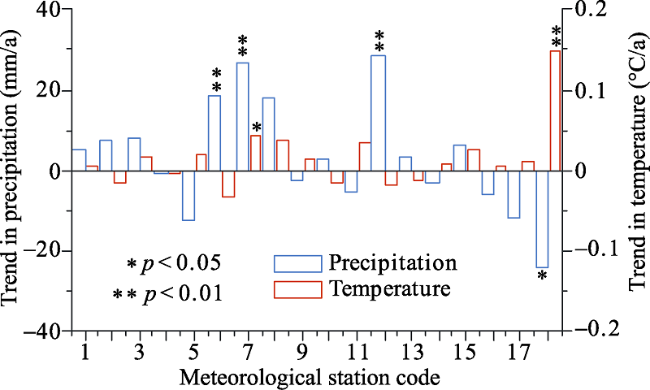
Figure 7 Trend of temperature and precipitation on the Qinba Mountains in 2000-2013 |
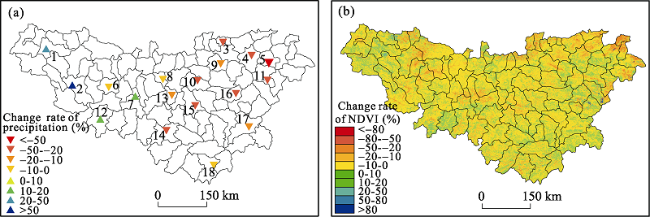
Figure 8 Precipitation deficit (a) and changes in the rate of NDVI (b) in 2010-2014 |
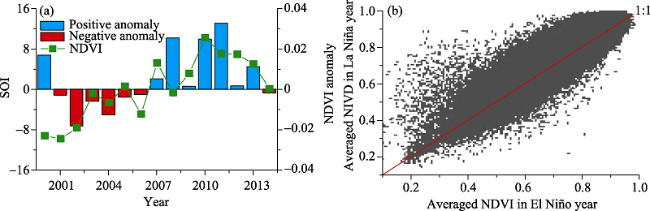
Figure 9 Correlations between NDVI and SOI |
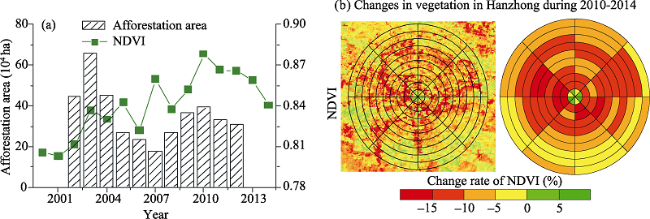
Figure 10 Influence of human activities on vegetation coverage |
The authors have declared that no competing interests exist.
| 1 |
|
| 2 |
|
| 3 |
|
| 4 |
Compiling Committee of National Assessment Report on Climate Change, 2011. Second National Assessment Report on Climate Change. Beijing: Science Press. (in Chinese)
|
| 5 |
|
| 6 |
|
| 7 |
|
| 8 |
|
| 9 |
|
| 10 |
|
| 11 |
|
| 12 |
|
| 13 |
|
| 14 |
|
| 15 |
|
| 16 |
|
| 17 |
|
| 18 |
|
| 19 |
|
| 20 |
|
| 21 |
|
| 22 |
|
| 23 |
|
| 24 |
|
| 25 |
|
| 26 |
|
| 27 |
|
| 28 |
|
| 29 |
|
| 30 |
|
| 31 |
|
| 32 |
|
/
| 〈 |
|
〉 |