Orginal Article

Spatial distribution of maize in response to climate change in northeast China during 1980-2010

  • LI Zhengguo , 1 ,
  • TAN Jieyang 1, 2 ,
  • TANG Pengqin 1 ,
  • CHEN Hao 1 ,
  • ZHANG Li 1 ,
  • LIU Han 2 ,
  • WU Wenbin 1 ,
  • TANG Huajun 1 ,
  • *YANG Peng , 1 ,
  • *LIU Zhenhuan , 3
Expand
  • 1. Chinese Academy of Agricultural Sciences, Key Laboratory of Agri-informatics, Ministry of Agriculture/Institute of Agricultural Resources and Regional Planning, Beijing 100081, China
  • 2. Hunan Academy of Agricultural Sciences, Institute of Agricultural Economics and Regional Planning, Changsha 410125, China
  • 3. Sun Yat-sen University, School of Geography and Planning, Guangzhou 510275, China

Author: Li Zhengguo, PhD and Associate Professor, specialized in remote sensing, climate change and food security. E-mail:

*Corresponding author: Liu Zhenhuan, PhD, E-mail: .Peng Yang, PhD, E-mail:

Received date: 2015-05-20

  Accepted date: 2015-07-28

  Online published: 2016-01-25

Supported by

National Natural Science Foundation of China, No.41171328, No.41201184, No.41101170

Copyright

Journal of Geographical Sciences, All Rights Reserved

Abstract

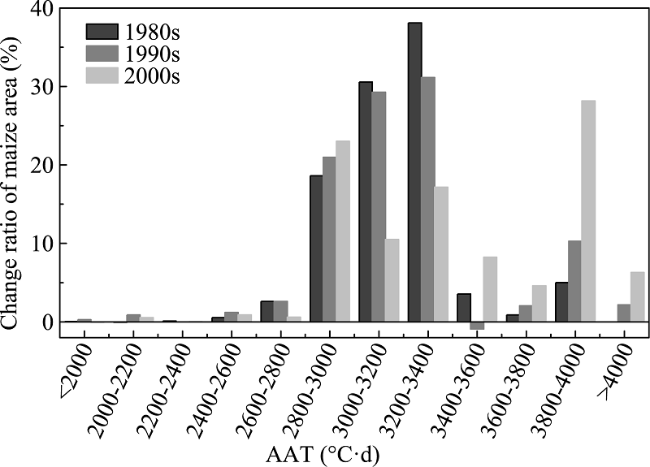
Based on county-level crop statistics and other ancillary information, spatial distribution of maize in the major maize-growing areas (latitudes 39°-48°N) was modelled for the period 1980-2010 by using a cross-entropy-based spatial allocation model. Maize extended as far north as the northern part of the Lesser Khingan Mountains during the period, and the area sown to maize increased by about 5 million ha. More than half of the increase occurred before 2000, and more than 80% of it in the climate transitional zone, where the annual accumulated temperature (AAT) was 2800-3400 °C·d. Regions with AAT of 3800-4000 °C·d became more important, accounting for more than 25% of the increase after 2000. The expansion of maize was thus closely related to warming, although some variation in the distribution was noticed across zones in relation to the warming, indicating that maize in northeast China may have adapted successfully to the warming by adjusting its spatial distribution to match the changed climate.

Cite this article

LI Zhengguo , TAN Jieyang , TANG Pengqin , CHEN Hao , ZHANG Li , LIU Han , WU Wenbin , TANG Huajun , *YANG Peng , *LIU Zhenhuan . Spatial distribution of maize in response to climate change in northeast China during 1980-2010[J]. Journal of Geographical Sciences, 2016 , 26(1) : 3 -14 . DOI: 10.1007/s11442-016-1250-y

1 Introduction

Climate change, through its impacts on agriculture, is expected to affect crop production dramatically and worldwide in the present century (IPCC, 2007; IPCC, 2013). Not all the impacts are likely to be adverse: in fact, crop production may even benefit from future warming if cropping systems are suitably adapted, especially at higher latitudes (De Jong et al., 2001; Robert et al., 2003; Li et al., 2015). Many specific cropping practices have been recommended as active adaptations to warming, such as adjusting crop phenophases, that is the sowing and harvesting dates (Rosenzweig and Hillel, 1998; Lobell et al., 2008; Li et al., 2012), and adopting new cultivars with a longer growing season (Jørgen and Marco, 2002; Ogden and Innes, 2008). Since both climate change and agronomic improvement are long-term and gradual processes, the present crop distribution may reflect an active and gradual adaptation to warming over the past few decades (Lobell et al., 2008; Tao and Zhang, 2010; Yang et al., 2015). A better understanding of such changes in crop distribution as a result of the warming will be useful in making strategic decisions on future crop production and food security (Nicholls, 1997; Piao et al., 2010; Chen et al., 2011; Lobell et al., 2011).
Northeast China (NEC) is one of the most important grain-producing regions of the country and represents more than 8 million ha sown to maize (Zea mays), contributing more than 30% of China’s total maize production (NBSC, 2010). Of all the regions in China, NEC has experienced the obvious increases in temperature (Liu et al., 2004; Chen et al., 2012): the average surface temperature in the region went up at a rate of 0.38°C per decade over the past five decades (Jin et al., 1996; Liu et al., 2009). A sustained increase in temperature over the season is believed to affect the growth, phenophases (that is dates for sowing, seedling emergence, maturity, etc.), and yield of maize (Tao et al., 2008a, 2008b; Chen et al., 2011). Jin et al. (2008) believed that local maize varieties will change from early-maturing ones to mid- and late-maturing ones, with a longer growing season, as a result of climate change in NEC. Relevant studies thus far have shown that over the past 30 years in NEC, the growth period of maize has been advancing (in other words, temperatures of 7°C or above and of 10°C or above are being reached earlier in the year), leading to a higher total annual accumulated temperature (AAT) (Liu et al., 2009; Jia and Guo, 2010; Chen et al., 2012; Li et al., 2014). Earlier studies, which mostly focused on yield, have shown that climate warming may lead to greater maize yields in NEC (Kenny et al., 1993; Carter et al., 1996; Yang et al., 2007; Tao et al., 2008b; Chen et al., 2011; Sun and Huang, 2011; Tao and Zhang, 2011; Chen et al., 2012; Liu Z J et al., 2013). However, a further understanding of how the areas sown to maize have changed—both in terms of their extent and their location—has implications for food security and resource management that are not evident from yield analyses alone. For example, the location and extent of the area under maize are critical to more efficient allocation of natural resources, which are costly, if not impossible, to transport. Infrastructure development helps expand or develop natural resources, and may be either a precursor or a response to changes in the spatial distribution of crops (Li et al., 2015). Such changes with reference to maize may affect, and in turn be affected by, the natural ecosystem as well (Piao et al., 2010). Regional temperature and precipitation patterns may affect such spatial changes, particularly given that nearly all the maize grown in NEC is rain-fed (Tao et al., 2006). Less well understood, however, is the mechanism by which long-term changes in temperature and precipitation drive the changes in the extent and location of maize cultivation.
To investigate the spatio-temporal changes in the distribution of maize cultivation, it is essential to know where and when maize has been grown over the past few decades. Although census-based crop data sets are available, their resolution, even at the county level, is too coarse for detailed spatial analysis (Monfreda et al., 2008). Data from satellite imagery are preferable because of the high spatial resolution and wide spatial and temporal coverage (Xiao et al., 2005). However, satellite images can show only the dominant land-cover category and seldom distinguish between crop over a large region (Ramankutty et al., 2008). Developing spatial datasets of the geographic distribution of crop at the pixel level is essential for studying the changes in spatial distribution of crop in response to warming (You et al., 2009b; Liu Z H et al., 2013). Recently, however, a spatial allocation model has been developed and used for modelling crop distribution over the last few decades at a resolution of 5'' (Tan et al., 2014a; Tan et al., 2014b; Anderson et al., 2015).
In the present study, the area sown to maize across NEC over the period 1980-2010 was modelled to study the spatio-temporal changes in the distribution of maize cultivation and to relate them to global warming to gain useful insights into such changes. A more thorough understanding of the crop’s dynamics will guide policymaking for agriculture not only in China but also in maize-growing areas at higher latitudes worldwide.

2 Study area and materials

2.1 Study area

Northeast China covers 791,800 km², of which cropland occupies 264,400 km², accounting for 16.5% of the total arable land in China (NBSC, 2010). The region plays a vital role in China’s economic development as one of the most important bases of food grains (e.g. maize and rice) and other economic crops (e.g. soybean and sugar beet). Geographically, NEC extends from 118°53′ to 135°05′E and from 38°43′ to 53°33′N and comprises three provinces, namely Heilongjiang, Jilin and Liaoning (Figure 1). Over most of the region, AAT (>0°C) is 2500-4000 °C·d, average summer temperatures are 20-25°C, the frost-free period is 140-170 days, and annual precipitation is 500-800 mm, 60% of which is received mainly during July-September, coinciding with the growing season of maize (Liu et al, 2009). As mentioned earlier, NEC has been undergoing a significant warming over the past few decades: annual sunshine hours have decreased by 40.6 hours per decade over the past five decades (Gao and Liu, 2011), and the daily minimum temperature has risen more sharply than the daily maximum temperature, thus markedly narrowing the diurnal temperature range (Liu Z J et al., 2013).
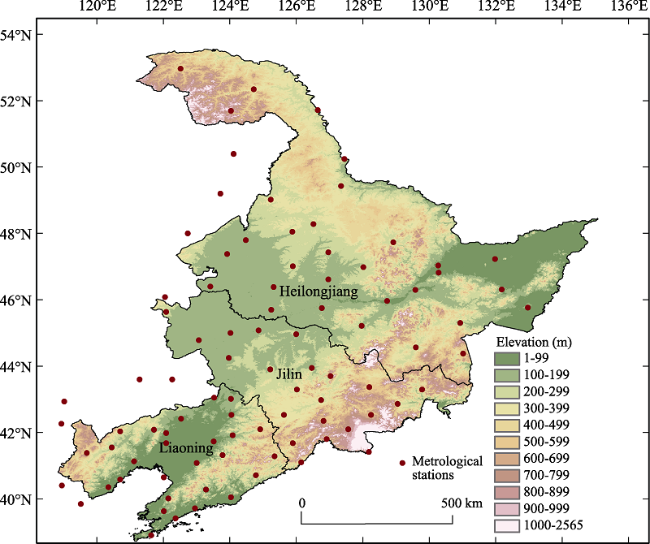
Figure 1 Meteorological stations in northeast China. Red dots represent meteorological stations; the gradient indicates elevation; and black lines mark province boundaries.

2.2 Data used

The relevant meteorological data for the period 1980-2010 were obtained from China Meteorological Administration (CMA, 2010) and came from 84 meteorological stations in NEC and 10 stations in the surrounding area. The dataset contained the daily maximum, minimum, and average temperatures. Data on the sown area under maize in NEC after 1980 were collected from the Planting Information Network of China (PINC, 2010).
In addition, data on national land-use product (NLUD) of China for the 1980s, 1990s, and 2000s were provided by the Chinese Academy of Sciences (CAS), which are also available online as part of the Data Sharing Infrastructure of Earth System Science (www.geodata.cn). This dataset includes 6 land-cover types (forest, grassland, cropland, city, wetland and water, and desert) and 25 subclasses with a resolution of 100 m and is produced from images obtained by remote sensing with a spatial resolution of 30 m, visual interpretation, field surveys, and other auxiliary information (Liu et al., 2002; Zhang et al., 2014).

3 Methods

3.1 Crop data and meteorological data pre-processing

In general, the first day on which the average temperature reaches 7°C is suitable for sowing maize in NEC, and the biological minimum temperature for the growth of maize in this region is 10°C (Jia and Guo, 2010). We defined the first day that recorded a temperature greater than 10°C as the starting date of the growth season and the first day of frost (daily average temperature below 2°C) as the last date, which marked the end of the growth season. When calculating the threshold temperatures (10°C and 2°C) for each station, a 5-day moving average was used. The theoretical dates on which maize was sown and harvested were taken as the days from which the temperatures stabilized above 10°C and below 2°C, respectively, and the number of days between these two dates was defined as the growth period that coincided with the desirable temperatures, i.e. the period over which temperatures were suitable for the growth of maize in a given region. Lastly, we calculated AAT in the growth period thus defined during 1980-2010. For analysing the spatial distribution of AAT, we used inverse distance weighting (IDW) interpolation provided by ArcGIS 10.0 package. Statistical significance was tested by using the two-tailed t-test.

3.2 Mapping the spatial distribution of maize

Recently, some pixel-based crop maps have been developed by combining agricultural inventory data and land-cover data from remote sensing (Monfreda et al., 2008; Ramankutty et al., 2008; Portmann et al., 2010). However, all these maps provide cropping areas at a spatial resolution of 5′ × 5′ in 2000 on a global scale, which is insufficient for dynamic detection and detailed spatial analysis. Therefore, we used the spatial production allocation model (SPAM) developed by the International Food Policy Research Institute (IFPRI) and the Chinese Academy of Agricultural Sciences (CAAS) for mapping the spatial distribution of maize (You et al., 2014; Tan et al., 2014a; Anderson et al., 2015). The input data included county-scale crop production statistics for 1980-2010, maps of irrigated areas, biophysical crop suitability assessments, population density, secondary data on irrigation and rain-fed production systems, cropping intensity, and crop prices. All the information was compiled and integrated to generate ‘prior’ estimates of the spatial distribution of crops. These estimates were then fed into an optimization model that uses cross-entropy principles and accounting constraints for area and yield to allocate crops to individual pixels of a GIS database. The results for each pixel (a grid of 5′ × 5′) represented the areas sown to maize in 1980, 1990, 2000, and 2010.

3.3 Spatial validation of maize distribution

To validate the results from the SPAM maps, they were compared with the NLUD maps for 2005 pixel by pixel as follows (Tan et al., 2014b). (1) Pixels that showed no cropland or crop in both the maps were marked as empty. These pixels indicate areas that were not under cultivation. (2) Pixels with cropland, but not maize (NLUD > 0 and SPAM = 0), were defined as no-existing-maize. These pixels represent cropland that was not under maize, either because some other crop had replaced maize or because cultivation had been abandoned. (3) Pixels allocated to maize but did not correspond to cropland (NLUD = 0 and SPAM > 0) were defined as mis-allocated and thus represent misallocation by SPAM. (4) Pixels allocated more to maize than to cropland (NLUD > 0 and SPAM > 0, but SPAM > NLUD) were defined as overestimated. (5) Pixels with appropriate areas for maize (NLUD > 0, SPAM > 0, and SPAM < NLUD) were defined as those that can be reasonably assumed to have been under maize.

3.4 Zoning of maize maturity types

To understand the spatial variation in maize cultivation in response to warming during 1980-2010, we developed a zoning scheme based on AAT to categorize maize into 6 categories based on the time taken to maturity (Table 1). Two primary categories of the zones were established—stable and transitional—in terms of the response to warming (Figure 2). In the zones with relatively stable thermal conditions, the suitable maturity types remained unchanged: extremely early maturing (EEM), early maturing (EM), early-mid maturing (EMM), mid-maturing (MM), mid-late maturing (MLM), and late maturing (LM). In the transitional zones with a marked rise in temperatures, the suitable maturity types changed because of the warming: they either became unsuitable to extremely-early maturing types (UST→EEM) or switched to late- maturing types, from extremely- early-maturing to early maturing (EEM→EM), from early maturing to mid-maturing (EM→MM), from mid-maturing to mid-late maturing (MM→MLM), and from mid-late maturing to late maturing (MLM→ LM).
Table 1 Maturity types of maize based on annual accumulated temperatures (AAT)
Maturity type AAT (°C·d)
Extremely early maturing (EEM) 2100-2200
Early maturing (EM) 2200-2400
Early-mid maturing (EMM) 2400-2550
Mid-maturing (MM) 2550-2700
Mid-late maturing (MLM) 2700-2800
Late maturing (LM) 2800-3100
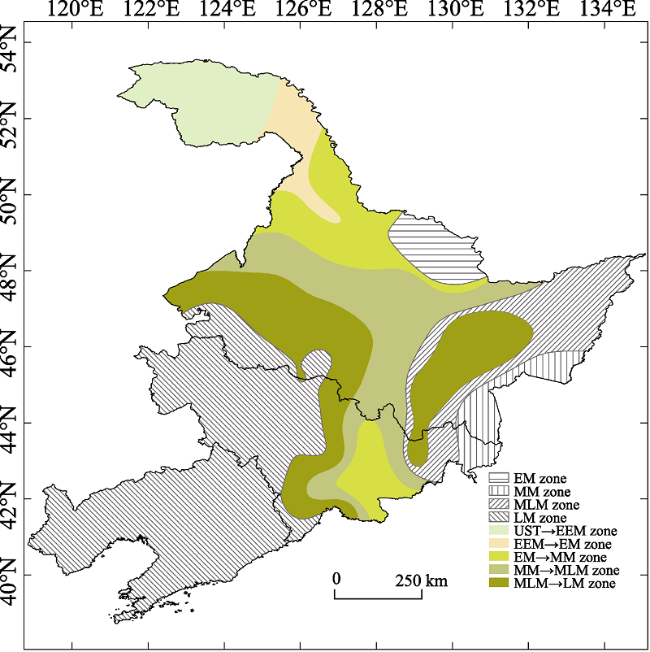
Figure 2 Spatial zoning of maize maturity types during 1980- 2010. Note: Stable climatic zones (shaded part) suited to varieties of maize classified by the temperature taken to reach maturity: (a) early maturing (EM), (b) mid-maturing (MM), (c) mid-late maturing (MLM), and (d) late maturing (LM). Transitional climatic zones (colored part) suited to varieties of maize classified by the temperature taken to reach maturity: (e) unsuitable for cultivation of maize to extremely early maturing (UST→EEM), (f) extremely early maturing to early maturing (EEM→EM), (g) early to mid-maturing (EM→MM), (h) mid- to mid-late maturing (MM→MLM), and (i) mid-late to late maturing (MLM→LM).

4 Results

4.1 Mapping and validation of maize distribution

For validating the results, as mentioned earlier, the areas indicated by SPAM were compared with those in the NLUD-2005 map at the pixel level (Figure 3). Mis-allocated pixels were few, found mostly in the lower Liaohe Plain, and accounted for only 0.58% of the total pixels and only 0.14% of the area indicated by SPAM. The overestimated pixels were distributed sporadically and accounted for 2.39% of the total pixels and 1.96% of the SPAM area. Pixels were reasonable to assume as being under maize by the SPAM results occupied 70.8% of the total pixels and accounted for 97.9% of the SPAM area. Thus, the results confirmed that the areas as identified by SPAM are accurate and the method is suitable for analysing the spatial distribution of maize in NEC.
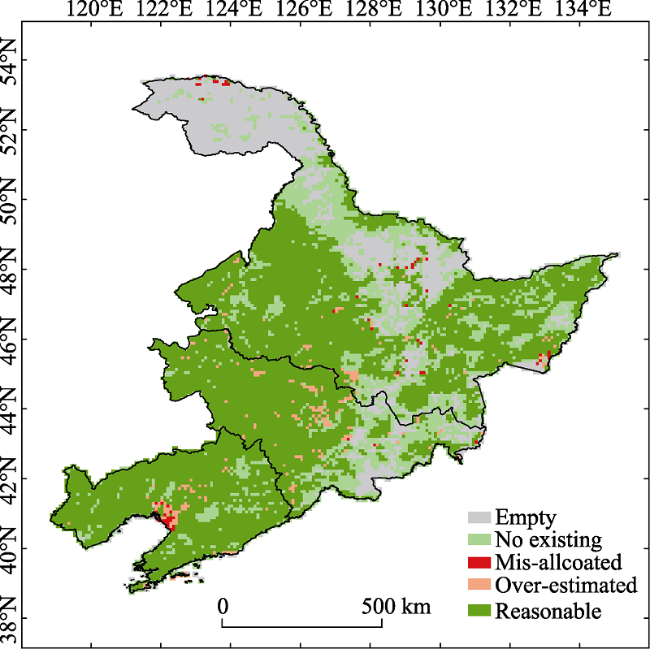
Figure 3 Validation of maize distribution by comparing with the NLUD map in 2005
The results from SPAM for each pixel were used to estimate the change ratio in area under maize in the 1980s, 1990s, and 2000s, that can be found in a previously published paper by Tan et al. (2014a). From 1980 to 2010, at more than 0.16 million ha per year, maize area in NEC increased by about 5 million ha. In the 1980s, regions that recorded a significant increase were mainly concentrated in the eastern part of the Songliao Plain whereas those that recorded a decrease were in the middle-lower Liaohe Plain and the southern part of the Songnen Plain. In the 1990s, the northern part of the Songnen Plain, the southern part of the Lesser Khingan Mountains, and the middle-upper Sanjiang Plain recorded an increase and the northern part of the Liaohe Plain and the western part of the Songnen Plain recorded a significant decrease. Since 2000, areas to the east of the Liaohe Plain, Sanjiang Plain, and the hilly and corridor zones in the western part of Liaoning have recorded an increase and parts of the eastern Songnen Plain and the northern Liaohe Plain have recorded a decrease.

4.2 Variations in the spatial distribution of maize area as linked to changes in temperature

The average values of AAT increased gradually, from 3099 °C·d in the 1980s to 3264 °C·d in the 1990s to 3274 °C·d in the 2000s. The increasing trend was seen at 76 out of 94 stations (close to 90%; P < 0.05; Figure 4). The overall increase was about 95 °C·d whereas the rate of increase per decade ranged from 33 °C·d to 203 °C·d. The most significant increase was in the Songnen Plain and the central Lesser Khingan Mountains. The interpolated values of AAT were grouped into different classes at intervals of 200 °C·d. The number of stations in AAT classes below 2800 °C·d, located mostly in the Songnen and Sanjiang plains, decreased during 1980-2010 whereas that in AAT classes above 3400 increased from 15% to 25%. Across NEC, the number of stations in AAT classes below 2600 °C·d decreased from 20% to 11%.
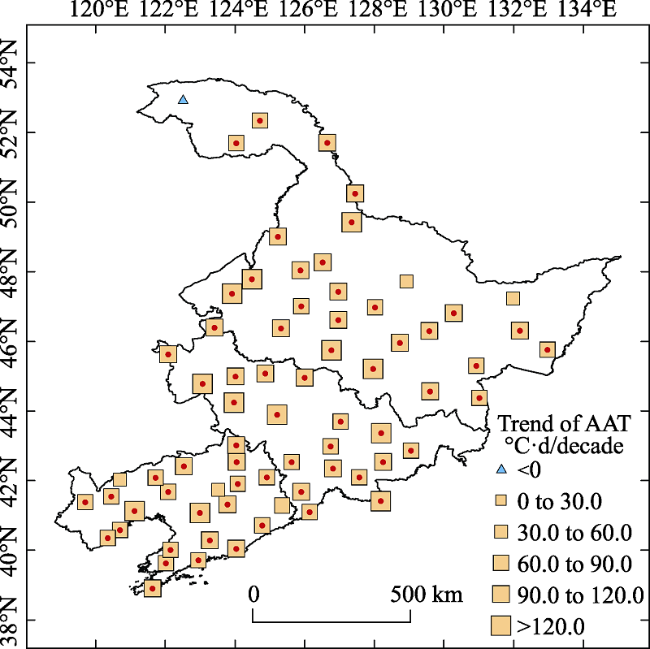
Figure 4 Spatio-temporal changes in AAT during 1980-2010 in NEC. Red dots mark a change significant at 0.05 level.
Changes in the spatial distribution of areas sown to maize and with AAT in the range of 1800-4000 °C·d were analysed at the pixel level for each decade from 1980 to 2010 by summing the areas at intervals of 200°C. More than 95% of the locations that recorded an increase in the area sown to maize were in regions with AAT greater than 2800°C·d (Figure 5). In the regions with AAT from 3000 to 3400 °C·d, although the total area sown to maize increased, the extent of increase over the previous decade showed a declining trend: in the 1980s, the increase was as much as 68.7% but it declined to 60.4% in the 1990s and fell further to 27.7% in the 2000s. In all the other AAT regions, on the other hand, both the total area and the extent of increase over the previous decade showed a rising trend—by 24.5% in the 1980s, 35.5% in the 1990s, and 62.1% for in the 2000s.
Figure 5 Changes in area sown to maize with annual accumulated temperature in the 1980s, 1990s, and 2000s

4.3 Spatial distribution of maize in response to warming

Changes in spatial distribution of maize in response to warming from 1980 to 2010 were analysed by dividing the area under maize into zones based on the temperature taken by the maize varieties to reach maturity (see Table 1 and Figure 2). In the 1980s, the area under maize expanded mostly in the MLM→LM and LM zones, in the central part of Jilin and the southern part of Heilongjiang (Figure 6a). During this period, the total area under maize increased by about 1.3 million ha, in which the contribution of zones with stable thermal conditions was less than 10%; the rest of the expansion came from the MLM→LM transitional zone.
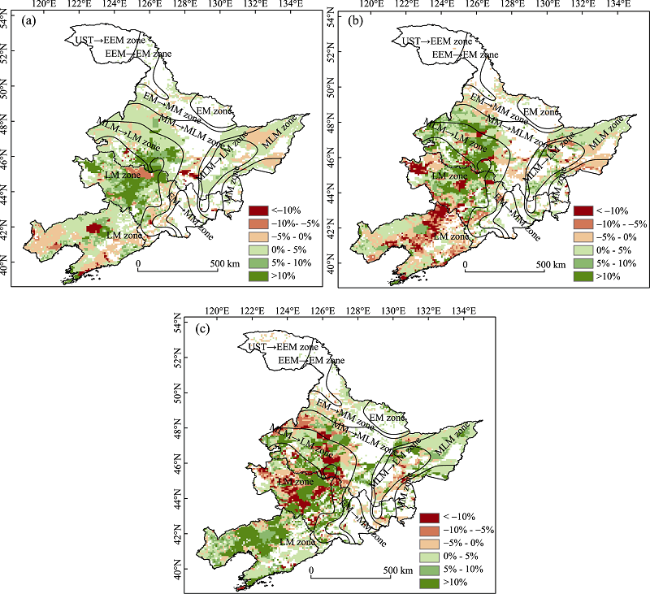
Figure 6 Dynamics of maize spatial distribution in different zones of maize maturity types in the 1980s (a), 1990s (b), and 2000s (c)
During the 1990s, the area under maize increased mostly in the MLM→LM transitional zone in central-southern and eastern parts of Heilongjiang, but also in the MM→MLM transitional zone (Figure 6b). Of the total increase of approximately 0.84 million ha, the stable zones contributed roughly 16.5%; of the rest, the major share was of the MLM→LM transitional zone (63%), and the MM→MLM transitional zone contributed 16.5%.
Since 2000, the area under maize has been expanding rapidly, predominantly in the stable zone, which has contributed 75% of the total increase of about 2.8 million ha (Figure 6c). The major is concentrated in the LM zone in mid-western Liaoning, central Jilin, and eastern Heilongjiang, with the MM→MLM zone contributing 11% and the MLM→LM transitional zone, slightly over 13%. Thus during the last decade the expansion has been faster in the stable zone but slower in the transitional zones.

5 Discussion

The increasingly warmer climate makes it possible to grow new maize cultivars with a longer growing period. The northern limit of late-maturing, mid-late maturing, and mid-maturing cultivars in NEC has been pushed further by more than 150 km, representing a 20%-30% increase in the area, whereas the area suitable for early-maturing cultivars in the north has shrunk and now accounts for less than 10% (Figure 2). Maize cultivation now extends to the northern part of the Lesser Khingan Mountains (Figure 6c), which represent the northern limit for the early-maturing maize cultivars (Liu Z J et al., 2013). More than 80% of the increased area lies where AAT is 2800-3400 °C·d—a clear demonstration of the connection between expansion of the maize-growing area and the rising temperatures (Tao et al., 2008a, 2008b; Yang et al., 2015).
The results also show that in the northern part of NEC, where the increase in temperatures has rendered the area unsuitable for the extremely-early maturing cultivars, they can be replaced with the early-maturing cultivars. The fact that yields of late-maturing cultivars are higher than those of the early-maturing and mid-maturing cultivars has promoted these changes in the spatial distribution of maize. Additionally, farmers have gradually adjusted the sowing and harvesting dates to fully exploit the positive effects of the warmer weather on maize production (Li et al., 2014; Tao et al., 2014). The extended growing period and the expanding area show the agronomic adjustment of maize in NEC. The results also demonstrate that maize-based cropping systems have a great potential to adapt to the ongoing climate change, which may benefit future maize production, especially in northern areas.
The spatial distribution of maize in NEC changed dramatically as a result of climate change during the research period. In particular, we found temperature has a clear spatial influence on the relocation of maize production. Climate warming in the north pushed the maize production frontier northwards and farmers changed their maize cultivars in response to the changing climate. However, the influence of precipitation was less spatially coherent than temperature, because irrigation compensated for rainfall deficiencies. We are aware that the annual precipitation of 400-1000 mm in NEC, although adequate for maize growth and development, is not enough to compensate for the increase in evapotranspiration caused by warming (Tao et al., 2011): if water is insufficient during the growth period of maize, production will be adversely affected in rain-fed areas. Furthermore, a strong annual variation in temperature and precipitation was observed in NEC over the period covered (Chen et al., 2011), which means that extreme weather events (such as very low temperatures and drought) are likely to be more frequent in the region and can limit the area under maize (Liu et al., 2009; Zhang et al., 2012). Further research is therefore required to ascertain the causes of the changes in the spatial distribution of maize to take into account such factors as the impacts of changes in precipitation.

6 Conclusions

This study illustrates the effect of rising temperatures, a part of climate change, on the spatial distribution of maize in NEC from 1980 to 2010. The higher temperatures extended the duration of the growth of maize by advancing the date of sowing and extending the date of harvesting. The changed distribution of maize probably reflects successful adaptation to the warming witnessed over the recent decades. However, the actual expansion in area did not always occur in areas that had recorded higher temperatures. Maize is important and will continue to be important to China’s food security. However, the expansion of area under maize in NEC faces some limitations. For example, expanding it without water management can destroy the ecosystem in surrounding areas. We advise the following research priorities and policy reforms in order to ensure food security.
(1) Reduce the risk of adverse impacts of the changes in temperature by taking suitable proactive adaptation measures such as adjusting the date of sowing and of harvesting, using maize cultivars with greater resistance to high or low temperatures, and adopting better agronomic practices to cope with biotic or abiotic sources of stresses.
(2) Focus on policies that promote more efficient management of water since the resource is limited, and expanding the area under maize may affect the water supplies required for maintaining the ecosystem.
(3) Accord higher priority to, and increase the funding for, more extensive research on the adaptability of agriculture to climate change in general and that of maize-based systems in particular, given the extended lag between investing on agricultural R&D and reaping the benefits from that investment.

The authors have declared that no competing interests exist.

1
Anderson W, You L, Wood Set al., 2015. An analysis of methodological and spatial differences in global cropping systems models and maps.Global Ecology and Biogeography, 24: 180-191.Abstract Aim Agricultural practices have dramatically altered the land cover of the earth, but the spatial extent and intensity of these practices is often difficult to catalogue. Information on the distribution and performance of specific crops is often only available through national or subnational statistics. Recently, however, there have been multiple independent efforts to incorporate the detailed information available from statistical surveys with supplemental spatial information to produce a spatially explicit global dataset specific to individual crops. While these datasets provide decision makers with improved information on global cropping systems, the final global cropping maps differ substantially from one another. This study aims to explore and quantify systematic similarities and differences between four major global cropping systems products and the subsequent implications for analyses dependent on those models. Location This study was conducted at a global scale. Methods Each global cropping systems model was assessed by latitude as a measure of biophysical plausibility and each pair of models was compared using a Gaussian filter to remove trivial spatial discrepancies. Model disagreement was explored in relation to the interdependent input data of each model pair with a particular focus on cropland extent. The influence of the observed model differences on subsequent analyses was demonstrated using model-dependent estimates of the yield gap as an example. Results The results of our analysis indicate that the choice of cropping systems model is non-trivial: considerable differences exist between model-specific estimates of the yield gap across nearly all climate zones and the average model difference exceeds the average estimated yield gap in certain regions. The differences in crop-specific harvested area and yield products of each model are significant, and mostly result from differences in the input datasets and downscaling methodologies. In particular, the choice of dataset on cropland extent proved to be influential regardless of the downscaling process employed. Main conclusions Discrepancies in the final products of cropping systems models are currently poorly understood, but have implications for basic policy decisions relating to agricultural production and food security. The considerable disagreement between models serves as a reminder of the ongoing challenges to the creation of spatially explicit estimates of harvested area and yield based on crop statistics. Our analysis helps shed light on the importance of model choice by demonstrating the implications for further analyses that depend on cropping systems models, and works to overcome these challenges by characterizing model-dependent differences in harvested area and yield.

DOI

2
Carter T, Saarikko R, Niemi K, 1996. Assessing the risks and uncertainties of regional crop potential under a changing climate in Finland.Agricultural and Food Science 3: 329-349.

3
Chen C, Lei C, Deng Aet al., 2011. Will higher minimum temperatures increase corn production in Northeast China? An analysis of historical data over 1965-2008.Agricultural and Forest Meteorology, 151: 1580-1588.Recent crop model projections have shown that crop production may benefit from warming, especially in the high latitudes, but hard evidence is limited. In this study we conducted correlation and regression analyses of climate records of seventy-two meteorological stations and records of corn yield over the period 1965-2008 in Northeast China. It was found that over these forty-four years. the diurnal mean, minimum and maximum temperatures during corn growing season increased on average by 0.31 degrees C, 0.42 degrees C and 0.23 degrees C every ten years, respectively. No significant change in precipitation was found, although differences between years were large. The daily minimum temperature was the dominant factor to corn production. Corn yield was significantly correlated with the daily minimum temperature in May and September. According to a regression analysis of the anomalies of corn yield and air temperature, a 1.0 degrees C increase in daily minimum temperature in May or September will lead to an increment of 303 kg ha(-1) or 284 kg ha(-1) in corn yield, respectively. Corn varieties with longer growth duration will profit most from the climatic changes but agronomic practices may have to be modified to address expected weather extremes such as droughts and periods with heavy rainfall. (C) 2011 Elsevier B.V. All rights reserved.

DOI

4
Chen C, Qian C, Deng Aet al., 2012. Progressive and active adaptations of cropping system to climate change in Northeast China. European Journal of Agronomy, 38: 94-103.To learn the historical response of cropping system to climate change will benefit the strategy decision of future cropping adaptation. In this paper, we conducted an integrated analysis of the climate records of seventy-two meteorological stations and the records of crop yields over the period 1970-2009 in Northeast China. It was found that over these forty years, the daily mean, maximum and minimum temperatures during crop growing season increased on average by 0.34°C, 0.28°C, 0.43 °C every ten years, respectively. No significant change in the precipitation was found, although the differences between years were large. After de-trending the agronomic technique contributions to the increments of crop yields, the historical warming had led to great annually increments of 16.6 kg ha

DOI

5
CMA Archives, .

6
De Jong R, Li K, Bootsma Aet al., 2001. Crop yield variability under climate change and adaptive crop management scenarios, Final Report For Climate Change Action Fund Project A080, Eastern Cereal and Oilseed Research Centre (ECORC), Agric and Agri-Food Canada.

7
Dixon R, Smith J, Guill S, 2003. Life on the edge: Vulnerability and adaptation of african ecosystems to global climate change.Mitigation and Adaptation Strategies for Global Change, 8: 93-113.lt;a name="Abs1"></a>Donor countriesare providing financial and technicalsupport for global climate change countrystudies to help African nations meet theirreporting needs under the United NationsFramework Convention on Climate Change(UNFCCC). Technical assistance to completevulnerability and adaptation assessmentsincludes training of analysts, sharing ofcontemporary tools (e.g. simulationmodels), data and assessment techniques,information-sharing workshops and aninternational exchange programme foranalysts. This chapter summarizes 14African country studies (Botswana, C&ocirc;ted''Ivoire, Egypt, Ethiopia, the Gambia,Kenya, Malawi, Mauritius, Nigeria, SouthAfrica, Tanzania, Uganda, Zambia andZimbabwe) assessing vulnerabilities toglobal climate change and identifyingadaptation options. The analysis revealedthat the participating African countriesare vulnerable to global climate change inmore than one of the followingsocio-economic sectors: coastal resources,agriculture, grasslands and livestock,water resources, forests, wildlife, andhuman health. This vulnerability isexacerbated by widespread poverty,recurrent droughts, inequitable landdistribution, environmental degradation,natural resource mismanagement anddependence on rain-fed agriculture. Arange of practical adaptation options wereidentified in key socio-economic sectors ofthe African nations analysed. However,underdeveloped human and institutionalcapacity, as well as the absence ofadequate infrastructure, renders manytraditional coping strategies (rooted inpolitical and economic stability)ineffective or insufficient. FutureAfrican country studies should be moreclosely coordinated with development ofnational climate change action plans

DOI

8
Dong J, Liu J, Tao Fet al., 2009. Spatio-temporal changes in annual accumulated temperature in China and the effects on cropping systems, 1980s to 2000.climate research, 40: 37-48.Change in thermal conditions can substantially affect crop growth, cropping systems, agricultural production and land use. In the present study, we used annual accumulated temperatures > 10 degrees C (AAT10) as an indicator to investigate the spatio-temporal changes in thermal conditions across China from the late 1980s to 2000, with a spatial resolution of 1 x 1 km. We also investigated the effects of the spatio-temporal changes on cultivated land use and cropping systems. We found that AAT10 has increased on a national scale since the late 1980s, Particularly, 3.16 x 10(5) km(2) of land moved from the spring wheat zone (AAT10: 1600 to 3400 degrees C) to the winter wheat zone (AAT10: 3400 to 4500 degrees C). Changes in thermal conditions had large influences on cultivated land area and cropping systems. The areas of cultivated land have increased in regions with increasing AAT10, and the cropping rotation index has increased since the late 1980s. Single cropping was replaced by 3 crops in 2 years in many regions, and areas of winter wheat cultivation were shifted northward in some areas, such as in the eastern Inner Mongolia Autonomous Region and in western Liaoning and Jilin Provinces.

DOI

9
Gao J, Liu Y, 2011. Climate warming and land use change in Heilongjiang Province, Northeast China.Applied Geography, 31: 476-482.This study explores the relationship between climate warming and rice paddy expansion in Heilongjiang Province of China. It is found that paddy fields more than quadrupled from 3479 km(2) in 1958 to 14 564 km(2) in 1980, and increased further to 21,940 km(2) in 2000. The newly gained paddy fields originated chiefly from dry fields (46.35%), swamps (30.22%), and primary forest (nearly 10%) during 1958-1980. During 1980-2000 paddy fields expanded at the expense of dry fields (70.50%), swamp (16.59%), and grassland (10.13%). Analysis of climate data shows a warming of over 2 degrees C from the 1960s to the 2000s in most places. All 28 meteorological stations except one experienced a warming trend. Spatially, the expansion of paddy fields coincided closely with the spatial distribution of annual temperature. These fields were located mostly between the isolines of 2-3 degrees C. Sowing area of grain increased at a modest rate during the 1970s and the 1980s when >0 degrees C area expanded rapidly. However, sowing area of rice rose in the 1990s and 2000s at a rate twice higher than that for sowing area of grain in the preceding decades. Thus, the expansion of paddy fields at the expense of other land covers was made possible owing to climate warming in the preceding decade. On average, it takes about 20 years for agricultural practices to adapt to the warmer climate. (C) 2010 Elsevier Ltd. All rights reserved.

DOI

10
IPCC (Intergovernmental Panel on Climate Change), 2007. Climate Change 2007: Impacts, Adaptation And Vulnerability. Contribution of Working Group II to the Fourth Assessment Report of the Intergovernmental Panel on Climate Change. Cambridge: Cambridge University Press.

11
IPCC (Intergovernmental Panel on Climate Change), 2013. Climate Change 2013: The Physical Science Basis. Contribution of Working Group I to the Fifth Assessment Report of the Intergovernmental Panel on Climate Change. Cambridge: Cambridge University Press.

12
Jia J, Guo J, 2010. Effects of climate changes on maize yield in Northeast China.Agricultural Science and Technology, 11: 169-174.Based on the meteorological data and production data of maize of 10 stations in Northeast China from 1961 to 2006,the primary climatic factors influencing maize yield in different region were studies by the method of Baier yields models.The result showed that the yield of maize in Heilongjiang and Jilin Province were mainly affected by temperatures,with air temperature increased,the meteorological yield of maize increased.The meteorological yield of maize in Liaoning Province was mainly affected by precipitation and sunshine duration,and different regions had different effects.

13
Jin Z, Ge D, Zheng Xet al., 1996. Assessing the potential impacts of global climate change on maize production in China.Acta Agronomica Sinica, 22: 513-524.

14
Jin Z, Zhu D, 2008. Impacts of changes in climate and its variability on food production in Northeast China.Acta Agronomica Sinica, 34: 1588-1597.Northeast China abounds in soybean (<EM>Glycine max</EM> L.), maize (<EM>Zea mays</EM> L.), wheat (<EM>Triticum aestivum</EM> L.), and rice (<EM>Oryza sativa</EM> L.), and is one of the most susceptive regions to climate change in the country. It has been found an increase in mean annually temperature about 0.34℃ per 10 years in recent 50 years. The probabilities of meteorological disasters, such as drought, flood and cold damages also increase with increasing of climatic variability (CV), which has caused northeast China to be one of regions with the greatest fluctuation in grain yields in China. According to IPCC, the possible increase in mean earth temperature would be 1.8-4.0℃ from now up to the end of this century. Meanwhile, the mean temperature in northeast China would be obviously higher than that of the earth. The air temperature with a doubling of CO<SUB>2</SUB> concentration (555 mmol mol<SUP>-1</SUP>) in future might be 6-7℃ higher than that at present time according to the predictions of 3 GCMs. Therefore, the possible effects of changes in both climate and it variability on food production in the studied region has drawn more attentions of Chinese government and scientists. In this study, 9 scenarios of (CC+ΔCV) involving both climate change (CC) and its variability (ΔCV) were generated at 19 sites in 3 agroecological zones in northeast China using the WGEN as a tool and based on the output of the 3 General Circulation Models (GISS, GFDL, and UKMO GCMs), the local current daily weather data from 1961 to 2000 (Baseline) at each site as well as the 3 hypotheses about the increase in CV in future. Then 4 crop models, i.e., SOYGRO, CERES-Maize, CERES-Wheat, and CERES-Rice in DSSAT were selected as the effect models and their parameter modification, validation and sensitivity analyses were done using the baseline weather, statistical yield data of the 4 crops and the local typical soil data. Finally, the potential impacts of changes in both climate and its variability on the food production in the studied regions with a doubling of CO<SUB>2</SUB> concentration doubled were assessed by running the effect models under both baseline and various (CC+ΔCV) scenarios, and by making comparison between the output simulated. The results showed that the 4 effect models were available in the studied regions and can be used as a tool in climate impact study. Climate change (CC) would be favorable for soybean and rice produc-tion in the studied region, especially in the northern cold zone and eastern wet zone, but unfavorable for both maize and spring wheat, the yields simulated, particularly the maize yield, reduced significantly under all the scenarios. With increasing of CV, not only the yields reduced compared with the control (ΔCV=0), but also the yield stabilities decreased for the rainfed crops, such as soybean, maize and spring wheat. However, there was no influence for the irrigated rice.

DOI

15
Kenny G J, Harrison P A, Olesen J Eet al., 1993. The effects of climate change on land suitability of grain maize, winter wheat and cauliflower in Europe.European Journal of Agronomy, 2: 325-338.A development model was adapted to map the distribution of the cauliflower growing season across Europe. The climate change scenarios showed a progressively earlier start to the growing season, with a shift of up to three months under the GCM 2 x CO 2 scenarios. Significant features were the expansion of the non-viable area in continental Europe, the increase in areas with a mixed season in mid-latitudes and the expansion of areas suitable for winter/spring cropping beyond southern Europe.

DOI

16
Li Z, Liu Z, Anderson Wet al., 2015. Chinese rice production area adaptations to climate changes, 1949-2010.Environmental Science & Technology, 49: 2032-2037.Abstract Climate change has great impact on cropping system. Understanding how the rice production system has historically responded to external forces, both natural and anthropogenic, will provide critical insights into how the system is likely to respond in the future. The observed historic rice movement provides insights into the capability of the rice production system to adapt to climate changes. Using province-level rice production data and historic climate records, here we show that the centroid of Chinese rice production shifted northeastward over 370km (2.98°N in latitude and 1.88°E in longitude) from 1949 to 2010. Using a linear regression model, we examined the driving factors, in particular climate, behind such rice production movement. While the major driving forces of the rice relocation are such social economic factors as urbanization, irrigation investment, and agricultural or land use policy changes, climate plays a significant role as well. We found that temperature has been a significant and coherent influence on moving the rice center in China and precipitation has had a significant but less spatially coherent influence.

DOI PMID

17
Li Z, Tang H, Yang P et al., 2012. Spatio-temporal responses of cropland phenophases to climate change in Northeast China.Journal of Geographical Sciences, 2012, 22(1): 29-45.Abstract<br/><p class="a-plus-plus">We investigated the responses of cropland phenophases to changes of agricultural thermal conditions in Northeast China using the SPOT-VGT Normalized Difference Vegetation Index (NDVI) ten-day-composed time-series data, observed crop phenophases and the climate data collected from 1990 to 2010. First, the phenological parameters, such as the dates of onset-of-growth, peak-of-growth and end-of-growth as well as the length of the growing season, were extracted from the smoothed NVDI time-series dataset and showed an obvious correlation with the observed crop phenophases, including the stages of seedling, heading, maturity and the length of the growth period. Secondly, the spatio-temporal trends of the major thermal conditions (the first date of ⩾ 10°C, the first frost date, the length of the temperature-allowing growth period and the accumulated temperature (AT) of ⩾ 10°C) in Northeast China were illustrated and analyzed over the past 20 years. Thirdly, we focused on the responses of cropland phenophases to the thermal conditions changes. The results showed that the onset-of-growth date had an obvious positive correlation with the first date of ⩾ 10°C (P &lt; 0.01), especially in the northern part of the Songnen Plain, the eastern part of the Sanjiang Plain and the middle and eastern parts of Jilin Province. For the extracted length of growing season and the observed growth period, notable correlations were found in almost same regions (P &lt; 0.05). However, there was no obvious correlation between the end-of-growth date and the first frost date in the study area. Opposite correlations were observed between the length of the growing season and the AT of ⩾ 10°C. In the northern part of the Songnen Plain, the eastern part of the Sanjiang Plain and the middle part of Jilin and Liaoning Provinces, the positive correlation coefficients were higher than the critical value of 0.05, whereas the negative correlation coefficients reached a level of 0.55 (P &lt; 0.05) in the middle and southern parts of Heilongjiang Province and some parts of the Sanjiang Plain. This finding indicated that the crop growth periods were shortened because of the elevated temperature; in contrast, the extended growth period usually meant a crop transformation from early- or middle-maturing varieties into middle or late ones.</p><br/>

DOI

18
Li Z, Yang P, Tang Het al., 2014. Response of maize phenology to climate warming in Northeast China between 1990 and 2012.Regional Environment Change, 14: 39-48.Investigating the temporal changes in crop phenology is essential for understanding crop response and adaption to climate change. Using observed climatic and maize phenological data from 53 agricultural meteorological stations in Northeast China between 1990 and 2012, this study analyzed the spatiotemporal changes in maize phenology, temperatures and their correlations in major maize-growing areas (latitudes 39-48 N) of Northeast China. During the investigation period, seedling and heading dates advanced significantly at 22 out of the 53 stations; maturity dates delayed significantly at 23 stations, and the growing period (GP, from seedling to maturity), the vegetative growing period (VGP, from seedling to heading) and the reproductive growing period (RGP, from heading to maturity) increased significantly at 30 % of the investigated stations. GP length was positively correlated with T at 40 stations and significantly at 10 stations ( P < 0.01). Both negative and positive correlations were found between VGP and T, while RGP length was significantly and positively correlated with T. The results indicated that agronomic factors contribute substantially to the shift in maize phenology and that most farmers had adopted longer season cultivars because the increase in temperature provided better conditions for maize germination, emergence and grain filling. The findings on the various changes to maize phenology can help climate change impact studies and will enable regional maize production to cope with ongoing climate change.

DOI

19
Liu B, Xu M, Henderson Met al., 2004. Taking China’s temperature: Daily range, warming trends, and regional variations, 1955-2000. Journal of Climate, 17: 4453-4462.

20
Liu J, Liu M, Deng Xet al., 2002. The land use and land cover change database and its relative studies in China.Journal of Geographical Sciences, 12(2): 275-282.In the mid-1990s, we established the national operative dynamic information serving systems on natural resources and environment. During building the land-use/land-cover change (LUCC)database for the mid-1990s, 520 scenes of remotely sensed images of Landsat Thematic Mapper (TM) were interpreted into land-use/land-cover categories at scale of 1:100,000 under overall digital software environment after being geo-referenced and ortho-rectified. The vector map of land-use/land-cover in China at the scale of 1:100,000 was recently converted into a 1-km raster database that captures all ofthe high-resolution land-use information by calculating area percentage for each kind of land use category within every cell. Being designed as an operative dynamic information serving system,monitoring the change in land-use/land-cover at national level was executed. We have completed the updating of LUCC database by comparing the TM data in the mid-1990s with new data sources received during 1999-2000 and 1989-1990. The LUCC database has supported greatly the national LUCC research program in China and some relative studies are incompletely reviewed in this paper.

DOI

21
Liu Z, Yang X, Wang Wet al., 2009. Characteristics of agricultural climate resources in three provinces of Northeast China under global climate change.Chinese Journal of Applied Ecology, 20(9): 2199-2206. (in Chinese)<p>Based on the 1961〖KG-*2〗-〖KG-*7〗2007 weather data from 72 meteorol<br />ogical stations in three provinces of Northeast China, the change characteristic<br />s of agricultural climatic factors including yearly and temperature-defined growing season&rsquo;s&nbsp; mean air<br />&nbsp;temperature, &ge;10 ℃ accumulated temperature, precipitation, reference evapotranspiration, and sunshine hours were analyzed. In 1961〖KG-*2〗-〖KG-*7〗2007, the<br />&nbsp;yearly mean air temperature in the three provinces had an increasing trend, wit<br />h a rate of 038 ℃&middot;10 a-1. The &ge;10 ℃ accumulated temperature in temperature-defined growing season also had an increasing trend, and the border of &ge;10 ℃ accumulated temperature belt moved northward and eastward. The area of &ge;3200 ℃&middot;d accumulated temperature increased by 22&times;104 km2. The belt of 2800〖KG-*2〗-〖KG-*7〗320<br />0 ℃&middot;d moved northward about 085&deg; and eastward about 067&deg; while that o<br />f 2400〖KG-*2〗-〖KG-*7〗2800 ℃&middot;d moved northward about 11&deg;. The sunshine h<br />ours decreased significantly, especially in the east part of Songnen Plain, cent<br />ral and west plains of Jilin Province, and west part of Liaohe River Plain. The ar<br />ea with sunshine hours &gt; 2800 h decreased from 136&times;104 km2 to 41&times;104<br />&nbsp;km2, and the zone with sunshine hours 2600〖KG-*2〗-〖KG-*7〗2800 h moved wes<br />tward about 15&deg;. The average sunshine hour in temperature-defined growing season was 1174 h. Comparing with that in 1961〖KG-*2〗-〖KG-*7〗1980, the region with more sunshine <br />hours in temperature-defined growing season in 1981〖KG-*2〗-〖KG-*7〗2007 narrowed significan<br />tly, and the zone with sunshine hours 1200〖KG-*2〗-〖KG-*7〗1400 h moved westwa<br />rd about 09&deg;. In 1961〖KG-*2〗-〖KG-*7〗2007, both the yearly and the <br />temperature-defined growing season&rsquo;s precipitation decreased, and the yearly reference evapotranspiration i<br />ncreased in Heilongjiang Province and in the eastern mountain areas of Jilin Pro<br />vince but decreased in the central and west plains of Jilin Province and in Liao<br />ning Province. Comparing with that in 1961〖KG-*2〗-〖KG-*7〗1980, the zone of r<br />eference evapotranspiration with the value of &ge;900 mm in 1981〖KG-*2〗-〖KG-*7<br />〗2007 moved westward about 1&deg; and the reference evapotranspiration in <br />temperature-defined growing season increased in most regions of Heilongjiang and Jilin Province but decrease<br />d in a rate of 0〖KG-*2〗-〖KG-*7〗14 mm&middot;10 a-1 in most regions of Liaoni<br />ng Province.</p>

22
Liu Z H, Li Z, Tang P et al., 2013. Changes analysis of rice area and production in China during the past three decades. Journal of Geographical Sciences, 2013, 23(6): 1005-1018.Abstract<br/><p class="a-plus-plus">Rice’s spatial-temporal distributions, which are critical for agricultural, environmental and food security research, are affected by natural conditions as well as socio-economic developments. Based on multi-source data, an effective model named the Spatial Production Allocation Model (SPAM) which integrates arable land distribution, administrative unit statistics of crop data, agricultural irrigation data and crop suitability data, was used to get a series of spatial distributions of rice area and production with 10-km pixels at a national scale — it was applied from the early 1980s onwards and used to analyze the pattern of spatial and temporal changes. The results show that significant changes occurred in rice in China during 1980–2010. Overall, more than 50% of the rice area decreased, while nearly 70% of rice production increased in the change region during 1980–2010. Spatially, most of the increased area and production were in Northeast China, especially, in Jilin and Heilongjiang; most of the decreased area and production were located in Southeast China, especially, in regions of rapidly urbanization in Guangdong, Fujian and Zhejiang. Thus, the centroid of rice area was moved northeast approximately 230 km since 1980, and rice production about 320 km, which means rice production moved northeastward faster than rice area because of the significant rice yield increase in Northeast China. The results also show that rice area change had a decisive impact on rice production change. About 54.5% of the increase in rice production is due to the expansion of sown area, while around 83.2% of the decrease in rice production is due to contraction of rice area. This implies that rice production increase may be due to area expansion and other non-area factors, but reduced rice production could largely be attributed to rice area decrease.</p><br/>

DOI

23
Liu Z J, Yang X, Chen Fet al., 2013. The effects of past climate change on the northern limits of maize planting in Northeast China.Climatic Change, 117: 891-902.Northeast China (NEC) is one of the major agricultural production areas in China and also an obvious region of climate warming. We were motivated to investigate the impacts of climate warming on the northern limits of maize planting. Additionally, we wanted to assess how spatial shifts in the cropping system impact the maize yields in NEC. To understand these impacts, we used the daily average air temperature data in 72 weather stations and regional experiment yield data from Jilin Province. Averaged across NEC, the annual air temperature increased by 0.38 A degrees C per decade. The annual accumulated temperature above 10 A degrees C (AAT10) followed a similar trend, increased 66 A degrees C d per decade from 1961 to 2007, which caused a northward expansion of the northern limits of maize. The warming enabled early-maturing maize hybrids to be sown in the northern areas of Heilongjiang Province where it was not suitable for growing maize before the warming. In the southern areas of Heilongjiang Province and the eastern areas of Jilin Province, the early-maturing maize hybrids could be replaced by the middle-maturing hybrids with a longer growing season. The maize in the northern areas of Liaoning Province was expected to change from middle-maturing to late-maturing hybrids. Changing the hybrids led to increase the maize yield. When the early-maturing hybrids were replaced by middle-maturing hybrids in Jilin Province, the maize yields would increase by 9.8 %. Similarly, maize yields would increase by 7.1 % when the middle-maturing hybrids were replaced by late-maturing hybrids.

DOI

24
Lobell D B, Burke M B, Tebaldi Cet al., 2008. Prioritizing climate change adaptation needs for food security in 2030.Science, 319: 607-610.

25
Lobell D B, Schlenker W, Costa-Roberts J, 2011. Climate trends and global crop production since 1980.Science, 333: 616-620.Efforts to anticipate how climate change will affect future food availability can benefit from understanding the impacts of changes to date. We found that in the cropping regions and growing seasons of most countries, with the important exception of the United States, temperature trends from 1980 to 2008 exceeded one standard deviation of historic year-to-year variability. Models that link yields of the four largest commodity crops to weather indicate that global maize and wheat production declined by 3.8 and 5.5%, respectively, relative to a counterfactual without climate trends. For soybeans and rice, winners and losers largely balanced out. Climate trends were large enough in some countries to offset a significant portion of the increases in average yields that arose from technology, carbon dioxide fertilization, and other factors.

DOI PMID

26
Monfreda C, Ramankutty N, Foley J A, 2008. Farming the planet: 2. Geographic distribution of crop areas, yields, physiological types, and net primary production in the year 2000.Global Biogeochemical Cycles, 22: B1022.

27
NBSC (National Bureau of Statistics of China), 2010. Statistical Yearbook of China 2010. Beijing: China Statistics Press. (in Chinese)

28
Nicholls N, 1997. Increased Australian wheat yield due to recent climate trends.Nature, 387: 484-485.Estimates the contribution of climate trends in Australia to the substantial increase in Australian wheat yields since 1952. How non-climatic influences were removed from the equation; The applicability of the approach in other regions.

DOI

29
Ogden A E, Innes J L, 2008. Climate change adaptation and regional forest planning in southern Yukon, Canada.Mitigation and Adaptation Strategies for Global Change, 13: 833-861.lt;a name="Abs1"></a>Recent interest in sustainable forest management planning in the Yukon has coincided with growing public awareness of climate change, providing an opportunity to explore how forestry plans are incorporating climate change. In this paper, the Strategic Forest Management Plans for the Champagne and Aishihik First Nations Traditional Territory (CATT) and the Teslin Tlingit Traditional Territory (TTTT) are examined for evidence of adaptation to climate change. For each plan, management policies and practices that are also recognized as ways to adapt to climate change are identified to provide information on the incremental costs and benefits of additional adaptation efforts. A typology for classifying sustainable forest management plans according to how they address climate change is proposed and applied to the CATT and TTTT plans. This typology, which may be useful to any future retrospective assessments on how successful these or other sustainable forest management plans have been in addressing and managing the risks posed by climate change, consists of a matrix that categorizes plans into one of four types; (1) proactive-direct, (2) proactive-indirect, (3) reactive-direct, and (4) reactive-indirect. Neither of the plans available for the southern Yukon explicitly identifies climate change vulnerabilities and actions that will be taken to reduce those vulnerabilities and manage risks. However, both plans have incorporated some examples of &#8216;best management practices&#8217; for sustainable forest management that are also consistent with appropriate climate adaptation responses. Even in a jurisdiction facing rapid ecological changes driven by climate change, where there is a relatively high level of awareness of climate change and its implications, forestry planning processes have yet to grapple directly with the risks that climate change may pose to the ability of forest managers to achieve the stated goals and objectives of sustainable forest management plans.

DOI

30
Olesen J E, Bindi M, 2002. Consequences of climate change for European agricultural productivity, land use and policy.European Journal of Agronomy, 16: 239-262.lt;h2 class="secHeading" id="section_abstract">Abstract</h2><p id="">This paper reviews the knowledge on effects of climate change on agricultural productivity in Europe and the consequences for policy and research. Warming is expected to lead to a northward expansion of suitable cropping areas and a reduction of the growing period of determinate crops (e.g. cereals), but an increase for indeterminate crops (e.g. root crops). Increasing atmospheric CO<sub>2</sub> concentrations will directly enhance plant productivity and also increase resource use efficiencies.</p><p id="">In northern areas climate change may produce positive effects on agriculture through introduction of new crop species and varieties, higher crop production and expansion of suitable areas for crop cultivation. Disadvantages may be an increase in the need for plant protection, the risk of nutrient leaching and the turnover of soil organic matter. In southern areas the disadvantages will predominate. The possible increase in water shortage and extreme weather events may cause lower harvestable yields, higher yield variability and a reduction in suitable areas for traditional crops. These effects may reinforce the current trends of intensification of agriculture in northern and western Europe and extensification in the Mediterranean and southeastern parts of Europe.</p><p id="">Policy will have to support the adaptation of European agriculture to climate change by encouraging the flexibility of land use, crop production, farming systems etc. In doing so, it is necessary to consider the multifunctional role of agriculture, and to strike a variable balance between economic, environmental and social functions in different European regions. Policy will also need to be concerned with agricultural strategies to mitigate climate change through a reduction in emissions of methane and nitrous oxide, an increase in carbon sequestration in agricultural soils and the growing of energy crops to substitute fossil energy use. The policies to support adaptation and mitigation to climate change will need to be linked closely to the development of agri-environmental schemes in the European Union Common Agricultural Policy.</p><p id="">Research will have further to deal with the effect on secondary factors of agricultural production, on the quality of crop and animal production, of changes in frequency of isolated and extreme weather events on agricultural production, and the interaction with the surrounding natural ecosystems. There is also a need to study combined effects of adaptation and mitigation strategies, and include assessments of the consequences on current efforts in agricultural policy to develop a sustainable agriculture that also preserves environmental and social values in the rural society.</p>

DOI

31
Piao S, Ciais P, Huang Yet al., 2010. The impacts of climate change on water resources and agriculture in China.Nature, 467: 43-51.China is the world's most populous country and a major emitter of greenhouse gases. Consequently, much research has focused on China's influence on climate change but somewhat less has been written about the impact of climate change on China. China experienced explosive economic growth in recent decades, but with only 7% of the world's arable land available to feed 22% of the world's population, China's economy may be vulnerable to climate change itself. We find, however, that notwithstanding the clear warming that has occurred in China in recent decades, current understanding does not allow a clear assessment of the impact of anthropogenic climate change on China's water resources and agriculture and therefore China's ability to feed its people. To reach a more definitive conclusion, future work must improve regional climate simulations-especially of precipitation-and develop a better understanding of the managed and unmanaged responses of crops to changes in climate, diseases, pests and atmospheric constituents.

DOI PMID

32
PINC Archives, .

33
Portmann F T, Siebert S, Döll P, 2010. MIRCA2000: Global monthly irrigated and rainfed crop areas around the year 2000: A new high-resolution data set for agricultural and hydrological modeling.Global Biogeochemical Cycles, 24: B1011.

34
Ramankutty N, Evan A T, Monfreda Cet al., 2008. Farming the planet: 1. Geographic distribution of global agricultural lands in the year 2000. Global Biogeochemical Cycles, 22: B1003.Agricultural activities have dramatically altered our planet's land surface. To understand the extent and spatial distribution of these changes, we have developed a new global data set of croplands and pastures circa 2000 by combining agricultural inventory data and satellite-derived land cover data. The agricultural inventory data, with much greater spatial detail than previously available, is used to train a land cover classification data set obtained by merging two different satellite-derived products (Boston University's MODIS-derived land cover product and the GLC2000 data set). Our data are presented at 5 min (~10 km) spatial resolution in longitude by longitude, have greater accuracy than previously available, and for the first time include statistical confidence intervals on the estimates. According to the data, there were 15.0 (90% confidence range of 12.2-17.1) million kmof cropland (12% of the Earth's ice-free land surface) and 28.0 (90% confidence range of 23.6-30.0) million kmof pasture (22%) in the year 2000.

DOI

35
Sun W, Huang Y, 2011. Global warming over the period 1961-2008 did not increase high-temperature stress but did reduce low-temperature stress in irrigated rice across China.Agricultural and Forest Meteorology, 151: 1193-1201.

36
Tan J, Yang P, Liu Zet al., 2014a. Spatio-temporal dynamics of maize cropping system in Northeast China between 1980 and 2010 by using spatial production allocation model.Journal of Geographical Sciences, 24(3): 397-410.<p>Understanding crop patterns and their changes on regional scale is a critical requirement for projecting agro-ecosystem dynamics. However, tools and methods for mapping the distribution of crop area and yield are still lacking. Based on the cross-entropy theory, a spatial production allocation model (SPAM) has been developed for presenting spatio-temporal dynamics of maize cropping system in Northeast China during 1980-2010. The simulated results indicated that (1) maize sown area expanded northwards to 48&deg;N before 2000, after that the increased sown area mainly occurred in the central and southern parts of Northeast China. Meanwhile, maize also expanded eastwards to 127&deg;E and lower elevation (less than 100 m) as well as higher elevation (mainly distributed between 200 m and 350 m); (2) maize yield has been greatly promoted for most planted area of Northeast China, especially in the planted zone between 42&deg;N and 48&deg;N, while the yield increase was relatively homogeneous without obvious longitudinal variations for whole region; (3) maize planting density increased gradually to a moderately high level over the investigated period, which reflected the trend of aggregation of maize cultivation driven by market demand.</p>

DOI

37
Tan J, Li Z, Yang Pet al., 2014b. Spatial evaluation of crop maps by the spatial production allocation model in China.Journal of Applied Remote Sensing, 8: 85197.

38
Tao F, Hayashi Y, Zhang Zet al., 2008a. Global warming, rice production, and water use in China: Developing a probabilistic assessment.Agricultural and Forest Meteorology, 148: 94-110.Uncertainties in global climate models (GCMs) and emission scenarios affect assessments of the impact of global warming as well as the communication of scientific results. Here, we developed a probabilistic technique to deal with the uncertainties and to simulate the impact of global warming on rice production and water use in China, against a global mean temperature (GMT) increase scale relative to 1961–1990 values. From 20 climate scenarios output from the Intergovernmental Panel on Climate Change Data Distribution Centre, we used Monte Carlo analysis to develop the most likely climate-change scenarios for representative stations and derived the CERES-Rice model of [Alocilja, E.C., Ritchie, R.T., 1988. Rice simulation and its use in multicriteria optimization, IBSNAT Research Report Series 01] to simulate rice production under baseline and future climate scenarios. Adaptation options such as automatic application of irrigation and fertilization were considered, although cultivars were assumed constant over the baseline and future. After assessing representative stations across China, we projected changes in rice yield, growing period, evapotranspiration, and irrigation-water use for GMT changes of 1, 2, and 3°C in a probabilistic way. Without consideration of CO 2 -fertilization effects, our results indicate that the growing period would shorten with 100% probability; yield would decrease with a probability of 90%, 100%, and 100% for GMT change of 1, 2, and 3°C, respectively. The median values of yield decrease ranged from 6.1% to 18.6%, 13.5% to 31.9%, and 23.6% to 40.2% for GMT changes of 1, 2, and 3°C, respectively. According to the median values of the projected changes, evapotranspiration and irrigation water use would decrease in most of the investigated stations. If CO 2 -fertilization effects were included, the rice growing period would also be reduced with 100% probability; across the stations the median values of yield changes ranged from 6110.1% to 3.3%, 6116.1% to 2.5%, and 6119.3% to 0.18% for GMT changes of 1, 2, and 3°C, respectively. Evapotranspiration and irrigation water use would decrease more and with higher probability in comparison with the simulations without consideration of CO 2 -fertilization effects. Our study presents a process-based probabilistic assessment of rice production and water use at different GMT increases, which is important for identifying which climate-change level is dangerous for food security.

DOI

39
Tao F, Yokozawa M, Liu Jet al., 2008b. Climate-crop yield relationships at provincial scales in China and the impacts of recent climate trends.Climate Research, 38: 83-94.Understanding climate-yield relationships and the impacts of recent climate trends on crop productivity on a large scale is an important step in predicting regional agricultural production. In this study we investigated climate-crop relationships, recent trends in seasonal climate (maximum and minimum temperatures, diurnal temperature range and precipitation) and their impacts on the yields of major crops (i.e. rice, wheat, maize and soybean) at provincial scales throughout China over the last few decades. We found that major crop yields were significantly related to growing season climate in the main production regions of China, and that growing season temperature had a generally significant warming trend. Due to the trends in growing season climate, total rice production in China was estimated to have increased by 3.2 x 10(5) t decade(-1) during the period 1951-2002; total production of wheat, maize and soybean changed by -1.2 x 10(5), -21.2 x 10(5) and 0.7 x 10(5) t decade(-1), respectively, during 1979-2002. The warming trend increased rice yield in northeast China and soybean in north and northeast China; however, it decreased maize yield in 7 provinces (autonomous region or municipality) and wheat yield in 3 provinces. Our analysis presents the general response patterns of regional agricultural productivity to seasonal climate variability and change over the last few decades. Crop response mechanisms to local seasonal climate change (and variability) need further investigation to better understand the patterns and predict future consequences of climate change and variability on regional agricultural production.

DOI

40
Tao F, Yokozawa M, Xu Yet al., 2006. Climate changes and trends in phenology and yields of field crops in China, 1981-2000.Agricultural and Forest Meteorology, 138: 82-92.A warming trend has become pronounced since the 1980s in China and is projected to accelerate in the future. Concerns about the vulnerability of agricultural production to climate change are increasing. The impact of future climate change on crop production has been widely predicted by using crop models and climate change scenarios, but little evidence of the observed impacts of climate change on crop production has been reported. In this study, we synthesized crop and climate data from representative stations across China during 1981-2000 to investigate whether there were significant trends in changes of climate variables in different regions, and whether theses changes have had significant impact on the development and production of the staple crops (i.e. rice, wheat, and maize). Our results showed that significant warming trends were observed at most of the investigated stations, and the changes in temperature have shifted crop phenology and affected crop yields during the two decades. The observed climate change patterns, as well their impacts on crop phenology and yields are spatially diverse across China. Our study also highlights the need for further investigations of the combined impacts of temperature and CO

DOI

41
Tao F, Zhang S, Zhang Zet al., 2014. Maize growing duration was prolonged across China in the past three decades under the combined effects of temperature, agronomic management, and cultivar shift.Global Change Biology, 20: 3686-3699.

42
Tao F, Zhang Z, 2010. Adaptation of maize production to climate change in North China Plain: Quantify the relative contributions of adaptation options.European Journal of Agronomy, 33: 103-116.lt;h2 class="secHeading" id="section_abstract">Abstract</h2><p id="">Adaptation is a key factor that will shape the future severity of climate change impacts on food production. We need to evaluate the relative potential of adaptation strategies, and to develop effective adaptation strategies to cope with climate risk. Here, we apply a super-ensemble-based probabilistic projection system (SuperEPPS) to project maize productivity and evapotranspiration (ET) over growing period during 2050s in the North China Plain, and to examine the relative contributions of adaptation options. Based on a large number of simulation outputs from the super-ensemble-based projection, our results show that without adaptation maize yield could decrease averagely by 13.2&ndash;19.1%, and ET during growing period could decrease by 15.6&ndash;21.8% during 2050s, relative to 1961&ndash;1990. In comparison with the experiment without adaptation, using high-temperature sensitive varieties, maize yield could averagely increase by 1.0&ndash;6.0%, 9.9&ndash;15.2%, and 4.1&ndash;5.6%, by adopting adaptation options of early planting, fixing variety growing duration, and late planting, respectively. ET could averagely increase by 1.9&ndash;4.4%, 1.9&ndash;3.7%, and &minus;2.9% to &minus;0.7%, respectively. In contrast, using high-temperature tolerant varieties, maize yield could averagely increase by &minus;2.4% to &minus;1.4%, 34.7&ndash;45.6%, and 5.7&ndash;6.1%, respectively. ET could averagely increase by 0.7&ndash;0.9%, 9.4&ndash;11.6%, and &minus;0.4% to 0.2%, respectively. The spatial patterns show that the relative contributions of adaptation options can be geographically quite different, depending on the climate and variety properties. The biggest benefits will result from the development of new crop varieties that are high-temperature tolerant and have high thermal requirements.</p>

DOI

43
Tao F, Zhang Z, 2011. Impacts of climate change as a function of global mean temperature: Maize productivity and water use in China.Climatic Change, 105: 409-432.Projections of future climate change are plagued with uncertainties from global climate models and emission scenarios, causing difficulties for impact assessments and for planners taking decisions on adaptation measure. Here, we developed an approach to deal with the uncertainties and to project the changes of maize productivity and water use in China using a process-based crop model, against a global mean temperature (GMT) increase scale relative to 1961-1990 values. From 20 climate scenarios output from the Intergovernmental Panel on Climate Change Data Distribution Centre, we adopted the median values of projected changes in monthly mean climate variables for representative stations and driven the CERES-Maize model to simulate maize production under baseline and future climate scenarios. Adaptation options such as automatic planting, automatic application of irrigation and fertilization were considered, although cultivars were assumed constant over the baseline and future. After assessing representative stations across China, we projected changes in maize yield, growing period, evapotranspiration, and irrigation-water use for GMT changes of 1A degrees C, 2A degrees C, and 3A degrees C, respectively. Results indicated that median values of projected decreases in the yields of irrigated maize without (with) consideration of CO(2)-fertilization effects ranged from 1.4% to 10.9% (1.6% to 7.8%), 9.8% to 21.7% (10.2% to 16.4%), and 4.3% to 32.1% (3.9% to 26.6%) for GMT changes of 1A degrees C, 2A degrees C, and 3A degrees C, respectively. Median values of projected changes in irrigation-water use without (with) consideration of CO(2)-fertilization effects ranged from -1.3% to 2.5% (-18.8% to 0.0%), -43.6% to 2.4% (-56.1% to -18.9%), and -19.6% to 2.2% (-50.6% to -34.3%), which were ascribed to rising CO(2) concentration, increased precipitation, as well as reduced growing period with GMT increasing. For rainfed maize, median values of projected changes in yields without (with) consideration of CO(2)-fertilization effects ranged from -22.2% to -1.0% (-10.8% to 0.7%), -27.6% to -7.9% (-18.1% to -5.6%), and -33.7% to -4.6% (-25.9% to -1.6%). Approximate comparisons showed that projected maize yield losses were larger than previous estimates, particularly for rainfed maize. Our study presents an approach to project maize productivity and water use with GMT increases using process-based crop models and multiple climate scenarios. The resultant impact function is fundamental for identifying which climate change level is dangerous for food security.

DOI

44
Xiao X, Boles S, Liu Jet al., 2005. Mapping paddy rice agriculture in southern China using multi-temporal MODIS images.Remote Sensing of Environment, 95: 480-492.Information on spatial extent and seasonality of inundation and paddy rice fields are needed for water resource management, trace gases emission, and food security. In this study we reported an effort to use images from Moderate Resolution Imaging Spectroradiometer (MODIS) sensor onboard NASA EOS Terra satellite to map inundation and paddy rice fields in southern China. Paddy rice fields are characterized by a period of inundation and open canopy (a mixture of surface water and rice crops). We developed a temporal profile analysis procedure that uses time series data of improved vegetation indices to identify and map inundation and paddy rice fields. The MODIS-based algorithm uses both Enhanced Vegetation Index (EVI) and Land Surface Water Index (LSWI), and excludes those pixels that are covered by cloud and snow from the analysis. Permanent water body mask and digital elevation model were also used in the analysis. Using multi-temporal 8-day composite of MODIS images at 500-m spatial resolution in 2002, we generated a map of inundation and paddy rice fields in southern China. The MODIS-derived paddy rice map was compared with the other datasets of paddy rice agriculture, including the paddy rice map derived from analysis of Landsat ETM+ images in 1999/2000. The results from the comparison have indicated that the MODIS-based algorithm could potentially be applied at large spatial scale for mapping and monitoring of inundation and paddy rice agriculture.

DOI

45
Yang X, Chen F, Lin Xet al., 2015. Potential benefits of climate change for crop productivity in China. Agricultural and Forest Meteorology, 208: 76-84.Multiple cropping systems are particularly important in China to feed the 19% of the world’s population with only 8% of the arable land. Rising temperatures can dramatically affect multiple cropping systems and, as a consequence, food security in China. Here, we investigate the impacts of climate change on the northern limits and crop planting areas of multiple cropping systems in China, and estimate the impacts of the change in the crop planting areas of multiple cropping systems on the China’s crop production (maize, wheat, and rice). Based on both historical climate observations from the China Meteorological Administration and future climate A1B emission scenario (IPCC, 2007) data for China, we evaluate the effects of climate change on multiple cropping systems in China. Historical statistical crop yield and simulated crop yield by Agricultural Production Systems Simulator (APSIM model) in 2011–2100 were used to quantify the crop production (maize, wheat, and rice) in China. We found that the northern limits of multiple cropping systems have been shifted northward. The projected area of cultivated land for triple-cropping system may significantly expand during the 21st century. The northern shifts resulted in a 2.2% (658,000,00002t) increase in national production of three major crops (maize, wheat, and rice) during the period from 1981 to 2010, positively impacting China’s food security. Therefore, we conclude that the warming due to climate change may cause a positive impact on the crop production in China if concomitant changes adapted in multiple cropping systems take place.

DOI

46
Yang X, Lin E, Ma Set al., 2007. Adaptation of agriculture to warming in Northeast China.Climatic Change, 84: 45-58.lt;a name="Abs1"></a>Northeast China comprises Heilongjiang, Jilin and Liaoning Provinces, with a total area of 790,000&nbsp;km<sup>2</sup> and a population of about 107 million. Northeast China, located at relatively high latitudes, (from about 39 to 53°N), is one of the coolest regions in China with long and cold winters, a short growth season and frequent cold extreme events, which are adverse to agricultural production. However, since the 1980s, Northeast China has experienced significant warming with annual mean temperature rising by 1.0&#8211;2.5°C. The increase of accumulated temperature, the extension of the growth period and the recession of summer cool disasters all contributed to improved conditions for crop growth and led to a northward movement of the agricultural climate zone. In addition, the adaptation to warming including the adjustment of crop composition and structure as well as the adoption of advanced technologies greatly facilitated agricultural development. As a result, total grain production in the region increased rapidly. This paper describes in detail climate change, adaptation measures and final agricultural outcomes, alongside with economic and political factors and the role of different political actors in Northeast China.

DOI

47
You L, Wood S, 2006. An entropy approach to spatial disaggregation of agricultural production.Agricultural Systems, 90: 329-347.While agricultural production statistics are reported on a geopolitical – often national – basis we often need to know the status of production or productivity within specific sub-regions, watersheds, or agroecological zones. Such re-aggregations are typically made using expert judgments or simple area-weighting rules. We describe a new, entropy-based approach to making spatially disaggregated assessments of the distribution of crop production. Using this approach, tabular crop production statistics are blended judiciously with an array of other secondary data to assess the production of specific crops within individual ‘pixels’ – typically 25–100 square kilometers in size. The information utilized includes crop production statistics, farming system characteristics, satellite-derived land cover data, biophysical crop suitability assessments, and population density. An application is presented in which Brazilian state level production statistics are used to generate pixel level crop production data for eight crops. To validate the spatial allocation we aggregated the pixel estimates to obtain synthetic estimates of municipality level production in Brazil, and compared those estimates with actual municipality statistics. The approach produced extremely promising results. We then examined the robustness of these results compared to short-cut approaches to allocating crop production statistics and showed that, while computationally intensive, the cross-entropy method does provide more reliable estimates of crop production patterns.

DOI

48
You L, Rosegrant M W, Wood Set al., 2009a. Impact of growing season temperature on wheat productivity in China.Agricultural and Forest Meteorology, 149: 1009-1014.Climate change continues to have major impact on crop productivity all over the world. Many researchers have evaluated the possible impact of global warming on crop yields using mainly indirect crop simulation models. Here we use a 1979–2000 Chinese crop-specific panel dataset to investigate the climate impact on Chinese wheat yield growth. We find that a 102°C increase in wheat growing season temperature reduces wheat yields by about 3–10%. This negative impact is less severe than those reported in other regions. Rising temperature over the past two decades accounts for a 4.5% decline in wheat yields in China while the majority of the wheat yield growth, 64%, comes from increased use of physical inputs. We emphasize the necessity of including such major influencing factors as physical inputs into the crop yield-climate function in order to have an accurate estimation of climate impact on crop yields.

DOI

49
You L, Wood S, Wood-Sichra U, 2009b. Generating plausible crop distribution maps for Sub-Saharan Africa using a spatially disaggregated data fusion and optimization approach.Agricultural Systems, 99: 126-140.

50
You L, Wood S, Wood-Sichra Uet al., 2014. Generating global crop distribution maps: From census to grid.Agricultural Systems, 127: 53-60.We describe a new crop allocation model that adds further methodological and data enhancements to the available crop downscaling modeling. The model comprises the estimates of crop area, yield and production for 20 major crops under four rainfed and irrigated production systems across a global 5 arc minute grid. The new model builds on prior work by the authors (and published in this journal) in developing regional downscaled databases for Latin America and the Caribbean (LAC) and sub-Saharan Africa (SSA) and encompasses notions of comparative advantage and potential economic worth as factors influencing the geographic distribution of crop production. This is done through a downscaling approach that accounts for spatial variation in the biophysical conditions influencing the productivity of individual crops within the cropland extent, and that uses crop prices to weigh the gross revenue potential of alternate crops when considering how to prioritize the allocation of specific crops to individual grid cells. The proposed methodology also allows for the inclusion of partial, existing sources of evidence and feedback on local crop distribution patterns through the use of spatial allocation priors that are then subjected to an entropy-based optimization procedure that imposes a range of consistency and aggregation constraints. We compare the global datasets and summarize factors that give rise to systematic differences amongst them and how such differences might influence the fitness for purpose of each dataset. We conclude with some recommendations on priorities for further work in improving the reliability, utility and periodic repeatability of generating crop production distribution data.

DOI

51
Zhang Q, Sun P, Singh V Pet al., 2012. Spatial-temporal precipitation changes (1956-2000) and their implications for agriculture in China.Global and Planetary Change, 82/83: 86-95.Global warming is believed to be accelerating the hydrological cycle and hence altering the spatial and temporal patterns of precipitation changes. This study investigates precipitation changes in both time and space and also the spatial distribution of natural hazards and irrigation areas, and implications for agricultural development in China. Results indicate that: (1) decreasing precipitation is prevailing in spring and autumn and winter is dominated by increasing precipitation. Seasonal shifts in precipitation may pose new challenges for water resource management and for agriculture production in China; (2) spatial distribution of natural hazards and hazard-induced loss of crops is in agreement with spatial patterns of precipitation changes. Generally, northwestern, northern and northeastern parts of China are influenced by droughts; whereas eastern and southeastern parts are prone to floods; and (3) the spatial distribution of irrigation areas and irrigation requirements are in line with that of precipitation changes, implying critical impacts of precipitation changes on agriculture. Current irrigation practices are inefficient and wasteful. Therefore, water-saving agriculture and water-saving agricultural technologies are required for sustainable agricultural development.

DOI

52
Zhang Z, Wang X, Zhao Xet al., 2014. A 2010 update of National Land Use/Cover Database of China at 1:100000 scale using medium spatial resolution satellite images.Remote Sensing of Environment, 149: 142-154.

Outlines

/