Orginal Article

Assessment of effectiveness of nature reserves on the Tibetan Plateau based on net primary production and the large sample comparison method

  • ZHANG Yili , 1, 2 ,
  • HU Zhongjun 1, 3 ,
  • *QI Wei , 1, 3 ,
  • WU Xue 1, 3 ,
  • BAI Wanqi 1 ,
  • LI Lanhui 1, 3 ,
  • DING Mingjun 1, 4 ,
  • LIU Linshan 1 ,
  • WANG Zhaofeng 1 ,
  • ZHENG Du 1
Expand
  • 1. Key Laboratory of Land Surface Pattern and Simulation, Institute of Geographic Sciences and Natural Resources Research, CAS, Beijing 100101, China
  • 2. CAS Center for Excellence in Tibetan Plateau Earth Sciences, Beijing 100101, China
  • 3. University of Chinese Academy of Sciences, Beijing 100049, China
  • 4. Key Laboratory of Poyang Lake Wetland and Watershed Research, Ministry of Education, Jiangxi Normal University, Nanchang 330022, China

Author: Zhang Yili (1962-), Professor, specialized in physical geography and biogeography. E-mail:

*Corresponding author: Qi Wei (1987-), PhD, E-mail:

Received date: 2015-05-22

  Accepted date: 2015-09-21

  Online published: 2016-01-25

Supported by

Foundation: The Strategic Priority Research Program of the Chinese Academy of Sciences, No.XDB03030500

National Key Technology Research and Development Program, No.2013BAC04B02

Key Foundation Project of Basic Work of the Ministry of Science and Technology of China, No.2012FY111400

National Natural Science Foundation of China, No.41171080, No.41201095

Copyright

Journal of Geographical Sciences, All Rights Reserved

Abstract

Twenty-one typical coupled large samples were chosen from areas within and surrounding nature reserves on the Tibetan Plateau using the large sample comparison method (LSCM). To evaluate the effectiveness of the nature reserves in protecting the ecological environment, the alpine grassland net primary production (NPP) of these coupled samples were compared and the differences between them before and after their establishment as protected areas were analyzed. The results showed that: (1) With respect to the alpine grassland NPP, the ecological and environmental conditions of most nature reserves were more fragile than those of the surrounding areas and also lower than the average values for the Tibetan Plateau. (2) Of the 11 typical nature reserves selected, the positive trend in the NPP for Manzetang was the most significant, whereas there was no obvious trend in Taxkorgan. With the exception of Selincuo, the annual NPP growth rate in the nature reserves covered by alpine meadow and wetland was higher than that in nature reserves consisting of alpine steppe and alpine desert. (3) There were notable findings in 21 typical coupled samples: (a) After the establishment of the nature reserves, the annual rate of increase in the NPP in 76% of samples inside nature reserves and 82% of samples inside national nature reserves was higher than that of the corresponding samples outside nature reserves. (b) The effectiveness of ecological protection of the Mid-Kunlun, Changshagongma, Zoige and Selincuo (Selin Co) nature reserves was significant; the effectiveness of protection was relatively significant in most parts of the Sanjiangyuan and Qiangtang nature reserves, whereas in south-east Manzetang and north Taxkorgan the protection effectiveness was not obvious. (c) The ecological protection effectiveness was significant in nature reserves consisting of alpine meadow, but was weak in nature reserves covered by alpine steppe. This study also shows that the advantage of large sample comparison method in evaluating regional ecology change. Careful design of the samples used, to ensure comparability between the samples, is crucial to the success of this LSCM.

Cite this article

ZHANG Yili , HU Zhongjun , *QI Wei , WU Xue , BAI Wanqi , LI Lanhui , DING Mingjun , LIU Linshan , WANG Zhaofeng , ZHENG Du . Assessment of effectiveness of nature reserves on the Tibetan Plateau based on net primary production and the large sample comparison method[J]. Journal of Geographical Sciences, 2016 , 26(1) : 27 -44 . DOI: 10.1007/s11442-016-1252-9

1 Introduction

The world’s first nature reserve-Yellowstone National Park in the USA-was created in 1872. One hundred and forty years of practice has proved that nature reserves are the best way to protect biodiversity; they are also effective in constructing ecosystems and maintaining regional ecological security (Ma, 1992; Wang et al., 2003; Cui, 2004; Chen et al., 2010). The first nature reserve in China was the Dinghushan Nature Reserve, which was established in 1956. The State Council of China promulgated the Regulations of the People’s Republic of China on Nature Reserves in September 1994, outlining the creation of nature reserves, the regulations for their management and legal responsibilities. After these regulations had been published, the development of nature reserves in China entered a rapid and orderly phase (Chen, 2012).
The Tibetan Plateau (TP) is known as the “Roof of the World” and the “Third Pole of the World” (Zhang et al., 2002). Both its ecology and environment are sensitive and fragile (Sun et al., 2012). In particular, regions to the west of Ali, the central-south part of Naqu, the Sanjiangyuan region and the Three Parallel Rivers Region are areas of key ecological significance (Mittermeier et al., 2011; Nan, 2013; Zhang et al., 2013b). To protect the environment, resources and biodiversity, 155 nature reserves have been created here since 1963, with a total area of approximately 8.22 × 10⁵ km2, accounting for 32.35% of the total area of the Tibetan Plateau. Of these nature reserves, national and provincial nature reserves on the Tibetan Plateau account for 54.96% of the total area of nature reserves (at the national and provincial levels) in China. A system of nature reserves with a reasonable spatial distribution has thus been formed on the Tibetan Plateau, offering a range of types of protection (Zhang et al., 2015). However, to our knowledge, a method for the evaluation of the overall effectiveness of the creation of nature reserves and a standard system of nature reserves have not yet been reported (Zheng et al., 1994; Cui, 2004; Ewers and Rodrigues, 2008; Zheng et al., 2012; Yan et al., 2015). With the exception of individual natural types of reserve or regions, such as wetlands (Victoria et al., 2002; Zheng et al., 2012) and the Sanjiangyuan (Shao et al., 2012; DEPQP et al., 2015), a systematic analysis of the overall effectiveness of protection of the natural reserves on the Tibetan Plateau has not yet been reported.
Many types of evaluation are aimed at particular objectives of protection or types of vegetation or species, such as terrestrial vertebrates (Yan et al., 2015), forest ecosystems (Curran et al., 2004; Andam et al., 2008; Wang et al., 2013), wetland ecosystems (Victoria et al., 2002; Zheng et al., 2012), biodiversity (Bruner et al., 2001; Naughton-Treves et al., 2005), the ecological environment (Shao et al., 2012), the management system used (Stoner et al., 2007; Caro et al., 2009; Quan et al., 2009; Chen et al., 2010 ; Leverington et al., 2010; Underwood, 2012), economic value (Naidoo et al., 2006; Yan et al., 2014), social benefit and regional sustainable development (Naughton-Treves et al., 2005; Liu et al., 2008; Radeloff et al., 2010). These studies mainly adopted the delphi method, fuzzy evaluation statistics, the analytic hierarchy process, principal component analysis and other quantitative or qualitative evaluation methods to construct an index system for evaluation. Static evaluation (Zheng et al., 1994) or dynamic assessment (Bruner et al., 2001; Liu et al., 2001; Curran et al., 2004; Mas, 2005; Deng et al., 2010; Shao et al., 2012; Zheng et al., 2012; Yan et al., 2014, 2015) were then used to compare the nature reserves by index scoring, weighted average and temporal comparison methods. However, these methods cannot assess several nature reserves contemporaneously with long time series over large-scale areas.
Net primary production (NPP) is an important indicator of the function of ecosystems. In recent decades, the NPP estimated by remote sensing has been widely used in vegetation ecosystem studies (Melillo et al., 1993; Potter et al., 1993; Running et al., 2004; Shvidenko et al., 2008; Crabtree et al., 2009). Based on remote sensing and observational plant biomass data, Zhang et al. (2014) used the Carnegie-Ames-Stanford Approach model to determine the spatio-temporal variability in the alpine grassland NPP on the Tibetan Plateau since 1982. This enabled the quantitative assessment of the effectiveness of protection of nature reserves on the Tibetan Plateau from the perspective of changes in the ecological system based on long time series data obtained by remote sensing.
Alpine grassland is the dominant vegetation type on the Tibetan Plateau, accounting for about 60% of its total area (Zhang et al., 2014). For this study, we selected 11 typical nature reserves covered mainly by alpine grassland, including alpine meadows, alpine steppe, wetlands or alpine desert (Figure 1a). We then selected 21 contrasting coupled samples inside and outside the nature reserves (Figure 1b). We analyzed the differences in the alpine grassland NPP between the regions inside and outside the nature reserves before and after their creation to evaluate their effectiveness in protection. This study provides a scientific basis for the ecological management of nature reserves and the formulation of national macroscopic policies.
Figure 1 Typical nature reserves and their peripheral buffer zones on the Tibetan Plateau (TP) (a), and 21 typical sample pairs (b)

2 Data and methods

2.1 Data sources

Spatial data
Alpine grassland NPP data were taken from Zhang et al. (2014) for the period 1982-2009 at a spatial resolution of 0.05°. This dataset was based on Global Inventory Modeling and Mapping Studies (GIMMS) NDVI and SPOT VEGETATION NDVI data; the Carnegie- Ames-Stanford Approach model was used to estimate the results. The process of model calculation and the method for verifying the model results are based on previously published methods (Potter et al., 1993; Crabtree et al., 2009; Zhang et al., 2014). The boundary of the Tibetan Plateau was taken as that defined by Zhang et al. (2002). The boundaries of typical nature reserves were taken from Zhang et al. (2012) and the range of alpine grassland (alpine meadow, alpine steppe, wetland, alpine desert and alpine sparse vegetation) were taken from Zhang (2007). To reduce analytical errors and uncertainty, all the spatial data were obtained using the WGS84 coordinate systems and the spatial resolution for raster data was set at 0.05°.
Nature reserve data
Information on the nature reserves at the end of 2012 was taken from the list of national nature reserves published by the Department of Nature and Ecology Conservation, Ministry of Environmental Protection of China (http://sts.mep.gov.cn/zrbhq/; Table 1).
Table 1 Representative nature reserves on the Tibetan Plateau
Name of nature
reserve
Area (km2) Proportion of alpine grassland (%)* Type of
protection
Level Date of
creation
Qiangtang 300,000.0 78.31 Desert ecosystem National 09 Jul. 1993
Sanjiangyuan 150,000.0 84.42 Inland wetland National 23 May 2000
Altun Mountain 45,000.0 36.69 Desert ecosystem National 01 Jan. 1983
Hoh Xil 45,000.0 56.13 Wild animal National 08 Oct. 1995
Selincuo 20,323.8 68.92 Wild animal National 01 Jan. 1993
Yanchiwan 13,600.0 47.03 Wild animal National 01 Apr. 1982
Changshagongma 6,698.0 91.07 Wild animal National 08 Dec. 1997
Zoige 1,665.7 86.25 Inland wetland National 18 Nov. 1994
Mid-Kunlun Mountain 32,000.0 21.82 Wild animal Provincial 01 Jan. 2001
Taxkorgan 15,000.0 28.07 Wild animal Provincial 08 May 1984
Manzetang 3,658.8 64.83 Inland wetland Provincial 08 Jun. 2001

*Calculated data combined with data from Zhang et al. (2007)

2.2 Methods

This ecological study considered the principles of vegetation ecology and environment heterogeneity using long time series NPP data, which can indicate the status of ecological systems. ArcGIS 10.1 software was used to conduct the spatial analysis of alpine grassland NPP in typical nature reserves and their peripheral buffer zones. Unlike the delphi and AHP methods, which are usually used to analyze the effectiveness of protection of nature reserves, we used the large sample comparison method (LSCM) and related indexes to study the effectiveness of protection of the reserves.
We chose representative large samples with equal areas for a comparative analysis of the ecological changes in adjacent zones inside and at the periphery of each nature reserve, for which the ecological and geographical environments were relatively consistent. The selection criteria for the comparative samples were as follows.
(1) The type of ecosystem in each pair of samples (inside the nature reserve and in its peripheral buffer zone) was the same. In addition, the area of the internal and external samples was approximately equal.
(2) There were more than 30 effective pixels in each sample, taking into account the geostatistical requirements. Effective pixels refer to complete pixels (0.05° × 0.05°) with alpine grassland vegetation for which the yearly NPP value can be included in the source data.
(3) There were at least three pairs of comparative samples for all the different kinds of main alpine grassland (e.g. alpine meadow, alpine steppe) and at least three pairs of comparative samples for each typical nature reserve (e.g. Qiangtang, Sanjiangyuan) to ensure that the main vegetation types and large reservations were represented in the analysis.
We identified all the pairs of comparative samples that met these conditions based on the distribution of alpine grassland and their distribution within and outside the nature reserves (Figure 1b). We identified 21 pairs (42 samples) of comparative samples of all types. There were eight pairs of samples in the Sanjiangyuan Nature Reserve, six pairs of samples in Qiangtang Nature Reserve, two pairs in Selincuo Nature Reserve and only one pair of samples in each of the other five nature reserves, namely, Taxkorgan Wild Animal Nature Reserve, Mid-Kunlun Nature Reserve, Changshagongma Nature Reserve, Manzetang Nature Reserve and Zoige Wetland Nature Reserve, which cover only a small area each. No comparative sample met the design principle in the Altun Mountain Nature Reserve, Hoh Xil Nature Reserve or Yanchiwan Nature Reserve. The sample areas were mainly covered by alpine meadow (ten pairs), alpine steppe (eight pairs), alpine desert (two pairs) and wetland (one pair) (Table 2). The sampled areas of the internal and external nature reserves were 6.95 × 10⁴ and 7.84 × 10⁴ km2, respectively. The area of samples within the nature reserves accounted for 10.98% of the total area of the nature reserves and 15.62% of the total area of alpine grassland within the nature reserves.
Table 2 Data for typical sample pairs
Sample No. Nature reserve Vegetation type Number of effective pixels in internal/external samples*
1 Taxkorgan Alpine steppe 87/102
2 Mid-Kunlun Mountain Alpine desert 34/63
3 Qiangtang Alpine steppe 54/71
4 Qiangtang Alpine desert 62/66
5 Qiangtang Alpine steppe 102/84
6 Qiangtang Alpine steppe 80/88
7 Qiangtang Alpine steppe 91/93
8 Qiangtang Alpine steppe 86/97
9 Selincuo Alpine steppe 51/79
10 Selincuo Alpine meadow 77/147
11 Sanjiangyuan Alpine meadow 70/95
12 Sanjiangyuan Alpine meadow 132/98
13 Sanjiangyuan Alpine meadow 148/95
14 Sanjiangyuan Alpine meadow 115/106
15 Changshagongma Alpine meadow 90/110
16 Sanjiangyuan Alpine meadow 115/145
17 Manzetang Alpine meadow 46/113
18 Sanjiangyuan Alpine meadow 125/94
19 Sanjiangyuan Alpine meadow 77/80
20 Sanjiangyuan Alpine steppe 70/70
21 Zoige Wetland 37/50

*For greater accuracy, all the NPP data in the internal and external representative sample areas only count the number of effective pixels of vegetation types. The effective pixels refer to complete pixels (0.05° × 0.05°) with alpine grassland vegetation, for which the yearly NPP value can be included in the source data.

We chose two indicators to characterize the differences in effectiveness of protection in the sample pairs: the protection amplitude (Pk) and the protection amplitude ratio (Pr). The protection amplitude (Pk) is the variation in amplitude of the net increase or net decrease in the NPP of the internal zone of the sample minus that of the external zone of the sample per unit time and unit area; a positive value indicates an increase in the NPP and a negative value indicates a decrease in the NPP. The protection amplitude ratio (Pr) is the ratio of the protection amplitude to the amplitude for a condition of no protection (the NPP of the external sample of the pair) per unit time and unit area. These two indicators are used to characterize a significant degree of protection effectiveness. The two calculation formulas are:
where kp is the average amplitude of variation per unit time and unit area in the sample inside the nature reserve for the period before and after the reserve was created and kn is the average amplitude of variation per unit time and unit area in the sample outside the nature reserve for the period before and after the reserve was established.

3 Results

3.1 Temporal and spatial characteristics of alpine grassland NPP in nature reserves

Among the typical nature reserves, the vegetation type of Qiangtang, Hoh Xil and Taxkorgan nature reserves is mainly alpine steppe; the Sanjiangyuan, Changshagongma, Selincuo, Zoige and Manzetang nature reserves are mainly covered by alpine meadow and the Mid- Kunlun nature reserve is mainly covered by alpine desert and alpine sparse vegetation. The vegetation types are approximately the same inside and outside the nature reserves (Figure 1a).
3.1.1 Spatial distribution of NPP
Between 1982 and 2009, the distribution of the average annual NPP in alpine grassland in each nature reserve and the surrounding zone gradually increased from the west (north) to the east (south) (Figure 2). This distribution is consistent with the regional spatial distribution of precipitation and temperature. The annual alpine grassland NPP of all the typical nature reserves is 87.47 gC m-2 yr-1, the annual NPP of all the national nature reserves is 87.33 gC m-2 yr-1 and the annual NPP of all the provincial nature reserves is 93.95 gC m-2 yr-1, whereas the annual NPP in the zone surrounding all the typical nature reserves is 157.86 gC m-2 yr-1 (Figure 2). Therefore the ecological environment in the nature reserves, especially the national nature reserves, is more fragile than in the surrounding regions.
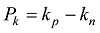
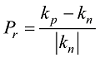
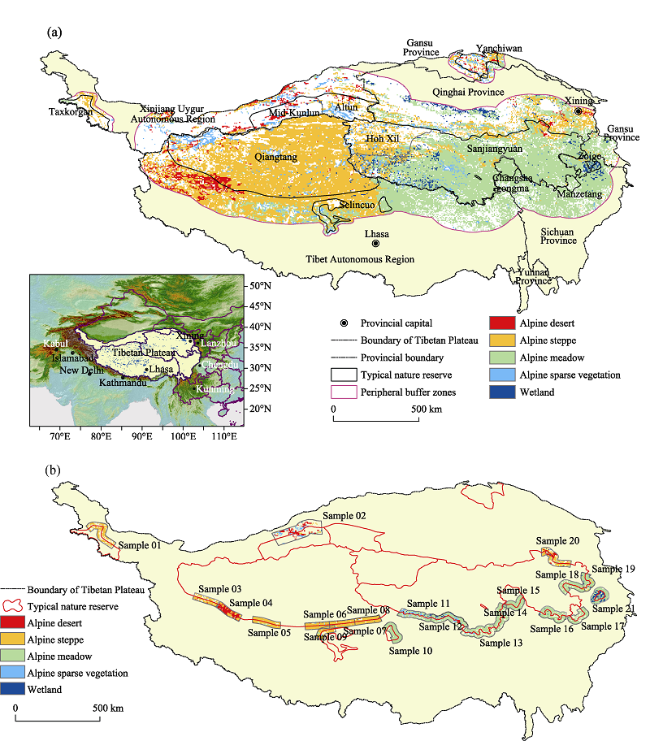
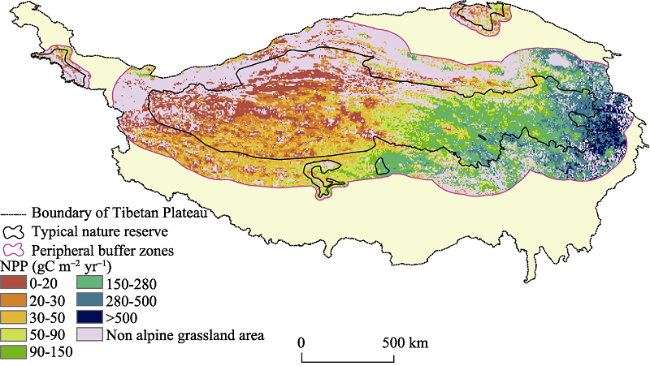
Figure 2 Distribution of NPP inside typical nature reserves and peripheral buffer zones of the Tibetan Plateau. Data are based on results of Zhang et al. (2014).
Comparing the mean NPP of all types of alpine grassland in all typical nature reserves and in their surrounding zones with the mean NPP of alpine grassland in the Tibetan Plateau, we showed that the mean NPP of all types of alpine grassland in the zones surrounding the nature reserves was higher than that for the Tibetan Plateau. However, the mean NPP of alpine desert was the same in the zones surrounding the nature reserves and in the Tibetan Plateau, whereas the mean NPP of alpine desert and alpine sparse vegetation in the national nature reserves and the mean NPP of alpine meadows in provincial nature reserves was higher than that in the zones surrounding the nature reserves. The mean NPP of other type of alpine grasslands was lower than the average NPP of the Tibetan Plateau (Table 3). The ecological environment of the Mid-Kunlun Provincial Nature Reserve, which is mainly covered by alpine desert and alpine sparse vegetation, and the Manzetang Provincial Nature Reserve, which is mainly covered by alpine meadow, was better than that of other nature reserves during the research period (Figure 2 and Table 3).
Table 3 Comparison of NPP of alpine grassland vegetation on the Tibetan Plateau (gC m-2 yr-1)
Vegetation type Representative nature reserve Surrounding area of nature reserve Tibetan Plateau (Zhang et al., 2014)
National level Provincial level
Alpine desert 43.50±61.11 12.58±4.74 41.05±56.57 41.12±52.74
Alpine steppe 33.48±38.18 19.71±16.46 74.51±98.52 55.86±81.40
Alpine meadow 169.2±105.2 301.9±188.7 232.4±178.9 188.7±156.0
Alpine sparse vegetation 38.43±44.50 11.68±6.15 36.95±50.90 34.49±40.89
Wetland 108.1±126.1 15.12±2.64 218.4±219.2 147.2±163.6
Mean 87.33 93.95 157.86 120.8

Note: Data are given as mean±SD values.

3.1.2 Trends in NPP
The annual NPP of alpine grassland in 11 typical nature reserves showed increasing trends of different degrees during the period 1982-2009 (Figure 3). The increasing trend observed for the Manzetang Nature Reserve is the most significant, with a value of about 1.54 gC m-2 yr-1, whereas that for the Taxkorgan Nature Reserve is not obvious and has a value of only 0.03 gC m-2 yr-1. The rate of increase in the NPP for nature reserves mainly covered by alpine meadow and wetland is higher than that for nature reserves covered by alpine steppe and alpine desert, with the exception of the Selincuo Nature Reserve.
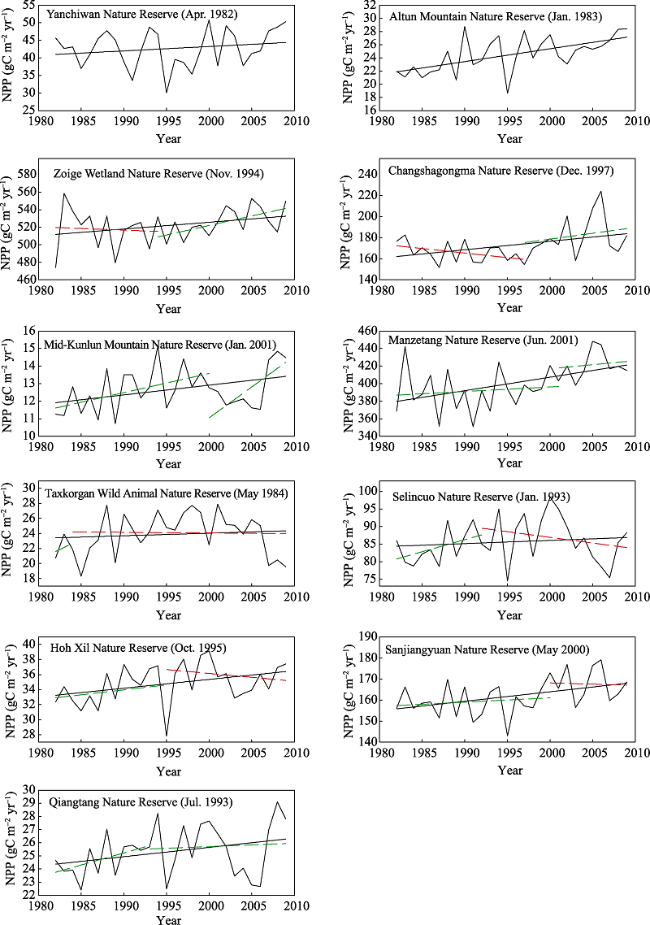
Figure 3 Changes in the NPP in natural reserves before and after their establishment. Red lines represent decreasing trends and green lines represent increasing trends
We divided the time period into two stages: before and after each nature reserve was established (note: the Yanchiwan Nature Reserve and the Altun Mountain Nature Reserve were established at about the time that this research started). Comparative analysis showed that the increasing trend in the NPP was higher after the Manzetang, Mid-Kunlun, Chang- shagongma and Zoige nature reserves were established than the trend before these nature reserves were established. The increasing trend in the NPP after the Qiangtang Nature Reserve was established was lower than the trend before it was established; however, there was a decreasing trend in the NPP for the other four nature reserves after they were established.
Studies have shown that the alpine grassland NPP has been affected by the overall effects of precipitation and temperature over the past 30 years. There were three relatively large fluctuations and the NPP dipped in 1987, 1995 and 2003 (Zhang et al., 2014). Figure 3 shows that the NPP in most nature reserves also dipped at these times and the downward trend was most significant around 1995. Even in the same nature reserve, we cannot simply attribute changes in the NPP before and after the nature reserve was established to the effectiveness of protection. There will therefore be great uncertainty if we evaluate the effectiveness of protection in the nature reserves with respect to differences in the regional climate.

3.2 Effectiveness of protection based on the large sample comparison method

3.2.1 Changes in the NPP inside and outside nature reserves
The NPP is affected by both natural and human activities. Directly comparing changes in the NPP before and after a nature reserve is established cannot truly reflect its effectiveness of protection. After analyzing the spatio-temporal changes in the NPP trends for alpine grassland in typical nature reserves, we selected a total of 42 samples (21 pairs) to analyze the differences between the zones inside and outside the nature reserves before and after they were established.
The vegetation growth status in 21 sample pairs was obviously different as a result of the different types of land cover. Among the 21 pairs of samples, the lowest average annual NPP (12.23 gC m-2 yr-1) was seen in the external zone (a matched sample located in the peripheral buffer zone outside the nature reserve) of sample 2 (alpine desert in Mid-Kunlun Provincial Nature Reserve) between 1982 and 2009. The highest value (556.24 gC m-2 yr-1) was seen in the external zone of sample 21 (wetland of Zoige Wetland National Nature Reserve). The annual average NPP was higher in the external zone than in the internal zone for eight pairs of samples; another eight pairs of samples had the opposite results and there was little difference between the internal and external zones for the remaining five pairs of samples.
As can be seen from the trend in annual NPP from 1982 to 2009, only five of the 42 samples showed a slightly decreasing trend in the NPP; the others all showed a trend of fluctuating increase. The increasing trend of the NPP in the internal sample was higher than that in the external sample in 12 pairs of samples (Figure 4).
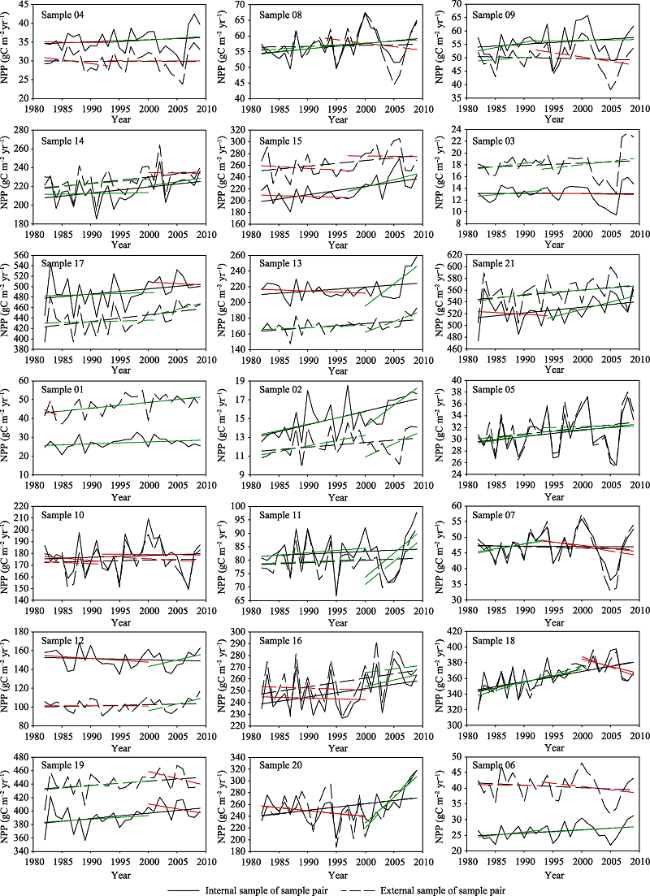
Figure 4 Changes in the NPP in sample pairs before and after the establishment of the natural reserves. Red lines represent decreasing trends and green lines represent increasing trends
3.2.2 Changes in the NPP before and after the establishment of nature reserves
We divided the time period into two stages: before and after each nature reserve was established. When the samples were selected, we assumed that the NPP outside each nature reserve was affected by both natural and human activities without protection, whereas the NPP inside each nature reserve was the result of protection. Furthermore, the climate in each pair of samples (inside and outside the nature reserve) was basically similar. Therefore a comparison of the internal and external zones of each sample pair can better illustrate the effectiveness of protection.
The trend in the NPP of the 21 pairs of samples can be divided into the following five types.
(1) Trends before reserve establishment were of the same type, but those after establishment were of the opposite type
The trend was the same for the internal and external samples before the nature reserve
was established (the first stage), but one trend changed after the nature reserve was established (the second stage). In five pairs of samples of this type (samples 4, 8, 9, 14 and 15), the NPP of the internal sample showed an increasing trend in the second stage, whereas the NPP of the external sample showed a decreasing trend. This indicated that the protection effectiveness of these five pairs of samples was significant. Another two pairs of samples (samples 3 and 17) showed the opposite trend in the second stage compared with the first five pairs of samples, indicating that the protection effect was poor.
(2) Trends before reserve establishment were of opposite types, but those after establishment were of the same type
There was an increasing trend in the NPP in both samples after the nature reserve was established, but there was a difference before the nature reserve was established. In two sample pairs (13 and 21), the NPP showed a decreasing trend in the internal samples, but an increasing trend in the external samples in the first stage. These results proved that the protective effect in the internal samples resulted in a change in the NPP from a “decreasing trend” in the first stage to an “increasing trend” in the second stage compared with the environmental background before and after the nature reserve was established. The trend shown for sample 1, however, is the opposite of these two pairs of samples.
(3) Consistent trends
In four pairs of samples, the trend in the NPP was of the same type in both the internal and external samples in both stages (samples 2, 5, 10 and 11).
(4) Trends before reserve establishment were the opposite of trends after reserve establishment
There were six pairs of samples (samples 7, 12, 16, 18, 19 and 20) for which the trend in NPP was the same in the internal and external samples for each stage, but different in the two stages.
(5) Trends were consistent, but opposite
The changing trend was consistent in the internal and external samples before and after the nature reserve was established, but the trend was opposite for the two samples-for example, in sample 6, there was an increasing trend in the NPP in the internal sample for both stages, but a decreasing trend in the external sample for both stages.
The differences in the trends between the internal and external zone samples for each stage and the effectiveness of protection inside the nature reserves can be discussed by comparing the protection amplitude (Pk). Of the 21 sample pairs, the Pk was positive in 15 pairs of samples and the Pk of sample 21 was the highest at approximately 3.74. The Pk value of the remaining six pairs of samples was negative; sample 17 had the lowest Pk value of approximately -3.27. The vegetative type of four of these six sample pairs was alpine steppe. This indicates that the protection effect of alpine steppe-type nature reserves was poor (Figure 4).
The protection amplitude ratio (Pr) of five sample pairs (samples 10, 13, 14, 15, and 21) was >1; of these sample pairs, sample 10 had the highest protecting amplitude ratio of approximately 9.17. The vegetation types of these five pairs of samples were all alpine meadow. This indicated that the protection effectiveness of alpine meadow-type nature reserves is significant. Three pairs of samples (samples 1, 3, and 17) had a protection amplitude ratio less than -1; of these sample pairs, sample 3 had the lowest Pr value of approximately -105.5.
An effectiveness analysis of the changing trends in the NPP of types (3) to (5) revealed that the Pr value of nine of these 11 pairs of samples was positive (only that of samples 5 and 20 were negative), indicating that the effectiveness of protection of these sample pairs was good (Table 4).
Table 4 Amplitude and amplitude ratio of the NPP in sample pairs before and after the establishment of nature reserves
Sample area Analysis period Protection amplitude
/Pk
Protection amplitude ratio/Pr Nature reserve Vegetation type
Sample
No.
Sample pair Whole period (1982-
2009)/k
First stage (1982 to establishment) Second stage (establishment to 2009)
1 Inside reserve 0.10 0.24 0.10 -1.66 -1.09 Taxkorgan Alpine steppe
Outside reserve 0.31 -1.22 0.31
2 Inside reserve 0.14 0.13 0.45 0.16 0.97 Mid-Kunlun Alpine desert
Outside reserve 0.05 0.11 0.28
4 Inside reserve 0.06 -0.01 0.10 -0.09 -0.47 Qiangtang Alpine desert
Outside reserve 0 -0.19 -0.003
3 Inside reserve 0 0.09 -0.02 -0.11 -105.50 Alpine steppe
Outside reserve 0.04 0.11 0.11
5 Inside reserve 0.11 0.13 0.06 -0.03 -0.78
Outside reserve 0.10 0.07 0.03
6 Inside reserve 0.10 0.20 0.11 0.10 0.54
Outside reserve -0.08 -0.03 -0.21
7 Inside reserve -0.01 0.30 -0.20 0.16 0.24
Outside reserve -0.05 0.37 -0.29
8 Inside reserve 0.17 0.20 0.11 0.29 0.77
Outside reserve 0.03 0.15 -0.23
9 Inside reserve 0.13 0.40 0.03 0.11 0.23 Selincuo Alpine steppe
Outside reserve -0.05 0.15 -0.32
10 Inside reserve 0.16 -0.42 -0.05 0.42 9.17 Alpine meadow
Outside reserve 0.10 -0.20 -0.25
20 Inside reserve 1.10 -0.94 8.76 -1.94 -0.17 Sanjiangyuan Alpine steppe
Outside reserve 1.16 -1.05 10.60
11 Inside reserve 0.10 0.17 1.79 0.01 0.01 Alpine
meadow
Outside reserve 0.08 0.10 1.71
12 Inside reserve -0.13 -0.38 1.40 0.33 0.23
Outside reserve 0.13 -0.01 1.44
13 Inside reserve 0.52 -0.29 5.64 3.50 1.44
Outside reserve 0.54 0.32 2.74
14 Inside reserve 0.64 0.09 0.92 1.35 2.57
Outside reserve 0.65 0.48 -0.05
16 Inside reserve 0.72 -0.13 1.09 0.43 0.54
Outside reserve 0.74 -0.17 0.63
18 Inside reserve 1.29 1.59 -1.83 1.29 0.27
Outside reserve 1.37 2.08 -2.63
19 Inside reserve 0.81 0.53 -1.47 0.78 0.28
Outside reserve 0.62 0.72 -2.07
15 Inside reserve 1.43 -0.29 2.49 2.31 5.01 Changshagongma Alpine meadow
Outside reserve 0.96 -0.57 -0.11
17 Inside reserve 0.99 0.34 -0.58 -3.27 -1.39 Manzetang Alpine meadow
Outside reserve 1.27 0.32 2.68
21 Inside reserve 0.97 -0.58 2.51 3.74 5.70 Zoige Wetland
Outside reserve 0.87 1.37 0.72
When considering the trends in the NPP, the Pk and the Pr ratio together, we found that there were 16 pairs of samples with good protection effectiveness (15 pairs of samples with a positive Pk value and sample 4, for which the changing trend of NPP became good). Considering the different types of vegetation, the effectiveness of protection of alpine meadow- type samples was good and that of alpine steppe-type samples was poor. The Pk value observed for more than 76% of the samples inside nature reserves and more than 82% of the samples inside national nature reserves was higher than that of samples outside nature reserves after the nature reserves has been established. In view of the nature reserves in which the sample pairs were located, it became clear that there was more effectiveness of ecological protection in most areas of the Mid-Kunlun, Changshagongma, Zoige, Selincuo, Sanjiangyuan and Qiangtang nature reserves, whereas the protection effectiveness in the south-eastern part of Manzetang Nature Reserve and the northern part of Taxkorgan Wild Animal Nature Reserve was not significant. Considering the administrative regions in which the sample pairs were located, the areas in which the protection effectiveness of the nature reserves was not significant were mainly concentrated in Taxkorgan County in Xinjiang Autonomous Region (sample 1), the Ali area in Tibet Autonomous Region (samples 3 and 5), Aba County in Sichuan Province (sample 17), Xinghai County and Tongde County in Qinghai Province (sample 20).

4 Discussion and conclusions

4.1 Discussion

Five sample pairs (samples 1, 3, 5, 17 and 20) did not show any obvious effectiveness of protection. This may be related to factors such as increased grazing pressures and a worsening climate over the same period. Sample 1 was located in the northwest-north-northeast of the Taxkorgan Wild Animal Nature Reserve, which accounts for 62.3% of the area of Taxkorgan County. According to the Xinjiang Statistical Yearbook (Edited by Statistic Bureau of Xinjiang Urgur Autonomous Region) published between 1989 and 2013, the number of livestock in this county has increased continuously since 1988; this may result in the grassland becoming overloaded, leading to serious grassland degradation (Yue et al., 2011). Samples 3 and 5 are located in the central-west part of the Qiangtang Nature Reserve in the Ali region. Current research indicates that the climate in the northwest of Tibet has become warmer and dryer over the period from 1970 to 2010 (Zhang et al., 2013a), leading to intensified drought conditions, causing a continuous degradation of grassland (Yang, 2002). The growth rate of livestock reached 40.00%, 12.14% and 8.19%, respectively, in Gaize, Geji and Ritu counties during the period 1985-2009, in which samples 3 and 5 were located; the overloading rate in Gaize and Geji county reached 11.04% and 23.10%, respectively, in 2010 (Chang et al., 2012). Sample 17 was located in the southeastern part of Manzetang Nature Reserve in the Aba region of Sichuan Province; here, human disturbance is frequent and the ecology and environment in this region have worsened and the effectiveness of protection is not obvious (Dai and Min, 2009). Sample 20 is located in the northeast of the Sanjiangyuan National Nature Reserve; this region did not belong to the core area of the nature reserve at one time, so it lacked substantial protection. The Ecological Protection and Construction Project of Sanjiangyuan came into effect in 2005. People have begun to return grazing land to grassland and the effectiveness of protection has begun to reappear in this region (Shao et al., 2012; Liu et al., 2013; Figure 4). The Tibetan-inhabited regions are usually located in the areas adjacent to nature reserves; some important economic development regions, such as county towns, are also distributed within nature reserves. This also means that grazing activity has affected the nature reserves in different ways and has affected their function (Glindermann et al., 2009; Chen et al., 2014).

4.2 Conclusions

Based on the long time series of the NPP data, this study analyzed changes in the NPP inside and outside 11 typical nature reserves and used the LSCM to evaluate effectiveness of protection of the selected 21 samples pairs on the Tibetan Plateau before and after their establishment by two indicators: the protection variation amplitude and the protection variation amplitude ratio.
From 1982 to 2009, the ecological and environmental conditions of most nature reserves were more fragile than those of their surrounding areas and also lower than the average values for the Tibetan Plateau. The exceptions were the Mid-Kunlung Nature Reserve, which is mainly covered by alpine desert and alpine sparse vegetation, and the Manzetang Nature Reserve, which is mainly covered by alpine meadow; both these reserves had good ecological and environmental conditions.
The annual average NPP of 11 typical nature reserves showed increasing trends of varying degrees over the research periods. Among these, the increasing trend in the Manzetang Nature Reserve was the most significant and the increasing trend in the Taxkorgan Wild Animal Nature Reserve was the weakest. The rate of increase in the NPP in the nature reserves mainly covered by alpine meadow and wetland was higher than that of nature reserves mainly covered by alpine steppe and alpine desert, with the exception of the Selincuo Nature Reserve. Differences in the regional climate is the main uncertainty to evaluate the effectiveness of protection in the nature reserves by NPP data.
From a comparative analysis of the samples, the following deductions can be made.
(1) After the nature reserves were established, the rate of increase in the NPP in more than 76% of samples inside nature reserves and more than 82% of samples inside national nature reserves was higher than that of the corresponding samples outside nature reserves, demonstrating the effectiveness of protection of the nature reserves.
(2) The nature reserves with the most obvious effectiveness of protection were Mid- Kunlun, Changshagongma, Zoige and Selincuo. Most parts of the Sanjiangyuan and Qiangtang nature reserves showed an obvious effectiveness of protection. However, the effectiveness of protection of the Manzetang and Taxkorgan Wild Animal nature reserves was not significant.
(3) The effectiveness of protection of the nature reserves covered with alpine meadow was significant, whereas the effectiveness of protection of nature reserves covered with alpine steppe was poor.
This research showed that we can analyze scientific data obtained by remote sensing to obtain evaluation indexes to compare large samples. The protection variation amplitude and protection variation amplitude ratio enabled us to evaluate the effectiveness of human activities, such as ecological protection and the establishment of nature reserves, and the degree of influence of natural factors, such as climate change. Careful design of the samples used, to ensure comparability between the samples, is crucial to the success of this LSCM.

The authors have declared that no competing interests exist.

1
Andam K S, Ferraro P J, Pfaff Aet al., 2008. Measuring the effectiveness of protected area networks in reducing deforestation.Proceedings of the National Academy of Sciences USA, 105(42): 16089-16094.Abstract Global efforts to reduce tropical deforestation rely heavily on the establishment of protected areas. Measuring the effectiveness of these areas is difficult because the amount of deforestation that would have occurred in the absence of legal protection cannot be directly observed. Conventional methods of evaluating the effectiveness of protected areas can be biased because protection is not randomly assigned and because protection can induce deforestation spillovers (displacement) to neighboring forests. We demonstrate that estimates of effectiveness can be substantially improved by controlling for biases along dimensions that are observable, measuring spatial spillovers, and testing the sensitivity of estimates to potential hidden biases. We apply matching methods to evaluate the impact on deforestation of Costa Rica's renowned protected-area system between 1960 and 1997. We find that protection reduced deforestation: approximately 10% of the protected forests would have been deforested had they not been protected. Conventional approaches to evaluating conservation impact, which fail to control for observable covariates correlated with both protection and deforestation, substantially overestimate avoided deforestation (by over 65%, based on our estimates). We also find that deforestation spillovers from protected to unprotected forests are negligible. Our conclusions are robust to potential hidden bias, as well as to changes in modeling assumptions. Our results show that, with appropriate empirical methods, conservation scientists and policy makers can better understand the relationships between human and natural systems and can use this to guide their attempts to protect critical ecosystem services.

DOI PMID

2
Bruner A G, Gullison R E, Rice R Eet al., 2001. Effectiveness of parks in protecting tropical biodiversity.Science, 291: 125-128.

3
Caro T, Gardner T A, Stoner Cet al., 2009. Assessing the effectiveness of protected areas: Paradoxes call for pluralism in evaluating conservation performance.Diversity and Distributions, 15: 178-182.ABSTRACT Aim68 To highlight and examine apparent paradoxes in assessing the effectiveness of different forms of land-use for biodiversity conservation. Location68 Tanzania. Methods68 We compare and contrast the findings of two recent and seemingly conflicting studies on the effectiveness of conservation protection strategies in Tanzania. We evaluate these studies in the context of a wider body of evidence relating to the problem of determining protected area performance. Results68 We highlight the importance of landscape-scale management approaches for biodiversity conservation; establishing clear management and monitoring objectives in advance; the interrelation between the choice of target species and the appropriate spatial scale over which to measure their fate; and differences between snapshot and longitudinal scales in assessing the effectiveness of conservation strategies. Main conclusions68 Protected area assessments should not promote an isolated focus on particular conservation targets or methods of monitoring and evaluating the effectiveness of conservation strategies. Instead we argue for a more pluralistic approach to evaluating conservation performance that can help to reveal where potential synergies in tackling different objectives exist, and clarifying the trade-offs when they do not.

DOI

4
Chang H Q, Xu W Y, Yuan Jet al., 2012. Current situation of grassland resources and grazing capacity in Ali, Tibet.Pratacultural Science, 29(11): 1660-1664. (in Chinese)<p>In recent decades, the ecological environment of grassland in Ali of Tibet has degraded continuously, which has attracted attention of local governments at different levels. Therefore, it is urgent to probe into the causes and improvement techniques of the degradation. In this paper, the overview and types of grassland resources and grazing capacity in Ali of Tibet were discussed. The results showed that the theoretical grazing capacity of Ali region was 2.993 7 million standard sheep and the actual grazing capacity is 3.466 6 million in 2010. Compared with the theoretical grazing capacity, the actual grazing capacity overloaded 15.80%. Based on the grassland resources and grazing capacity, it is suggested that the best suitable measures for local conditions should be taken, such as arranging grazing rationally and utilizing grassland resources scientifically to promote the sustainable development of animal husbandry.</p>

5
Chen B X, Zhang X Z, Tao Jet al., 2014. The impact of climate change and anthropogenic activities on alpine grassland over the Qinghai-Tibet Plateau.Agricultural and Forest Meteorology, 189: 11-18.Climate change and anthropogenic activities are two factors that have important effects on the carbon cycle of terrestrial ecosystems, but it is almost impossible to fully separate them at present. This study used process-based terrestrial ecosystem model to stimulate the potential climate-driven alpine grassland net primary production (NPP), and Carnegie–Ames–Stanford Approach based on remote sensing to stimulate actual alpine grassland NPP influenced by both of climate change and anthropogenic activities over the Qinghai–Tibet plateau (QTP) from 1982 to 2011. After the models were systematically calibrated, the simulations were validated with continuous 3-year paired field sample data, which were separately collected in fenced and open grasslands. We then simulated the human-induced NPP, calculated as the difference between potential and actual NPP, to determine the effect of anthropogenic activities on the alpine grassland ecosystem. The simulation results showed that the climate change and anthropogenic activities mainly drove the actual grassland NPP increasing in the first 20-year and the last 10-year respectively, the area percentage of actual grassland NPP change caused by climate change declined from 79.62% in the period of 1982–2001 to 56.59% over the last 10 years; but the percentage change resulting from human activities doubled from 20.16% to 42.98% in the same periods over the QTP. The effect of human activities on the alpine grassland ecosystem obviously intensified in the latter period compared with the former 20 years, so the negative effect caused by climate change to ecosystem could have been relatively mitigated or offset over the QTP in the last ten years.

DOI

6
Chen J K, 2012. Insights into the history of conservation of natural wetlands in China.Chinese Science Bulletin, 57(4): 205-206. (in Chinese)

7
Chen J K, Lei G C, Wang X L, 2010. Analysis of Ten Effective Management Case in the Middle and Lower Reaches of the Yangtze River. Shanghai: Fudan University Press. (in Chinese)

8
Crabtree R, Potter C, Mullen Ret al., 2009. A modeling and spatio-temporal analysis framework for monitoring environmental change using NPP as an ecosystem indicator.Remote Sensing of Environment, 113(7): 1486-1496.We present and describe a modeling and analysis framework for monitoring protected area (PA) ecosystems with net primary productivity (NPP) as an indicator of health. It brings together satellite data, an ecosystem simulation model (NASA-CASA), spatial linear models with autoregression, and a GIS to provide practitioners a low-cost, accessible ecosystem monitoring and analysis system (EMAS) at ...

DOI

9
Cui G F, 2004. Special research fields and hot spots in science of nature reserves.Journal of Beijing Forestry University, 26(6): 102-105. (in Chinese)The nature reserves, covering above 14% terrestrial land area of China,have become special type of utilization. They not only conserve wildlives, but also possess the key functions of protecting territory. When the Project of Construction of Nature Reserve is carried out, there are some urgent problems to be resolved, such as systematic planning of nature reserves, the distribution pattern of key reserves, investigation and monitoring of wildlives. Science of nature reserves has become an important branch of learning. This paper gives the definition of science of nature reserves, and puts forward the special research fileds and hot spots, such as recovering and controlling population of endangered species in nature reserves' “ecological islands”, setting minimum area of nature reserves, designing the corridor of wildlife, evaluating natural capital of nature reserves, and economic management.

DOI

10
Curran L M, Trigg S N, McDonald A, 2004. Lowland forest loss in protected areas of Indonesian Borneo.Science, 303: 1000-1003.

11
Dai L D, Min H X, 2009. Countermeasures on the sustainable development of Manzetang wetland nature reserve in Sichuan.Sichuan Forestry Exploration and Design, (4): 39-42. (in Chinese)Mazetang wetland nature reserve,which is protecting the wetland and wild animals mainly,is the integrative nature reserve.The nature reserve has abundant biology diversity and important wetland ecological significance.This paper introduced the management status and questions existed in the building of nature reserve,put up the clues to solve these questions and countermeasures on its sustainable development.

12
Deng M L, Tian K, Duan Z Let al., 2010. The changes of landscape at Zoige Plateau wetland reserve in Sichuan, China.Journal of Mountain Science, 28(2): 240-246. (in Chinese)Based on the landsat images of the years of 1990 and 2000 and 2007,variation of the landscape patterns of the plateau wetland reserve area of Zoige in Sichuan Province in the past 20 years and its driving factor were analyzed quantitatively,using landscape indexes (such as NP,PLAND,SHDI,SHEI and so on) by FRAGSTATS software.,and analyzing transposed matrix of the whole landscape. Results show that within the study area,the Zoige plateau wetland reserve landscape patterns changed significantly from 1990 to 2007,especially in NP,PLAND,AI,SHDI,SHEI.,in the Landscape-scale degraded swamps was the landscape of matrix and became dominantones,accounting for 48.05% in the study area in 2007. The area under the influence of human activities,the spatial heterogeneity and the landscape fragmentation were decrease then increase again,and the landscape dominance was increase firstly then decrease. 1990~2000,the water area of lakes and rivers were decrease,sand was restored,the area of degraded marsh,meadow and shrub increased by 1 978.60 hm2,2 559.09 hm2and 824.27 hm2. 2000~2007,the water areas of lake and marsh were still decrease,and the areas of degraded marsh and grassland continued to grow,A significant increase in the sand by 1 945.90 hm2. Global warming cooperated with the man-made of drainage dewatering,over-grazing,disorderly tourism,the authority management of protected were the main driving factors of the area of wetland landscape pattern change.

DOI

13
Department of Environment Protection of Qinghai Province, Bureau of Quality and Technology Supervision of Qinghai Province (DEPQP), 2015. Local Standard of Qinghai Province-Technical Specification for Evaluation on Ecological Effect of Ecological Protection and Construction of Three-Rivers Nature Reserve (DB63/T1342-2015).

14
Ewers R M, Rodrigues A S L, 2008. Estimates of reserve effectiveness are confounded by leakage.Trends in Ecology & Evolution, 23(3): 113-116.In situ conservation often requires the designation of sites where land-use is restricted, such as protected areas and no-fishing zones. Such areas are designed to reduce impacts on the ecosystem, but the overall benefits of this approach might be compromised if 'leakage' takes place--that is, if impacts that would take place inside the restricted area are displaced to a nearby, unrestricted area. Recently, Oliveira and colleagues became the first group to measure leakage from newly created forest concessions. They showed that restricting land-use reduced deforestation within the concession areas, but dramatically increased it in the surrounding areas. We discuss these findings in the wider context of growing global interest in quantifying the effectiveness of nature reserves.

DOI PMID

15
Glindermann T, Wang C, Tas B Met al., 2009. Impact of grazing intensity on herbage intake, composition, and digestibility and on live weight gain of sheep on the Inner Mongolian steppe.Livestock Science, 124: 142-147.

16
Leverington F, Costa K L, Pavese Het al., 2010. A global analysis of protected area management effectiveness.Environmental Management, 46: 685-698.We compiled details of over 8000 assessments of protected area management effectiveness across the world and developed a method for analyzing results across diverse assessment methodologies and indicators. Data was compiled and analyzed for over 4000 of these sites. Management of these protected areas varied from weak to effective, with about 40% showing major deficiencies. About 14% of the surveyed areas showed significant deficiencies across many management effectiveness indicators and hence lacked basic requirements to operate effectively. Strongest management factors recorded on average related to establishment of protected areas (legal establishment, design, legislation and boundary marking) and to effectiveness of governance; while the weakest aspects of management included community benefit programs, resourcing (funding reliability and adequacy, staff numbers and facility and equipment maintenance) and management effectiveness evaluation. Estimations of management outcomes, including both environmental values conservation and impact on communities, were positive. We conclude that in spite of inadequate funding and management process, there are indications that protected areas are contributing to biodiversity conservation and community well-being.

DOI PMID

17
Liu J, Li S, Ouyang Zet al., 2008. Ecological and socioeconomic effects of China’s policies for ecosystem services.Proceedings of the National Academy of Sciences, 105: 9477-9482.

18
Liu J G, Linderman M, Ouyang Z Yet al., 2001. Ecological degradation in protected areas: The case of Wolong Nature Reserve for Giant Pandas.Science, 292: 98-101.

19
Liu J Y, Shao Q Q, Fan J W, 2013. Ecological construction achievements assessment and its revelation of ecological project in Three Rivers Headwaters Region.Chinese Journal of Nature, 35(1): 40-46. (in Chinese)

20
Ma J Z, 1992. Science of Nature Conservation. Harbin: Northeast Forestry University Press. (in Chinese)

21
Mas J, 2005. Assessing protected area effectiveness using surrounding (buffer) areas environmentally similar to the target area.Environmental Monitoring and Assessment, 105: 69-80.lt;a name="Abs1"></a>Many studies are based on the assumption that an area and its surrounding (buffer) area present similar environmental conditions and can be compared. For example, in order to assess the effectiveness of a protected area, the land use/cover changes are compared inside the park with its surroundings. However, the heterogeneity in spatial variables can bias this assessment: we have shown that most of the protected areas in Mexico present significant environmental differences between their interior and their surroundings. Therefore, a comparison that aims at assessing the effectiveness of conservation strategies, must be cautioned. In this paper, a simple method which allows the generation of a buffer area that presents similar conditions with respect to a set of environmental variables is presented. The method was used in order to assess the effectiveness of the Calakmul Biosphere Reserve, a protected area located in the south-eastern part of Mexico. The annual rate of deforestation inside the protected area, the standard buffer area (based upon distance from the protected area only) and the <i>similar buffer area</i> (taking into account distance along with some environmental variables) were 0.3, 1.3 and 0.6%, respectively. These results showed that the protected area was effective in preventing land clearing, but that the comparison with the standard buffer area gave an over-optimistic vision of its effectiveness.

DOI PMID

22
Melillo J M, Mcguire A D, Kicklighter D Wet al., 1993. Global climate-change and terrestrial net primary production.Nature, 363(6426): 234-240.

23
Mittermeier R A, Turner W R, Larsen F W et al., 2011. Global Biodiversity Conservation: the Critical Role of Hotspots. In: Zachos F E, Habel J C. Biodiversity Hotspots. Berlin & Heidelberg: Springer, 3-22.

24
Naidoo R, Balmford A, Ferraro P Jet al., 2006. Integrating economic costs into conservation planning.Trends in Ecology & Evolution, 21: 681-687.Recent studies that incorporate the spatial distributions of biological benefits and economic costs in conservation planning have shown that limited budgets can achieve substantially larger biological gains than when planning ignores costs. Despite concern from donors about the effectiveness of conservation interventions, these increases in efficiency from incorporating costs into planning have not yet been widely recognized. Here, we focus on what these costs are, why they are important to consider, how they can be quantified and the benefits of their inclusion in priority setting. The most recent work in the field has examined the degree to which dynamics and threat affect the outcomes of conservation planning. We assess how costs fit into this new framework and consider prospects for integrating them into conservation planning.

DOI PMID

25
Nan W Y, 2013. On the unification of Qinghai-Tibet High Plateau nature and ecology projection.Tibetan Studies, (4): 44-51. (in Chinese)In 2011,"The Plan of Ecological Construction and Environmental Protection of Tibetan Plateau Areas",passed by the State Council,is a comprehensive and macro strategic plan which is to treat the construction of national ecological safety curtain as the key,to promote comprehensive and harmonious development of the plateau society,culture and environment.How to effectively combine the plateau construction of natural protection area and protection of nationalities cultural ecology is the key to carry out the "Plan" and to fully construct the ecological civilization of Tibetan Plateau.

26
Naughton-Treves L, Holland M, Brandon K, 2005. The role of protected areas in conserving biodiversity and sustaining local livelihoods.Annual Review of Environment and Resources, 30: 219-252.74 Abstract68The world's system of protected areas has grown exponentially over the past 25 years, particularly in developing countries where biodiversity is greatest. Concurrently, the mission of protected areas has expanded from biodiversity conservation to improving human welfare. The result is a shift in favor of protected areas allowing local resource use. Given the multiple purposes of many protected areas, measuring effectiveness is difficult. Our review of 49 tropical protected areas shows that parks are generally effective at curtailing deforestation within their boundaries. But deforestation in surrounding areas is isolating protected areas. Many initiatives now aim to link protected areas to local socioeconomic development. Some of these initiatives have been successful, but in general expectations need to be tempered regarding the capacity of protected areas to alleviate poverty. Greater attention must also be paid to the broader policy context of biodiversity loss, poverty, and unsustainable la...

DOI

27
Potter C S, Randerson J T, Field C Bet al., 1993. Terrestrial ecosystem production: A process model-based on global satellite and surface data.Global Biogeochemical Cycles, 7(4): 811-841.Many basic questions about the global carbon cycle can be addressing using a modeling approach which links remote sensing, spatial data bases of climate and soils, and mechanistic understanding of atmosphere-plant-soil biogeochemistry. This paper describes the Carnegie-Ames-Stanford approach Biosphere model for study of the terrestrial carbon cycle. 112 refs., 10 figs., 11 tabs.

DOI

28
Quan J, Ouyang Z Y, Xu W Het al., 2009. Management effectiveness of China nature reserves: Status quo assessment and counter measures.Chinese Journal of Applied Ecology, 20(7): 1739-1746. (in Chinese)Based on the questionnaire of World Bank/World Wide Fund for Nature (WB/WWF) management effectiveness tracking tool, a survey was conducted in 535 China nature reserves to assess their management effectiveness, with the countermeasures suggested. The 535 nature reserves had an average score of 5195, and 6935% of them had a score less than 60, illustrating that the general management level of our nature reserves was relatively low. There was a significant difference (P&lt;001) in the scores of management effectiveness among the nature reserves of different class and established at different time, i.e., the higher class and the longer establishing time, the higher score of management effectiveness. However, no significant differences (P&gt;005) were observed in the scores among the reserves with different area and type. The average scores of management base, management mechanism, management behavior, and management effectiveness were 155, 144, 152, and 190, respectively. The indices (management of protection targets, condition assessment, reserve boundary, resource management, and management agency) had the highest average scores, while equipment use and maintenance, community co-management, budget sources, budget expending and management, and management system and regulations had the lowest ones. The management system for China nature reserves had been generally established, the major targets and their values had been successfully protected, but there were still many problems in the management of China nature reserves, such as management mechanism and management base construction. To improve the management effectiveness, some countermeasures should be taken, e.g., establishing rational distribution and management mechanisms of budgets, strengthening ability construction, and promoting community participation.

29
Radeloff V C, Stewart S I, Hawbaker T J, 2010. Housing growth in and near United States protected areas limits their conservation value.Proceedings of the National Academy of Sciences, 107(2): 940-945.

30
Running S W, Nemani R R, Heinsch F Aet al., 2004. A continuous satellite-derived measure of global terrestrial primary production.Bioscience, 54(6): 547-560.Until recently, continuous monitoring of global vegetation productivity has not been possible because of technological limitations. This article introduces a new satellite-driven monitor of the global biosphere that regularly computes daily gross primary production (GPP) and annual net primary production. (NPP) at 1-kilometer (km) resolution over 109,782,756 km(2) of vegetated land surface. We summarize the history of global NPP science, as well as the derivation of this calculation, and current data production activity. Thefirst data on NPP from the EOS (Earth Observing System) MODIS (Moderate Resolution Imaging Spectroradiometer) sensor are presented with different types of validation. We offer examples of how this new type of data set can serve ecological science, land management, and environmental policy. To enhance the use of these data by non-specialists, we are now producing monthly anomaly maps for GPP and annual NPP that compare the current value with an 18-year average value for each pixel, clearly identifying regions where vegetation growth is higher or lower than normal.

DOI

31
Shao Q Q, Fan J W et al., 2012. Integrated Monitoring and Assessment of Ecosystem in the Source Regions of Three Rivers, China. Beijing: Science Press. (in Chinese)

32
Shvidenko A Z, Schepashchenko D G, Vaganov E Aet al., 2008. Net primary production of forest ecosystems of Russia: A new estimate.Doklady Earth Sciences, 421(2): 1009-1012.

DOI

33
Stoner C, Caro T, Mduma Set al., 2007. Assessment of effectiveness of protection strategies in Tanzania based on a decade of survey data for large herbivores.Conservation Biology, 21: 635-646.Abstract Considerable controversy surrounds the effectiveness of strictly protected areas that prohibit consumptive resource use. For Tanzania we compared temporal changes in densities of large herbivores among heavily protected national parks and game reserves, partially protected game-controlled areas, and areas with little or no protection. Comparisons based on surveys conducted in the late 1980s and early 1990s versus the late 1990s and early 2000s showed three consistent patterns across the country. First, significant declines in the densities of large herbivores between these two snapshots in time overwhelmingly outnumbered significant increases in all protection categories. Second, more species fared well (increased significantly or showed no significant change) in strictly protected national parks than in areas with partial or no protection and in heavily protected game reserves relative to areas with no protection. Third, significantly more species fared poorly (densities declined or were too low to detect a decline) than fared well in areas with partial or no protection. Our results show that although heavy protection was generally more effective in maintaining large herbivore populations than partial or no protection, continued long-term monitoring is needed in Tanzania to inform managers whether large herbivores are experiencing declining population trends even within heavily protected areas.

DOI PMID

34
Sun H L, Zheng D, Yao T Det al., 2012. Protection and construction of the national ecological security shelter zone on Tibetan Plateau.Journal of Geographical Sciences, 67(1): 3-12. (in Chinese)The shelter function of Tibetan Plateau has an important effect on the ecological security in China, even in Asia. Under the joint influence of global change and human activities, ecosystem destabilizing and resources and environment pressure increasing emerge on the Tibetan Plateau, which have caused some problems, including significant glacier retreat, serious land degradation, aggravated soil erosion and water loss, increased threats to biodiversity along with decreased rare and specious biological resources, and natural disasters increasing. These problems have a great influence on regional ecological security shelter function on the plateau. Based on the relevant research and practical experience in ecological construction, some suggestions are proposed to strengthen ecological protection and construction of the national ecological security shelter zone on the Tibetan Plateau at present, namely, strengthening basic research on the Tibetan Plateau ecological shelter impacts and regional ecological security enhancement and climate change mitigation; developing the key technology of protection and construction of the national ecological security shelter zone on the plateau and demonstration; striving to set up a monitoring system of ecological shelter function, intensifying evaluation of protection and construction efficiency of ecological security shelter zone, perfecting evaluation systems and standards, and summarizing experience, so as to enhance the overall function of national ecological security shelter and to further take the initiative in dealing with global change.

35
Underwood F M, 2012. A framework for adapting survey design through time for wildlife population assessment.Environmental and Ecological Statistics, 19: 413-436.Abstract<br/>Sampling strategies for monitoring the status and trends in wildlife populations are often determined before the first survey is undertaken. However, there may be little information about the distribution of the population and so the sample design may be inefficient. Through time, as data are collected, more information about the distribution of animals in the survey region is obtained but it can be difficult to incorporate this information in the survey design. This paper introduces a framework for monitoring motile wildlife populations within which the design of future surveys can be adapted using data from past surveys whilst ensuring consistency in design-based estimates of status and trends through time. In each survey, part of the sample is selected from the previous survey sample using simple random sampling. The rest is selected with inclusion probability proportional to predicted abundance. Abundance is predicted using a model constructed from previous survey data and covariates for the whole survey region. Unbiased design-based estimators of status and trends and their variances are derived from two-phase sampling theory. Simulations over the short and long-term indicate that in general more precise estimates of status and trends are obtained using this mixed strategy than a strategy in which all of the sample is retained or all selected with probability proportional to predicted abundance. Furthermore the mixed strategy is robust to poor predictions of abundance. Estimates of status are more precise than those obtained from a rotating panel design.<br/>

DOI

36
Victoria C J, Cheng M S, Chen X W, 2002. The development of Landscape Analysis of Wetland Function (LAWF): A GIS-based wetland functional assessment tool. Proceedings of the Water Environment Federation, Watershed, 418-424.The various functions performed by wetlands in the landscape and the associated impact on water quality utrient uptake and cycling, wildlife habitat, flood flow attenuation, contaminant binding, sediment retention, stream base flow maintenance re well documented. Regulatory agencies require protection, preservation, and when impacts are unavoidable, mitigation of wetland systems. Traditionally, replacement of wetlands is done on a strict ratio of replacement to loss, without regard to functional losses associated with the destruction of particular wetlands. Crucial aspects related to the successful establishment of these systems include proper hydrology, landscape position, and appropriate soils. Using GIS-based tools, areas for successful wetland restoration and mitigation, along with storm water management facilities, can be identified and protected.Prince George's County, Maryland, USA, has developed a GIS-based, landscape-level functional assessment application in the ArcView environment. Based upon HGM and other functional assessment approaches, the tool will be used to site mitigation banking areas, locate rare wetland types for protection and preservation, and allow the impact of public works projects proposed by the County to be evaluated before execution. Excluding certain areas from consideration before going to the field for expensive on-site evaluations allows for efficient use of County resources and protection of wetland function in an integrated, watershed-based fashion.

DOI

37
Wang W, Pechacek P, Zhang Met al., 2013. Effectiveness of nature reserve system for conserving tropical forests: A statistical evaluation of Hainan Island, China.PLoS ONE, 8(2): e57561.Evaluating the effectiveness of existing nature reserve systems for the conservation of tropical forests is an urgent task to save the remaining biodiversity. Here, we tested the effectiveness of the reserve system on Hainan Island by conducting a three-way comparison of changes in forest area in locations within the reserves, adjacent to the reserves, and far outside of the reserves. We used a general linear model to control for the effects of covariates (historical forest area, elevation, slope, and distance to nearest roads), which may also be correlated with the changes in forest area, to better explain the effectiveness of the reserve system. From 2000 to 2010, the forest area inside Hainan nature reserve system showed an increase while adjacent unprotected areas and the wider, unprotected landscape both experienced deforestation. However, the simple inside-outside comparisons may overestimate the protective effect of the reserve system. Most nature reserves (>60%) showed increasing fragmentation. And the risk of rapid deforestation remained high at low elevations, where remaining forests tend to be easily logged and converted to commercial plantations. Future conservation efforts should pay more attention to those sites with less challenging environmental conditions.

DOI

38
Wang X P, Cui G F, 2003. Nature Reserve Construction and Management. Beijing: Chemical Industry Press. (in Chinese)

39
Yan Y Y, Deng J, Zhang Z Qet al., 2014. Research progress in the protection efficacy evaluation of wildlife nature reserves.Chinese Journal of Ecology, 33(4): 1128-1134. (in Chinese)<p>Wildlife nature reserves are aimed at the conservation of wildlife population and their habitats. The protection efficacy evaluation of wildlife nature reserves is an important way to protect the wildlife resources, and it plays an important role in promoting the management effectiveness and systematic planning of nature reserves. In this paper, the evaluation of nature reserves (including the assessment on conservation value, management effectiveness, and human impact) and the assessment on the efficiency of wildlife conservation were discussed systematically. Concept and content of protection efficacy evaluation of wildlife nature reserves were defined, and the problems existing in the present studies were analyzed. The future researches related to the field should be focused on the dynamic evaluation of target species&rsquo; population and habitats, and the effectiveness of patrol and monitoring in the nature reserves.</p>

40
Yan Y Y, Yang D D, Deng Jet al., 2015. Construction of an indicator system for evaluating the protection efficacy of national nature reserves in China: A case study on terrestrial vertebrates (excluding migratory birds).Chinese Journal of Applied Ecology, 26(5): 1571-1578. (in Chinese)<div style="line-height: 150%">The protection efficacy of nature reserves is a key element in achieving targets of biodiversity conservation. It is therefore very important to develop a scientific, systematic, and accurate index system for evaluating the protection efficacy of national nature reserves in China. Using methods of frequency statistics, expert consultation, analytic hierarchy process, and demonstration survey, we present a novel index system for evaluating the protection efficacy of Chinese national nature reserves for terrestrial vertebrates (excluding migratory birds) over a 10-year period. The indicator system included one target layer, two system layers, nine factor layers, and forty index layers. The system layer included ecological effectiveness evaluation (with a score of 60%) and management effectiveness evaluation (score of 40%). The ecological effectiveness evaluation was a comprehensive, dynamic evaluation of the target species, population, habitat, and ecological system. The management effectiveness evaluation was focused on the effectiveness of patrol and monitoring. The additional part aimed to analyze the impact of humans on the target species, population and nature resources of the nature reserve. This study combined the ecological effectiveness evaluation and the management effectiveness evaluation for the first time, highlighted the importance of time and space changes, distinguished the influence of natural factors from human factors, and integrated them into the evaluation results. By emphasizing quantifiable indicators, this evaluation index system could vastly assist the protection of nature reserves by improving management effectiveness, biodiversity conservation, and macroscopic decisionmaking.</div><div style="line-height: 150%">&nbsp;</div>

41
Yang R R, 2002. Present situation of grassland degeneration and prevention measure in Ali Region, Xizang.Grassland of China, 24(1): 62-68. (in Chinese)Grassland amimal husbandry is domain of society economy in Ali region, animal husbandry production value occupy 90.26% of agricultural production value. Grassland degraded brought out the animal production declined and affected people living. The grassland input is repuire to increase artifical grassland construction, increase grassland prodaction, improve people living level.

DOI

42
Yue P C, Dai J, Li D Let al., 2011. Major issues and countermeasure in the husbandry evelopment in Tashikuergan County.Grass-Feeding Livestock, (4): 21-23. (in Chinese)

43
Zhang H Z, Lu H Y, Hong J Cet al., 2013a. Climate change and its effect on steppe animal husbandry in Northwest Tibet.Arid Zone Research, 30(2): 308-314. (in Chinese)Temperature in northwest Tibet was increased significantly, especially in dry season, precipitation was increased in most areas, but the potential evaporation was decreased during the period from 1971 to 2010. Regionally, temperature was increased significantly, precipitation was increased, potential evaporation was decreased in the central and eastern parts of northwest Tibet, and climate trended a warmingwetting pattern. However, temperature was increased, precipitation was decreased, potential evaporation was increased, and climate trended a warmingdrying pattern in the western regions including Shiquanhe. The beginning time of pasture growing and greengrass seasons became earlier, their end time was postponed, the durations were extended significantly, and the cumulative temperature and precipitation were increased significantly in these seasons. The fatten duration of livestock were extended significantly in most places 〔the tendency rate was 2.7 d&bull;(10a) <sup>-1</sup>〕, and the fatloss duration was in a significant reduction 〔the tendency rate was 6.1 d&bull;(10a)<sup>-1</sup>〕 in northwest Tibet in recent 35 years. Climate change was in a favorable trend for steppe animal husbandry in the northwest Tibet. It is of significance for controlling steppe degeneration to rationally regulate the livestock structure and limit the number of livestock, especially goats in northwest Tibet.

44
Zhang R Z, Li B Y, Zhang H X et al., 2012. Regional System of Natural Reserves in China. Beijing: China Environmental Science Press. (in Chinese)

45
Zhang W, 2007. Research of land use/cover classification and carbon stocks: A case study on Tibetan Plateau [D]. Beijing: Graduate University of Chinese Academy of Sciences. (in Chinese)

46
Zhang Y L, Li B Y, Zheng D, 2002. A discussion on the boundary and area of the Tibetan Plateau in China.Geographical Research, 21(1): 1-8. (in Chinese)The Tibetan Plateau is a unique geomorphic unit composed of some basic geomorphic types, such as extreme high mountains,high mountains, hills, plains, and tablelands of high altitude or sub-high altitude. Different opinions for the exact scope of Tibetan Plateau exist. According to latest research achievement and the long time fieldwork, questions related to the area and boundary of the Plateau have been discussed in view of geography, and the principles taking geomorphic characters as the main rule and considering the integrity have been made to define the boundary. The 1∶1 000 000 geomorphological map was compiled based on 1∶100 000 aerial photographic map,1∶500 000 topographic map and interpretation of satellite images. By refering to the 1∶3 000 000 relief map, the boundary of the Plateau was delineated.The position of the boundary was quantitatively determined with GIS and GPS.The map of electronic version of the Tibetan Plateau was compiled. The main conclusion is that Tibetan Plateau starts from the southern edge of the Himalayan Range, abuts on India,Nepal and Bhutan,connects the northern edge of Kunlun, Altun and Qilian Mts., and joins Tarim Basin and Hexi Corridor in Central Asia.The west of it is the Pamirs and Karakorum Mts., bordering on Kirghizistan, Tajikistan, Afghanistan, Pakistan and Kashmir. The east of it is Yulongxueshan, Daxueshan, Jiajinshan and Qionglaishan Mts.as well as south or east piedmont of Minshan Mts. Tibetan Plateau joins the Qinling Mts.and Loess Plateau with its eastern and northeastern part. Tibetan Plateau in China's territory starts from the Pamirs in the west and reaches to Hengduanshan in the east. It bestrides a longitude of 31 degrees with a length of 2 945 km from east to west,and bestrides a latitude of 13 degrees with a length of 1 532 km from south to north. It ranges from 26°00′12" N to 39°46′50" N and from 73°18′52"E to 104°46′59"E, covering an area of 2 572.4×10 3 km 2. Administratively, it embraces 201 counties (cities) in 6 provinces, namely, the Tibet Autonomous Region (73 counties/cities,1 176.0×10 3 km 2, part of Cona, Mêdog and Zayü), the Qinghai Province(40 counties/cities,721.0×10 3 km 2, some counties only partially), Dêqen Tibetan Autonomous Prefecture in Northwest Yunnan Province(9 counties/cities,33.5×10 3 km 2), West Sichuan Province ( 46 counties/cities about 254.0×10 3 km 2 ,such as Garze Autonomous Prefecture, Aba Tibetan and Qiangzu Autonomous Prefecture,and Muli Autonomous County, etc.),Gansu Province(21 counties/cities, 74.9×10 3 km 2), and Southern Xinjiang Uygur Autonomous Region (about 12 counties/cities, 313.0×10 3 km 2).

DOI

47
Zhang Y L, Qi W, Zhou C Pet al., 2014. Spatial and temporal variability in the net primary production of alpine grassland on the Tibetan Plateau since 1982.Journal of Geographical Sciences, 24(2): 269-287.lt;p>Based on the GIMMS AVHRR NDVI data (8 km spatial resolution) for 1982-2000,the SPOT VEGETATION NDVI data (1 km spatial resolution) for 1998-2009,and observational plant biomass data,the CASA model was used to model changes in alpine grassland net primary production (NPP) on the Tibetan Plateau (TP). This study will help to evaluate the health conditions of the alpine grassland ecosystem,and is of great importance to the promotion of sustainable development of plateau pasture and to the understanding of the function of the national ecological security shelter on the TP. The spatio-temporal characteristics of NPP change were investigated using spatial statistical analysis,separately on the basis of physico-geographical factors (natural zone,altitude,latitude and longitude),river basin,and county-level administrative area. Data processing was carried out using an ENVI 4.8 platform,while an ArcGIS 9.3 and ANUSPLIN platform was used to conduct the spatial analysis and mapping. The primary results are as follows:(1) The NPP of alpine grassland on the TP gradually decreases from the southeast to the northwest,which corresponds to gradients in precipitation and temperature. From 1982 to 2009,the average annual total NPP in the TP alpine grassland was 177.2&times;10<sup>12</sup> gC yr<sup>-1</sup>(yr represents year),while the average annual NPP was 120.8 gC m<sup>-2</sup> yr<sup>-1</sup>. (2) The annual NPP in alpine grassland on the TP fluctuates from year to year but shows an overall positive trend ranging from 114.7 gC m<sup>-2</sup> yr<sup>-1</sup> in 1982 to 129.9 gC m<sup>-2</sup> yr<sup>-1 </sup>in 2009,with an overall increase of 13.3%;32.56% of the total alpine grassland on the TP showed a significant increase in NPP,while only 5.55% showed a significant decrease over this 28-year period. (3) Spatio-temporal characteristics are an important control on annual NPP in alpine grassland:a) NPP increased in most of the natural zones on the TP,only showing a slight decrease in the Ngari montane desert-steppe and desert zone. The positive trend in NPP in the high-cold shrub-meadow zone,high-cold meadow steppe zone and high-cold steppe zone is more significant than that of the high-cold desert zone;b) with increasing altitude,the percentage area with a positive trend in annual NPP follows a trend of &quot;increasing-stable-decreasing&quot;while the percentage area with a negative trend in annual NPP follows a trend of &quot;decreasing-stable-increasing&quot;with increasing altitude;c) the variation in annual NPP with latitude and longitude co-varies with the vegetation distribution;d) the variation in annual NPP within the major river basins has a generally positive trend,of which the growth in NPP in the Yellow River Basin is most significant. Results show that,based on changes in NPP trends,vegetation coverage and phonological phenomenon with time,NPP has been declining in certain places successively,while the overall health of the alpine grassland on the TP is improving.</p>

DOI

48
Zhang Y L, Wang Z F, Wang X Het al., 2013b. Land cover changes in the key regions and self reflection on ecological construction of the Tibetan Plateau.Chinese Journal of Nature, 35(3): 187-192. (in Chinese)<p>The Tibetan Plateau is an important ecological security shelter zone for China. The unique and sensitive ecosystems of<br />the plateau are main supports for its ecological shelter function and the basis for regional economic and social sustainable<br />development. As for the large plateau, each district has its own ecological function and regional problems due to the regional<br />differentiation in natural conditions. Therefore, it is necessary to take proper measures for ecological construction and protection<br />according to local conditions. This paper identified four key areas for ecological construction: western Ngari, central and southern<br />Nagqu, source region of three rivers (the Yangtze River, the Yellow River and Lancang River) and the region of three parallel rivers<br />(Nujiang River, Lancang River and Jinsha River) according to the integrated analysis of main functions, fragile degree, changing<br />trend and risk characteristics of ecosystems. Some suggestions and measures were put forward to stabilize and to promote ecological<br />function, based on regional ecological system characteristics, land cover changes and their driving factors. These suggestions could<br />be very useful to protect and restore ecological security shelter function.</p>

49
Zhang Y L, Wu X, Qi Wet al., 2015. Characteristics and protection effects of the nature reserves in Tibetan Plateau, China.Resources Science, 37(7): 1455-1464. (in Chinese)As one of the important measures to protect typical ecosystems,natural resources,biodiversity,and rare and endangered species resource,nature reserve construction and its effectiveness on the Tibetan Plateau has been the focus of attention from all walks of life. Here,we use the latest list of China's nature reserve data,published NPP and protection effectiveness data to study the composition,distribution characteristics and protection effectiveness of nature reserves on the Tibetan Plateau. We found that since 1963,155 nature reserves of various types have been constructed on the Tibetan Plateau with an area of 822,400km<sup>2</sup>accounting for 31.97% of the plateau&#x02019;s land area. Nature reserve types are mainly composed of wildlife and desert ecosystems,wildlife and ecosystems,and wildlife,respectively accounting for 36.84%,33.35%,6.80% of the total area of nature reserves. Over time authorities have formed natural reserve system on the Tibetan Plateau with the characteristics of an ultra-large reserve base,mainly distributed in central and south-east,and various types of protection. After more than 50 years of ecological construction,the protective effect of the Reserves is significant. Mainly performance in rare and endangered species number increased significantly,the endangered Tibetan red deer (<em>Cervus elaphus wallichi</em>)was rediscovered,wildlife habitat has been restored and improved,and the ecological function of typical reserve grassland vegetation enhanced.

50
Zheng Y M, Zhang H Y, Niu Z Get al., 2012. Protection efficacy of national wetland reserves in China.Chinese Science Bulletin, 57(4): 207-230. (in Chinese)

51
Zheng Y W, Xue D Y, Zhang G S, 1994. Study on ecological evaluation criteria and standards for nature reserves in China.Rural Eco-Environment, 10(3): 22-25. (in Chinese)

Outlines

/