Orginal Article

Latitudinal variation of leaf morphological traits from species to communities along a forest transect in eastern China

  • WANG Ruili , 1, 2 ,
  • *YU Guirui , 1 ,
  • *HE Nianpeng , 1 ,
  • WANG Qiufeng 1 ,
  • ZHAO Ning 3 ,
  • XU Zhiwei 4
Expand
  • 1. Key Laboratory of Ecosystem Network Observation and Modeling, Institute of Geographic Sciences and Natural Resources Research, CAS, Beijing 100101, China
  • 2. University of Chinese Academy of Sciences, Beijing 100049, China
  • 3. Cold and Arid Regions Environmental and Engineering Research Institute, CAS, Lanzhou 730000, China
  • 4. School of Geographical Sciences, Northeast Normal University, Changchun 130024, China

Author: Wang Ruili (1988-), PhD, specialized in variation of plant functional traits. E-mail:

*Corresponding author: Yu Guirui, Professor, E-mail: .He Nianpeng, Associate Professor, E-mail:

Received date: 2015-08-21

  Accepted date: 2015-09-22

  Online published: 2016-01-25

Supported by

National Natural Science Foundation of China, No.31290221, No.31470506

Chinese Academy of Sciences Strategic Priority Research Program, No.XDA05050702

Program for Kezhen Distinguished Talents in Institute of Geographic Sciences and Natural Resources Research, CAS, No.2013RC102

Copyright

Journal of Geographical Sciences, All Rights Reserved

Abstract

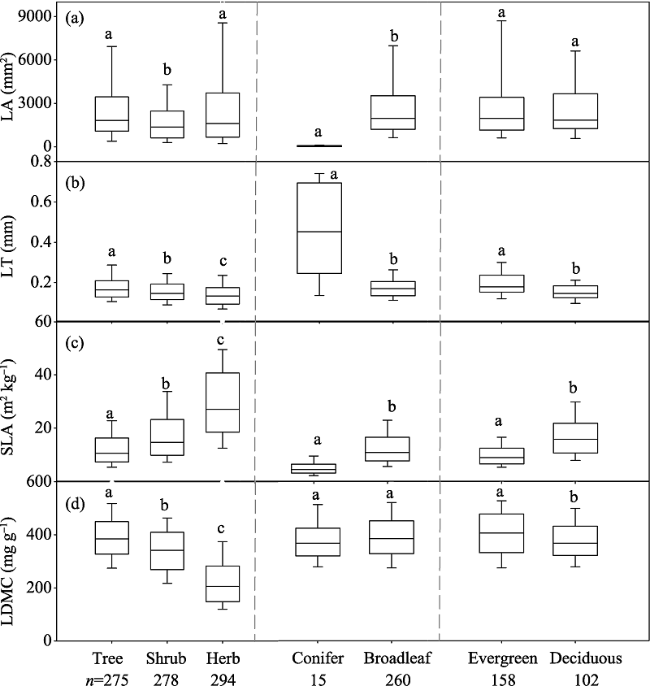
Comprehensive information on geographic patterns of leaf morphological traits in Chinese forests is still scarce. To explore the spatial patterns of leaf traits, we investigated leaf area (LA), leaf thickness (LT), specific leaf area (SLA), and leaf dry matter content (LDMC) across 847 species from nine typical forests along the North-South Transect of Eastern China (NSTEC) between July and August 2013, and also calculated the community weighted means (CWM) of leaf traits by determining the relative dominance of each species. Our results showed that, for all species, the means (± SE) of LA, LT, SLA, and LDMC were 2860.01 ± 135.37 mm2, 0.17 ± 0.003 mm, 20.15 ± 0.43 m2 kg-1, and 316.73 ± 3.81 mg g-1, respectively. Furthermore, latitudinal variation in leaf traits differed at the species and community levels. Generally, at the species level, SLA increased and LDMC decreased as latitude increased, whereas no clear latitudinal trends among LA or LT were found, which could be the result of shifts in plant functional types. When scaling up to the community level, more significant spatial patterns of leaf traits were observed (R2 = 0.46-0.71), driven by climate and soil N content. These results provided synthetic data compilation and analyses to better parameterize complex ecological models in the future, and emphasized the importance of scaling-up when studying the biogeographic patterns of plant traits.

Cite this article

WANG Ruili , *YU Guirui , *HE Nianpeng , WANG Qiufeng , ZHAO Ning , XU Zhiwei . Latitudinal variation of leaf morphological traits from species to communities along a forest transect in eastern China[J]. Journal of Geographical Sciences, 2016 , 26(1) : 15 -26 . DOI: 10.1007/s11442-016-1251-x

1 Introduction

Leaves are the primary organs of photosynthesis in terrestrial ecosystems (Poorter et al. 2009). Leaf morphological traits, e.g., leaf area (LA), leaf thickness (LT), specific leaf area (SLA), and leaf dry matter content (LDMC), may reflect the leaf photosynthetic capacity and resource-use strategy of plant species experiencing changes in environmental conditions (Chapin et al., 1993; Poorter et al., 2009; Garnier and Navas, 2012). In addition, these traits are relatively easy and quick to measure when comparing the chemical and physiological traits of leaves (Cornelissen et al., 2003), thus they have received special attention in the analysis of variation in leaf traits at the regional and global scales (Wright et al., 2004; Reich et al., 2007; Kazakou et al., 2014).
In the past few decades, a number of scientists have investigated the spatial patterns of leaf functional traits along environmental gradients and demonstrated that their geographic patterns were shaped by environmental factors (climatic and edaphic gradients) and phylogenetic differences (Reich et al., 2007; Poorter et al., 2009; Ordonez et al., 2010; Hodgson et al., 2011; Moles et al., 2014). For example, leaves in habitats characterized by high temperature and insolation or water limitation generally show high LT and LDMC (Niinemets, 2001) but low SLA (Poorter et al., 2009). However, these studies on global leaf traits involve only a small number of forest ecosystems in China, and there is a lack of comprehensive information concerning geographic patterns of leaf morphological traits in Chinese forests. Here, we aimed to fill the gap by analyzing a dataset covering 847 forest species across a wide range of environments in China.
Another challenge in leaf trait research is that majority of studies have conducted their analyses at the species level (across the species pool or average), and thus have shed little light on the adaptive mechanisms of plant communities along large-scale environmental gradients as a result of community assembly. Moreover, it is impossible, in theory, to build direct links between species-level leaf traits and ecosystem function on a large scale (Wang et al., 2015). Recently, some ecologists have incorporated the community weighted mean (CWM) into leaf traits to assess community dynamics and ecosystem function. To do this, the leaf-level measurements are weighted by the relative abundance of each species in each plot (Garnier et al., 2004; Vile et al., 2006), and clear trends were found in community-level leaf traits along gradients of soil water availability (Cornwell and Ackerly, 2009), light (Domínguez et al., 2012), the duration of abandonment (Garnier et al., 2004; Vile et al., 2006), and grazing disturbance (Klumpp and Soussana, 2009). However, most of these studies were conducted on a local scale, and little is known concerning the spatial variation in community-level leaf traits along these environmental gradients on a large scale (e.g., across different climate zones).
The North-South Transect of Eastern China (NSTEC) spans from a tropical rain forest in the south to a cold-temperate coniferous forest in the north, including almost all forest types in the Northern Hemisphere (Zhang and Yang, 1995) (Figure 1 and Table 1). This transect, therefore, provides an ideal set of experimental plots to explore the ecological and evolutionary responses of plants to environmental changes on a large scale. We comprehensively investigated LA, LT, SLA, and LDMC across 847 common plant species from nine typical forests along the NSTEC. Based on these measured data, we analyzed the biogeographic patterns of leaf morphological traits at the species and community levels, and specifically investigated: 1) the latitudinal patterns of variation in leaf morphological traits, and whether they are similar at the species and community levels or not; 2) the primary factors controlling latitudinal variation.

2 Materials and methods

2.1 Study sites and field sampling

The NSTEC is the 15th standard transect of the International Geosphere-Biosphere Program (IGBP), which extends from the Hainan Island to the northern border of China, ranging from 108°E-118°E to less than 40°N, and from 118°E-128°E to a minimum of 40°N, including 25 provinces and approximately 1/3 of China. Due to the influence of the eastern Asian monsoon, the climate in the NSTEC differs from that found in Europe and North America, and is characterized by clear latitudinal gradients of temperature and precipitation. Correspondingly, different types of zonal forest ecosystems are distributed along the NSTEC from north to south, including cold-temperate coniferous forests, temperate mixed forests, warm-temperate deciduous broad-leaved forests, subtropical evergreen broad-leaved forests, and tropical monsoon rainforests (Zhang and Yang, 1995; Yu et al., 2006).
A field survey was carried out between July and August in 2013 across nine natural forests along the NSTEC. These sampling sites, from south to north, were Jianfengling (JF), Dinghu Mountain (DH), Jiulian Mountain (JL), Shennongjia (SN), Taiyue Mountain (TY), Dongling Mountain (DL), Changbai Mountain (CB), Liangshui (LS), and Huzhong (HZ) (Figure 1). The specific characteristics of the nine sampling sites are described in Table 1.
Figure 1 Geographic locations and vegetation types of sampling sites. JF, Jianfengling; DH, Dinghu Mountain; JL, Jiulian Mountain; SN, Shennongjia; TY, Taiyue Mountain; DL, Dongling Mountain; CB, Changbai Mountain; LS, Liangshui; HZ, Huzhong. Different colors highlighted in the North-South Transect of Eastern China (NSTEC) represent different vegetation types (Zhang and Yang, 1995).
Table 1 Environmental characteristics and vegetation types of sampling sites
Site Latitude
(°N)
Longitude
(°E)
MAT
(°C)
MAP
(mm)
SN
(mg g-1)
Vegetation type No. of
species
JF 18.7 108.9 19.8 2449.0 1.95 Tropical monsoon rainforest 139
DH 23.2 112.5 20.9 1927.0 1.76 Subtropical evergreen broad-leaved forest 158
JL 24.6 114.4 16.7 1954.0 2.35 Subtropical evergreen broad-leaved forest 172
SN 31.3 110.5 10.6 1330.0 3.76 Subtropical mixed evergreen and deciduous broad-leaved forest 120
TY 36.7 112.1 6.2 662.0 2.56 Temperate deciduous
broad-leaved forest
76
DL 40.0 115.4 4.8 539.1 3.12 Temperate deciduous
broad-leaved forest
79
CB 42.4 128.1 2.6 691.0 6.37 Temperate mixed forest 109
LS 47.2 128.9 -0.3 676.0 4.59 Temperate mixed forest 104
HZ 51.8 123.0 -4.4 481.6 3.15 Cold-temperate coniferous forest 88

Note: MAT, mean annual temperature; MAP, mean annual precipitation; SN, soil N content.

A detailed description of the floristic and environmental survey methods used here is presented in Wang et al. (2015). Briefly, we first established four sampling plots (30 × 40 m) in each forest ecosystem. Then, the geographic information (latitude, longitude, and altitude) as well as community structure was assessed for each plot. We recorded all plant individuals within each plot, and measured height and diameter-at-breast-height (DBH) for each woody individual with DBH ≥ 2 cm. For herbs, aboveground biomass was harvested and oven-dried. Meanwhile, 20 healthy mature leaves were collected from four individuals of each plant species and were measured as soon as possible after collection (within 4-8 h). A total of 1047 species-at-site observations were completed in 32 plots across nine forest ecosystems, representing 847 plant species in 427 genera and 159 families (some plant species were found in several forest types), including angiosperms, gymnosperms, and pteridophytes.

2.2 Leaf functional trait measurements

Following the standardized procedures of Cornelissen et al. (2003), LA (mm2, leaf projected surface area), LT (mm), SLA (m2·kg-1, the one-sided area of a fresh leaf divided by its oven-dried mass), and LDMC (mg·g-1, the oven-dried mass of a leaf divided by its water-saturated fresh mass) were determined for ten fully expanded leaves per individual sampled. LA was measured with a scanner (CanoScan LiDE 110, Japan) and Photoshop CS (Adobe Systems, San Jose, USA), while LT was measured with an electronic digital caliper on five to ten points per leaf (blade), avoiding the mid-vein. Leaves were then oven-dried at 70°C for 48 h and weighed to calculate SLA and LDMC.

2.3 Community-level leaf traits

To measure leaf traits at the community level, we calculated the CWMs of leaf traits as the community-level integrative indices (Garnier et al., 2004), as follows:
where Pi is the relative dominance of species i within a community based on the aboveground biomass. For woody plants, aboveground biomass, including stems, branches, and leaves, was calculated using species-specific allometric regressions with DBH and height, which were obtained from the Chinese Ecosystem Research Net (CERN) database (http:// 159.226.111.42/pingtai/cernc/index.jsp), published studies, and our previous field measurements. When the allometric equations of a species were not available, we substituted the equations from the same genera, and used similar plant functional type (PFT), or mixed-species equations of a specific forest. A total of 246 allometric biomass equations (R2 = 0.52-1.00) were implemented in this study. All of the allometric regressions are available in Wang et al. (2015). For herbs, the aboveground live biomass was sorted according to species and weighted after drying.

2.4 Environmental data

Mean annual temperature (MAT, ºC) and mean annual precipitation (MAP, mm) for each study site were derived from the meteorological database (1961-2007) produced by CERN (He et al., 2014).
At each plot, soil samples were taken at depths of 0-10 cm using a 6 cm diameter auger and were sieved to remove roots and visible organic debris. Samples were mixed thoroughly and air-dried prior to chemical analyses. Soil total carbon (SC, mg·g-1) and nitrogen (SN, mg·g-1) were determined by an elemental analyzer (Vario MAX CN; Elementar, Germany).

2.5 Data analysis

Data of leaf traits were log10 transformed when it was necessary to obtain approximate normality and homogeneity of residuals. Species-by-site data were averaged for each species, and the average for each species was then classified into different groups: growth form (herbs, shrubs, and trees), leaf type (coniferous and broad-leaved trees), and leaf habit (evergreen and deciduous broad-leaved trees). A one-way analysis of variance (ANOVA) with least significant difference (LSD) post-hoc testing was used to compare leaf traits among various PFTs.
To investigate the latitudinal patterns of leaf traits, we first related leaf traits to latitude using a polynomial regression at the species and community levels. Next, to decompose the variance of species-level leaf traits into among-site and within-site components, these data were further analyzed through nested ANOVAs with species nested within sites.
Then, we qualified the effects of environmental variables and PFT on each of the leaf traits using mixed-effect models and the lmer function in the package lme4 (R version 2.15). For species-level traits, we treated PFT and environmental variables as fixed effects and sites as a random effect in order to account for the non-independence of species occurring at the same site. Given that the environmental variables were strongly coupled with each other, only one of the climate and soil variables was included in each main effect model to avoid instance of multiple collinearity. The environmental factors with significant effects (P < 0.05) on leaf traits and interaction terms between PFT and the environmental variables were included in the final models. For community-level traits, the explanatory variables were climatic and soil variables. If more than one environmental variable was significant, models with lower Akaike’s Information Criterion (AIC) values were selected as the final best-fit models (Aho et al., 2014).
All analyses were conducted using SPSS 13.0 statistical software (SPSS Inc., Chicago, IL, USA, 2004) and R software (version 2.15.2, R Development Core Team 2012). The significance levels were set at P < 0.05.

3 Results

3.1 Overall statistics of leaf traits

For all 847 species, the means (± standard error, SE) of LA, LT, SLA, and LDMC were 2860.01 ± 135.37 mm2, 0.17 ± 0.003 mm, 20.15 ± 0.43 m2·kg-1, and 316.73 ± 3.81 mg·g-1, with ranges of 4.09-56085.43 mm2, 0.01-0.78 mm, 1.89-94.99 m2 kg-1, and 44.46-775.68 mg·g-1 (Table 2), respectively. Among these four traits, the LA had the greatest variation (coefficient of variation, CV=1.51), and that of the LDMC was the least (CV=0.39).
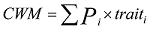
Table 2 Statistics for leaf traits at the species and community levels
Level Traits n Mean Minimum Maximum SE CV Skewness
Species LA (mm2) 847 2860.01 4.09 56085.4 135.37 1.51 5.54
LT (mm) 847 0.17 0.01 0.78 0.003 0.56 2.71
SLA (m2·kg-1) 847 20.15 1.89 94.99 0.43 0.68 1.29
LDMC (mg·g-1) 847 316.73 44.46 775.68 3.81 0.39 0.27
Community LACWM (mm2) 32 1443.8 22.98 3547.5 169.35 0.66 0.49
LTCWM (mm) 32 0.34 0.18 0.69 0.03 0.46 1.00
SLACWM (m2·kg-1) 32 9.83 5.08 18.34 0.71 0.41 0.68
LDMCCWM (mg·g-1) 32 421.78 364.16 544.01 8.76 0.12 0.72

Note: n, number of species or plots; SE, standard error; CV, coefficient of variation.

At the community level, the means (± SE) of LACWM, LTCWM, SLACWM, and LDMCCWM were 1443.80 ± 169.35 mm2, 0.34 ± 0.03 mm, 9.83 ± 0.71 m2·kg-1, and 421.78 ± 8.76 mg·g-1, respectively (Table 2). Similar to what was found among species, the variation was greatest for LA and the least for LDMC.

3.2 Differences in leaf traits among functional types

Results of the ANOVA analyses showed that leaf traits varied largely among different PFTs (Figure 2). Compared with the values obtained for shrubs and trees, the leaves of herbs had higher LA and SLA (LA: F = 6.90, P = 0.001; SLA: F = 201.13, P < 0.001) but lower LT and LDMC (LT: F = 18.39, P < 0.001; LDMC: F = 231.02, P < 0.001). The broad-leaved trees had larger LA and SLA (LA: F = 6.90, P = 0.001; SLA: F = 201.13, P < 0.001) and thinner leaves (LT: F = 213.61, P < 0.001) than those of the coniferous trees. Evergreen broadleaves had higher LT and LDMC (LT: F = 37.34, P < 0.001; LDMC: F = 5.06, P = 0.025) and lower SLA (F = 83.13, P < 0.001) than those of their deciduous counterparts.
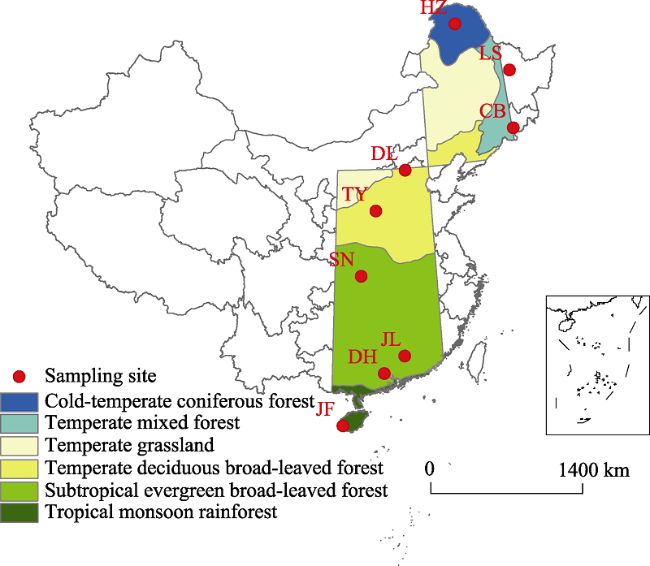
Figure 2 Differences in leaf traits among plant functional types. The black lines across the boxes are median values. n, species number. Statistical differences are denoted using different letters (P < 0.05).

3.3 Latitudinal patterns of leaf traits at the species and community levels

Latitudinal variation in leaf traits differed remarkably between the species level and community level (Figure 3). At the species level, similar trends occurred when analyzing the latitudinal variation in leaf traits of trees, shrubs, and herbs. In general, SLA increased and LDMC decreased with increasing latitude (P < 0.05), whereas the latitudinal trends of LA and LT were weak (R2 = 0.02-0.06, P < 0.05, Figure 3a).
Figure 3 Latitudinal patterns of leaf traits at the species (a) and community levels (b). Error bars in panels (b) represent ± 1 standard error. Only significant regressions are given (P < 0.05).
At the community level, as latitude increased, LACWM and SLACWM initially increased and then decreased, while LTCWM increased and LDMCCWM decreased linearly (all P < 0.05, Figure 3b).
The results of nested ANOVA analyses revealed that 38.15%-50.87% of the variance in species-level leaf traits occurred within sites, and 15.96%-37.20% of the variance occurred across sites (Figure 4). In addition, compared with SLA and LDMC, a higher proportion of the variance (> 49%) in LA and LT was attributed to differences among species within a site.
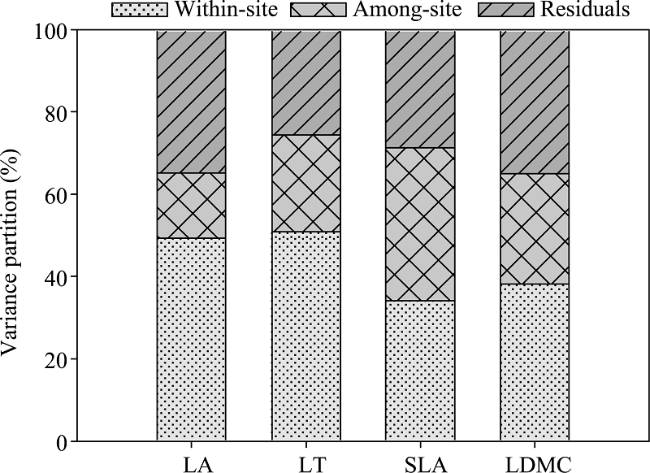
Figure 4 Variance partitioning of species-level leaf traits into within-site, among-site, and residual components

3.4 Factors influencing latitudinal variation in leaf traits

From the results of mixed-effect models, the PFT could explain the largest proportion of the variation in LA, LT, SLA, and LDMC (19.43%-41.57%, Table 3) at the species level, while the effects of climate and soil nutrition were trivial (1.65%-9.13%, Table 3). However, the variation of community-level leaf traits was mainly driven by climate and soil N content. Specifically, MAT was the most important factor influencing variation in LACWM and LDMCCWM, and accounted for 25.08% and 48.04% of the total variation, respectively. In addition, 32.75% of the variation in LTCWM was explained by MAP, and 36.41% of that in SLACWM depended on soil N (Table 4).
Table 3 Influences of the plant functional type and environmental factors on species-level leaf traits
Factor Log LA Log LT Log SLA Log LDMC
df F SS% df F SS% df F SS% df F SS%
PFT 4 56.79** 19.43 4 1.26** 41.57 4 163.24** 36.83 4 129.50** 34.18
MAT 1 98.16** 6.72 1 41.41** 2.19
MAP 1 25.22** 1.65 1 127.55** 5.76
SN 1 30.49** 2.09 1 139.73** 9.13 1 197.69** 8.92 1 77.47** 4.09
PFT×MAT 4 9.90** 2.09
PFT×MAP 4 4.45** 1.16 4 6.73** 1.21
PFT×SN 4 3.90** 1.02 4 2.67* 0.48 4 4.30** 0.91
MAT×SN 1 10.18** 0.54
MAP×SN 1 80.67** 5.27 1 12.48** 0.56
Site 8 6.31** 3.46 8 5.14** 2.68 8 3.86** 1.39 8 4.51** 1.90
Residuals 997 68.31 1001 65.51 992 44.85 1022 54.11

Note: PFT, plant functional type; MAT, mean annual temperature; MAP, mean annual precipitation; SN, soil N concentration; df, degrees of freedom; SS%, percentage of sum of squares explained. *, P < 0.05; **, P < 0.01.

Table 4 Influences of environmental factors on community-level leaf traits
Factor Log LACWM Log LTCWM Log SLACWM Log LDMCCWM
df F SS% df F SS% df F SS% df F SS%
MAT 1 3.34* 25.08 1 7.77* 16.51 1 22.56** 48.04
MAP 1 5.30** 32.75
SN 1 7.75** 36.41
MAT×SN 1 0.003 1.79
Site 8 14.09** 58.43 8 14.99** 54.87 8 5.86* 15.42 8 1.471 3.01
Residuals 22 16.49 22 12.38 20 29.87 22 48.95

Note: MAT, mean annual temperature; MAP, mean annual precipitation; SN, soil N concentration; df, degrees of freedom; SS%, percentage of sum of squares explained. *, P < 0.05; **, P < 0.01.

4 Discussion

This study comprehensively documented the biogeographic patterns of leaf morphological traits among forest ecosystems in eastern China. The ranges of LA, LT, SLA, and LDMC were comparable to those reported in other regions (Cornelissen et al., 2003; Hodgson et al., 2011), although they varied largely across 847 species.

4.1 Latitudinal variation in species-level leaf traits and the controlling factors

Clear latitudinal trends were observed for SLA and LDMC, whereas the trends for LA and LT were weak (Figure 3a). Compared with SLA and LDMC, higher variation in LA and LT among co-existing species within a site (> 49%, Figure 4) may result in relatively weak spatial variation. Similarly, in an analysis of global leaf traits, Moles et al. (2014) found that the majority of variation occurred at the local scale or within communities, e.g., 34% for plant height and 43% for LA. The larger variance occurring within sites may be the result of micro-site variability, phylogenetic or historical effects, or biotic interactions and competition (Ordonez et al., 2010). This indicates that taking inter-specific differences and site scale (or community-level scale) into consideration is essential for the study of biogeography and the assessment of plant trait variability (Liu et al., 2010; Freschet et al., 2011).
The spatial variation of leaf morphological traits at the species level was mainly controlled by shifts in the PFT, while climate and soil nutrient availability had only marginal effects (Table 3). This is in line with the idea that the PFT may account for more global variation in leaf economic traits compared to climatic metrics (Reich et al., 2007). Variation in leaf morphological traits among PFTs is considered to be a result of genetic and adaptive differences to the external environment (Ordonez et al., 2010).
In spite of the weak relationships between environmental variables and leaf traits, climate and soil variables may exert both direct and indirect effects on the patterns of leaf traits. Through regulating the metabolic activity and carbon allocation of plants (Moles et al., 2014), climate directly influences the morphology of leaves. In addition, climate may influence the geographic distribution of leaf traits indirectly by shaping the biogeography of the vegetation as well as soil nutrient availability (Chapin et al., 2002; Ordonez et al., 2009).

4.2 Latitudinal variation in community-level leaf traits and the driving factors

In comparison with species-level leaf traits, community-level leaf traits have stronger relationships with latitude (Figure 3b). Domínguez et al. (2012) and Vile et al. (2006) reported similar results on a local scale that, compared with species-level plant traits, more significant trends along the light gradient or according to forest age were found when species abundance was considered using CWM values. These results suggested that species-level traits (especially the mean values across different plant species) did not accurately reflect the real community-level traits unless the relative abundance of species was considered. This was because the processes and functioning of ecosystems are overwhelmingly determined by the functional traits of the dominant species within a specific community (the mass ratio hypothesis) (Garnier et al., 2004). In other words, the substitution of species mean traits for community-level traits may undermine or cancel the influence of the dominant species and misconstrue results (Vile et al., 2006). In contrast, the CWM values, which integrate the data from the community structure (Garnier et al., 2004), can better explain the response of the real community to environmental factors on a large scale (Cornwell and Ackerly, 2009; Domínguez et al., 2012).
Climate or soil N had a strong influence on community-level traits and their latitudinal patterns (Table 4), indicating that these were the main environmental parameters driving the latitudinal patterns of community-level leaf traits through the regulation of species composition. According to community assembly theory, species turnover within communities across abiotic gradients is primarily derived from the adaptive differences of each species to the external habitat (Cornwell and Ackerly, 2009; Andersen et al., 2012). In this study, on one side of the environmental gradient from south to north, woody plant species with evergreen broadleaves (low SLA but high LDMC) dominated in the tropic regions characterized by hot, humid, and infertile habitats, accompanied by low SLACWM and high LDMCCWM. On the other side, distinct seasons and fertile habitats in temperate forests favor deciduous trees with high SLA (thus high SLACWM). Coniferous species dominate at high latitude with low LA and SLA but high LT allows them to increase leaf mechanical resistance (Onoda et al., 2011) and minimize the incidence and severity of freezing stress (Poorter et al., 2009), resulting in low LACWM and SLACWM and high LTCWM.

5 Conclusions

This study is, to our knowledge, the first to comprehensively document the biogeographic patterns of leaf morphological traits in Chinese forests and quantify the potential influencing factors at both the species and community levels. The main results and conclusions are:
(1) Across 847 species from nine forest ecosystems in eastern China, the means (± SE) of LA, LT, SLA, and LDMC were 2860.01 ± 135.37 mm2, 0.17 ± 0.003 mm, 20.15 ± 0.43 m2·kg-1, and 316.73 ± 3.81 mg·g-1, respectively.
(2) At the community level, the means (± SE) of LACWM, LTCWM, SLACWM, and LDMCCWM were 1443.80 ± 169.35 mm2, 0.34 mm ± 0.03, 9.83 ± 0.71 m2·kg-1, and 421.78 ± 8.76 mg·g-1, respectively.
(3) Different latitudinal variations in leaf morphological traits were observed at the species and community levels. At the species level, SLA increased and LDMC decreased with increasing latitude, whereas no clear latitudinal trends in LA or LT were found. When scaling up to the community level, more significant spatial patterns in leaf traits were observed (R2 = 0.46-0.71, P < 0.05).
(4) Different factors controlled these spatial patterns of leaf traits at the species and community levels. Specifically, changes in PFT were the main influencing factor regarding the latitudinal variation of species-level traits, while for community-level leaf traits, climate and soil N content acted as the main environmental parameters driving latitudinal patterns through the shifts of species composition within communities.
These findings suggest that the real community-level traits could not be simply represented by those of the species pool or among the most common species identified, and emphasize the importance of considering community structure in analyses when scaling-up from organisms to populations, communities, or ecosystems.

The authors have declared that no competing interests exist.

1
Aho K, Derryberry D, Peterson T, 2014. Model selection for ecologists: The worldviews of AIC and BIC.Ecology, 95: 631-636.Comment in Ecology. 2014 Mar;95(3):651-3. Comment on Ecology. 2014 Mar;95(3):611-7.

DOI PMID

2
Andersen K M, Endara M J, Turner B Let al., 2012. Trait-based community assembly of understory palms along a soil nutrient gradient in a lower montane tropical forest.Oecologia, 168: 519-531.Abstract<br/>Two opposing niche processes have been shown to shape the relationship between ecological traits and species distribution patterns: habitat filtering and competitive exclusion. Habitat filtering is expected to select for similar traits among coexisting species that share similar habitat conditions, whereas competitive exclusion is expected to limit the ecological similarity of coexisting species leading to trait differentiation. Here, we explore how functional traits vary among 19 understory palm species that differ in their distribution across a gradient of soil resource availability in lower montane forest in western Panama. We found evidence that habitat filtering influences species distribution patterns and shifts community-wide and intraspecific trait values. Differences in trait values among sites were more strongly related to soil nutrient availability than to variation in light or rainfall. Soil nutrient availability explained a significant amount of variation in site mean trait values for 4 of 15 functional traits. Site mean values of leaf nitrogen and phosphorus increased 37 and 64%, respectively, leaf carbon:nitrogen decreased 38%, and specific leaf area increased 29% with increasing soil nutrient availability. For <em class="a-plus-plus">Geonoma cuneata</em> the only species occurring at all sites, leaf phosphorus increased 34% and nitrogen:phosphorus decreased 42% with increasing soil nutrients. In addition to among-site variation, most morphological and leaf nutrient traits differed among coexisting species within sites, suggesting these traits may be important for niche differentiation. Hence, a combination of habitat filtering due to turnover in species composition and intraspecific variation along a soil nutrient gradient and site-specific niche differentiation among co-occurring species influences understory palm community structure in this lower montane forest.<br/>

DOI PMID

3
Chapin F S, Autumn K, Pugnaire F, 1993. Evolution of suites of traits in response to environmental-stress.American Naturalist, 142: S78-S92.Traits that enable plants to exploit low-resource environments (e.g., slow tissue turnover, low transpiration rate, high root: shoot ratio, and high concentrations of plant defenses against pathogens and herbivores) are physiologically linked to key growth-related traits (low rates of photosynthesis, nutrient uptake, and growth). Similar suites of traits occur as both phenotypically plastic and evolutionary responses to stress. We suggest that a genetic change in a switch or underlying trait that turns on this stress resistance syndrome (SRS), which causes it to be expressed over a wider range of environmental circumstances, would effectively convert a high-resource genotype into one that is more stress-tolerant (...)

DOI

4
Chapin F S, Matson P A, Mooney H A, 2002. Principles of Terrestrial Ecosystem Ecology. New York: Springer, 123-155.Principles of terrestrial ecosystem ecology F. Stuart Chapin, III, Pamela A. Matson, Peter M. Vitousek ; illustrated by Melissa C. Chapin Springer, c2011 2nd ed : [hardcover] : softcover

DOI

5
Cornelissen J H C, Lavorel S, Garnier Eet al., 2003. A handbook of protocols for standardised and easy measurement of plant functional traits worldwide.Australian Journal of Botany, 51: 335-380.

6
Cornwell W K, Ackerly D D, 2009. Community assembly and shifts in plant trait distributions across an environmental gradient in coastal California.Ecological Monographs, 79: 109-126.Community assembly processes are thought to shape the mean, spread, and spacing of functional trait values within communities. Two broad categories of assembly processes have been proposed: first, a habitat filter that restricts the range of viable strategies and second, a partitioning of microsites and/or resources that leads to a limit to the similarity of coexisting species. The strength of both processes may be dependent on conditions at a particular site and may change along an abiotic gradient. We sampled environmental variables and plant communities in 44 plots across the varied topography of a coastal California landscape. We characterized 14 leaf, stem, and root traits for 54 woody plant species, including detailed intraspecific data for two traits with the goal of understanding the connection between traits and assembly processes in a variety of environmental conditions. We examined the within-community mean, range, variance, kurtosis, and other measures of spacing of trait values. In this landscape, there was a topographically mediated gradient in water availability. Across this gradient we observed strong shifts in both the plot-level mean trait values and the variation in trait values within communities. Trends in trait means with the environment were due largely to species turnover, with intraspecific shifts playing a smaller role. Traits associated with a vertical partitioning of light showed a greater range and variance on the wet soils, while nitrogen per area, which is associated with water use efficiency, showed a greater spread on the dry soils. We found strong nonrandom patterns in the trait distributions consistent with expectations based on trait-mediated community assembly. There was a significant reduction in the range of six out of 11 leaf and stem functional trait values relative to a null model. For specific leaf area (SLA) we found a significant even spacing of trait values relative to the null model. For seed size we found a more platyk

DOI

7
Domínguez M T, Aponte C, Perez-Ramos I Met al., 2012. Relationships between leaf morphological traits, nutrient concentrations and isotopic signatures for Mediterranean woody plant species and communities.Plant and Soil, 357: 407-424.

8
Freschet G T, Dias A T C, Ackerly D Det al., 2011. Global to community scale differences in the prevalence of convergent over divergent leaf trait distributions in plant assemblages.Global Ecology and Biogeography, 20: 755-765.Aim The drivers of species assembly, by limiting the possible range of functional trait values, can lead to either convergent or divergent distributions of traits in realized assemblages. Here, to evaluate the strengths of these species assembly drivers, we partition trait variance across global, regional and community scales. We then test the hypothesis that, from global to community scales, the outcome of co-occurring trait convergence and divergence is highly variable across biomes and communities.<br/>Location Global: nine biomes ranging from subarctic highland to tropical rain forest.<br/>Methods We analysed functional trait diversity at progressively finer spatial scales using a global, balanced, hierarchically structured dataset from 9 biomes, 58 communities and 652 species. Analyses were based on two key leaf traits (foliar nitrogen content and specific leaf area) that are known to drive biogeochemical cycling.<br/>Results While 35% of the global variance in these traits was between biomes, only 15% was between communities within biomes and as much as 50% occurred within communities. Despite this relatively high within-community variance in trait values, we found that trait convergence dominated over divergence at both global and regional scales through comparisons of functional trait diversity in regional and community assemblages against random (null) models of species assembly.<br/>Main conclusions We demonstrate that the convergence of traits occurring from global to regional assemblages can be twice as strong as that from regional to community assemblages, and argue that large differences in the nature and strength of abiotic and biotic drivers of dominant species assembly can, at least partly, explain the variable outcome of simultaneous trait convergence and divergence across sites. Ultimately, these findings stress the urgent need to extend species assembly research to address those scales where trait variance is the highest, i.e. between biomes and within communities.

DOI

9
Garnier E, Cortez J, Billes Get al., 2004. Plant functional markers capture ecosystem properties during secondary succession.Ecology, 85: 2630-2637.Although the structure and composition of plant communities is known to influence the functioning of ecosystems, there is as yet no agreement as to how these should be described from a functional perspective. We tested the biomass ratio hypothesis, which postulates that ecosystem properties should depend on species traits and on species contribution to the total biomass of the community, in a successional sere following vineyard abandonment in the Mediterranean region of France. Ecosystem-specific net primary productivity, litter decomposition rate, and total soil carbon and nitrogen varied significantly with field age, and correlated with community-aggregated (i.e., weighed according to the relative abundance of species) functional leaf traits. The three easily measurable traits tested, specific leaf area, leaf dry matter content, and nitrogen concentration, provide a simple means to scale up from organ to ecosystem functioning in complex plant communities. We propose that they be called unctional mark...

DOI

10
Garnier E, Navas M L, 2012. A trait-based approach to comparative functional plant ecology: Concepts, methods and applications for agroecology: A review.Agronomy for Sustainable Development, 32: 365-399.Abstract<br/>Comparative functional ecology seeks to understand why and how ecological systems and their components operate differently across environments. Although traditionally used in (semi)-natural situations, its concepts and methods could certainly apply to address key issues in the large variety of agricultural systems encountered across the world. In this review, we present major advances in comparative plant functional ecology that were made possible over the last two decades by the rapid development of a trait-based approach to plant functioning and prospects to apply it in agricultural situations. The strength of this approach is that it enables us to assess the interactions between organisms and their environment simultaneously on a large number of species, a prerequisite to address questions relative to species distribution, community assembly and ecosystem functioning. The trait concept will be first defined, before presenting a conceptual framework to understand the effects of environmental factors on plant community structure and ecosystem properties via plant traits. We will then argue that leading dimensions of variation among species can be captured by some selected traits and show that a combination of three easily measured traits—specific leaf area (the ratio of leaf area to leaf dry mass), plant height and seed mass—enables us to assess how different species use their resources, interact with neighbours and disperse in time and space. The use of traits to address central questions in community ecology will be reviewed next. It will be shown that traits allow us to (1) understand how plant species are sorted according to the nature of environmental gradients, (2) evaluate the relative importance of habitat filtering and limiting similarity in the process of community assembly and (3) quantify two main components of community functional structure, namely, community-weighted means of traits and community functional divergence. The relative impacts of these two components on ecosystem properties will then be discussed in the case of several components of primary productivity, litter decomposition, soil water content and carbon sequestration. There is strong support for the biomass ratio hypothesis, which states that the extent to which the traits of a species affect those ecosystem properties depends on the abundance of this species in the community. Assessing the role of functional divergence among species on ecosystem properties will require major methodological breakthroughs, both in terms of metrics and statistical procedures to be used. In agricultural situations, we show that trait-based approaches have been successfully developed to assess the impacts of management practices on (1) the agronomic value of grasslands and (2) the functional composition and structure of crop weed communities and how these could affect the functioning of the crop. Applications in forestry are still poorly developed, especially in temperate regions where the number of species in managed forest remains relatively low. The last decades of research have led to the constitution of large data sets of plant traits, which remain poorly compatible and accessible. Recent advances in the field of ecoinformatics suggest that major progress could be achieved in this area by using improved metadata standards and advancing trait domain ontologies. Finally, concluding remarks, unanswered questions and directions for research using the functional approach to biodiversity made possible by the use of traits will be discussed in the contexts of ecological and agronomical systems. The latter indeed cover a wide range of environmental conditions and biological diversity, and the prospect for reducing environmental impacts in highly productive, low-diversity systems will certainly imply improving our skills for the management of more diverse systems prone to a trait-based approach as reviewed here.<br/>

DOI

11
He H L, Liu M, Xiao X Met al., 2014. Large-scale estimation and uncertainty analysis of gross primary production in Tibetan alpine grasslands.Journal of Geophysical Research-Biogeosciences, 119: 466-486.

12
Hodgson J G, Montserrat-Marti G, Charles Met al., 2011. Is leaf dry matter content a better predictor of soil fertility than specific leaf area?Annals of Botany, 108: 1337-1345.Background and Aims Specific leaf area (SLA), a key element of the 'worldwide leaf economics spectrum', is the preferred 'soft' plant trait for assessing soil fertility. SLA is a function of leaf dry matter content (LDMC) and leaf thickness (LT). The first, LDMC, defines leaf construction costs and can be used instead of SLA. However, LT identifies shade at its lowest extreme and succulence at its highest, and is not related to soil fertility. Why then is SLA more frequently used as a predictor of soil fertility than LDMC?;Methods SLA, LDMC and LT were measured and leaf density (LD) estimated for almost 2000 species, and the capacity of LD to predict LDMC was examined, as was the relative contribution of LDMC and LT to the expression of SLA. Subsequently, the relationships between SLA, LDMC and LT with respect to soil fertility and shade were described.<br/>Key Results Although LD is strongly related to LDMC, and LDMC and LT each contribute equally to the expression of SLA, the exact relationships differ between ecological groupings. LDMC predicts leaf nitrogen content and soil fertility but, because LT primarily varies with light intensity, SLA increases in response to both increased shade and increased fertility.<br/>Conclusions Gradients of soil fertility are frequently also gradients of biomass accumulation with reduced irradiance lower in the canopy. Therefore, SLA, which includes both fertility and shade components, may often discriminate better between communities or treatments than LDMC. However, LDMC should always be the preferred trait for assessing gradients of soil fertility uncoupled from shade. Nevertheless, because leaves multitask, individual leaf traits do not necessarily exhibit exact functional equivalence between species. In consequence, rather than using a single stand-alone predictor, multivariate analyses using several leaf traits is recommended.

DOI PMID

13
Kazakou E, Violle C, Roumet Cet al., 2014. Are trait-based species rankings consistent across data sets and spatial scales? Journal of Vegetation Science, 25: 235-247.lt;p>Our study validated, for the species studied, the stable species hierarchy hypothesis in the case of several, but not all, widely used traits. The main conclusion is that the strength of the species signal is strong enough for some traits to allow values to be used from different data sets (experiments, databases) to characterize local populations of species: for SM, seed N concentration, RH, SLA and LDMC.</p>

DOI

14
Klumpp K, Soussana J F, 2009. Using functional traits to predict grassland ecosystem change: A mathematical test of the response-and-effect trait approach.Global Change Biology, 15: 2921-2934.The role of plant community structure and plant functional traits for above- and belowground carbon (C) fluxes was studied for 2 years in a mesocosm experiment with grassland monoliths, using continuous gas exchange measurements and soil analyses. Here we test the response-and-effect trait hypothesis, by applying a mathematical framework used to predict changes in C fluxes after a change in dis...

DOI

15
Liu G F, Freschet G T, Pan Xet al., 2010. Coordinated variation in leaf and root traits across multiple spatial scales in Chinese semi-arid and arid ecosystems.New Phytologist, 188: 543-553.P>Variation in plant functional traits is the product of evolutionary and environmental drivers operating at different scales. Little is known about whether, or how, this variation is coordinated between aboveground and belowground organs across and within spatial scales. We address these questions using a hierarchically designed dataset of pairwise leaf and root traits related to carbon and nutrient economy of 64 species belonging to 14 plant communities in northern Chinese semi-arid and arid regions. While both root and leaf traits showed most of their variance among (individuals and) species within communities, leaf trait variance tended to be relatively higher at coarser spatial scales than root trait variance. While leaf nitrogen (N) per area to root N per length ratio increased and specific leaf area to specific root length and leaf [N] to root [N] ratios decreased from semi-arid to arid environments owing to climatic/edaphic shifts, the matching pairs showed a strong pattern of positive correlation that was upheld across spatial scales and geographic areas. Thus, trade-offs in plant resource investment across organs within individual vascular plants are constrained within a rather narrow range of variation. A new challenge will be to test whether and how such trait coordination is also seen within and across other biomes of the world.

DOI PMID

16
Moles A T, Perkins S E, Laffan S Wet al., 2014. Which is a better predictor of plant traits: Temperature or precipitation?Journal of Vegetation Science, 25: 1167-1180.Question: Are plant traits more closely correlated with mean annual temperature, or with mean annual precipitation? Location: Global. Methods: We quantified the strength of the relationships between temperature and precipitation and 21 plant traits from 447,961 species-site combinations worldwide. We used meta-analysis to provide an overall answer to our question. Results: Mean annual temperature was significantly more strongly correlated with plant traits than was mean annual precipitation. Conclusions: Our study provides support for some of the assumptions of classical vegetation theory, and points to many interesting directions for future research. The relatively low R

DOI

17
Niinemets U, 2001. Global-scale climatic controls of leaf dry mass per area, density, and thickness in trees and shrubs.Ecology, 82: 453-469.Leaf dry mass per unit area (LMA) is a product of leaf thickness (T) and of density (D). Greater T is associated with greater foliar photosynthetic rates per unit area because of accumulation of photosynthetic compounds; greater D results in decreased foliage photosynthetic potentials per unit dry mass because of lower concentrations of assimilative leaf compounds and decreases in intercellular transfer conductance to CO

DOI

18
Onoda Y, Westoby M, Adler P Bet al., 2011. Global patterns of leaf mechanical properties.Ecology Letters, 14: 301-312.P>Leaf mechanical properties strongly influence leaf lifespan, plant-herbivore interactions, litter decomposition and nutrient cycling, but global patterns in their interspecific variation and underlying mechanisms remain poorly understood. We synthesize data across the three major measurement methods, permitting the first global analyses of leaf mechanics and associated traits, for 2819 species from 90 sites worldwide. Key measures of leaf mechanical resistance varied c. 500-800-fold among species. Contrary to a long-standing hypothesis, tropical leaves were not mechanically more resistant than temperate leaves. Leaf mechanical resistance was modestly related to rainfall and local light environment. By partitioning leaf mechanical resistance into three different components we discovered that toughness per density contributed a surprisingly large fraction to variation in mechanical resistance, larger than the fractions contributed by lamina thickness and tissue density. Higher toughness per density was associated with long leaf lifespan especially in forest understory. Seldom appreciated in the past, toughness per density is a key factor in leaf mechanical resistance, which itself influences plant-animal interactions and ecosystem functions across the globe.

DOI PMID

19
Ordonez J C, van Bodegom P M, Witte J P Met al., 2009. A global study of relationships between leaf traits, climate and soil measures of nutrient fertility.Global Ecology and Biogeography, 18: 137-149.ABSTRACT Top of page ABSTRACT INTRODUCTION MATERIALS AND METHODS RESULTS DISCUSSION CONCLUSIONS ACKNOWLEDGEMENTS REFERENCES Supporting Information Aim This first global quantification of the relationship between leaf traits and soil nutrient fertility reflects the trade-off between growth and nutrient conservation. The power of soils versus climate in predicting leaf trait values is assessed in bivariate and multivariate analyses and is compared with the distribution of growth forms (as a discrete classification of vegetation) across gradients of soil fertility and climate. Location All continents except for Antarctica. Methods Data on specific leaf area (SLA), leaf N concentration (LNC), leaf P concentration (LPC) and leaf N:P were collected for 474 species distributed across 99 sites (809 records), together with abiotic information from each study site. Individual and combined effects of soils and climate on leaf traits were quantified using maximum likelihood methods. Differences in occurrence of growth form across soil fertility and climate were determined by one-way ANOVA. Results There was a consistent increase in SLA, LNC and LPC with increasing soil fertility. SLA was related to proxies of N supply, LNC to both soil total N and P and LPC was only related to proxies of P supply. Soil nutrient measures explained more variance in leaf traits among sites than climate in bivariate analysis. Multivariate analysis showed that climate interacted with soil nutrients for SLA and area-based LNC. Mass-based LNC and LPC were determined mostly by soil fertility, but soil P was highly correlated to precipitation. Relationships of leaf traits to soil nutrients were stronger than those of growth form versus soil nutrients. In contrast, climate determined distribution of growth form more strongly than it did leaf traits. Main conclusions We provide the first global quantification of the trade-off between traits associated with growth and resource conservation trategies in relation to soil fertility. Precipitation but not temperature affected this trade-off. Continuous leaf traits might be better predictors of plant responses to nutrient supply than growth form, but growth forms reflect important aspects of plant species distribution with climate.

DOI

20
Ordonez J C, van Bodegom P M, Witte J P Met al., 2010. Leaf habit and woodiness regulate different leaf economy traits at a given nutrient supply.Ecology, 91: 3218-3228.Abstract The large variation in the relationships between environmental factors and plant traits observed in natural communities exemplifies the alternative solutions that plants have developed in response to the same environmental limitations. Qualitative attributes, such as growth form, woodiness, and leaf habit can be used to approximate these alternative solutions. Here, we quantified the extent to which these attributes affect leaf trait values at a given resource supply level, using measured plant traits from 105 different species (254 observations) distributed across 50 sites in mesic to wet plant communities in The Netherlands. For each site, soil total N, soil total P, and water supply estimates were obtained by field measurements and modeling. Effects of growth forms, woodiness, and leaf habit on relations between leaf traits (SLA, specific leaf area; LNC, leaf nitrogen concentration; and LPC, leaf phosphorus concentration) vs. nutrient and water supply were quantified using maximum-likelihood methods and Bonferroni post hoc tests. The qualitative attributes explained 8-23% of the variance within sites in leaf traits vs. soil fertility relationships, and therefore they can potentially be used to make better predictions of global patterns of leaf traits in relation to nutrient supply. However, at a given soil fertility, the strength of the effect of each qualitative attribute was not the same for all leaf traits. These differences may imply a differential regulation of the leaf economy traits at a given nutrient supply, in which SLA and LPC seem to be regulated in accordance to changes in plant size and architecture while LNC seems to be primarily regulated at the leaf level by factors related to leaf longevity.

DOI PMID

21
Poorter H, Niinemets U, Poorter Let al., 2009. Causes and consequences of variation in leaf mass per area (LMA): A meta-analysis.New Phytologist, 182: 565-588.Contents 61Summary69565 61 LMA in perspective69566 61 LMA in the field69567 61 Inherent differences69568 61 Relation with anatomy and chemical composition69570 61 Environmental effects69572 61 Differences in space and time69577 61 Molecular regulation and physiology69579 61 Ecological consequences69580 61 Conclusions and perspectives69582 61Acknowledgements69582 61References69582 61Appendices69587

DOI PMID

22
Reich P B, Wright I J, Lusk C H, 2007. Predicting leaf physiology from simple plant and climate attributes: A global GLOPNET analysis.Ecological Applications, 17: 1982-1988.Knowledge of leaf chemistry, physiology, and life span is essential for global vegetation modeling, but such data are scarce or lacking for some regions, especially in developing countries. Here we use data from 2021 species at 175 sites around the world from the GLOPNET compilation to show that key physiological traits that are difficult to measure (such as photosynthetic capacity) can be predicted from simple qualitative plant characteristics, climate information, easily measured ("soft") leaf traits, or all of these in combination. The qualitative plant functional type (PFT) attributes examined are phylogeny (angiosperm or gymnosperm), growth form (grass, herb, shrub, or tree), and leaf phenology (deciduous vs. evergreen). These three PFT attributes explain between one-third and two-thirds of the variation in each of five quantitative leaf ecophysiological traits: specific leaf area (), leaf life span, mass-based net photosynthetic capacity (Amass), nitrogen content (N(mass)), and content (P(mass)). Alternatively, the combination of four simple, widely available climate metrics (mean annual temperature, mean annual precipitation, mean vapor pressure deficit, and solar irradiance) explain only 5-20% of the variation in those same five leaf traits. Adding the climate metrics to the qualitative PFTs as independent factors in the model increases explanatory power by 3-11% for the five traits. If a single easily measured leaf trait () is also included in the model along with qualitative plant traits and climate metrics, an additional 5-25% of the variation in the other four other leaf traits is explained, with the models accounting for 62%, 65%, 66%, and 73% of global variation in N(mass), P(mass), A(mass), and leaf life span, respectively. Given the wide availability of the summary climate data and qualitative PFT data used in these analyses, they could be used to explain roughly half of global variation in the less accessible leaf traits (A(mass), leaf life span, N(mass), P(mass)); this can be augmented to two-thirds of all variation if climatic and PFT data are used in combination with the readily measured trait . This shows encouraging possibilities of progress in developing general predictive equations for macro-ecology, global scaling, and global modeling.

DOI PMID

23
Vile D, Shipley B, Garnier E, 2006. Ecosystem productivity can be predicted from potential relative growth rate and species abundance.Ecology Letters, 9: 1061-1067.Abstract We show that ecosystem-specific aboveground net primary productivity (SANPP, g g(-1) day(-1), productivity on a per gram basis) can be predicted from species-level measures of potential relative growth rate (RGRmax), but only if RGRmax is weighted according to the species' relative abundance. This is in agreement with Grime's mass-ratio hypothesis. Productivity was measured in 12 sites in a French Mediterranean post-agricultural succession, while RGRmax was measured on 26 of the most abundant species from this successional sere, grown hydroponically. RGRmax was only weakly correlated (r2 = 0.12, P < 0.05) with field age when species abundance was not considered, but the two variables were strongly correlated (r2 = 0.81, P < 0.001) when the relative abundance of species in each field was taken into account. SANPP also decreased significantly with field age. This resulted in a tight relationship (r2 = 0.77, P < 0.001) between productivity and RGRmax weighted according to species relative biomass contribution. Our study shows that scaling-up from the potential properties of individual species is possible, and that information on potential and realized species traits can be integrated to predict ecosystem functioning.

DOI PMID

24
Wang R L, Yu G R, He N Pet al., 2015. Latitudinal variation of leaf stomatal traits from species to community level in forests: Linkage with ecosystem productivity.Scientific Reports, 5: 14454. doi: 10.1038/srep14454.To explore the latitudinal variation of stomatal traits from species to community level and their linkage with net primary productivity (NPP), we investigated leaf stomatal density (SD) and stomatal length (SL) across 760 species from nine forest ecosystems in eastern China, and calculated the community-level SD (SD) and SL (SL) through species-specific leaf area index (LAI). Our results showed that latitudinal variation in species-level SDand SLwas minimal, but community-level SDand SLdecreased clearly with increasing latitude. The relationship between SD and SL was negative across species and different plant functional types (PFTs), but positive at the community level. Furthermore, community-level SDcorrelated positively with forest NPP, and explained 51% of the variation in NPP. These findings indicate that the trade-off by regulating SDand SLmay be an important strategy for plant individuals to adapt to environmental changes, and temperature acts as the main factor influencing community-level stomatal traits through alteration of species composition. Importantly, our findings provide new insight into the relationship between plant traits and ecosystem function.

DOI

25
Wright I J, Reich P B, Westoby Met al., 2004. The worldwide leaf economics spectrum.Nature, 428: 821-827.

26
Yu G R, Wen X F, Sun X Met al., 2006. Overview of ChinaFLUX and evaluation of its eddy covariance measurement.Agricultural and Forest Meteorology, 137: 125-137.The Chinese Terrestrial Ecosystem Flux Research Network (ChinaFLUX) is a long-term national network of micrometeorological flux measurement sites that measure the net exchange of carbon dioxide, water vapor, and energy between the biosphere and atmosphere. The ChinaFLUX network includes 8 observation sites (10 ecosystem types) and encompasses a large range of latitudes (21 degrees 57'N to 44 degrees 30'N), altitudes, climates and species. It relies on the existing Chinese Ecosystem Research Network (CERN), fills an important regional gap and increases the number of ecosystem types in FLUXNET. Data and site information are available online at the ChinaFLUX web sites (http://www.chinaflux.org/). Expanding the scope of the FLUXNET database, ChinaFLUX offers new opportunities to quantify and compare the magnitudes and dynamics of annual ecosystem carbon and water balance and to explore the biotic and abiotic effects on ecosystem processes of carbon dioxide and water vapor exchange that are unique to ecosystems in China, such as the vegetation communities on the Qinghai-Tibet plateau. Besides, ChinaFLUX also provides more insights to help define the current status and enable future prediction of the global biogeochemical cycles of carbon, water and trace gases. Recent findings from the ChinaFLUX network are summarized in both micrometeorological and ecological aspects. This paper also summarizes these results and makes recommendations for the research priorities in ChinaFLUX. (c) 2006 Elsevier B.V. All rights reserved.

DOI

27
Zhang X S, Yang D A, 1995. Allocation and study on global change transects in China.Quaternary Sciences, (1): 43-52. (in Chinese)lt;p>The ecological transect is considered as an effcient approach for studying the 'interaction between global change and terrestrial ecosystems. It could be used as a linkage between site observation and integrated regional studies, or a medium for transferring and coupling between models of time and space on different scales or levels. In the core projects of IGBP such as &quot;Global Change and Terrestrial Ecosystems(GCTE)&quot; and &quot;Past Global Changes(PAGES)&quot; the research on transects has been highly emphasized. The Northeast China's Forest--Steppe Transect(NECT) that we proposed at the GCTE International Symposium of Transects, Marshall, CA, USA in 1993 has been accepted as one of four international IGBP transects. A global change;transect is comprised of a set of coherent research sites along the gradient of a major global change driving force, e.g., temperature, precipitation, the intensity of land use, etc. The main items are to study biogeochemical processes including trace gas emissions, carbon and nitrogen cycles. etc., to study energy exchange of ecosystems', to study vegetation structure and dynamics, climirate-vegetation interaction&quot; and changes in biodiversities, to study the characteristics and patterns of land use; to debuge 'models on different scales; and to test remote sensing data. On the basis of these considerations, China's global oh.ange transects can be allocated longitudinally and latitudinally in the eastern and northern parts of the country, called CENT (Eastern and Northern Transects of China) for short.</p>

Outlines

/