Orginal Article

Characteristics and influencing factors of grass-feeding livestock breeding in China: An economic geographical perspective

  • WANG Guogang ,
  • WANG Guogang , * ,
  • WANG Jimin ,
  • YANG Chun ,
  • LIU Yufeng
Expand
  • Institute of Agricultural Economics and Development, CAAS, Beijing 100081, China

Author: Wang Guogang (1984-), PhD and Associate Professor, specialized in land sciences, agricultural economics and rural development. E-mail:

*Corresponding author: Wang Mingli (1968-), Professor, specialized in agricultural economics and policy.E-mail:

Received date: 2015-10-20

  Accepted date: 2015-11-15

  Online published: 2016-04-25

Supported by

National Natural Science Foundation of China, No.41401203, No.71173220 The Agricultural Science and Technology Innovation Program, No ASTIP-IAED-2015-01

Copyright

Journal of Geographical Sciences, All Rights Reserved

Abstract

The development of grass-feeding livestock breeding is the key to promoting the transition from grain-consumption type animal husbandry to grain-saving type animal husbandry in China, and to solving the problem of competition for grain between people and livestock. From the perspective of economic geography, this paper first defines the conversion standard for the breeding quantity of livestock, and then uses exploratory spatial data analysis technology and econometric models and methods to systematically investigate the sequential variation process, geographical aggregation characteristics, and influencing factors of grass-feeding livestock breeding in China. The study results show the following: 1) The breeding quantity of grass-feeding livestock in China has an obvious overall growth trend, but there is an obvious difference among the livestock species. During the period 1978-2012, the breeding quantity of grass-feeding livestock in China grew by 92.5%; and the breeding quantity within the same period was beef cattle > sheep > dairy cow. 2) On the county scale, the number of increasing areas of the breeding quantity of grass-feeding livestock is larger than the number of decreasing areas, and the growth rate of breeding quantity of grass-feeding livestock in northern China is higher than that in southern China, which initially forms the pattern of “hot in the north and cold in the south”. 3) The spatial Durbin model shows that the per capita output of grain, proportion of productive land area, urban per capita disposable income, agricultural mechanization level, agricultural labor productivity and policy factor have positive effects on the development of grass-feeding livestock breeding, while the per capita GDP, urbanization level and proportion of non-agricultural income have obvious negative effects on it. 4) Grass-feeding livestock breeding in China can be divided into six major types of areas, and each type of area should be regulated and controlled in terms of their respective focus of attention according to regional conditions and situation of agricultural production.

Cite this article

WANG Guogang , WANG Guogang , WANG Jimin , YANG Chun , LIU Yufeng . Characteristics and influencing factors of grass-feeding livestock breeding in China: An economic geographical perspective[J]. Journal of Geographical Sciences, 2016 , 26(4) : 501 -512 . DOI: 10.1007/s11442-016-1282-3

1 Introduction

Food is an important national strategic resource, and food security is a matter of national economy and common livelihood (Wan, 2008). Although the food production of China realized “11 consecutive growths” in 2014, the per capita food consumption quantity there tends to be stable with the economic development and improvement of people’s living standards. However, the demands for feed grain have increased substantially, which causes the constant rise of grain import. After the founding of the People’s Republic of China, the breeding quantity of main livestock in China has increased rapidly. The total output of meat, poultry and eggs in China remained the highest in the world for many consecutive years since 1991, and the proportion of the total output value of animal husbandry in the total output value of agriculture increased from 18% in 1980 to 30% in 2012, and this proportion has increased more rapidly in recent years (Fu et al., 2012). Meanwhile, the rigid demand for feed grain has seen an obvious growth, and solving the supply and demand problem of feed grain has become the most important task of grain security of China (Wang and Xiao, 2013).
Development of grass-feeding livestock breeding is of great importance to guaranteeing national grain security. Grass-feeding livestock can convert the non-grain feed resources to animal by-products by its special-structure digestive system and physiological functions, while also acting as the main source of supply of beef and mutton and dairy products for human beings. As an important component of modern animal husbandry, grass-feeding livestock breeding complies with the national situation of “less cultivated land area and abundant grassland resources” in China, follows the change tendency of residents’ food consumption structure, and also reduces the feed grain consumption, which is the key to solving the problem of competition for grain between people and livestock in China, and has great practical significance. From the point of view of economic geography, we should clarify the spatiotemporal dynamic change process and characteristics of grass-feeding livestock breeding in China and master the critical influencing factors, so as to provide support for the decision-making of macro-adjustment of grass-feeding livestock breeding in China. However, the existing academic researches tend to place emphasis on the spatial pattern change of the overall livestock breeding (Neumann et al., 2009; Cecchi et al., 2010; Li et al., 2010; Saizen et al., 2010) and analyze its gravity center curve characteristics (Fu et al., 2012), as well as environmental pollution of breeding to the atmosphere, water body and land. The research areas are mainly concentrated in the European and North American countries (Neumann et al., 2009; Orhan et al., 2009; Sanderson et al., 2010; Fu et al., 2012; Eshel et al., 2014), with less research on China. How have the spatiotemporal dynamics of grass-feeding livestock breeding changed in China? What kind of spatial pattern does the breeding show? Which factors influence the spatial changes of breeding? The existing research results fail to give effective answers to the above questions, thus related researches are urgently needed. For this purpose, this paper selects the main types of grass-feeding livestock to systematically elaborate the spatial change tendency of grass-feeding livestock breeding in China, reveal the influencing factors, divide the different types of areas, and define the optimized regulation and control emphasis points in different types of breeding areas, by adopting the exploratory spatial data analysis method, etc., so as to provide a reference for the healthy and sustainable development of the grass-feeding livestock breeding industry in China.

2 Research methods and data

2.1 Data

The vector data of China’s county administrative divisions are taken from the national fundamental geographic data base of the State Bureau of Surveying and Mapping. In view of the availability of data, this paper only considers the three major types of grass-feeding livestock: beef cattle, dairy cow and sheep. The socio-economic data and agricultural statistical index are mainly taken from the China Statistical Yearbook, 60 Years Statistical Data in Agriculture of the New China and China Rural Statistical Yearbook, while the data of the breeding quantity of grass-feeding livestock are mainly taken from the agricultural investigation data, livestock statistics and statistical yearbook of each province. In order to guarantee the inter-annual comparability, this paper makes uniform corrections to the adjustment of administrative division and county units with changed names by regarding 2000 as the reference year. During the data analysis, the data with large discrepancy are eliminated, and the abnormal values or county unit with missing data of the same year are replaced with the adjacent year. In total, the data of more than 1926 counties (excluding the Hong Kong, Macao and Taiwan regions) were obtained and summarized.

2.2 Methods

2.2.1 Conversion standard of breeding quantity
In order to facilitate the uniform analysis and comparison of different types of livestock, this paper uses the livestock unit (AU) to realize the standardized conversion of livestock breeding quantity. The specific conversion formula is as follows (Kellogg et al., 2000; Li et al., 2007):
where Ti is the breeding stock of the livestock type i, kij indicates the proportion of the type j of livestock type i in the breeding stock, λij represents the number of annual marketing batches or the breeding stock time of the type j of livestock type i, and μij is the number of livestock in each livestock unit of the type j of livestock type i (Table 1).
Table 1 Conversion standard parameters for the livestock unit of grass-feeding livestock (Kellogg et al., 2000; Wang, 2004)
Main types of grass-feeding livestock Proportion of livestock on
hand (%)
Quantity of livestock in each
livestock unit
Number of annual marketing batches Annual time of livestock on hand (month/month)
Dairy cow Adult cow 60 0.74 - 12/12
Calf 15 4 - 5/12
Replacement cattle 25 0.94 - 12/12
Beef
cattle
Fattened cattle 42 1.14 1.5 -
Bull 2 1 - 12/12
Calf 13 4 - 5/12
Reproducible cow 43 1.14 - 12/12
Sheep Lamb 15 12.97 - 4/12
Adult sheep 85 6.98 1 -
2.2.2 Gravity center model
The gravity center of elements indicates the spatial mean value of the elements and is the statistical description of spatial pattern of the elements (Song and Ouyang, 2012). The calculation formula is as follows:
where Ai is the total elements in the area i; (xi, yi) is the geometric center coordinate of the area i; and 
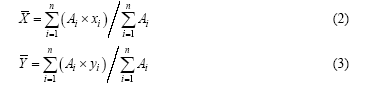
is the gravity center coordinate of this element.
2.2.3 Variable set and measurement model selection
In combination with the occurrence conditions of grass-feeding livestock breeding, and taking into account of the availability of data, this paper mainly selects and investigates the influence of the following variables on the grass-feeding livestock breeding: 1) Resource endowment factor: productive land area per labor (sum of cultivated land area and grassland area / agricultural labor force x1), per capita output of grain (grain output / total population x2) and proportion of productive land area (sum of grassland area and cultivated land area / land area x3). 2) Macro economy and market factors: per capita GDP (areal GDP/total population x4), population urbanization rate (urban population/total population x5), urban per capita disposable income (x6), and proportion of non-agricultural income (x7). 3) Agricultural productivity factors: per unit seeded area yield of grain (grain output / seeded area x8), agricultural mechanization level (Long et al., 2012) (total power of agricultural machinery / cultivated land area x9), agricultural labor productivity (Long et al., 2012) (gross product of primary industry / agricultural labor force x10). 4) Policy factors: set the dummy variables in accordance with the layout plan of advantageous region of beef cattle and sheep issued by the Ministry of Agriculture (Yang and Wang, 2013) x11 (advantageous region x11=1, non- advantageous region x11=0).
Considering the complexity, autocorrelation and variability of spatial data, the influence of the explanatory variable on the explained variable will be different in different regions, thus we first adopt the Global Moran's I statistics to test the spatial autocorrelation of data. If there is no spatial autocorrelation, then the global linear regression model (OLS regression) can be adopted for the estimation (Wang et al., 2015; He and Liu, 2007). The calculation formula is as follows:
Y=b0+b1x1+b2x2+b3x3+b4x4+…+m(4)
where Y is the breeding quantity of grass-feeding livestock, and bi (i=1, 2, 3, …, n) respectively corresponds to the partial regression coefficients of xj (j=1, 2, 3, …, n). If there is spatial autocorrelation, then the spatial lag model (SLM), spatial error model (SEM) and spatial Durbin model (SDM) can be further selected for the purpose of estimation. The spatial Durbin model not only considers the spatial autocorrelation of dependent variables, but also considers the spatial autocorrelation of independent variables, which means that the dependent variable is not only influenced by the independent variable of this area, but is also influenced by the independent variables and dependent variables in other areas. For this purpose, this paper adopts the spatial Durbin model to analyze the influencing factors of spatiotemporal dynamic changes of grass-feeding livestock breeding. The basic form of spatial Durbin model is as follows (Ye and Fang, 2013):
where wy and wX are respectively the spatial lag items of the dependent variable and independent variable, w represents the spatial weight matrix, ρ and γ are the spatial lag coefficients, β is the elastic coefficient of the independent variable, and ε is the random error item which meets ε~N (0, σ2In).

3 Results

In this part, we analyzed time series variation characteristics of grass-feeding livestock breeding at first, and then, dynamic characteristics of grass-feeding livestock breeding and its influencing factors were explained in detail. Finally, we zoned grass-feeding livestock breeding into six types.

3.1 Time series variation characteristics of grass-feeding livestock breeding

3.1.1 Obvious growth situation of total breeding quantity of grass-feeding livestock
We calculate the breeding quantity of grass-feeding livestock of China in 1978-2012 by means of the standardized conversion method of livestock breeding quantity, and the calculation results show that the breeding quantity has an obvious overall growth trend since the reform and opening-up (Figure 1). The breeding quantity increased from 6060.8 104 AU in 1978 to 11665.7 104 AU in 2012, which shows a growth rate of 92.5%. The breeding quantity shows fluctuation in some periods, in which the period 2005-2010 had the largest fluctuation, and the breeding quantity decreased from 10617.1 104 AU in 2005 to 9596.6 104 AU in 2006. Up to 2009, the breeding quantity of grass-feeding livestock basically recovered to the level in 2005. The changing trend of grass- feeding livestock of China in 1978-2012 is fitted by using multiple functions, and it is found that the linear fitting curve can more effectively describe the changing trend of breeding quantity of grass-feeding livestock during this period, with the fitting degree reaching 0.96. It can be further found from the fitting curve that the breeding quantity of grass- feeding livestock showed a stable growth trend during the period 1978-2012, and the growth trend is obvious.
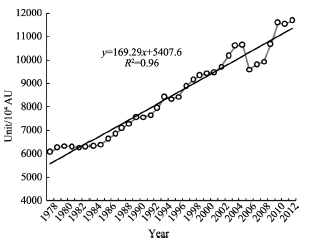
Figure 1 Overall changing trend of breeding quantity of grass-feed livestock in China during 1978-2012
3.1.2 Obvious differences in aspect of growth trend among the grass- feeding livestock species
It can be seen from Figure 2 that the three grass-feeding livestock species in China during 1978-2012 have obvious difference in terms of breeding quantity and changing trend. Overall, the breeding quantities of beef cattle, dairy cow and sheep are obviously increased by 0.67 times, 30.45 times and 0.68 times, respectively, during the study period. It is found through comparative analysis that the breeding quantity at the same period are beef cattle > sheep > dairy cow.
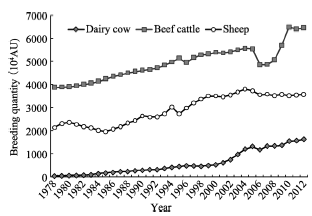
Figure 2 Overall changing trend of breeding quantity of dairy cow, beef cattle and sheep in 1978-2012
Overall, the breeding quantity of beef cattle in China during the period 1978-2012 showed an obvious increasing trend. The growth within 1978-2005 was stable; the breeding quantity in 2006 was reduced by 688.9 104 AU compared with 2005, which shows a high falling rate; the breeding quantity started to recover rapidly since 2008 and increased to 6492 104 AU in 2010. The fitting degree of cubic polynomial function curve was 0.857, and it can be calculated by further solving the fitting function that the breeding quantity of beef cattle is in the interval of increasing function. During the research period, the breeding quantity of sheep in China also showed an increasing trend, but fluctuation within a narrow range was frequent, which had a close relationship with the fast growth rate, short raising cycle and other production characteristics of sheep. The cubic polynomial function curve can better describe the changing trend during this period, and the fitting degree is 0.97. It can be seen from the fitting curve that the breeding quantity of sheep succession trend had a slight decrease and slow increase. Compared with the changes of breeding quantity of cattle and sheep, the change rule of breeding quantity of dairy cow within 1978-2012 showed a different trend. After the fitting of this changing trend by using the multiple functions, it is found that the fitting degree of quadratic polynomial curve reaches up to 0.97. It can be seen from the fitting trend that the breeding quantity of dairy cow within 1978-2011 had an obvious growth trend, in which the breeding quantity within 1978-1997 showed a slow increasing trend, while the breeding quantity within 1998-2011 showed a rapid growth trend, which signifies that the change of breeding quantity of dairy cow has an obvious stage characteristic.

3.2 Spatial pattern and evolution of grass-feeding livestock breeding

We calculate the gravity center of breeding quantity of grass-feeding livestock in 1990, 1995, 2000, 2005, 2008 and 2011, in accordance with the gravity center model of elements, and draw the gravity center migration path. Figure 3 shows that the gravity centers of breeding quantity of grass-feeding livestock transferred towards the west during 1995-2000 after the migration towards the northeast direction in 1990-1995, then experienced the changes of transfer towards the northeast direction in 1990-1995, and towards the northwest direction in 2005-2011. It can be seen that the growth rate of breeding quantity of grass-feeding livestock in northern China is larger than that in the southern during 1990-2011.
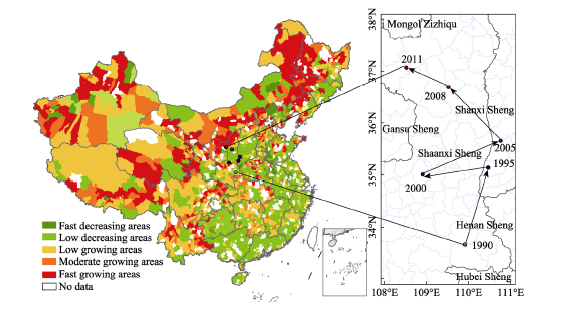
Figure 3 Dynamic pattern of grass-feeding livestock breeding and its gravity centers during1990-2011
In order to further reveal the dynamic change process of the spatial pattern of the grass-feeding livestock breeding in China, the research areas are divided into five types: low decrease, rapid decrease, low increase, moderate increase and fast increase (Figure 3). On the county level of all of China, the number of increasing areas of grass-feeding livestock breeding quantity in counties of China is much greater than the number of decreasing areas. Specifically, the decreasing areas are concentrated in central China, the hilly area south of the Yangtze River, Nanling Mountains region, Yangtze River Delta region and Pearl River Delta region; the distribution of increasing areas is scattered, and the northeastern China mainly exhibits the fast growth type; and the other types of increasing areas are mainly distributed in western China and the Huang-Huai-Hai Plain region. The Yangtze River Delta, Pearl River Delta and other areas with rapid development of urbanization have always been cold spot areas for breeding. This has a certain coupling relationship with the spatial differentiation pattern of China’s regional economic zonal difference. The farming-pastoral areas in Inner Mongolia, the Qinghai-Tibet Plateau region, and Xinjiang constituting the major traditional pastoral regions in China provide a solid foundation for the development of grass-feeding livestock by virtue of their rich grass resources and breeding experience, and these regions have always been hot spot areas for the breeding of grass-feeding livestock. In addition, although the grass-feeding livestock industry in the double cropping rice producing areas in China has seen a certain development in recent years, yet traditional rice farming practice still dominates most of the regions which are located in the cold spot areas of breeding.

3.3 Influencing factors of spatiotemporal evolution of grass-feeding livestock breeding

It can be seen from Table 2 that the Moran's I index values are positive and are obviously at the 1% statistical level. The spatial correlation test results show that the grass-feeding livestock breeding of China has positive spatial autocorrelation. Therefore, it is more suitable to use the spatial measurement model to realize the regression. The Hausman test refuses the indistinctive null hypothesis between the fixed effect model and random effect model, thus the fixed-effect spatial Durbin model is selected to analyze the influencing factors.
Table 2 Spatial autocorrelation test and Hausman test
Index 1995 2000 2005 2008 2011
Moran's I 0.392*** 0.473*** 0.514*** 0.374*** 0.489***
Hausman Test 297.3
R2 Adj 0.923
Log Likelihood 2.0596
In the spatial Durbin model, the independent variable comprehensively reflects the influence degree on the dependent variable through the direct effect, indirect effect and total effect (Table 3).
Table 3 Effect estimation of influencing factors of changes of grass-feeding livestock breeding
Variable Total effect Direct effect Indirect effect
x1 -0.033 -0.019 -0.014
x2 0.286*** 0.266*** 0.060**
x3 0.391*** 0.303*** 0.088*
x4 -0.173*** -0.097*** -0.076
x5 -1.328*** -1.030*** -0.298***
x6 0.486** 0.283* 0.203**
x7 -0.665** -0.353*** -0.312
x8 -0.031 -0.018 -0.013
x9 0.222*** 0.130*** 0.092***
x10 0.169** 0.098** 0.071**
x11 0.264*** 0.154** 0.110

Note: ***, ** and * respectively represent the fact that the statistics are obvious respectively at the confidence levels of 1%, 5% and 10%.

In terms of resource endowment factor, the direct effect, indirect effect and total effect of the productive land per capita on the grass-feeding livestock breeding are negative, but not obvious. The per capita output of grain and proportion of productive land area have obvious positive effects on the breeding, and their direct effects are stronger than the indirect effects. This means that the abundance of forage grass and feed resources has a direct positive impact on the development of the grass-feeding livestock breeding industry, which also explains the reasons of grass-feeding livestock breeding aggregating in the advantageous area of fodder grass production.
The per capita GDP, urbanization level and proportion of non-agricultural income have obvious negative effects, and their total effect values are respectively -0.173, -1.328 and -0.665. This signifies that the development of regional economy and improvement of urbanization level provide non-agricultural employment opportunities for farmers while improving their non-agricultural income, but this also has strong and direct negative effects on the grass-feeding livestock breeding, and the negative effects occurring in the adjacent areas are also very obvious. The urban per capita disposable income is mainly reflected as the consuming ability, and its indirect effect on the grass-feeding livestock breeding is obvious. The indirect effect value is 0.203, and is obviously above the 5% confidence level.
The estimation results of agricultural productivity factors show the following: the direct effect, indirect effect and total effect of per unit seeded area yield of grain on the grass-feeding livestock breeding are not obvious, which means that the grain yield ability has a smaller impact on the grass-feeding livestock breeding compared with the regional grain abundance. However, the improvement of agricultural mechanization level and agricultural labor productivity have a very obvious positive impact on the grass-feeding livestock breeding, and the total effect values are respectively 0.222 and 0.169.
The total effect estimation coefficient of policy factor is 0.264, and is obvious above the 1% confidence level. The estimation coefficient of direct effect is 0.154, which is obvious and is not zero at above the 5% confidence level. The indirect effect is not obvious. This signifies that the layout planning of national advantageous areas has an obvious positive effect on the development of local grass-feeding livestock breeding. This is mainly due to the timely implementation of local supporting policies and measures under the guidance of the national macro layout.

3.4 Zoning and regulating control of grass-feeding livestock breeding types

In order to further reveal the objective law of the regional differentiation of grass-feeding livestock breeding in China and provide a basis for the development of grass-feeding livestock breeding and related strategic decision-making, this paper selects the dynamic degree of grass-feeding livestock breeding, Getis- Ord G* index value, breeding quantity and unit land bearing capacity by regarding the county district as the basic unit, and adopts clustering methodology to divide the breeding areas of grass-feeding livestock into six major areas (Figure 4). This paper also discusses the basic guidelines for the optimized regulating control in combination with the basic characteristics and “regional condition” of the grass-feeding livestock breeding. 1) The Type I areas are mainly distributed in northeastern China. These areas are the hot spot areas of grass-feeding livestock breeding in China. In recent years, the breeding quantity has grown fast and the unit land bearing capacity faces great pressure, thus it is necessary to speed up the conversion of feeding production mode and control the areal breeding quantity, and the pasturing area must strictly implement the national balance system between forage area and animals. 2) The Type II areas are mainly located in the Huang- Huai-Hai Plain region. The grass-feeding livestock breeding grows at an intermediate speed and the unit land bearing capacity also faces increasing pressure, thus it is necessary to develop the fattening industry and guide the industrial division of specialization work in combination with the advantages of regional grain production base. 3) The Type III areas are located in eastern and southern China, areas with developed economy, high urbanization level and small breeding quantity of grass-feeding livestock. The breeding quantity of grass-feeding livestock in these areas shows a rapid decreasing trend and the land bearing pressure is relatively small, thus they are considered cold spot areas of grass-feeding livestock breeding, and it is necessary to strictly protect the cultivated land, suitably increase the breeding quantity, and develop high-efficiency modern animal husbandry. 4) The Type IV areas are mainly distributed in the Loess Plateau and Hubei and Hunan Provinces. Grass-feeding livestock breeding shows a low-speed growth in these places, and the land bearing pressure is slightly increased, but this pressure is mainly low pressure. In view of the regional location and geological and geographical conditions, it is recommended to suitably develop the facility feeding, while paying equal attention to the reasonable utilization of resources and ecological protection. 5) The Type V areas are concentrated in southwestern China, and the grass-feeding livestock breeding quantity in these regions mainly shows low-speed reduction. However, considering the high precipitation and serious water and soil loss, it is necessary to focus on the ecological conservation when developing grass-feeding livestock breeding, by making full use of the grassy mountains and slopes and grass resources. 6) The Type VI areas are mainly located in the western pastoral regions, with large breeding quantity of grass-feeding livestock and rapid growth. Although the region is located in the hot spot and sub-hot breeding areas, yet the ecological environment here is very fragile as most of its part is located in the arid area and high and cold areas of the Qinghai-Tibet Plateau. Therefore, the regional resources and environmental features should be relied on convert the production mode of animal husbandry, plant grass, control livestock to develop the characteristic plant-eating animal husbandry economy, build high-end brands, and implement the strategy of success through quality (not quantity) to increase the income of herdsman.
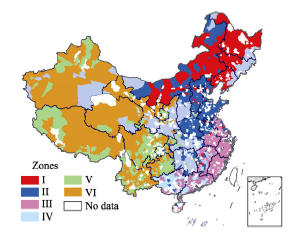
Figure 4 Divisions of grass-feeding livestock breeding in China

4 Conclusions and discussion

The study and judgment of the spatiotemporal dynamics and influencing factors of the grass-feeding livestock breeding is an important scientific basis for development planning of grass-feeding livestock. By means of spatial analysis technique and measurement model, this paper found that:
(1) The breeding quantity of grass-feeding livestock in China during the period 1978- 2012 shows a stable growth trend, and the number of county areas with increased breeding quantity is obviously larger than the number of decreased areas; however, there is an obvious difference in the breeding quantity growth trend among the livestock species, i.e. the largest breeding quantity in the same period is beef cattle, followed by sheep and dairy cow.
(2) The spatial pattern of grass-feeding livestock breeding undergoes great changes, and the hot spot breeding areas such as the farming-pastoral region in Inner Mongolia, the Qinghai-Tibet Plateau region, Xinjiang and the Huang-Huai-Hai Plain region, Greater Khingan Mountains and the Northeast China Plain region were gradually formed in 2011, while the main double cropping rice producing areas in China, such as the hilly area to the south of the Yangtze River, Nanling Mountains region and developed areas along the southeast coastal zone have always been the cold spot breeding areas. Therefore, we can see that the spatial differentiation characteristic of “hot in the north and cold in the south” is very obvious.
(3) The per capita output of food, proportion of productive land area, urban per capita disposable income, agricultural mechanization level, agricultural labor productivity and policy factor have positive effects on the development of grass-feeding livestock breeding, while the per capita GDP, urbanization level and proportion of non-agricultural income have obvious negative effects on it. This effectively explains the reasons for which the grass-feeding livestock breeding of China shows the layout in the areas with abundant resources of grass and forage, relative backward economic development, few non-agricultural employment opportunities, high agricultural mechanization level, and policy advantages. Specific to the six major breeding areas of grass-feeding livestock, each type of area should positively adjust the breeding scheme of grass-feeding livestock, coordinate the relationship between the areal breeding and land bearing capacity, improve the utilization efficiency of regional resources, and promote the sustainable development of the regional grass-feeding livestock breeding, in combination with the factors such as the breeding quantity and dynamic change of grass-feeding livestock, natural resource base, environmental background conditions, etc.
The development of grass-feeding livestock breeding is of great significance to guaranteeing the supply of animal by-products and mitigating the conflicts of competition for grain between people and livestock, and this issue under discussion has attracted much more attention of the concerned government departments and all sectors of society. This paper initially reveals the fact that the spatiotemporal differentiation characteristics and influencing factors of the grass-feeding livestock breeding in China, the optimized study on the breeding pattern of grass-feeding livestock from the perspective of geographical division of labor and professionalization, environmental effect of grass-feeding livestock breeding, and the calculation of resource consumption and utilization efficiency in regional grass-feeding livestock breeding still requires further deep study.

The authors have declared that no competing interests exist.

1
Cecchi G, Wint W, Shaw Aet al., 2010. Geographic distribution and environmental characterization of livestock production systems in Eastern Africa.Agriculture Ecosystems & Environment, 135(1/2): 98-110.The central role played by livestock in the livelihoods of rural households in the developing world is seldom fully appreciated by policy makers, development agencies and donors. Knowledge gaps in the geographic distribution and environmental determinants of farming systems, especially if viewed through the livestock lens, compound this problem. We have produced a map of pastoral, agro-pastoral...

DOI

2
Eshel G, Shepon A, Makov Tet al., 2014. Land, irrigation water, greenhouse gas, and reactive nitrogen burdens of meat, eggs, and dairy production in the United States. Proceedings of the National Academy of the Sciences of the United States of America, 111(33): 11996-12001.

3
Fu Q, Zhu Y Q, Sun J Let al., 2012. Spatial analysis and districting of the livestock and poultry breeding in China.Journal of Geographical Sciences, 22(6): 1079-1100.Abstract<br/><p class="a-plus-plus">The capacity of livestock breeding in China has increased rapidly since 1949, and the total output of meat, poultry and eggs maintains the world’s top first in recent 20 years. Livestock emissions and pollution is closely associated with its population and spatial distribution. This paper aims to investigate the spatial patterns of livestock and poultry breeding in China. Using statistical yearbook and agricultural survey in 2007, the county-level populations of livestock and poultry are estimated as equivalent standardized pig index (ESP), per cultivated land pig index (PCLP) and per capita pig index (PCP). With the help of spatial data analysis (ESDA) tools in Geoda and ArcGIS software, especially the Moran’s I and LISA statistics, the nationwide global and local clustering trends of the three indicators are examined respectively. The Moran’s I and LISA analysis shows that ESP and PCP are significantly clustering both globally and locally. However, PCLP is clustering locally but not significant globally. Furthermore, the thematic map series (TMS) and related gravity centers curve (GCC) are introduced to explore the spatial patterns of livestock and poultry in China. The indicators are classified into 16 levels, and the GCCs for the three indicators from level 1 to 16 are discussed in detail. For districting purpose, each interval between gravity centers of near levels for all the three indicators is calculated, and the districting types of each indicator are obtained by merging adjacent levels. The districting analysis for the three indicators shows that there exists a potential uniform districting scheme for China’s livestock and poultry breeding. As a result, the China’s livestock and poultry breeding would be classified into eight types: extremely sparse region, sparse region, relatively sparse region, normally sparse region, normal region, relatively concentrated region, concentrated region and highly concentrated region. It is also found that there exists a clear demarcation line between the concentrated and the sparse regions. The line starts from the county boundary between Xin Barag Left Banner and Xin Barag Right Banner, Inner Mongolia Autonomous Region to the west coast of Dongfang County, Hainan Province.</p><br/>

DOI

4
He X Q, Liu W Q, 2007. Applied Regression Analysis. 2nd ed. Beijing: China Renmin University Press. (in Chinese)

5
Kellogg R L, Lander C H, Moffitt D Cet al., 2000. Manure nutrients relative to the capacity of cropland and pastureland to assimilate nutrients: Spatial and temporal trends for the United States. United States Department of Agriculture, Natural Resources Conservation Service and Economic Research Service, 2-16.

6
Li W, Li Y X, Yang Met al., 2010. Spatial distribution of livestock and poultry production and land application accessibility of animal manure in Beijing. Journal of Natural Resources, 25(5): 746-755. (in Chinese)

DOI

7
Li W, Li Y X, Zhang F Set al., 2007. The spatial and temporal distribution features of animal production in Three Northeast Provinces and impacts of manure nutrients on local environment.Journal of Agro-Environment Science, 26(6): 2350-2357.

8
Long D P, Li T S, Miao Y Yet al., 2014. The spatial distribution and types of the development level of Chinese agricultural modernization.Acta Geographica Sinica, 69(2): 213-226. (in Chinese)The modernization of agriculture is a crucial symbol of the progress of social civilization, and an essential part of China's "four modernizations" of the simultaneous development. From the geographic perspective, this paper tries to comprehensively evaluate the development level of agricultural modernization in China by building index system with multi-index comprehensive evaluation method and Delphi method. Besides, it uses some spatial analyses and type researches to explore the regional differentiation law about the development of agricultural modernization in China in order to provide reference for its rapid and steady development. The results indicate that: (1) From the national level, Chinese agricultural modernization development level can be categorized into the eastern and western parts according to Hu's line, presenting a pattern of "high east and low west". At the same time, Chinese agricultural modernization development level improves on the whole with the increase of distance from Hu's line, presenting a pattern of slightly flattened "S" curve; (2) From the local perspective, there are obvious regional differences in the development level of agricultural modernization among the eastern, western and central regions and Northeast China, and in space a trend of decrease is found in the development level of agricultural modernization from the east, north-east, center to the west; (3) The four sub-dimensions indicators of the development level of Chinese agricultural modernization in the geographical space also reveal some regional differentiation pattern, and how to break the stereotype and path dependence of agriculture development will become the practical problem and scientific issue for government at all levels and geographers; (4) The development level of Chinese agricultural modernization can be divided into five types of areas and different areas should have clear present and future development ideas and strategies.

DOI

9
Neumann K, Elbersen B S, Verburg P Het al., 2009. Modelling the spatial distribution of livestock in Europe.Landscape Ecology, 24(9): 1207-1222.<a name="Abs1"></a>Livestock remains the world&#8217;s largest user of land and is strongly related to grassland and feed-crop production. Assessments of environmental impacts of livestock farming require detailed knowledge of the presence of livestock, farming practices, and environmental conditions. The present Europe-wide livestock distribution information is generally restricted to a spatial resolution of NUTS 2 (province level). This paper presents a modelling approach to determine the spatial distribution of livestock at the landscape level. Location factors for livestock occurrence were explored and applied to consistent and harmonized EU-wide regional statistics to produce a detailed spatial distribution of livestock numbers. Both an expert-based and an empirical approach were applied in order to disaggregate the data to grid level. The resulting livestock maps were validated. Results differ between the two downscaling approaches but also between livestock types and countries. While both the expert-based and empirical approach are equally suited to modelling herbivores, in general, the spatial distribution of monogastrics can be better modelled by applying the empirical approach.

DOI

10
Orhan H, Ozturk I, Dogan Zet al., 2009. Examining structural distribution of livestock in eastern and south-eastern Anatolia of Turkey by multivariate statistics. Journal of Animal and Veterinary Advances, 8(3): 481-487.In this study, livestock numbers and animal production of the main regions of Eastern and Southeastern of Turkey were evaluated by multivariate statistical analysis methods in order to determine the recent structure of livestock production. Data were taken from Turkish Statistical Institute (Turk Stat). The cities showing structural resemblance with each other were established as results of cluster analysis were summarized in dendograms. Also, accuracy of the clustering analysis was tested by Wilk s Lamda statistics value and assigning of cluster of cities was determined with discriminant analysis.

DOI

11
Qi Y J, YangY, Jin F J, 2013. China’s economic development stage and its spatio-temporal evolution: A prefectural-level analysis.Acta Geographica Sinica, 68(4): 517-531. (in Chinese)As important carriers of regional strategy and policy, prefecture-level regions have played an increasingly significant role in the development of China's economy. However, few studies have grasped the essence of economic development stage and spatio-temporal evolution process at a prefectural level. Thus they may lead to a biased policy and ineffective implementation. Based on Chenery's economic development theory, this paper identifies China's economic development stages at both national and prefectural levels. Both Global Moran's I index and Getis-Ord Gi* index are employed to investigate the spatial-temporal evolution of China's economic development from 1990 to 2010. Major conclusions can be drawn as follows: (1) China's economic development is generally in the state of agglomeration. It stepped into primary production stage in 1990, and middle industrialized stage in 2010, with a &quot;balanced-unbalanced-gradually rebalanced&quot; pattern in the process. (2) China's rapid economic growth experienced a spatial shift from coastal regions to inland regions. Most advanced cities in central and western China can be roughly categorized into regional hub cities and resource-dependent cities. (3) Hot-spots in China's economic development moved northward and westward. The interactions between cities and prefectures became weaker in eastern China, while cities and prefectures in central and western China were still on the stage of monomer development, with limited effects on the surrounding cities. (4) While the overall growth rate of China's economy gradually slowed down during the past two decades, the numbers of cities and prefectures in central and western China grew much faster than those in coastal areas. (5) Regions rich in resources, such as Xinjiang and Inner Mongolia, became the new hot-spots of economic growth in recent years. For these regions, however, more attention should be paid to its unbalanced industrial structure and the lagging social development in the backdrop of the rapid economic growth driven predominantly by the exploitation of resources.

DOI

12
Saizen I, Maekawa A, Yamamura N, 2010. Spatial analysis of time-series changes in livestock distribution by detection of local spatial associations in Mongolia.Applied Geography, 30(4): 639-649.<h2 class="secHeading" id="section_abstract">Abstract</h2><p id="">The rapid change in the livestock population in Mongolia since the beginning of the 1990s has been a very important issue in terms of the sustainable management of grasslands. We investigated the spatial distribution and changes in the populations of Mongolian livestock for the years 1992, 1999, 2002, and 2006 using GIS datasets based on administrative units. Although the total livestock population had changed drastically owing to the shift from a planned economy to a free market economy from 1992 to 1999 and 2002 to 2006 &ndash; as well as the impact of the <em>dzud</em> an adverse combination of summer drought followed by a harsh winter, between 1999 and 2002 &ndash; no significant change in the spatial association of any livestock other than goats was detected by the local indicators of spatial autocorrelation (LISA) statistics. Goats were the only animals to show a significant change in their spatial association, and the goat population is increasing in areas surrounded by a high density of livestock. Considering that of all Mongolian domestic animals, goats have the greatest impact on grasslands, policy makers should pay attention to these areas to ensure the sustainability of grasslands in the future. This could play a key role in the successful application of environmental management in Mongolia.</p>

DOI

13
Sanderson M A, Feldmann C, Schmidt Jet al., 2010. Spatial distribution of livestock concentration areas and soil nutrients in pastures.Journal of Soil and Water Conservation, 65(3): 180-189.Livestock concentration areas can be significant point sources of nutrient pollution. Our objective was to determine the spatial distribution of livestock concentration areas in pastures at the farm scale, along with the distribution of soil nutrients at the individual livestock concentration area scale. We georeferenced and measured the size of all livestock concentration areas in cool-season grass-legume pastures on five farms (four grazing dairies and a beef cattle farm) in Maryland, Pennsylvania, and New York during two years. Soil of selected concentration areas on each of the farms was sampled to 0 to 5 and 0 to 15 cm (0 to 2 and 0 to 6 in) depths to compare nutrient levels with paired unaffected areas of the pasture. On one farm, we sampled two concentration areas more densely (20 to 25 samples, 0 to 5 cm depth along each of five 100 m [328 ft] transects) to measure spatial distribution of soil nutrients. The transects were arranged radially to encompass variation both up and downslope. We installed runoff plots at three locations on and near the two concentration areas to measure nutrients in surface water runoff from simulated rainfall. On the five farms, concentration areas occurred most frequently at paddock gates (38% of sites). Although fewer in number, concentration areas at feeding sites were often larger than those at gates or other locations and accounted for most (48%) of the area affected by livestock congregation. Most concentration areas were small (median area 100 m2 [1,076 ft2]), isolated (median distance, 61 m [200 ft] from a water body), and surrounded by vegetation. Intensive sampling on one farm showed that soil within 20 to 40 m (66 to 132 ft) of concentration areas was enriched in phosphorus, which contributed to higher phosphorus concentration in the runoff from simulated rainfall compared with the rest of the pasture. Pastures used as holding and feeding areas with highly elevated soil nutrients and no surrounding vegetation to filter runoff represented a direct threat to surface water quality. Many concentration areas, however, were surrounded by vegetation, which would mitigate this risk

DOI

14
Song X Q, Ouyang Z, 2012. Key influencing factors of food security guarantee in China during 1999-2007.Acta Geographica Sinica, 67(6): 793-803. (in Chinese)Exploring the key influencing factors of food security guarantee during the typical period is of significance for the development of cultivated land protection and agricultural policy. This paper aims at exploring the factors between 1999 and 2007 which was in the new period of cultivated land protection administration. Methods such as comparison, spatial and econometric analysis are used to analyze the change in cultivated land productivity which was the cause of the disparity between cultivated land area and grain output changes. Results show that farmers' willingness to grow grain which determines cultivated land use intensity is the key factor. The sustained improvement of the willingness in 2003-2007 was mainly resulted from the rise of grain market price. Meanwhile, direct subsidy merely inspired farmers' anticipation for the profit of grain growing at the beginning years of implementing this policy. In addition, suggestions on the development of cultivated land protection are proposed involving improvement of farmers' willingness to grow grain, optimization of inputs in grain growing and improvement of cultivated land protection models.

DOI

15
Wan B R, 2008. Deepening understanding of food security. Issues in Agricultural Economy, (9): 4-9. (in Chinese)

16
Wang G G, Liu Y S, Fang F, 2013. Comprehensive evaluation and spatial distinction of land use efficiency around Bohai Rim in China.Progress in Geography, 32(4): 649-656. (in Chinese)Multi-function of land use determined its diverse efficiency. While, there are fewer studies which evaluated land use efficiency based on comprehensive measurement at the regional scale. It is time to carry out similar studies. The arm of this paper is to compare the main benefit of land use at different counties around Bohai Rim. At first; we constructed evaluation index system of land use efficiency, benefit measurement index, and coupling degree models. And then, we analyzed social, economic and ecological benefits of land use and its temporal- spatial coordination characteristics at the county level around Bohai Rim, which is chosen as a case study area. The conclusions can be drawn as follows. (1) It is quite obvious that land use benefits presented characteristics of spatial distinction and agglomeration. High economic value zone distributed in coastal area and inland plain area, while high ecological value zone in the basin of northwest Hebei mountains, Hebei Bashang Plateau, and mountain areas of Liaoning. (2) Based on the analysis of coupling degree models, the stage of running areas had the most numbers, which is accounting for 63.9% of the total units. (3) Coupling degree indexes showed that minor imbalance areas occupied leading position, the second is the primary coordinating regional, which are accounting for 51.09% and 31.76% of the total areas, respectively. So, it needs to put forward to control these regional problems. These measures, including dividing land use zone which can make the leading function of county land use clearly, making different land use policy, enhancing land management and planning, establishing and perfecting interest coordination and compensation mechanisms, are comprehensive ways to solve the coordination of land use benefits.

DOI

17
Wang G G, Liu Y S, Li Y Ret al., 2015. Dynamic trends and driving forces of land use intensification of cultivated land in China. Journal of Geographical Sciences, 25(1): 45-57.<p>The aim of this study is to establish several important factors representing land use intensification in cultivated land (denoted by CII), using a multi-dimensional approach to achieve realistic and practical cultivated land use policies in China. For this reason, the theoretical framework was first built to explain the changes of land use intensification in the cultivated land, and then the variables and index were further developed for the purpose of characterizing the dynamic trends and driving forces of the land use intensification in the cultivated land at the provincial level. The study results indicate that the extent of CII significantly increased during the period of 1996 to 2008, due to the extensive use of fertilizers, machinery and pesticide, increased labor and capital input, and intensified land use. Moreover, the principal component regression results show that the productivity of cultivated land, economic benefits of cultivated land, labor productivity, and land use conversion are the main factors affecting the village development. The first three factors play a positive role, while the last one has a negative effect on the land use intensification in the cultivated land. According to these results, the main policies for sustainable intensification in cultivated land are proposed. First, the sustainable pathways for intensification should be adopted to reduce the unsustainable uses of chemical fertilizer, agricultural chemicals, etc. Second, the conditions for agricultural production should be further improved to increase the cultivated land productivity. Third, it is very necessary and helpful for improving labor productivity and land use efficiency from the viewpoint of accelerated the cultivated land circulation. The last step is to positively affect the production activities of peasants by means of reforming the subsidy standards.</p>

DOI

18
Wang J J, Liao Y L, Liu X, 2010. Course of Spatial Data Analysis. Beijing: Science Press. (in Chinese)

19
Wang J M, Xiao H B, 2013. The nature and the prospect of China’s grain production for eight years. Issues in Agricultural Economy, (2): 22-31. (in Chinese)

20
Wang K J, 2004. Technology and Policy of Preventing Livestock and Poultry Pollution. Beijing: Chemical Industry Press. (in Chinese)

21
Yang C, Wang M L, 2013. Research on regional agglomeration of beef cattle production in China and its reason based on spatial effect.Technology Economics, 32(10): 80-87. (in Chinese)Based on the theory of new economic geography,this paper uses the spatial econometric approach to study the change of China's beef cattle production areas and their causes empirically.The results show as follows:China's beef cattle production takes on the characteristics of obvious spatial agglomeration,and is transferring from central plains with many off-farm employment opportunities to northeast,northwest and southwest zones with rich forage resource and low economic development level gradually.Further it studies its causes.The result shows as follows:resource condition,economic condition,technical factor and spatial interaction effect have different effects on the regional agglomeration of beef cattle production;technology,spatial error autocorrelation,agricultural labor number,grassland area and grain yield have obvious positive effects on the regional agglomeration of beef cattle production;the effect of farm employment opportunity is obvious negative.

22
Ye M Q, Fang Y, 2013. Relationship between export and total factor productivity growth in China: A study based on Spatial Durbin Model.Journal of International Trade, (5): 19-31. (in Chinese)Considering the spatial dependence of technology and knowledge as well as export spillovers,and based on the export endogenous growth model,this paper constructs a spatial Durbin model to analyze the relationship between export and total factor productivity growth in China.The empirical results indicate no significant impact of export on local total factor productivity growth,while suggesting an enhancing effect of export on total factor productivity growth of both other regions and all regions as a whole.In order to inspect the relationship more precisely,this paper draws on the method of quantile regression for panel data.As the results suggest,various export trade effects are not significant when the total factor productivity is low,as China's technology absorption capacity is small;since China鈥 s export trade mode is extensive rather than intensive,the export trade does not significantly affect the total factor productivity,either,when the total factor productivity is high;only when the total factor productivity matches the export trade mode does export trade promote the total factor productivity markedly.

Outlines

/