Orginal Article

Spatial assessment of soil wind erosion using WEQ approach in Mongolia

  • Nyamtseren MANDAKH , 1 ,
  • Jamsran TSOGTBAATAR 1 ,
  • Doljin DASH 1 ,
  • Sodov KHUDULMUR 2
Expand
  • 1. Institute of Geoecology, Mongolian Academy of Sciences, Ulaanbaatar 15170, Mongolia
  • 2. Environmental Information Center, National Agency for Meteorology and Environmental Monitoring, Ulaanbaatar 15160, Mongolia

Author: Nyamtseren Mandakh, Researcher, specialized in physical geography, GIS and remote sensing. E-mail:

Received date: 2015-06-28

  Accepted date: 2015-10-29

  Online published: 2016-04-25

Supported by

Swiss Agency for Development and Cooperation (SDC), No.81013651

Copyright

Journal of Geographical Sciences, All Rights Reserved

Abstract

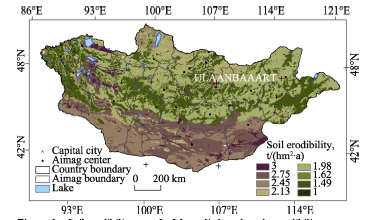
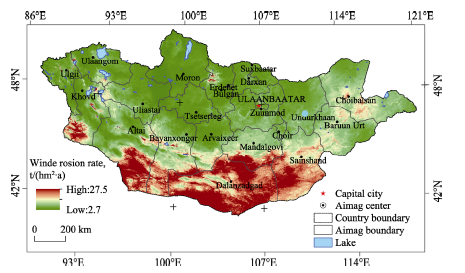
Wind erosion is a major contributor to land degradation and desertification. According to the Global Assessment of Human Induced Soil Degradation, the dryland territories of Mongolia are significantly affected by wind erosion. We used the wind erosion equation model in an ArcGIS environment to evaluate wind erosion across Mongolia. The individual factors of the wind erosion equation were parameterized using the following datasets: (a) monthly climatic data from 45 meteorological stations; (b) 16-day composites of MODIS Normalized Difference Vegetation Index data; (c) a SRTM DEM with a 90 m spatial resolution; and (d) the soil map of Mongolia. The results revealed the significant influence of aridity on wind erosion. The desert and semi-desert ecosystems were more vulnerable to wind erosion, hence more affected. The map of wind erosion revealed three major wind erosion regions where the maximum soil loss of 15-27 t/(hm2•a) was observed. In general, the wind erosion potentials for the entire country of Mongolia are 15-27 t/(hm2•a) in the deserts and semi-deserts, 10-15 t/(hm2•a) in the dry steppes and 5-10 t/(hm2•a) in the steppe regions.

Cite this article

Nyamtseren MANDAKH , Jamsran TSOGTBAATAR , Doljin DASH , Sodov KHUDULMUR . Spatial assessment of soil wind erosion using WEQ approach in Mongolia[J]. Journal of Geographical Sciences, 2016 , 26(4) : 473 -483 . DOI: 10.1007/s11442-016-1280-5

1 Introduction

Dust storms are a severe form of wind erosion and are a common occurrence in dryland regions. A number of factors can increase dryland ecosystem’s resiliency to wind erosion (Lal, 1990; Fernandez-Bernal, De La Rosa, 2009). Vegetation can obstruct and accumulate sand and dust, thus reducing the wind velocity. A layer of gravel, commonly called ‘desert pavement’, can protect the topsoil layer. However, recent changes in climate and land use have intensified the transportation of soil particles by wind in dryland regions, thus accelerating soil erosion.
The results of the Global Assessment of Human Induced Soil Degradation research project suggested that about 548 million ha of the world’s land mass are affected to some degree by wind erosion (Oldeman, 1992). Of the total area affected by wind erosion, 95% was assessed as slightly or moderately degraded. It can therefore be concluded that at the time of this assessment, approximately 27.4×10⁶ ha of land worldwide were heavily degraded by wind erosion. Wind erosion processes contributed to 30% of the total soil degradation in the Asian continent, of this 30%, 2.22×10⁸ ha were contributed by wind erosion (Oldeman, 1992).
The rate and extent of wind erosion over Mongolia has been assessed using an expert-based method. According to these results, about 30% of the total territory of Mongolia was considered to be affected by wind erosion, of which the Gobi Desert was considered to be most heavily affected (Oldeman, 1992; Middleton and Thomas, 1998). Using meteorological observations coupled with liDAR an overall increase in wind erosion has been observed throughout Mongolia (Natsagdorj et al., 2003). However, the amount of soil that has eroded within any given defined area in Mongolia has yet to be quantified.
Field and laboratory research to identify the factors affecting wind erosion started in the 1930s when wind was considered to be the leading factor in erosion (Fryrear et al., 2001). As it is impossible to determine all the factors contributing to wind erosion during a single event, a series of experiments is needed to assess each factor separately. Several physical models have been developed for this purpose. The first wind erosion assessment model, the Universal Wind Erosion Equation, was developed by the United States Department of Agriculture in 1961 and was later updated and published as the Wind Erosion Equation (WEQ) (USDA, 1961; Woodruff, Siddoway, 1965). The WEQ was the only empirical model available for over 30 years until the Revised Wind Erosion Equation (RWEQ) was published in 1998 (Fryrear et al., 1998). These models were mainly used on agricultural areas and a wind erosion assessment spatial model, capable of covering large territories, was not available until the year 2000.
The first spatial model, the Wind Erosion Assessment Model, was developed in Australia. It was designed to assess climatic and terrain surface factors from satellite data, but did not account for soil moisture levels or surface roughness, two important components in empirical models (Leys et al., 2001). To analyse the extent of soil degradation on a regional scale using geographical information system (GIS) and satellite data, the RWEQ is used instead (Zobeck et al., 2000). As some of the satellite-based data contains several different values, the input data can be simplified into single complex indicator.
The aim of this research was to calculate the soil loss due to wind erosion across the entire territory of Mongolia and to identify regions that may be particularly prone to wind erosion. We also explored the ability of GIS and remote sensing techniques to assess and map wind erosion. We relied on the general concept of the WEQ model because some input data for the RWEQ (e.g. land use, the height of vegetation and the soil roughness using the chain method) were not available for the entire territory of Mongolia.

2 Materials and methods

2.1 Study area

Mongolia is a landlocked country in northern Asia, bounded by Russia to the north and China to the west, south and east. Mongolia’s climate changes from extra-arid to arid, dry, sub-humid and humid along a north-south gradient. In general, the climate is characterized as extra-continental, with large seasonal and diurnal fluctuations in temperature and a clearly defined seasonal pattern of precipitation. The mean annual temperature varies between regions. In the mountainous regions it is approximately -4°C; the montane valleys and low depressions observe mean annual temperatures as low as a range from -6 to -8°C. In the southern regions the mean annual temperature fluctuates between 0-2°C and 6-8°C. The total precipitation is low across the whole country, but also shows a strong latitudinal variation. The northern mountainous regions receive about 300-400 mm of precipitation each year, whereas the southern semi-desert and desert regions receive 50-150 mm. The annual evaporation in the high mountain belt region is <500 mm; 550-700 mm in the forest steppe, 650-750 mm in the steppe and 800-1000 mm in the desert steppe regions. Mongolia receives 230-260 days of sunshine each year, with an annual sunshine duration between 2600 and 3300 hours.
Mongolia’s steppe and desert steppe regions experience significant winds, which often produce dust storms. The annual average wind velocity in these areas is 4-6 m/s. The Altai, Khangai, Khovsgol and Khentii mountains and mountain valleys observe wind velocities of 1-2 m/s and speeds of 2-3 m/s in the remaining areas. Data from observation stations suggest that about one-quarter of the country experiences wind velocities >4.0 m/s. The desert steppe, semi-desert and desert regions account for about 41.3% of the Mongolia’s territory and are characterized by loose and fragile soils, with high winds causing sand and dust storms. The number of days with sand and dust storms is 30-100 days•yr-1, increasing to 120 days in the southern parts of the Mongol Els (Mongol Sands). Meteorological observational data indicate that there are about 300-600 hours of sand and dust storms per year.
Kastanozem soils cover about 40% of the country. The other major types of soil are cambisols and chernozems. The southern dryland areas consist of various types of calcisols (Dorjgotov, 2009). The vegetation types include forest, forest steppe, steppe, desert steppe and desert plant communities. According to the land cover map, the desert steppes cover 30.39% of the total land area, and the steppes 19.32%, semi-deserts 14.05%, dry steppes 13.18%, forest 7.77%, high mountain meadow steppe 4.77% and desert 3.52% of the total land area.

2.2 Wind erosion equation

The WEQ (Woodruff, Siddoway, 1965) is an empirically based model with the following functional expression:
E = f(I, K, C, L, V) (1)
where E is the estimated average annual soil loss (t/(hm2·a)); I is the soil erodibility index (t/(hm2·a)); K is the surface roughness factor; C is the climatic factor; L is the unsheltered distance or the distance for which the wind blows undisturbed (m); V is the vegetation factor.
These factors were initially derived from wind tunnel research and were determined by the correlation of 11 primary parameters. The soil erodibility factor (I) is a measure of the potential soil loss from a wide, bare, smooth, unsheltered and non-crusted surface and can be adjusted to account for the presence of hills, knoll topography and the mechanical stability of the soil. The surface roughness factor (K) adjusts the soil erodibility for the surface roughness of the soil other than that caused by clods or vegetation. The climatic factor (C) includes the effect of wind velocity and soil moisture, which is proportional to the PE index (Thornthwaite, 1931). The field length factor (L) is the distance across a field along the prevailing direction of wind erosion. The vegetation factor (V) adjusts the soil loss given by other factors to account for any vegetative material on the soil surface.

2.3 Data

The following sections describe how the individual WEQ factors were estimated from the available data on climate and how the satellite images were processed with a DEM. The factor of unsheltered distance or the distance for undisturbed wind flow was not taken into consideration on the assumption that there was no barrier to hinder the wind force in this study area. The terrain roughness was used as a surrogate for the surface roughness factor as the current research focus is at the regional level.

2.4 Wind erosion climatic factors

When estimating wind erosion, climatic factors such as wind velocity and the surface moisture condition should be taken into consideration (Chepil et al., 1962; Woodruff, Armbrust, 1968; Lyles, 1983). For this purpose, we used the following equation proposed by Chepil et al. (1962):
where С is the climatic factor; u is the mean wind velocity (m/s); PE is the Thornthwaite potential evaporation index. PE can be determined by the following equation:
where Pi is the monthly mean precipitation (mm); Ti is the monthly mean temperature (°C).
To calculate the climatic factor, the main input parameters for Eqs. (2) and (3) were obtained from 45 meteorological stations distributed across Mongolia. We then used the plate spline algorithm in conjunction with an DEM and station point data to interpolate a climatic factor surface map.

2.5 Soil erodibility factor

The soil erodibility factor is determined under laboratory conditions by the percentage of non-erodible surface soil aggregates >0.84 mm in diameter in a soil sample obtained from a given surface unit (Chepil, 1942; Laflen et al., 1991). To calculate the soil erodibility factor, we obtained data on the content of silt and clay particles in the various types of soil from the Harmonized World Soil Database (FAO/IIASA/ISRIC/ISS-CAS/JRC, 2008). Information on the content of organic matter and calcium carbonate were obtained from the soil laboratory database at the Institute of Geography, Mongolian Academy of Sciences. The following governing equation was used to calculate the soil erodibility for different types of soil:
where SA is the sand content (%), Si is the silt content (%), CL is the clay content (%), OM is the organic matter content (%); CaCO3 is the percentage of calcium carbonate in the soil sample.

2.6 Surface roughness

Surface roughness is an important factor affecting wind dynamics. Surface roughness is usually understood as an elevation at which the mean wind velocity is close to zero. The value of the surface roughness depends on the undulation of the landscape, the presence and density of soil clods and the height of the vegetation, among other factors (Zingg and Woodruff, 1951). According to Fryear (1994), the surface roughness and soil wind erosion are negatively correlated, with surface roughness suppressing the flow of sand and dust. Although this factor is therefore necessary for the assessment of wind erosion, it is both difficult and time consuming to assess surface roughness location at a site and its surrounding landscape.
In this research we relied on the available remote sensing data to calculate terrain features. As the WEQ defines roughness as a factor limiting the erosive effect of wind, we considered terrain roughness as a possible indicator for the country-wide assessment of this factor. The elevation difference in the height of the correlated data points was calculated from the SRTM DEM and used to define a terrain roughness for a moving window of 1 km.

2.7 Vegetation cover factors

Wind erosion is sensitive to surface vegetation cover because vegetation affects the near-surface wind velocity. In areas dominated by annual plants, droughts can result in bare ground exposed to wind erosion. Vegetation parameters such as height and foliage cover (leaf area) are therefore essential for assessing wind erosion (Wischmeier and Smith, 1978).
Plant height has a more significant effect on wind erosion than on water erosion. However, information on plant height and density is spatially restricted in Mongolia. Following similar research conducted by Raupach, (1994), McVicar et al. (1996), and Rui et al. (2013), we used remotely sensed Normalized Difference Vegetation Index (NDVI) and Leaf Area Index (LAI) data.
The NDVI data were derived from MODIS satellite records of red and near-infrared radiation. A composite of 16-day images from April to November 2010 were used in this study. As the MODIS LAI product is undetermined vegetation for semi-desert and desert regions, the following linear equation associated with the NDVI was used:
where LAI is the leaf area index, NDVI is the normalized difference vegetation index obtained from data sets for MODIS Terra Vegetation Indices 16-Day L3 Global 250 m.

3 Results

3.1 Climatic factors

Climatic factors are essential in the WEQ model. The relevant climatic factors include the wind regime, rainfall, temperature and humidity, with the wind velocity being the primary factor. Considering all other factors, if higher wind velocities are observed, then greater erosion will occur. The temperature and precipitation regimes define the susceptibility to wind erosion. Humid areas have a greater soil moisture content and therefore a lower vulnerability to wind erosion than drier climates. It is challenging to simultaneously account for wind velocity, precipitation and temperature regimes in the interpretation of such a complex process as wind erosion. A number of studies have attempted to explain climatic factors using general climatology and atmospheric physics methods. We calculated the climatic driver of wind erosion using Eqs. 2 and 3, as proposed by Chepil (1962), using the monthly and annual data for precipitation, temperature and wind speed in 2010. Our results showed that the maximum value of the climatic factor for Mongolia is between 20 and 39 in the semi- desert and desert regions; the minimum value is between 0.1 and 0.8 in the northern-forested regions (Figure 1).
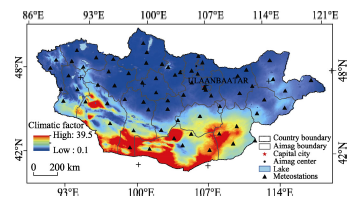
Figure 1 Geographical distribution of the climatic factor in Mongolia
We considered that an analysis of which climatic variable more significantly defined wind erosion in different natural settings would be an interesting topic for further research on wind erosion in Mongolia. To investigate this, we used a simple Pearson correlation (r) analysis. We found that different climatic factors affected different regions. Aridity was particularly important in the Gobi and desert regions, whereas the wind velocity was more important in the steppe and forest regions (Table 1).
Table 1 Correlation analysis of wind erosion climatic factors in different regions
Gobi region Steppe Forest
Wind velocity -0.00392 0.473368 0.395919**
Total precipitation 0.495978 -0.15961 -0.40169
Mean temperature 0.21528 0.206479 -0.90791**
Annual PE -0.93119** -0.92748** -0.19763**

**, P≤0.001, n=45.

In terms of vulnerability to wind erosion, three distinct regions can be defined. These are the southern Altai region, the Central Gobi region and the Lake Valley region (Figure 1). These three regions are the most affected by climatic drivers of wind erosion.

3.2 Soil erodibility factor

We found a total of seven soil groups with different erodibility factors (Table 2). Based on these results, we objectively evaluated the susceptibility of the representative soils to soil erosion and defined four groups of soils (from not susceptible to most susceptible). More than 60% of Mongolian soils fall into the strong and extremely strong groups based on this erodibility factor (Figure 2). The areas of soils with a light degree of susceptibility are 32.4%
and soils with moderate erodibility occupy about 8% of the territory. It was concluded that cambisol, calcisol and kastanozem soils were the soils most susceptible to erosion.
Figure 2 Soil erodibility map for Mongolia based on the erodibility group
Table 2 Soil erodibility (K) factor by affected area and rate assessment

3.3 Surface roughness

Wind streams occurring throughout Mongolia should be considered at the macro-, meso- and micro-scales. The topography has a significant effect on the airflow and wind streams in circulation throughout the territory and, consequently, also affects the wind direction and the distribution of wind velocity. For this reason, the wind velocity is higher in the southern half of Mongolia, whereas in the mountainous regions the wind velocity is relatively low as a result of the sheltering effect of the terrain. At the meso-scale, the increase in wind velocity within the mountain valleys and in the valleys between the mountains and depressions is a result of the reduction in obstructions. The local changes in wind direction and the change in wind velocity with terrain roughness were assessed on a scale of 0-1, where 1 is assigned to unsheltered regions. The regions with values closer to 1 have very low levels of obstructions to wind flow. The roughness values in Mongolia vary between 0.3 and 0.98. The results showed that more than 45% of the territory has a topographic roughness value between 0.3 and 0.9 (Figure 3). These regions mainly occupy the southern, eastern and southeastern parts of Mongolia.
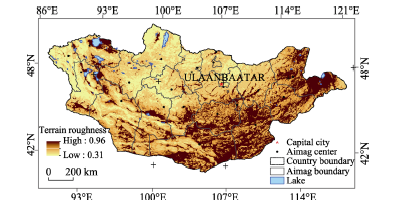
Figure 3 Terrain roughness map for Mongolia

3.4 Vegetation cover factors

The impact of vegetation cover factors on wind erosion was calculated from the total amount of soil particles transported offsite through creep, saltation, and suspension. Previous studies have found that 60%-70% of soil subjected to erosion was transported through creep and saltation (USDA, 1961; Woodruff and Siddoway, 1965; Fryrear et al., 1998). The LAI was therefore chosen as a key component of wind erosion in this study. We found that the selected index varied between 0 and 3 (Figure 4). The highest values were found in the forest and forest steppe regions of northern Mongolia. Although the spatial distribution of the LAI is generally equal to or coincides with the NDVI, it has comparatively smaller values in terrains other than forested areas. Therefore the impact of vegetation cover on wind erosion is relatively small in Mongolia. In other words, in areas other than the forest region, most of the vegetation and plants are sparsely distributed and have a limited leaf area.
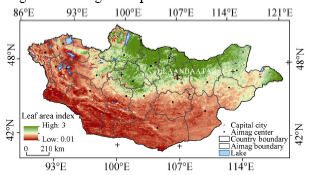
Figure 4 Leaf area index map for Mongolia

3.5 Wind erosion in Mongolia

The wind erosion map for Mongolia was produced by multiplying all the individual factor maps discussed in the preceding sections. The resulting map shows that wind erosion is present in all regions of the country. The modelled results show that the rate of wind erosion in Mongolia varies between 2.7 and 27.5 t/(hm2•a) (Figure 5). The maximum amount of soil transported by wind is 15-27 t/(hm2•a), most of which occurs in the desert and semi-desert regions. Geographically, there are three different regions of high wind erosion concentrated in the southernmost part of the country. These are mainly flat, elongated and elevated plains separated by mountain ranges with a relative height of 1000-1500 m. These regions coincide with the southernmost Altai Gobi, northern desert and southern desert physiographic regions.
Figure 5 Wind erosion map for Mongolia

4 Discussion

Our quantified results of soil loss due to wind erosion showed that it is highly variable within the territory of Mongolia and mainly pronounced in arid and semi-arid parts of the country where its maximum can reach up to 27.5 t/(hm2•a). The underlying cause of high level of wind erosion in the southern part of the country is attributed to the distribution of soil and vegetation which are prone to exogenous factors, e.g. drought, erosion etc. From the individual factor assessment it can also be concluded that climate is the leading factor for activation of wind erosion on a territory. Topography of the territory also has some influence on wind erosion, which mainly acts as a corridor for main wind directions from the NW to SE. It was observed that areas with a sloping plain and plain relief surrounded by mountains are more affected by wind erosion.
The erosion rate assessment for the Mongolian Plateau reported by Qi et al. (2010) using 137Cs tracing techniques in the field showed that 100-400 t/(hm2 
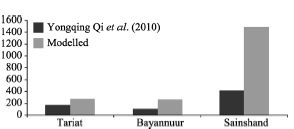
a) of soil is removed by wind. We compared these results with our modelled results (Figure 6). Our modelled results are close to the field results (df = 2, t-stat -1.4, r = 0.97), although the modelled results are slightly higher. The difference between the results in Sainshand may be due to the surface roughness factor. The surface roughness factor is low in this region, but the field-based assessments account for small-scale features. In addition, the effect of vegetation in the model is a hypothetical value taken from the derivation of a remotely sensed image. Overall the comparison shows that the model has great potential in predicting wind erosion.
Figure 6 Comparison of modelled results with those of Qi et al. (2010)
Asimilar picture has been described by Funk et al. (2011) and Yuan et al. (2008) in their research on wind erosion using 137Cs tracing technique in the territory of Inner Mongolia. The authors linked high level of wind erosion in Inner Mongolia (or transboundary territory of China and Mongolia) to the conditions of vegetation cover and its dynamics over the past decade, which were highly degraded due to overgrazing. Unlike the Inner Mongolian part, the number of livestock in the southern parts of Mongolia is relatively low; however, it doesn’t reject assumptions on relations of livestock grazing and soil wind erosion. Thus, land use has to be considered as one factor for future research.
Zhou et al. (2015) indicated that over the territory of Inner Mongolia regions with erosion at severe, intensive and mild levels during the period of 1985-2011 have increased. The authors used GIS and remote sensing information to evaluate intensity of wind erosion and revealed that regions occupied by barren land or sparse vegetation showed the most severe erosion, followed by land occupied by open shrubbery.In addition, erosion rate is differed with the content of CaCO3 and the surface composition of sandy, loamy and clayey soils with particle sizes of 0-1 cm has been defined, which might also be a case for the wind erosion situation in southern Mongolia.

5 Conclusions

The main purpose of this research was to make a quantitative assessment of wind erosion over the territory of Mongolia by using a physical model. Such analyses are necessary to develop a comprehensive assessment of land degradation and desertification in Mongolia.
By analysing the various factors individually, we concluded that each factor influenced the wind erosion process differently depending in which natural zone it occurred. In general, the wind erosion process is more pronounced in the semi-desert and desert regions. Some 90% of the land area in Mongolia is affected by wind erosion to some extent and the highest erosion values (15-20 t/(hm2•a)) are observed in the Gobi region, which occupies 30% of the total territory. Wind erosion also occurs in the steppe and forest steppe regions with relatively dense vegetation, from which it can be concluded that vegetation is not a limiting factor for soil erosion by wind. The geographical distribution of wind erosion leads us to conclude that there are three major regions where the rate and possible effects of wind erosion are critical. Special focus in further research should be paid to the southernmost Altai Gobi, northern desert and southern desert physiographic regions.
A comparative analysis of our modelled results with the field results obtained by Qi et al. (2010), Funk et al. (2011) and Yuan et al. (2008) using 137Cs showed a good consistency. However, any empirical, physical or statistical models used to assess erosion processes, especially those relying on remotely sensed data and techniques, should take account of the fact that all derivations of remotely sensed images are hypothetical. In this respect, field level monitoring using methods such as dust sampling and isotope screening should be used to complement this kind of research.

The authors have declared that no competing interests exist.

1
Chepil W S, 1942. Measurement of wind erosiveness of soils by the dry sieving procedure.Scientific Agriculture, 25: 154-160.

2
Chepil W S, Siddoway F H, Armbrust D V, 1962. Climatic factor for estimating wind erodibility of farm fields.Journal of Soil and Water Conservation, 17: 162-165.CiteSeerX - Scientific documents that cite the following paper: Climatic Factor for Estimating Wind Erodibility of Farm Fields

3
Dorjgotov D, 2009. National Geographic Atlas of Mongolia. Ulaanbaatar: The Institute of Geography.

4
FAO/IIASA/ISRIC/ISS-CAS/JRC, 2008. Harmonized World Soil Database (version 1.0). Rome: FAO.

5
Fernandez-Bernal A, De La Rosa M A, 2009. Arid Environments and Wind Erosion. Portland, Oregon: Nova Science.

6
Fryrear D W, Saleh A, Bilbro J Det al., 1998. Revised wind erosion equation.Technical Bulletin No. 1. College Station, Texas, USA: Southern Plain Area Cropping Systems Research Laboratory, USDA-ARS.

7
Fryrear D W, Sutherland P L, Davis G et al., 2001. Wind erosion estimates with RWEQ and WEQ. In: Stott D E, Mohtar R H, Steinhardt G C (eds.). Sustaining the Global Farm. Selected Papers from the 10th International Soil Conservation Organization Meeting, 760-765. West Lafayette, IN: Purdue University and USDA-ARS National Soil Erosion Research Laboratory.

8
Funk R, Li Y, Hoffmann Cet al., 2012. Using 137Cs to estmate wind erosion and dust deposition on grassland in Inner Mongolia - selection of a reference site and description of the temporal variability.Plant Soil, 351: 293-307. doi: 10.1007/s11104-011-0964-y.

9
Laflen J M, Elliot W J, Simanton J Ret al., 1991. WEPP soil erodibility experiments for rangeland and cropland soils.Journal of Soil and Water Conservation, 46: 39-44.The effects of controlled-drainage-subirrigation (CD-SI) systems on subsurface and outflow water quality must be evaluated before these systems can be promoted for use in the Georgia flatwoods region of the eastern Coastal Plain. In this paper, Nitrate-nitrogen (N), ammonium-N, and orthophosphorous (P) concentrations are measured from shallow subsurface wells and outlets of a CD-SI system in the Georgia flatwoods for comparison to adjacent forested and grassland areas (the most common current land uses). Nitrate-N concentrations did not exceed 10 mg/L from any of the outflow samples although almost 6% of the well samples taken from the CD-SI area had concentrations exceeding 10 mg/L. Nitrate-N concentrations in most of the wells in the CD-SI area were significantly higher than in the forested and cleared areas. Ammonium-N and ortho-P concentrations were relatively low and do not appear to be a problem based on this limited data. No significant differences in ammonium-N and ortho-P concentrations were shown between any of the sites. Ammonium-N concentrations did exceed 2 mg/L from at least one sample of the scrub forest, one of the CD-SI blueberry sites, an open ditch (1.8 m depth), and one of the cleared unirrigated sites. Ortho-P concentrations ranged from 0 to 1.94 mg/L, with average concentrations from all sites near 0.1 mg/L.

DOI

10
Lal R, 1990. Soil Erosion in the Tropics: Principles and Management. New York: McGraw-Hill.

11
Leys J, Mctainsh G, Shao Y, 2001. Wind erosion monitoring and modeling techniques in Australia. In: Stott D E, Mohtar R H, Steinhardt G C (eds.). Sustaining the Global Farm. Selected Papers from the 10th International Soil Conservation Organization Meeting, 940-950. West Lafayette, In: Purdue University and USDA-ARS National Soil Erosion Research Laboratory.

12
Liu J, Qi Y, She Het al., 2008. Estimation of wind erosion rates by using 137Cs tracing technique: A case study in Tariat-Xilin Gol transect, Mongolian Plateau.Chinese Science Bulletin, 53(5): 751-758.

13
Lyles L, 1983. Erosive wind energy distributions and climatic factors for the West.Journal of Soil and Water Conservation, 38: 106-109.Erosive wind energy (EWE) distributions were determined for the 7 west- ern states and Alaska. Wind erosion equation climatic factors (C) were determined for the 10 Great Plains States, the 7 western states, and Alaska. Both EWE and C should be useful in improving design and evaluation of wind erosion control systems and data qual- ity from future national erosion inventories.

DOI

14
McVicar T R, Walker J, Jupp D L Bet al., 1996. Relating AVHRR vegetation indices to in situ measurements of leaf area index.Technical Memorandum 96.5. Canberra: CSIRO, Division of Water Resources.

15
Middleton N J, Thomas D S G, 1998. World Atlas of Desertification. 2nd edn. London: Edward Amold, 182 pp.

16
Natsagdorj L, Jugder D, Chung Y S, 2003. Analysis of dust storms observed in Mongolia during 1937-1999.Atmospheric Environment, 37: 1401-1411.An important outcome of this study is the trend of dusty days between 1960 and 1999. It shows that the number of dusty days has tripled from the 1960s to 1990s and has decreased since 1990.

DOI

17
Oldeman L R, 1992. Global extent of soil degradation.ISRIC Bi-Annual Report. Wageningen: ISRIC.

18
Qi Y, Liu J, Shi Het al., 2010. Estimation of wind erosion rates of Mongolian Plateau by using 137Cs tracing technique. Annals of Warsaw University of Life Sciences - SGGW,Land Reclamation, 42(1): 197-208.

19
Raupach M R, 1994. Simplified expressions for vegetation roughness length and zero-plane displacement as functions of canopy height and area index.Boundary Layer Meteorology,71: 211-216.Using a previous treatment of drag and drag partition on rough surfaces, simple analytic expressions are derived for the roughness length ( z 0 ) and zero-plane displacement ( d ) of vegetated surfaces, as functions of canopy height ( h ) and area index (螞). The resulting expressions provide a good fit to numerous field and wind tunnel data, and are suitable for applications such as surface parameterisations in atmospheric models.

DOI

20
Rui M, Chang H H, Song Fet al., 2013. The influence of vegetation variation on Northeast Asian dust activity.Asia-Pacific Journal of Atmospheric Science, 49(1): 87-94.In this study, we investigate the influence of vegetation variations on dust activity (dust load, dust transport in the troposphere, and dust weather frequency) over Northeast Asia during springtime.

DOI

21
Thornthwaite C W, 1931. Climate of North America according to a new classification.Geographical Review, 21: 633-655.

22
United States Department of Agriculture (USDA), 1961. A universal equation for measuring wind erosion. USDA-ARS Report 22-69: 1-22. USDA, Washington, DC.

23
Wischmeier W H, Smith D D, 1978. Predicting rainfall erosion losses: A guide for conservation planning. Agriculture Handbook 537. USDA, Washington, DC.

24
Woodruff N P, Armbrust D V, 1968. A monthly climatic factor for the wind erosion equation.Journal of Soil and Water Conservation, 23(3): 103-104.ABSTRACT

25
Woodruff N P, Siddoway F H, 1965. A wind erosion equation.Soil Science Society of America Proceedings, 29: 602-608.

26
Zingg A W, Woodruff N P, 1951. Calibration of a portable tunnel for simple determination of roughness and drag on field surfaces.Agronomy Journal, 43: 191-193.

27
Zobeck T, Parker N, Haskell Set al., 2000. Scaling-up from field to region for wind erosion prediction using a field-scale wind erosion model and GIS.Agriculture, Ecosystems and Environment, 82: 247-259.The feasibility was evaluated of using a field-scale wind erosion model with a geographic information system (GIS) to scale up to regional levels and to quantify the differences in wind erosion estimates produced by different scales of soil mapping used as a data layer in the model. A GIS was used in combination with the revised wind erosion equation, a field-scale wind erosion model, to estima...

DOI

28
Zhou Yi, Guo Bing, Wang Shixinet al., 2015. An estimation method of wind erosion in Inner Mongolia of China based on geographic information system and remote sensing.Journal of Arid Land, 7(3): 304-317. doi: 10.1007/s40333-015-0122-0.Studies of wind erosion based on Geographic Information System (GIS) and Remote Sensing (RS) have not attracted sufficient attention because they are limited by natural and scientific factors. Few studies have been conducted to estimate the intensity of large-scale wind erosion in Inner Mongolia, China. In the present study, a new model based on five factors including the number of snow cover days, soil erodibility, aridity, vegetation index and wind field intensity was developed to quantitatively estimate the amount of wind erosion. The results showed that wind erosion widely existed in Inner Mongolia. It covers an area of approximately 90&times;10<sup>4</sup> km<sup>2</sup> accounting for 80% of the study region. During 1985&ndash;2011, wind erosion has aggravated over the entire region of Inner Mongolia, which was indicated by enlarged zones of erosion at severe, intensive and mild levels. In Inner Mongolia, a distinct spatial differentiation of wind erosion intensity was noted. The distribution of change intensity exhibited a downward trend that decreased from severe increase in the southwest to mild decrease in the northeast of the region. Zones oc-cupied by barren land or sparse vegetation showed the most severe erosion, followed by land occupied by open shrubbery. Grasslands would have the most dramatic potential for changes in the future because these areas showed the largest fluctuation range of change intensity. In addition, a significantly negative relation was noted between change intensity and land slope. The relation between soil type and change intensity differed with the content of CaCO<sub>3</sub> and the surface composition of sandy, loamy and clayey soils with particle sizes of 0&ndash;1 cm. The results have certain significance for understanding the mechanism and change process of wind erosion that has occurred during the study period. Therefore, the present study can provide a scientific basis for the prevention and treatment of wind erosion in Inner Mongolia.

DOI

Outlines

/