Orginal Article

Capacity of soil loss control in the Loess Plateau based on soil erosion control degree

  • GAO Haidong 1, 2 ,
  • Li Zhanbin , 1, 2 ,
  • JIA Lianlian 3 ,
  • Li Peng 1 ,
  • XU Guoce 1 ,
  • REN Zongping 1 ,
  • PANG Guowei 4 ,
  • ZHAO Binhua 1
Expand
  • 1. State Key Laboratory Base of Eco-hydraulic Engineering in Arid Area (Xi’an University of Technology), Xi’an 710048, China
  • 2. State Key Laboratory of Soil Erosion and Dryland Agriculture on Loess Plateau, Institute of Soil and Water Conservation, Chinese Academy of Sciences and Ministry of Water Resources, 712100, Yangling, Shaanxi, China
  • 3. Upper and Middle Yellow River Bureau, Yellow River Conservancy Commission of the Ministry of Water Resources, Xi’an 710021, China
  • 4. College of Urban and Environmental Science, Northwest University, Xi’an 710127, China;

Author: Gao Haidong (1983-), PhD, specialized in soil erosion and remote sensing. E-mail:

*Corresponding author: Li Zhanbin, Professor, E-mail:

Received date: 2015-09-17

  Accepted date: 2015-10-20

  Online published: 2016-04-25

Supported by

National Natural Science Foundation of China, No.41401305 No.41330858 The Open Foundation of State Key Laboratory of Soil Erosion and Dryland Farming on the Loess Plateau, No K318009902-14

Copyright

Journal of Geographical Sciences, All Rights Reserved

Abstract

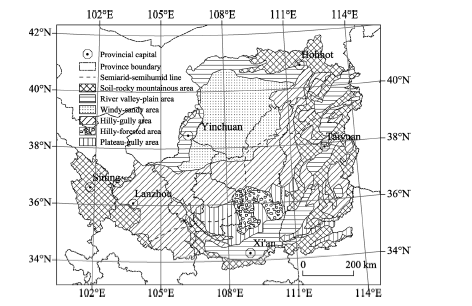
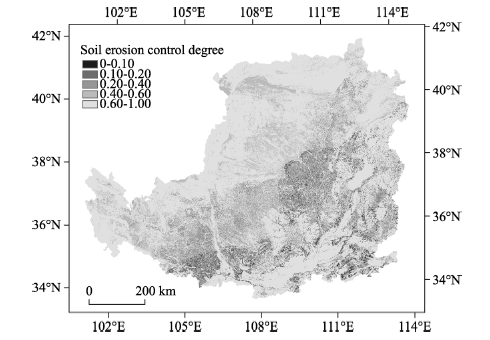
The capacity of soil and water conservation measures, defined as the maximum quantity of suitable soil and water conservation measures contained in a region, were determined for the Loess Plateau based on zones suitable for establishing terraced fields, forestland and grassland with the support of geographic information system (GIS) software. The minimum possible soil erosion modulus and actual soil erosion modulus in 2010 were calculated using the revised universal soil loss equation (RUSLE), and the ratio of the minimum possible soil erosion modulus under the capacity of soil and water conservation measures to the actual soil erosion modulus was defined as the soil erosion control degree. The control potential of soil erosion and water loss in the Loess Plateau was studied using this concept. Results showed that the actual soil erosion modulus was 3355 t•km-2•a-1, the minimum possible soil erosion modulus was 1921 t•km-2•a-1, and the soil erosion control degree was 0.57 (medium level) in the Loess Plateau in 2010. In terms of zoning, the control degree was relatively high in the river valley-plain area, soil-rocky mountainous area, and windy-sandy area, but relatively low in the soil-rocky hilly-forested area, hilly-gully area and plateau-gully area. The rate of erosion areas with a soil erosion modulus of less than 1000 t•km-2•a-1 increased from 50.48% to 57.71%, forest and grass coverage rose from 56.74% to 69.15%, rate of terraced fields increased from 4.36% to 19.03%, and per capita grain available rose from 418 kg•a-1 to 459 kg•a-1 under the capacity of soil and water conservation measures compared with actual conditions. These research results are of some guiding significance for soil and water loss control in the Loess Plateau.

Cite this article

GAO Haidong , Li Zhanbin , JIA Lianlian , Li Peng , XU Guoce , REN Zongping , PANG Guowei , ZHAO Binhua . Capacity of soil loss control in the Loess Plateau based on soil erosion control degree[J]. Journal of Geographical Sciences, 2016 , 26(4) : 457 -472 . DOI: 10.1007/s11442-016-1279-y

1 Introduction

The Loess Plateau is located in the northern hinterland of China, and forms a significant portion of the Yellow River Basin. The major environmental problem in the Loess Plateau is serious soil erosion and water loss. According to the Comprehensive Scientific Survey of Soil Erosion and Water Loss and Ecological Safety in China, the Loess Plateau with a total area of 64×104 km2 has soil erosion area up to 39×104 km2, including severe water erosion area of 3.67×10⁴ km2 with soil erosion modulus ≥15,000 t·km-2·a-1, which accounts for 89% of similar areas in China (MWR, PRC et al., 2010). The serious soil erosion and water loss in the Loess Plateau restrains local socio-economic development and seriously threatens the flood control safety in the downstream channel, so it has attracted widespread attention from scholars at home and abroad; concentrated rainstorms, loose loess, low vegetation coverage, and unreasonable human activities are the main causes for the serious soil erosion in the Loess Plateau (Fu et al., 2011; Dotterweich, 2013; Sun et al., 2014; Wang et al., 2015; Zhao et al., 2014; Jiao et al., 2014).
To prevent the serious soil erosion and water loss, the Chinese government has taken a series of soil and water conservation measures, such as adjusting land use structure, recovering vegetation, improving tillage practice, building terraces on slopes, and constructing check dams in channels (Zhu, 2012; Bullock et al., 2011). As of 2010 (UMRYRAB, 2011), more than 90,000 check dams of various types had been constructed to form 28.63×10⁴ ha of dam farmland, 281.85×10⁴ ha of terraces had been built, and 968.28×10⁴ ha of forest had been planted. The implementation of large-scale soil and water conservation programme has caused sharp decrease in sediment discharge in the Yellow River, for example, the average sediment discharge measured at Sanmenxia hydrologic station was 16×108 t during 1919-1960, but it was 6×10⁸ t during 1990-2007, decreasing by 10×108 t, of which 50%-60% was caused by rainfall-induced sediment reduction and 40%-50% was caused by soil and water conservation measures (YRCC, MWR, 2013). The sediment reduction effect of soil and water conservation measures has been studied in depth by scholars from China and other countries; the soil conservation measures primarily include terracing, check dam building, and returning cultivated land to forest (grassland), and the study areas are mainly concentrated in the source region of centralized coarse sediments in the Hekou-Longmen section of the middle reaches of the Yellow River (Yao et al., 2013). Liu et al. (2014) believed that the sediment reduction effect of the level terraces in the Loess Plateau has been most probably underestimated, and the sediment reduction potential of ridged level terraces in the river basins can be up to 65%-90%; when the terrace percentage is more than 35%-40%, the sediment reduction effect of the terraces is basically stabilized at about 90%. Zhang et al. (2009) through study indicated that the influence degree of the human activities, including land use/cover changes, in the Hekou-Longmen section of the middle reaches of the Yellow River on the decrease in runoff in the river basin is over 50%. The construction of check dams has enabled significant change in the original relationship between sediment transport and sedimentation in the river basin. Research results show that, in natural conditions, the sediment delivery ratios of the river basins in the Loess Plateau are generally about 1, and decrease significantly with the construction of dam and reservoir projects, for example, the sediment delivery ratio in the Wuding River basin decreases to 0.2-0.4 (Xu et al., 2004).
The common index currently used for characterizing river basin governance degree is soil erosion and water loss governance degree (Su et al., 2011), namely, “ratio of the area of the regions with soil erosion and water loss governance measures taken to the area of the regions having soil erosion and water loss in a river basin (region)”. However, governance degree cannot accurately reflect the governance level of a river basin; for some river basins, the soil erosion and water loss governance degree may have reached 100%, yet there are still soil erosion and water loss areas to be further governed, so the ratio of governance area to soil erosion and water loss area cannot comprehensively reflect the status of governance recovery (erosion control) of a small catchment. The slope farmlands account for about 2/3 of the total farmland area in the Loess Plateau, and are the main source of soil and water loss in the Loess Plateau, with average soil erosion modulus up to 25,000 t·km-2·a-1 (Gao et al., 2012). There are primarily two ways for converting the slope farmlands in the Loess Plateau: one is converting slopes into terraces, and the other is returning cultivated land to forest (grassland). There are currently few reports on soil and water conservation measures and slope farmland conversion potential in the Loess Plateau.
This paper, with the whole Loess Plateau as a study object, firstly defines the concept of soil erosion control degree and determines the calculation method for the capacity of soil and water conservation measures; secondly analyzes the capacity of soil and water conservation measures and the characteristics of soil erosion control degree of the whole Loess Plateau; and finally discusses the soil erosion and land use structure changes in the Loess Plateau under the capacity of soil and water conservation measures and analyzes the grain yield level in the Loess Plateau under the capacity of soil and water conservation measures. It is expected that the research results will provide scientific bases for soil and water conservation works in the Loess Plateau.

2 Materials and methods

2.1 Study region

The Loess Plateau is located between 100°52′-114°33′E and 33°41′-41°16′N, and contains seven provinces and autonomous regions, i.e., Qinghai, Gansu, Ningxia, Inner Mongolia, Shaanxi, Shanxi, and Henan, with a total area of 64.62×10⁴ km2. The Loess Plateau suffers very serious soil erosion and water loss, with complex and diverse erosion types. Soil erosion and water loss make up an area of 39.08×10⁴ km2, which includes water and wind erosion areas of 33.41×10⁴ km2 and 5.67×10⁴ km2, respectively.
The Loess Plateau surface is primarily covered by loess deposits (50-200 m deep) distributed in a relatively continuous manner, with high terrain in the northwest and low terrain in the southeast. Based on natural conditions, such as topography and geomorphology, as well as soil erosion features, the plateau can be zoned into six areas, namely, plateau-gully area, hilly-gully area, river valley-plain area, soil-rocky mountainous area, windy-sandy area, soil-rocky hilly-forested area (hereafter hilly-forested area for short) (Figure 1). The climate is continental monsoon, with rainstorms in the hot summer and autumn, and high winds and sand storms during the cold, dry winter and spring. The multi-year average temperature is 9-12°C, and multi-year average annual precipitation ranges from 200 to 700 mm from the northwest to the southeast; rainfall concentrations generally from June to September, with rainstorm in domination. The centralized precipitation accounts for over 60% of the annual total. There are 48 tributaries, each with an area over 1000 km2, directly flowing into the Yellow River, with surface water in the whole region covering an area of 105.56×10⁸ m3. Vegetation can be divided into forest, forest-steppe, typical steppe, desert-steppe, and steppe-desert zones from the southeast to the northwest. The area is dominated by loessial soil, with a grain composition of fine sand and silt, a relatively uniform texture, and a loose, soft body with soil bulk density of 1.1-1.3 t/m3 and total porosity of 50%-60%. Due to serious soil erosion and water loss, the soil is of relatively poor quality.
Figure 1 Zoning map of the Loess Plateau
The Loess Plateau region incorporates 44 prefectures (cities) and 305 counties (banners) from seven provinces (autonomous regions). In 2011, the population density was 178.23 people•km-2 and the total population was 11517.52×104, including an agricultural population of 7547.37×104, accounting for 65.53% of the total population. The annual per capita net income for farmers is 3200 RMB yuan, and thus economic development is relatively low.

2.2 Data collection and analysis

The digital elevation model (DEM) dataset was provided by the Geospatial Data Cloud, Computer Network Information Center, Chinese Academy of Sciences (http://www.gscloud. cn), and was obtained by processing the data from ASTER GDEM (V1), with projection type UTM/WGS84 and a spatial resolution of 30 m.
The soil type map was provided by the Cold and Arid Regions Sciences Data Center at Lanzhou (http://westdc.westgis.ac.cn), and included the China region subset of the Harmonized World Soil Database (HWSD) (Gunther et al., 2008). The data were in grid format. The spatial resolution was 1 km, the geographic coordinate system was WGS84, and the soil classification system used was FAO-90.
The land use data were from the 1:100,000 Land Use Database of China 2010, which was obtained using the human-computer interaction quick interpretation method on the basis of images from Landsat TM and Chinese environmental mitigation HJ1 satellite. Assessments showed that the classification accuracy of Class I land use types was 94% and that of Class II was 91% (Liu et al., 2014). In this land use classification system, farmlands were divided into paddy field and dry farmland; in the Loess Plateau, dry farmlands were further divided into irrigated land, terraced field, dam farmland, and slope farmland. Data on the area of irrigated land were from agricultural statistical yearbooks of each county (NBS, PRC, 2012), and the terraced and dam farmland data were obtained from remote sensing and statistical investigation conducted by the Upper and Middle Yellow River Bureau, Yellow River Conservancy Commission (YRBMC, 2011).
The rainfall data were from the China Meteorological Data Sharing Service System (http://cdc.nmic.cn), and the 30 years of monthly precipitation data were collected from 108 state-level weather stations in and around the Loess Plateau.
Population data were obtained from the Population Statistics for Counties and Cities of the PRC (2011) published by the Administration Bureau for Public Order, Ministry of Public Security of the People’s Republic of China. The farmland data and grain yield per unit area were obtained from statistical yearbooks, literature analysis and field questionnaires.

2.3 Analytical method

2.3.1 Concept of soil erosion control degree
Soil erosion control degree is the ratio of minimum possible soil erosion modulus to actual soil erosion modulus (Gao et al., 2013), that is,
r = T0 / Ts (1)
where r is soil erosion control degree, dimensionless; T0 is the minimum possible soil erosion modulus, that is, the soil erosion modulus under capacity of soil and water conservation measures, t·km-2·a-1; Ts is the actual soil erosion modulus, t·km-2·a-1. The soil erosion control degree is within 0-1, reflecting the degree of proximity to the ideal governance state of soil and water conservation; the closer the r is to 1, the higher the governance degree, and the closer the r is to 0, the lower the governance degree, that is, it deviates farther from the ideal governance state.
2.3.2 Capacity of soil and water conservation measures in the Loess Plateau
Capacity of soil and water conservation measures is defined as the maximum quantity of suitable soil and water conservation measures containable in an area, and it reflects the governance potential of soil and water conservation in an area. The concept of the capacity of soil and water conservation measures reflects the principle of “adaptation to local condition” in governance of soil and water conservation. According to the site requirements of different soil and water conservation measures, all suitable distribution zones of each measure are found, and then the soil and water conservation measures are laid out; after the measures are laid out, all governance works have been completed theoretically for the area, with the soil erosion modulus controlled at a reasonable level, and the quantity of soil and water conservation measures in this case is called capacity of soil and water conservation measures. Priority sequence should be taken into account in laying out soil and water conservation measures; in the Loess Plateau, the priority sequence is generally as follows: terrace → forestland → grassland. When a site meets the requirements for layout of all of the above three measures in the same time, the priority sequence is terrace, followed by forestland, and finally grassland.
(1) Suitable areas for terrace in the Loess Plateau
The loess region has thick soil layer, and slope-to-terrace is the main governance measure for gentle slope areas. The suitable areas for terrace in the Loess Plateau set in this paper meet the following conditions: original hilly-gully area and plateau-gully area used as farmlands shall have a slope less than 15°, while soil-rocky mountainous area, windy-sandy area, river valley-plain area and hilly-forested area shall have a slope less than 5° due to thinner soil layer.
(2) Suitable areas for forestland in the Loess Plateau
The growth of trees in the forestlands is primarily restricted by rainfall condition, and some scholars pointed out that the suitable areas for forest in the Loess Plateau should have more than 400 mm of precipitation but some others thought that the precipitation threshold for the suitable areas for forest should be 450 mm (Jiang, 1997; Li et al., 2008). The main landscape is steppe in semi-arid areas and forest steppe in semi-humid areas. Therefore, it was believed through this study that semi-humid areas and humid areas are suitable distribution areas for forestland, and semi-arid areas and arid areas are suitable distribution areas for grassland. For the semi-arid and semi-humid boundary, the climatic regionalization proposed by Zheng et al. (2010) was directly used in this paper. Consequently, the suitable distribution areas for forestland include: the existing forestlands; soil-rocky mountainous area, forested area, windy-sandy area and river valley-plain area having slope farmlands with slope more than 5° located in semi-humid areas; and hilly-gully area and plateau-gully area having slope farmlands with slope more than 15° located in semi-humid areas.
(3) Suitable areas for grassland in the Loess Plateau
In addition to the terraces and forestlands in the above areas, grasslands are laid out in other areas, so the suitable areas for grassland include: the existing grasslands; soil-rocky mountainous area, hilly-forested area, windy-sandy area and river valley-plain area having slope farmlands with slope more than 5° located in semi-arid areas; hilly-gully area and plateau-gully area having slope farmlands with slope more than 15° located in semi-arid areas; and sandy lands.
The layout area of the soil and water conservation measures in the above cases is called capacity of soil and water conservation measures, and the soil erosion modulus calculated on this basis is defined as minimum possible soil erosion modulus. The slopes were extracted using the digital elevation model (DEM) and subdivided into four classes, i.e., 0-5°, 5°-15°, 15°-25°, and >25°. The capacity of soil and water conservation measures in the Loess Plateau was obtained through discriminant analysis using the criteria function, under the support of the spatial model of the ERDAS IMAGINE9.1 software and with the existing land use map and climate zoning map. The terraces are 1229.31×104 ha, the forestlands are 1248.72×104 ha, and the grasslands are 3219.16×104 ha, accounting for 19.03%, 19.33%, and 49.82% of the total area of the Loess Plateau, respectively.
2.3.3 Determination of soil erosion modulus using RUSLE
The soil erosion modulus was determined using the revised universal soil loss equation (RUSLE) supported by the ArcGIS software (Kenneth et al., 1997), and the expression is:
A = R · K · S · L · C · P(2)
where A is the average annual soil loss, t·km-2·a-1; R is the rainfall-runoff erosivity factor, MJ•mm•ha-1•h-1•a-1; K is the soil erodibility factor, t•ha•h•ha-1•MJ-1•mm-1; S is the slope steepness factor; L is the slope length factor; C is the cover-management factor; and P is the supporting-practice factor.
(1) Rainfall-runoff erosivity factor (R)
The empirical equation for rainfall erosivity with monthly precipitation, as proposed by Wischmeier et al. (1978), was used to calculate multi-year average rainfall erosivity:
where P and Pi are average annual and monthly precipitations, respectively, mm.
The multi-year average rainfall erosivity (R) value was calculated with Eq. (3) based on the monthly precipitation data collected in the study region; semivariance function simulation was conducted in GS+7.0 to find the optimal model. Kriging interpolation was carried out using the Gaussian model in the ArcGIS geostatistical module to obtain the rainfall erosivity factor of the whole Loess Plateau (Figure 2a).
(2) Soil erodibility factor (K)
Estimation of the soil erodibility (K) value was conducted with organic matter and particle composition of soil using the soil erosion-productivity impact calculator (EPIC) (Sharpley and Williams, 1990):
K = 0.1317*{0.2+0.3exp[-0.0256SAN(1-SIL/100)]}*[ SIL/(CLA+ SIL)]0.3*
{1.0-0.25C/[C+exp(3.72-2.95C)]}*{1.0-0.7SN1/[SN1+exp(-5.51+22.9SN1)]} (4)
where SAN is the sand fraction, %; SIL is the silt fraction, %; CLA is the clay fraction, %; C is the soil organic carbon content, %; and SN1 = 1-SAN/100. The soil erodibility K value of the whole study region was calculated according to the soil type map and attribute data of the Loess Plateau (Figure 2b).
(3) Slope steepness and slope length factor (LS)
The LS calculation was based on the following expressions of McCool et al. (1989) used in the RUSLE:
S = 10.8sin θ + 0.03 θ <9% (5)
S = 16.8 sin θ - 0.5 θ ≥9% (6)
L = (λ/22.1)m (7)
where λ is the horizontal projection length of the slope, m; m is the available length-slope exponent, and θ is the slope angle.
The LS factor values of the whole Loess Plateau were calculated using the LS factor calculation tool developed by Zhang et al. (2013), based on the 30 m DEM data of the Loess Plateau, with the whole Loess Plateau divided into eight sub-regions with the main rivers as boundaries (Figure 2c).
(4) Cover-management factor (C)
According to the research results from Zhang (2001, 2003) and Jiao et al. (2009) the C values of the main crops in the hilly-gully areas of the Loess Plateau are as follows: 0.28 for corn, 0.51 for beans, 0.47 for potatoes, and 0.53 for millet. The main crops in the gentle slope farmlands with slope less than 5° in the Loess Plateau are corn and wheat, whose C value is set as 0.25. The crops in the slope farmlands with slope more than 5° are dominated by beans, potatoes, and millet, and the C value is set as 0.40. The C value for paddy fields, water areas and building lands is set as 0, and that for unused lands is set as 1. For the forestlands and grasslands, the C values are taken from Table 1 depending on vegetation coverage. The C factor distribution map was obtained based on the land use type map of the Loess Plateau in 2010 (Figures 2d and 2e).
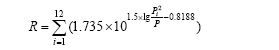
Table 1 C values at different vegetation coverage in the Loess Plateau
Vegetation coverage (%) 0-20 20-40 40-60 60-80 80-100
Forestland 0.25 0.12 0.06 0.02 0.004
Grassland 0.45 0.24 0.15 0.09 0.043
(5) Supporting-practice factor (P)
The soil layer is thick in most parts of the Loess Plateau, so terrace is the predominant slope governance measure. Based on the multi-site monitoring data acquired in the Loess Plateau, Ran et al. (2006) believed that rainfall of individual rain events with precipitation more than 100 mm and less than 200 mm can almost completely be retained by terraces without runoff generated. Terraces retain runoff to reduce the runoff scouring to slope surfaces and valleys, decreasing the soil erosion amount. The existing research efforts mostly focus on the “in situ” sediment reduction effect of terraces, that is, the sediment reduction amount of a plot after the slope is transformed into terraces. In addition, terraces have “ex situ” sediment reduction effect, which is primarily reflected in two aspects: one is that terraces can intercept the sediment-laden water flow from above, and the other is that the flow velocity of the slope runoff flowing through terraces will be lowered, thereby reducing the slope erosion amount below the terraces. Liu et al. (2014) thought that the sediment reduction effect of terraces has probably been underestimated for a long time due to the neglect of the “ex situ” sediment reduction effect of terraces. The spatial layout of terraces can also influence the sediment reduction benefit (Zhang et al., 2014), and terraces having the same area follow the law of “the upper part being better than the lower one” in respect of spatial layout. In other words, in respect of sediment reduction benefit, if terraces are laid out longitudinally in a river basin, they have better sediment reduction effect at the upstream than at the downstream; if terraces are laid out at one cross section, they have better sediment reduction effect at the upper area than at the lower area.
In the RUSLE, the Supporting-practice factor (P) is used to measure the influence of the soil and water conservation measures, including terraces, on the soil erosion. Research results show that (Wu et al., 2004; Liu et al., 2011), the sediment reduction benefit of the level terraces in the Loess Plateau could reach 88%, so the P value of the level terraces was taken as 0.12, and that of the other types of land was taken as 1 (Figure 2f). The existing land use data do not contain the spatial distribution information of terraces, but the area of terraces in all counties of the Loess Plateau can be obtained; therefore, some scholars (Xie, 2008) proposed to infer the factor of soil and water conservation measures (P) using the ratio of the area of terraces used to the total land area:
where St is the area of terrace, km2; S is the total area of land, km2; α is the sediment reduction benefit of terraces, taken as 0.12.
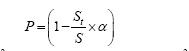
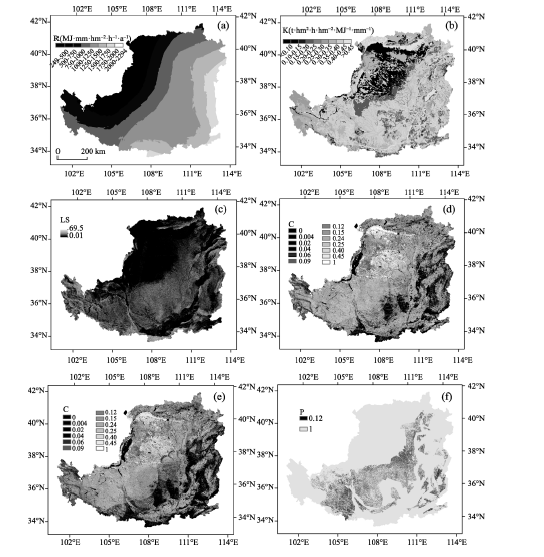
Figure 2 Various factor values from RUSLE for the Loess Plateau (a. rainfall erosivity factor (R); b. soil erodibility factor (K); c. slope length and steepness factor (LS); d. cover-management factor under actual conditions (C); e. cover-management factor under capacity of soil and water conservation measures (C); f. supporting-practice factor (P))

3 Results and analysis

3.1 Actual soil erosion modulus and minimum possible soil erosion modulus in the Loess Plateau

The calculated actual soil erosion modulus and minimum possible soil erosion modulus in the Loess Plateau are shown in Figure 3. In respect of spatial distribution, it can be seen that the areas with maximum actual soil erosion modulus and minimum possible soil erosion modulus are concentrated in the hilly-gully area and plateau-gully area in the hinterland of the Loess Plateau.
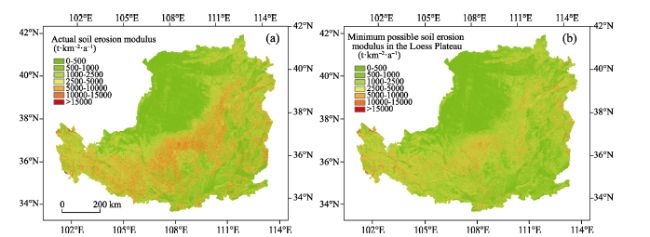
Figure 3 Actual soil erosion modulus and minimum possible soil erosion modulus in the Loess Plateau
Statistics was made for the average actual soil erosion modulus and minimum possible soil erosion modulus in various zoned areas using the Zonal Statistics tool in the ArcGIS (Table 2). For the whole Loess Plateau, the average actual soil erosion modulus is 3355 t·km-2·a-1, and the average minimum possible soil erosion modulus is 1921 t·km-2·a-1, decreasing by 42.74%. For different zoned areas, the plateau-gully area has the maximum decrease magnitude, which reaches 51.80%, whereas the river valley-plain area has the minimum decrease magnitude, which is 28.98%.
Table 2 Actual soil erosion modulus and minimum possible soil erosion modulus in all zones
Zoning Actual soil erosion modulus (t·km-2·a-1) Minimum possible soil erosion modulus (t·km-2·a-1) Decreasing
range (%)
River valley-plain area 1377 978 28.98
Windy-sandy area 465 311 33.12
Forested area 3436 1863 45.78
Hilly-gully area 4997 2477 50.43
Plateau-gully area 5417 2611 51.80
Soil-rocky mountainous area 3824 2650 30.70
Whole Loess Plateau 3355 1921 42.74
Soil loss tolerance refers to the maximum soil erosion intensity allowed for maintaining soil fertility and land productivity in a long period (Li et al., 2005), and it is a criterion for judging whether soil and water loss occurs in an area; the soil loss tolerance currently used for the Loess Plateau is 1000 t·km-2·a-1 (Zhang et al., 2011). Areas with soil erosion modulus less than 1000 t·km-2·a-1 are slight erosion areas, where no soil and water conservation measures need to be laid out in general; and areas with soil erosion modulus more than 1000 t·km-2·a-1 are areas with light and more severe erosion, where soil and water conservation measures are generally needed. It can be seen from the statistics in Table 2 that, under the capacity of soil and water conservation measures, the minimum possible soil erosion modulus in the Loess Plateau is still greater than the soil loss tolerance in the region. The authors made statistics for the percentages of the slight erosion areas and the light and more severe erosion areas under the actual condition and the capacity of soil and water conservation measures respectively (Table 3). Under the actual condition, the percentages of the slight erosion areas and the light and more severe erosion areas in the Loess Plateau are 50.48% and 49.52%, respectively; under the capacity of soil and water conservation measures, the percentage of the slight erosion areas increases to 57.71%, while the percentage of the light and more severe erosion areas decreases to 42.29% accordingly.
Table 3 Ratios of different erosion types under actual conditions and under capacity of soil and water conservation measures
Zoning Under the actual condition (%) Under capacity of soil and water
conservation measures (%)
Slight erosion Light or above Slight erosion Light or above
River valley-plain area 72.89 27.11 75.90 24.10
Windy-sandy area 87.27 12.73 90.38 9.62
Forested area 45.16 54.84 52.77 47.23
Hilly-gully area 31.66 68.34 43.57 56.43
Plateau-gully area 37.38 62.62 46.58 53.42
Soil-rocky mountainous area 40.81 59.19 46.94 53.06
Loess Plateau 50.48 49.52 57.71 42.29

3.2 Soil erosion control degree of the Loess Plateau

The soil erosion control degree of the whole Loess Plateau was calculated according to the concept of soil erosion control degree (Figure 4), and the average soil erosion control degree of the Loess Plateau is 0.57, belonging to moderate governance level. The areas with high governance degree are the river valley-plain area, soil-rocky mountainous area, and windy-sandy area, with soil erosion control degrees of 0.71, 0.69, and 0.67, respectively. The soil erosion control degrees of the hilly-forested area and hilly-gully area are 0.54 and 0.50, respectively, belonging to moderate governance level. Nevertheless, the plateau-gully area has relatively low governance degree, with soil erosion control degree of 0.48 (Figure 4).
Figure 4 Soil erosion control degree in the Loess Plateau

3.3 Land use changes under actual condition and capacity of soil and water conservation measures

Statistics was made for the land use structure in the whole Loess Plateau under the actual condition and the capacity of soil and water conservation measures, respectively (Table 4). Under the actual condition, the percentages of terrace, slope farmland, forestland, and grassland in the Loess Plateau are 4.36%, 22.35%, 14.99%, and 41.75%, respectively. Nevertheless, under the capacity of soil and water conservation measures, the percentages of terraces, slope farmland, forestland, and grassland are 19.03%, 0.00%, 19.33%, and 49.82%, respectively. In the whole Loess Plateau, the percentage of the terrace area is increased from 4.36% under the actual condition to 19.03% under the capacity of soil and water conservation measures, and the forest and grass coverage is increased from 56.74% to 69.15%.
Table 4 Land use structure under actual condition and under capacity of soil and water conservation measures in the Loess Plateau
Land use type Under the actual condition Under capacity of soil and water conservation measures
Area (104 ha) Percentage (%) Area (104 ha) Percentage (%)
Paddy field 58.75 0.91 58.74 0.91
Irrigated land 288.72 4.47 288.72 4.47
Dam farmland 28.63 0.44 28.63 0.44
Terrace 281.85 4.36 1229.31 19.03
Slope farmland 1443.91 22.35 0.00 0.00
Forestland 968.28 14.99 1248.72 19.33
Grassland 2697.69 41.75 3219.16 49.82
Others 693.63 10.73 388.18 6.01

3.4 Grain yield change under capacity of soil and water conservation measures

According to the land use interpretation results and the terrace and check dam survey data (YRBMC, 2011), there were 58.75×10⁴ ha of paddy field, 288.72×10⁴ ha of irrigated land, 28.63×10⁴ ha of dam farmland, 281.85×10⁴ ha of terraces, and 1443.91×104 ha of slope farmland in total in the Loess Plateau in 2010. The average per unit yields were 12,000 kg·ha-1 for paddy field, 6500 kg·ha-1 for irrigated land, 4500 kg·ha-1 for dam farmland, 2100 kg·ha-1 for terraces, and 1050 kg·ha-1 for slope farmland, respectively. Calculation based on this shows that the total grain output in the Loess Plateau under the actual condition is 4818.51×104 t, and that the slope farmland accounts for 2/3 of total area of farmlands but they contribute only 1/3 to the grain yield. The total population in the Loess Plateau was 11,517.52×104 in 2010, so the per capita grain available under the actual condition was 418 kg·a-1. Under the capacity of soil and water conservation measures, the areas of paddy field, irrigated land and dam farmland did not change, but the area of terraces increased to 1229.31×104 ha and that of slope farmland decreased to 0; the calculated total grain yield in the Loess Plateau increased to 5291.95×104 t, and the per capita grain available could increase to 459 kg·a-1.

3.5 Influence of check dams on erosion-induced sediment yield

Check dams are main gully governance works in the Loess Plateau, and the suitable scale of check dams under the capacity of soil and water conservation measures was not taken into account. The reason is that check dams have less influence on erosion but much influence on sediment yield. The influence of a check dam on soil erosion is primarily reflected in two aspects: one is shortening the slope length to “submerge” the bared slope areas with great soil erosion modulus in the lower part of the river basin, and to reduce the soil erosion amount in the controlled areas. The other is retaining water and sediment to decrease the flow rate of gully runoff and thus to reduce scouring downstream check dams. The
influence of the siltation by a check dam on the slope soil erosion can be evaluated using the established typical slope in hilly-gully area of the Loess Plateau and the RUSLE (Figure 5).
According to the calculation results in section 2.3.2, the rainfall-runoff erosivity (R) of the Loess Plateau was taken as 1265 MJ•mm•ha-1•h-1•a-1. The soil erodibility (K) was taken as 0.040 t•ha•h•ha-1•MJ-1•mm-1. The LS factor was calculated with Eqs. (5), (6) and (7). The C values for dam farmland, terraces, slope farmland, and grassland were taken as 0.25, 0.40, 0.40, and 0.09, respectively. The factor of soil and water conservation measures (P) for terraces was taken as 0.12.
Under the typical slope conditions shown in Figure 5, if there is no dam farmland (Figure 5a), the soil erosion modulus is 5617 t·km-2·a-1 in the area above the hillock borderline, below which the soil erosion modulus is 8528 t·km-2·a-1, and the average soil erosion modulus of the slope is 6864 t·km-2·a-1. If there is a dam farmland (Figure 5b), and it is assumed that the siltation thickness in the dam farmland is 4.2 m, then the area of the dam farmland accounts for 4.76% of the total area, thus in the area above the hillock borderline, the soil erosion modulus does not change, still being 5617 t·km-2·a-1, but below the hillock borderline, it decreases to 7153 t·km-2·a-1, and the average soil erosion modulus of the slope decreases to 6275 t·km-2·a-1. Compared with the soil erosion modulus in the case without dam farmland, the soil erosion modulus has a decrease magnitude of 8.58%, which is relatively low.
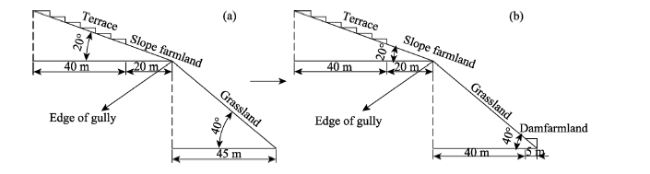
Figure 5 Effect of deposition of check dams on slope soil erosion (a. without dam farmland, b. with dam farmland)
The sediment delivery ratio (SDR) can reflect the influence of soil and water conservation measures, including check dams, on sediment transport process. In natural condition, the SDR in loess hilly-gully areas is generally close to 1. The SDRs in typical river basins were calculated, based on the collected siltation data of key dams in the typical river basins in the middle reaches of the Yellow River, as well as the configuration ratios and control area ratios of the key dams, medium-sized dams and small-sized dams (Table 5). The results show that, the SDRs in the typical rivers in the middle reaches of the Yellow River decrease to about 0.62.
Table 5 Sediment delivery rate in the major rivers at the middle reaches of the Yellow River
River (hydrometric station) Sediment load (104 t) Deposition (104 t) Erosion (104 t) SDR
Tuwei river (Gaojiachuan) 1713.51 271.09 1984.60 0.70
Dali river (Suide) 2174.56 1119.47 3294.03 0.56
Jialu river (Shenjiawan) 875.37 223.42 1098.79 0.64
Chabagou river (Caoping) 71.75 131.40 203.15 0.33
Wuding river (Baijiachuan) 4930.95 5555.41 10486.36 0.44
Gushanchuan river (Gaoshiya) 1208.44 298.25 1506.70 0.59
Huangfuchuan river (Huangfu) 3203.57 193.59 3397.16 0.87
Kuye (Wenjiachuan) 6779.99 274.16 7054.15 0.82

4 Discussion and conclusions

4.1 Discussion

Compared with soil and water loss governance degree, soil erosion control degree can better reflect the actual governance level of a river basin, and is applicable to slope scale, river basin scale and region scale. On the slope scale, the change in soil erosion amount was simulated under different slope governance conditions by establishing a theoretical model for slopes (Gao et al., 2012), thereby the slope governance approach of the minimum possible soil erosion modulus was determined, and with the existing slope governance being taken into account, the slope governance degree can be determined. On the small catchment scale, finer land use classification results can be obtained. For example, QuickBird images can be used to accurately identify the distribution of terraces and slope farmlands (Li et al., 2015), and even to obtain the changes of terrain caused by soil and water conservation measures, which may lead to the change in LS factor (Gao et al., 2013). In addition, on the slope and small catchment scales, it is even simpler and more accurate to determine the capacity of soil and water conservation measures. Therefore, the capacity of soil and water conservation measures can be used to rapidly evaluate the governance degrees of slopes and small catchments. On the river basin and region scales, the key to calculating soil erosion control degree is to reasonably determine the capacity of soil and water conservation measures. For the whole Loess Plateau, research efforts on the suitability of forestland are currently relatively weak, so scientifically identifying suitable areas for forestland can improve the calculation accuracy of soil erosion control degree.
Soil erosion control degree is based on the concept of soil erosion modulus, so it is very important to accurately calculate soil erosion modulus. There are many methods for determining soil erosion modulus, e.g., use of measured runoff sediment data, rainfall simulation, field survey, radioactive isotope, and mathematical model. The RUSLE was used for calculating soil erosion modulus in this paper; although the limitation to application of the RUSLE in the Loess Plateau was corrected to the maximum extent possible, the calculated erosion amount still has some deviation due to weak research efforts on the C value in China. Moreover, the RUSLE can only be used to calculate water erosion modulus, but some parts of the Loess Plateau belong to wind erosion areas, and there is currently lack of an effective calculation model for complex soil erosion modulus for wind erosion and water erosion, so the change in wind erosion modulus was not taken into account in this study, resulting in too small soil erosion modulus calculated in windy-sandy areas.

4.2 Conclusions

The average soil erosion modulus under actual condition in the whole Loess Plateau is 3355 t·km-2·a-1, the average minimum possible soil erosion modulus is 1921 t·km-2·a-1, and the soil erosion control degree is 0.57, belonging to moderate level. In respect of zoned areas, the areas with high governance degree are the river valley-plain area, soil-rocky mountainous area, and windy-sandy area, whereas the hilly-forest areas, hilly-gully area, and plateau-gully area have lower governance degrees. In respect of river basins, the Dahei River, the Huangfuchuan River, the Qingshui River, the Kuye River and the Pianguang River basins have higher soil erosion control degrees, whereas the Qingjian River, the Wuding River, the Jialu River and the Yanhe River basins have lower soil erosion control degrees.
Comparison between the actual condition and the capacity of soil and water conservation measures shows that the percentage of slight erosion areas in the whole Loess Plateau is increased from 50.48% under the actual condition to 57.71% under the capacity of soil and water conservation measures. The forest and grass coverage is increased from 56.74% under the actual condition to 69.15% under the capacity of soil and water conservation measures. The per capita grain available is increased from 418 kg·a-1 under the actual condition to 459 kg·a-1 under the capacity of soil and water conservation measures.

The authors have declared that no competing interests exist.

1
Angulo-Martínez M, Beguería S, 2009. Estimating rainfall erosivity from daily precipitation records: A comparison among methods using data from the Ebro Basin (NE Spain).Journal of Hydrology, 379(1/2): 111-121.

2
Bullock A, King B, 2011. Evaluating China’s slope land conversion program as sustainable management in Tianquan and Wuqi counties.Journal of Environmental Management, 92: 1916-1922.Increased soil erosion on sloped land has become a significant environmental concern in China that has been attributed to human activities such as deforestation, over-cultivation, and over-grazing of livestock. In order to reduce soil erosion on sloped lands, the Chinese government has responded by implementing large-scale, ecological rehabilitation programs, including the "Grain for Green" reforestation project. This program involves financial incentives to transition farmers into other economic activities with the goal of reducing ecological pressures and degradation. Because of the scope and potential impacts from these programs, detailed research is needed to understand their social and ecological effects. This paper reports on research conducted in Tianquan County, Sichuan Province, and Wuqi County, Shaanxi Province, that evaluates the effects of the program upon local economies and household livelihood systems. The paper argues that the successful conversion of farmland under "Grain for Green" depends upon local government involvement, local economic development, and funding for local projects. Without economic development within rural economies, we conclude that farmers will remain dependent upon continued subsidy assistance to meet the policy's ambitious environmental restrictions, thereby undermining the program's long-term sustainability. (C) 2011 Elsevier Ltd. All rights reserved.

DOI

3
Fu B J, Liu Y, Lu Y Het al., 2011. Assessing the soil erosion control service of ecosystems change in the Loess Plateau of China.Ecological Complexity, 8: 284-293.lt;h2 class="secHeading" id="section_abstract">Abstract</h2><p id="spar0010">Soil erosion in terrestrial ecosystems, as an important global environmental problem, significantly impacts on environmental quality and social economy. By protecting soil from wind and water erosion, terrestrial ecosystems supply human beings with soil erosion control service, one of the fundamental ecosystem services that ensure human welfare. The Loess Plateau was one of the regions in the world that suffered from severe soil erosion. In the past decades, restoration projects were implemented to improve soil erosion control in the region. The Grain-to-Green project, converting slope croplands into forest or grasslands, launched in 1999 was the most massive one. It is needed to assess the change of soil erosion control service brought about by the project. This study evaluated the land cover changes from 2000 to 2008 by satellite image interpretation. Universal Soil Loss Equation (USLE) was employed for the soil erosion control assessment for the same period with localized parameters. Soil retention calculated as potential soil erosion (erosion without vegetation cover) minus actual soil erosion was applied as indicator for soil erosion control service. The results indicate that ecosystem soil erosion control service has been improved from 2000 to 2008 as a result of vegetation restoration. Average soil retention rate (the ratio of soil retention to potential soil loss in percentage) was up to 63.3% during 2000&ndash;2008. Soil loss rate in 34% of the entire plateau decreased, 48% unchanged and 18% slightly increased. Areas suffering from intense erosion shrank and light erosion areas expanded. Zones with slope gradient of 8&deg;&ndash;35&deg; were the main contribution area of soil loss. On average, these zones produced 82% of the total soil loss with 45.5% of the total area in the Loess Plateau. Correspondingly, soil erosion control capacity was significantly improved in these zones. Soil loss rate decreased from 5000&#xA0;t&#xA0;km<sup>&minus;2</sup>&#xA0;yr<sup>&minus;1</sup> to 3600&#xA0;t&#xA0;km<sup>&minus;2</sup>&#xA0;yr<sup>&minus;1</sup> 6900&#xA0;t&#xA0;km<sup>&minus;2</sup>&#xA0;yr<sup>&minus;1</sup> to 4700&#xA0;t&#xA0;km<sup>&minus;2</sup>&#xA0;yr<sup>&minus;1</sup> and 8500&#xA0;t&#xA0;km<sup>&minus;2</sup>&#xA0;yr<sup>&minus;1</sup> to 5500&#xA0;t&#xA0;km<sup>&minus;2</sup>&#xA0;yr<sup>&minus;1</sup> in the zones with slope gradient of 8&deg;&ndash;15&deg; 15&deg;&ndash;25&deg; and 25&deg;&ndash;35&deg; respectively. However, the mean soil erosion rate in areas with slope gradient over 8&deg; was still larger than 3600&#xA0;t&#xA0;km<sup>&minus;2</sup>&#xA0;yr<sup>&minus;1</sup> which is far beyond the tolerable erosion rate of 1000&#xA0;t&#xA0;km<sup>&minus;2</sup>&#xA0;yr<sup>&minus;1</sup>. Thus, soil erosion is still one of the top environmental problems that need more ecological restoration efforts.</p><h4 id="secGabs_N3ac39a50N3ab95ae8">Highlights</h4><p>? The soil erosion control service of regional ecosystems was evaluated based on land cover change and USLE modeling. ? Results indicated that soil erosion control service has been greatly enhanced through vegetation restoration in the Loess Plateau region. ? The spatiotemporal variations of the soil erosion control service were determined, which may be crucial for regional ecological restoration.</p>

DOI

4
Dotterweich M, 2013. The history of human-induced soil erosion: Geomorphic legacies, early descriptions and research, and the development of soil conservation: A global synopsis.Geomorphology, 201: 1-34.

5
Gao H D, Li Z B, Li Pet al., 2012. Quantitative study on influences of terraced field construction and check-dam siltation on soil erosion.Journal of Geographical Sciences, 22(5): 946-960.Abstract<br/><p class="a-plus-plus">To study the influences of terraced field construction and check-dam siltation on soil erosion of a watershed, we built a simplified watershed model for the Loess Plateau hilly-gully region including terraced fields, slope farmlands, steep-slope grasslands, and dam farmlands, and defined three states of watershed (i.e., pioneer, intermediate, and climax stages, respectively). Then, the watershed soil erosion moduli at various stages were studied by using a revised universal soil loss equation. Our results show that the pioneer and climax stages are the extreme states of watershed soil-and-water conservation and control; in the pioneer stage, the soil erosion modulus was 299.56 t·ha<sup class="a-plus-plus">−1</sup>·a<sup class="a-plus-plus">−1</sup> above the edge of gully, 136.64 t·ha<sup class="a-plus-plus">−1</sup>·a<sup class="a-plus-plus">−1</sup> below the edge of gully, and 229.74 t·ha<sup class="a-plus-plus">−1</sup>·a<sup class="a-plus-plus">−1</sup> on average; in the climax stage, the soil erosion modulus was 39.10 t·ha<sup class="a-plus-plus">−1</sup>·a<sup class="a-plus-plus">−1</sup> above the edge of gully, 1.10 t·ha<sup class="a-plus-plus">−1</sup>·a<sup class="a-plus-plus">−1</sup> below the edge of gully, and 22.81 t·ha<sup class="a-plus-plus">−1</sup>·a<sup class="a-plus-plus">−1</sup> on average; in the intermediate stage, the soil erosion modulus above the edge of gully exhibited an exponential decline along with the increase in terraced field area percentage, while the soil erosion modulus below the edge of gully exhibited a linear decline along with the increase in siltation height.</p><br/>

DOI

6
Gao H D, Li Z B, Li Pet al., 2013. Concept and calculation methods of erosion control degree: A case study of the Wangmaogou watershed.Science of Soil and Water Conservation, 11(1): 17-24. (in Chinese)In this paper, the erosion control degree was defined as the ratio of the minimum possible soil erosion modulus and actual soil erosion modulus. The minimum possible soil erosion modulus was 2573t/(km2&middot;a)) under soil and water conservation measures in Wangmaogou Watershed. Based on the land use map in 2004, the actual soil erosion modulus of Wangmaogou Watershed was 7413t/(km2&middot;a). According to the definition of the erosion control degree, the erosion control degree of Wangmaogou Watershed was at a lower level of 0.35, due to existed sloping farmland and less forestry area. Therefore, we suggested that erosion control degree should be as the evaluation indicator for the status of soil and water conservation.

7
Gunther F, Nachtergaele Freddy N, Sylvia Pet al., 2008. Global Agro-ecological Zones Assessment for Agriculture (GAEZ 2008). IIASA, Laxenburg, Austria and FAO, Rome, Italy.

8
Jiang D S, 1997. Soil Erosion and Control Model in the Loess Plateau. Beijing: China Water & Power Press, 106-120. (in Chinese)

9
Jiao J Y, Wang Z J, Zhao G Jet al., 2014. Changes in sediment discharge in a sediment-rich region of the Yellow River from 1955 to 2010: implications for further soil erosion control. Journal of Arid Land, 6(5): 540-549.The well-documented decrease in the discharge of sediment into the Yellow River has attracted con-siderable attention in recent years. The present study analyzed the spatial and temporal variation of sediment yield based on data from 46 hydrological stations in the sediment-rich region of the Yellow River from 1955 to 2010. The results showed that since 1970 sediment yield in the region has clearly decreased at different rates in the 45 sub-areas controlled by hydrological stations. The decrease in sediment yield was closely related to the intensity and extent of soil erosion control measures and rainstorms that occurred in different periods and sub-areas. The average sediment delivery modulus (SDM) in the study area decreased from 7,767.4 t/(km<sup>2</sup>&bull;a) in 1951&ndash;1969 to 980.5 t/(km<sup>2</sup>&bull;a) in 2000&ndash;2010. Our study suggested that 65.5% of the study area with the SDM below 1,000 t/(km<sup>2</sup>&bull;a) is still necessary to control soil deterioration caused by erosion, and soil erosion control measures should be further strengthened in the areas with the SDM above 1,000 t/(km<sup>2</sup>&bull;a).

DOI

10
Jiao J Y, Zou H Y, Jia Y Fet al., 2009. Research progress on the effects of soil erosion on vegetation.Acta Ecologica Sinica, 29: 85-91.The relationship between vegetation and soil erosion deserves attention due to its scientific importance and practical applications. A great deal of information is available about the mechanisms and benefits of vegetation in the control of soil erosion, but the effects of soil erosion on vegetation development and succession is poorly documented. Research shows that soil erosion is the most important driving force for the degradation of upland and mountain ecosystems. Soil erosion interferes with the process of plant community development and vegetation succession, commencing with seed formation and impacting throughout the whole growth phase and affecting seed availability, dispersal, germination and establishment, plant community structure and spatial distribution. There have been almost no studies on the effects of soil erosion on seed development and availability, of surface flows on seed movement and redistribution, and their influences on soil seed bank and on vegetation establishment and distribution. However, these effects may be the main cause of low vegetation cover in regions of high soil erosion activity and these issues need to be investigated. Moreover, soil erosion is not only a negative influence on vegetation succession and restoration, but also a driving force of plant adaptation and evolution. Consequently, we need to study the effects of soil erosion on ecological processes and on development and regulation of vegetation succession from the points of view of pedology and vegetation, plant and seed ecology, and to establish an integrated theory and technology for deriving practical solutions to soil erosion problems.

DOI

11
Li L, Zhou Z H, Liu G C, 2005. The present situation and some thoughts of soil loss tolerance study.Advances in Earth Science, 20(10): 1127-1134. (in Chinese)<p>As the criterion of judging non-erosion and erosion area, the value of soil loss tolerance (<em>T-</em>value) must be determined scientifically and rationally. To assign a <em>T</em>-value soil formation rate, relationship between soil loss and productivity and gully prevention must be considered. Current methods of evaluating the soil loss tolerance mainly include: ①soil profile thickness; ②the geochemistry cycle theory; ③nutrient balance; and ④ according to erosion model. The international existing <em>T-</em>value standards are mainly established according to the soil profile thickness and soil formation rate. The history and the main content of soil loss tolerance study are reviewed in this paper,and the method of using Barth equation and on the basis of the risk assessment are also introduced. In face of the existing problems in the evaluation method and conclusion of <em>T-</em>value research, future&nbsp; <em>T-</em>value study should be concentrated on the characteristic of soil formation(natural attribute), the durative of rational productivity level(social attribute) and the soil and water environment safety (social and natural attribute)is raised.</p>

12
Li R, Yang W Z, Li B C, 2008. Research Progress and Prospect of the Chinese Loess Plateau. Beijing: Science Press, 183-211. (in Chinese)

13
Li Z, Zhang Y, Zhu Q Ket al., 2015. Assessment of bank gully development and vegetation coverage on the Chinese Loess Plateau.Geomorphology, 228(1): 462-469.Gully erosion is a serious environmental problem and the primary source of sediment loss on the Loess Plateau of China, yet previous research focusing on bank gullies is limited. An assessment of bank gully development is needed as a basis for predicting erosion rates under the effects of vegetation cover and land use change. To estimate bank gully retreat rates under different land uses, assess the factors leading to bank gully development and model gully area growth rate at the catchment scale, 30 catchments with an average area of 39.0ha were selected in the southeastern part of the Loess Plateau. QuickBird images (0.61m resolution) obtained in 2003 and 2010 were interpreted to delineate bank gully features, and a 5m resolution digital elevation model was used to extract topographic factors. The results showed that from 2003 to 2010, the maximum retreat rates of bank gully heads in the 30 investigated catchments ranged between 0.23 and 1.08myr 611 , with an average of 0.51myr 611 . The ratio of bank gully growth area to valley area changed from 0.49 to 9.45%, depending on land use, with average increases of 3.94, 4.00 and 2.09% for the three land use types identified, i.e. mixed use, grassland and forestland, respectively. Correlation analysis indicated that the effects of topographic factors on bank gullies decreased as vegetation coverage increased in upslope drainage areas and that vegetation coverage exceeding 60% in upslope drainage areas can significantly control bank gully development. A model was built to predict the bank gully area growth rate ( R a , m 2 yr 611 ) with upslope drainage area ( A i , m 2 ), local slope gradient ( S , mm 611 ) and the proportion of the area with vegetation coverage below 60% in upslope drainage areas ( Φ 0.6 ) at the catchment scale. The regression equation is in the form R a =0.1540[( Φ 0.6 A i ) 0.24 S ] 3.2588 . Compared with previous studies, vegetation is a factor in this model, which would be helpful for assessing the influence of vegetation cover on bank gully development.

DOI

14
Liu J Y, Kuang W H, Zhang Z Xet al., 2014. Spatiotemporal characteristics, patterns, and causes of land-use changes in China since the late 1980s.Journal of Geographical Sciences, 24(2): 195-210.lt;p>Land-use/land-cover changes (LUCCs) have links to both human and nature interactions. China's Land-Use/cover Datasets (CLUDs) were updated regularly at 5-year intervals from the late 1980s to 2010,with standard procedures based on Landsat TM\ETM+ images. A land-use dynamic regionalization method was proposed to analyze major land-use conversions. The spatiotemporal characteristics,differences,and causes of land-use changes at a national scale were then examined. The main findings are summarized as follows. Land-use changes (LUCs) across China indicated a significant variation in spatial and temporal characteristics in the last 20 years (1990-2010). The area of cropland change decreased in the south and increased in the north,but the total area remained almost unchanged. The reclaimed cropland was shifted from the northeast to the northwest. The built-up lands expanded rapidly,were mainly distributed in the east,and gradually spread out to central and western China. Woodland decreased first,and then increased,but desert area was the opposite. Grassland continued decreasing. Different spatial patterns of LUC in China were found between the late 20th century and the early 21st century. The original 13 LUC zones were replaced by 15 units with changes of boundaries in some zones. The main spatial characteristics of these changes included (1) an accelerated expansion of built-up land in the Huang-Huai-Hai region,the southeastern coastal areas,the midstream area of the Yangtze River,and the Sichuan Basin;(2) shifted land reclamation in the north from northeast China and eastern Inner Mongolia to the oasis agricultural areas in northwest China;(3) continuous transformation from rain-fed farmlands in northeast China to paddy fields;and (4) effectiveness of the &quot;Grain for Green&quot; project in the southern agricultural-pastoral ecotones of Inner Mongolia,the Loess Plateau,and southwestern mountainous areas. In the last two decades,although climate change in the north affected the change in cropland,policy regulation and economic driving forces were still the primary causes of LUC across China. During the first decade of the 21st century,the anthropogenic factors that drove variations in land-use patterns have shifted the emphasis from one-way land development to both development and conservation.The &quot;dynamic regionalization method&quot; was used to analyze changes in the spatial patterns of zoning boundaries,the internal characteristics of zones,and the growth and decrease of units. The results revealed &quot;the pattern of the change process,&quot; namely the process of LUC and regional differences in characteristics at different stages. The growth and decrease of zones during this dynamic LUC zoning,variations in unit boundaries,and the characteristics of change intensities between the former and latter decades were examined. The patterns of alternative transformation between the &quot;pattern&quot; and &quot;process&quot; of land use and the causes for changes in different types and different regions of land use were explored.</p>

DOI

15
Liu S L, Wang C, Zhang X Let al., 2011. Soil and water conservation effect of different terrace configurations in land consolidation project.Journal of Soil and Water Conservation, 25(4): 59-68. (in Chinese)In this study,based on typical land consolidation project conditions,WEPP model was used to simulate the effects of different terrace configuration on soil and water conservation under different slopes and precipitation intensities.By the combination of different slopes,rainfalls and the terrace numbers,30 scenarios were set to model the soil loss and sediment yield.The results showed that WEPP model could quantitatively describe the loss of soil conditions on the slope with the mechanism of physical processes.Overall,terrace construction had obvious influence on soil loss and sediment yield.For the soil loss,the terrace regulated the spatial distribution on the slope and reduced the loss amount.For the sediment yield,the terrace construction effectively blocked sediment yield.The interception rate rose from 20% to 84% with the increase of slope from 5掳 to 25掳.On the whole,the more the number of terraces,the lower the soil loss.But sediment yield changed little with terrace number.Compared with different slope and rainfall intensity,slope and rainfall intensity were still the decisive factors in soil and water conservation.

16
Liu X Y, Wang F G, Yang S Tet al., 2014. Sediment reduction effect of level terrace in the hilly-gully region in the Loess Plateau.Journal of Hydraulic Engineering, 45(7): 793-780. (in Chinese)The sediment reduction effect of level terrace in the Loess Plateau is likely to have been underestimated before. By analyzing the water and sediment regulation mechanism of the terraces in the basin,it is realized that the level terrace can not only significantly reduce the sediment yield from itself,but also intercept the sediment yield from the upper area,and can achieve the valley sediment reduction by reducing runoff flowing from slope to valley. The sediment reduction potential of level terrace with ridges in watershed is up to 65 %. Based on the measured data of the third and the fifth sub-district of the loess hilly region in different periods,the sediment reduction effect of different scale level terraces is analyzed under average annual rainfall condition. The concept of terrace ratio is introduced to build the relationship between terrace ratio and sediment reduction magnitude,which can be used to quantitatively evaluate sediment reduction effect of level terrace on a large spatial scale,When the terrace ratio is less than 30 %,the magnitude of sediment reduction is basically proportional to the terrace ratio;and when the terrace ratio is larger than 35 %,the sediment reduction effect is basically stable at about 90 %. The flood sediment concentration reduction effect of level terrace is not very obvious;this characteristic can be used to measure the water-reducing effect of level terrace in the river basin.

DOI

17
McCool D K, Foster G R, Mutchler C Ket al., 1989. Revised slope length factor for the universal soil loss equation.Transactions of the American Society of Agricultural Engineers, 32: 1571-1576.ABSTRACT

DOI

18
Ministry of Public Security Authority of the People’s Republic of China (NBS, PRC), 2013. The National Counties Population Statistics Yearbook 2011. Beijing: Qunzhong Press, 121-219. (in Chinese)

19
Ministry of Water Resources of the People’s Republic of China (MWR, PRC), Chinese Academy of Sciences, Chinese Academy of Engineering, 2010. Water Loss and Soil Erosion and Ecological Security of China: The Loess Plateau. Beijing: Science Press, 28-59. (in Chinese)

20
National Bureau of Statistics of the People’s Republic of China, 2012. China County Statistical Yearbook 2012. Beijing: China Statistics Press, 10-426. (in Chinese)

21
Ran D C, 2006. Water and sediment variation and ecological protection measures in the middle reach of the Yellow River.Resources Science, 28(1): 93-100. (in Chinese)The paper discussed existent rate and area of soil and water conservation measures and calculation methods for reducing flood and sediment through slope measures and warping dam as well as their applications in HeLong area, Jinghe, Beiluohe, and Weihe watershed in the middle reach of the Yellow River. Research results of soil and water conservation method showed that the mean flood and sediment reduced 0.5456 billion m3 and 0.2238 billion tons in Helong area, Jinghe, Beiluohe, Weihe watershed respectively from 1970 to 1996, which accounted for 4.6% and 22.9% of the total amount in the corresponding watershed. The reduced flood and sediment from soil and water conservation measures increased chronologically; the sediment and scouring water into the lower reach reduced 0.157 billion tons and 4.5 billion m<sup>3</sup> respectively. The reduced flood and sediment from warping dam accounted for 59.3% and 64.7% of the total flood and sediment reduction from soil and water conservation measures respectively. The water and sediment reduction from warping dams decreased chronologically and shown a periodic and unsustainable trend. The ecological protection policy was discussed in the middle reach of the Yellow River based on ecological construction of soil and water conservation, the relationship between engineering measures, ecological measures and cultivation measures, forest and grass measures and ecological protection.

22
Renard K G, Foster G R, Gleen W et al., 1997. Predicting soil erosion by water: A guide to conservation planning with the revised universal soil loss equation (RUSLE). In: U.S. Department of Agriculture Agricultural Handbook No. 703. US Department of Agriculture, Washington, DC.

23
Su C L, Liang Y, Li D Cet al., 2011. Concept and evaluation methodology of watershed management and recovery degree in red soil region.Soils, 43(3): 466-475. (in Chinese)The concept of watershed management and recovery degree(WMRD) was defined from three aspects,i.e.,soil and water conservation,socio-economic development and ecological service function.An evaluation index system and method for assessing WMRD was established focusing on the purpose of watershed comprehensive management on the bases of expert advices and references.Tangbei watershed in Xinguo country was selected as the study case.The results showed that the selected 19 indicators for assessing WMRD could reflect the real situation of watershed management.The analytic hierarchy process was simple and practical.WMRD of Tangbei watershed increased from 0.252 in 1980s to 0.683 in 2007 after long-term management.

24
Sun W Y, Shao Q Q, Liu J Yet al., 2014. Assessing the effects of land use and topography on soil erosion on the Loess Plateau in China.Catena, 121: 151-163.The Revised Universal Soil Loss Equation (RUSLE) was used in conjunction with geographic information system (GIS) mapping to determine the influence of land use and topography on soil erosion on the Loess Plateau during the period 2000 to 2010. The average soil erosion on the Loess Plateau was 15.202t02ha 61021 02yr 61021 in 2000–2010. Most of the Loess Plateau fell within the minimal and low erosion categories during 2000 to 2010. Forest, shrub and dense grassland provided the best protection from erosion, but the decadal trend of reduced soil erosion was greater for the lower vegetation cover of woodland and moderate and sparse grassland. Midslopes and valleys were the major topographical contributors to soil erosion. With slope gradient increased, soil erosion significantly increased under the same land use type, however, significant differences in soil erosion responding to slope gradients differed from land uses. The results indicate that the vegetation restoration as part of the Grain-to-Green Program on the Loess Plateau has been effective.

DOI

25
Upper and Middle Reaches of the Yellow River Administrative Bureau, 2011. Introduction to the Soil and Water Conservation of Yellow River Basin. Zhengzhou: Yellow River Water Conservancy Press, 64-96. (in Chinese)

26
Wang F, Mu X M, Li Ret al., 2015. Co-evolution of soil and water conservation policy and human-environment linkages in the Yellow River Basin since 1949.Science of the Total Environment, 508: 166-177.Policy plays a very important role in natural resource management as it lays out a government framework for guiding long-term decisions, and evolves in light of the interactions between human and environment. This paper focuses on soil and water conservation (SWC) policy in the Yellow River Basin (YRB), China. The problems, rural poverty, severe soil erosion, great sediment loads and high flood risks, are analyzed over the period of 1949–present using the Driving force–Pressure–State–Impact–Response (DPSIR) framework as a way to organize analysis of the evolution of SWC policy. Three stages are identified in which SWC policy interacts differently with institutional, financial and technology support. In Stage 1 (1949–1979), SWC policy focused on rural development in eroded areas and on reducing sediment loads. Local farmers were mainly responsible for SWC. The aim of Stage 2 (1980–1990) was the overall development of rural industry and SWC. A more integrated management perspective was implemented taking a small watershed as a geographic interactional unit. This approach greatly improved the efficiency of SWC activities. In Stage 3 (1991 till now), SWC has been treated as the main measure for natural resource conservation, environmental protection, disaster mitigation and agriculture development. Prevention of new degradation became a priority. The government began to be responsible for SWC, using administrative, legal and financial approaches and various technologies that made large-scale SWC engineering possible. Over the historical period considered, with the implementation of the various SWC policies, the rural economic and ecological system improved continuously while the sediment load and flood risk decreased dramatically. The findings assist in providing a historical perspective that could inform more rational, scientific and effective natural resource management going forward.

DOI PMID

27
Williams J R, Jones C A, Kiniry J Ret al., 1989. The EPIC crop growth model.Transactions of the ASAE, 32(2): 497-511.

28
Wu F Q, Zhang Y B, Wang J, 2004. Study on the benefits of level terrace on soil and water conservation.Science of Soil and Water Conservation, 2(1): 34-37. (in Chinese)By collecting and analyzing the survey data of runoff and sediment plots in soil and water conservation stations (Xifeng et al.) on Loess Plateau, the benefits of level terrace on soil and water conservation was studied by the method of contributing factor for soil and water conservation. It showed that the average value of benefits result is 86 7% and 87 7%,yet the difference is large because of the effect of the rain-storm, torrential rain and its quality. The benefits were 100% when rainfall synthesis parameter PI was less than 20 0mm<sup>2</sup>/min, rainfall in flood period was less than 350?mm and annual rainfall of runoff gentration was less than 125?mm. The relationship between benefit and parameters is negative correlation. Also terrace quality effects the benefits.

29
Xie H X, 2008. Study on the spatio-temporal change of soil loss and on the assessment of impacts on environment of soil and water conservation in Yanhe basin [D]. Xi’an: Shaanxi Normal University. (in Chinese)

30
Xie W C, Li T H, 2012. Research comment on watershed sediment delivery ratio.Acta Scientiarum Naturalium Universitatis Pekinensis, 48(4): 685-694. (in Chinese)With the existing research achievements on sediment delivery ratio (SDR), the authors discuss the definition of SDR and its roles in water and sediment research. According to the content of the definition of SDR, with the various impact factors of SDR, several methods of calculating SDR are reviewed. Based on the domestic and international examples of numerical calculation on SDR, the values of SDR in major watersheds are summarized. At present, mathematical statistical analysis on watershed erosion and transport data is still a dominating approach to SDR formulation. Due to different understanding of SDR, the formulas for SDR are in different forms and often established for the specific research areas, but cannot be applied to the other areas. How to establish a formula for SDR, which will be suitable for a larger area, is still a major challenge in the future.

31
Xu J X, Sun J, 2004. Effect of erosion control measures on sediment delivery ratio.Advances in Water Science, 15(1): 29-34. (in Chinese)Effect of the erosion control measures on the sediment delivery ratio is studied,based on the data from the Wuding River,a major sediment-supplying tributary of the middle Yellow River.The erosion control measures have greatly changed sediment erosion,transportation and deposition processes in the drainage basin,and thereby the previously established sediment budget has also been modified.In natural conditions without human disturbance,the sediment delivery ratio over the Wuding River basin approaches 1.0.However,when the sediment delivery ratio has rapidly declined to 0.4~0.3 due to the large-scale erosion control measures having been taken since the 1960s.The dramatic change of sediment delivery ratio is caused by the formation of artificial sediment sinks,i.e.,sediment-trapping check-dams and reservoirs.Large quantities of sediment has been trapped by them,only to decrease the sediment ratio.At present,the effect of the sediment interception of these artificial sinks is 2.4~6.3 times as high as that of the sediment reduction with the slope measures such as land terracing and tree-and grass-planting.This indicates that these direct erosion-reduction measures should be strengthened in the middle Yellow River basin.

32
Yao W Y, Ran D C, Chen J N, 2013. Recent changes in runoff and sediment regimes and future projections in the Yellow River basin.Advances in Water Science, 24(5): 607-616. (in Chinese)The runoff and sediment regimes in the Yellow River Basin have been undergone significantly changes in recent years. This study analyzes the changes in runoff and sediment regimes during the period 1997-2006 using the combined approach of hydrological methods, soil and water conservation methods and mathematical modeling. The hydrological and sediment data measured at stations on the main stream and tributaries of the middle and upper reaches of Yellow River are used in the study. The mechanism of changes in runoff and sediment is analysed. Projections of future changes in runoff and sediment regimes are also provided. Results show that in comparison to the long-term average runoff from the source area of Yellow River, a reduction of 43.90 billion m<sup>3</sup> in the annual runoff has been found in recent years (1997-2005). Among which, precipitation and other natural factors can account for 92.26% of the reduction and the remaining is due to the effect of human activities. The observed value of Yellow River annual runoff during the same period has decreased 112.1 billion m<sup>3</sup> compared to that before 1970. Human activities are responsible for 76.50% of the decrease and the rest is due to the reduction of precipitation. At the same time, the observed annual sediment load has been reduced by 11.80 million tons, 49.75% of which is due to the result of human activities such as the integrated control measures on soil and water loss and the remaining portion of the reduction can attribute to the reduction of precipitation. The impacts of human activities and precipitation reduction on the changes in runoff and sediment regimes vary significantly over space. For example, the effect of human activities on runoff reductions is much greater than that of precipitation reduction in the area along the middle reach of Yellow River. While for the reduction of sediment load, the human activities contribute nearly as much as precipitation does. Despite the fact that significant changes have been found in runoff and sediment regimes, the quantitative relationships generally remain unchanged between runoff and sediment load and between precipitation, floods and sediment load in most areas of Yellow River tributary basins. For example, the hyperconcentrated flow occurs during heavy storm events. There are few exceptions on the relationships between precipitation, floods and sediment load in individual tributary basins, which are often accompanied by a significant reduction in runoff and sediment yields. A slight downward trend is projected for both runoff amount and sediment load in the coming decades until 2050 with occasional occurrences of plentiful runoff and heavy sediment load.

33
Yellow River Basin Monitoring Center (YRBMC) of Water-Soil Conservation and Eco-Environment, 2011. The Middle and Upper Reaches of the Yellow River Survey of Soil and Water Conservation Measures. Xi’an: Upper and Middle Yellow River Bureau. (in Chinese)

34
Yellow River Conservancy Commission of the Ministry of Water Resources, 2013. Yellow River Basin Comprehensive Planning (2012-2030). Zhengzhou: Yellow River Water Conservancy Press, 1-10. (in Chinese)

35
Zhang H M, Yang Q K, Li Ret al., 2013. Extension of a GIS procedure for calculating the RUSLE equation LS factor.Computers &Geosciences, 52: 177-188.The Universal Soil Loss Equation (USLE) and revised USLE (RUSLE) are often used to estimate soil erosion at regional landscape scales, however a major limitation is the difficulty in extracting the LS factor. The geographic information system-based (GIS-based) methods which have been developed for estimating the LS factor for USLE and RUSLE also have limitations. The unit contributing area-based estimation method (UCA) converts slope length to unit contributing area for considering two-dimensional topography, however is not able to predict the different zones of soil erosion and deposition. The flowpath and cumulative cell length-based method (FCL) overcomes this disadvantage but does not consider channel networks and flow convergence in two-dimensional topography. The purpose of this research was to overcome these limitations and extend the FCL method through inclusion of channel networks and convergence flow. We developed LS-TOOL in Microsoft's.NET environment using C鈾 with a user-friendly interface. Comparing the LS factor calculated with the three methodologies (UCA, FCL and LS-TOOL), LS-TOOL delivers encouraging results. In particular, LS-TOOL uses breaks in slope identified from the DEM to locate soil erosion and deposition zones, channel networks and convergence flow areas. Comparing slope length and LS factor values generated using LS-TOOL with manual methods, LS-TOOL corresponds more closely with the reality of the Xiannangou catchment than results using UCA or FCL. The LS-TOOL algorithm can automatically calculate slope length, slope steepness, L factor, S factor, and LS factors, providing the results as ASCII files which can be easily used in some GIS software. This study is an important step forward in conducting more accurate large area erosion evaluation.

DOI

36
Zhang S J, Jiao J Y, 2011. Soil loss tolerance in the Loess Plateau based on the healthy function of the lower reaches of the Yellow River.Science of Soil and Water Conservation, 9(1): 9-15. (in Chinese)Based on previous researches on critical flow of different sediment concentration under equilibrium between scouring and deposition and pollutants concentration in the lower reaches of the Yellow River,using the daily flow and sediment yield of Huayuankou and Gaocun hydrologic station,we calculated the critical sediment discharge,which is 6.54×10⁸ t in average year,8.83×108 t in high flow year and 3.95×10⁸ t in dry year with an average of 6.44×10⁸ t,when the lower reaches of Yellow River is in equilibrium between scouring and deposition.Taking ammonia nitrogen and total phosphorus as indicators,we analyzed the non-point source pollution caused by water and soil loss in anmenxia,Huayuankou and Gaocun section,and got the critical sediment discharge,which is 7.93×10⁸ t and 5.20×10⁸ t in Sanmenxia to Gaocun interval averagely,when the lower reaches of Yellow River up to the standard of Ⅲ and Ⅱ water quality based on environment quality standards of surface water.Considering equilibrium between scouring and deposition and water quality criterion as the constraint conditions of the healthy function of he lower reaches of the Yellow River,and combining the reduced sediment discharge by water conservancy and soil and water conservation,average sediment discharge of Toudaoguai hydrologic station,sediment discharge ratio of the Loess Plateau,we obtained soil loss tolerance of Loess Plateau,which is 9.41×10⁸ t or 8.41×10⁸ t when water quality up to Ⅲ or Ⅱ standard with equilibrium between scouring and deposition as well in the Lower reaches of the Yellow River.It provides scientific basis for the soil erosion control in the Loess Plateau.

37
Zhang X P, Zhang L, Wang Yet al., 2009. Tempo-spatially responses of the annual streamflow to LUCC in the middle reaches of Yellow River, China.Science of Soil and Water Conservation, 7(1): 19-26. (in Chinese)Land use/cover changes(LUCC) have profound impacts on many aspects of the environment,including hydrology.To control the severe soil erosion in the Loess Plateau,China,a great number of soil conservation measures and eco-environmental construction have been implemented in the studied region especially from 1970s.These measures have resulted in large scale land use/cover change and considerably modified the streamflow leading to reduced water yield.It is important to understand the impacts of the soil conservation measures on streamflow and its tempo-spatial change pattern in the arid and semi arid region.In this study,data from 38 catchments in the Hekou-Longmen section of middle reaches of Yellow River were analyzed to investigate the responses of streamflow to the land use/cover changes.The nonparametric Mann-Kendall test and Pettitt test were used to identify trends and change points in the streamflow records.It was found that 29 out of the 38 catchments had significant downward trends in annual streamflow ranging from 0.17 to 2.61 mm/a.Pioneer abrupt changes in annual streamlfow defined by change points occurred from 1970 to 1973 found in Wuding River.In other catchments,the change points occurred from 1978 to 1985,the latest was in 1994.The other catchments with no significant trend located mainly in South-West part of study area probably caused by the complex human activities.For Hekou-Longmen section,the streamflow was significant downtrend with 0.79 mm/a and the change point occurred in 1979.Frequency analysis showed that the ratio of reduction in annual streamflow during before and after periods at 5%,50% and 95% percentile were mostly from 30% to 60%.The highest reduction reached to 73.2%,63.5% and 69.7%,respectively.For the whole Hekou-Longmen section,the annual streamflow reduced by 46.5%,42.4% and 24.1%,respectively.It was estimated that the land use/cover changes accounted for over 50% of reduction in mean annual streamflow in 9 of 11 catchments.The construction of soil conservation measures,especially sediment trapping dams,appeared to be the main cause for the changes of mean annual streamflow.

DOI

38
Zhang Y, Liu B Y, Shi P Jet al., 2001. Crop cover factor estimating for soil loss prediction.Acta Ecologica Sinica, 21(7): 1050-1056. (in Chinese)Land use and crop characteristics influence soil loss obviously,so that a quantitative evaluation of the effect of different crops on soil loss(crop factor)is essential to land use and soil conservation planning.The effect of a given crop on soil erosion varies a great deal within the period from seeding to harvest because crop characteristics and canopy cover varies greatly in different seasons.Moreover,the distribution of the erosive rainfall within a year differs for different localities.Therefore,crop factor that takes both the protection of crop and rainfall erosion index into account is widely adapted in soil loss prediction in many countries.Although some research on C (crop)factor have been reported in China,there were much disagreement between those C values;so no C values or related parameters is widely adapted in China so far.The main reason is that the present C values seldom include the influence of rainfall patterns and variety of crop coverage in a year;or crop stages were not defined clearly.Another reason is the compared fallow conditions are not consistent.The purpose of this study is to calculate soil loss ratio from different types of cropland to bare fallow land,on the basis of which crop factor on loess plateau is estimated. 108 plot year observation data from Tianshui,Gansu during 1945~1953(slope length 20m,slope width 5m,slope gradient 5°,8°,14°,17°,including lentil,winter wheat,buckwheat,maize intercropping with soybean grown by traditional tillage in rotation)and 48 plot year observation data from Ansai,Shaanxi during 1987~1992(slope length 20m,slope width 5m,slope gradient 25°,including buckwheat,potato,millet,soybean,which are grown by traditional tillage in rotation,fallow and two types of grass,sainfoin adsurgens)on loess plateau was analyzed in this study. In order to take account of variance of crop coverage,a crop year is divided into the following six crop stage periods according to crop coverage change with time:fallow(from plowing to preparing seedbed),seedbed(preparing seedbed to 10% coverage),established(10%~50% coverage),development(50%~75% coverage),mature(75%~harvest)and residue and stubble(harvest plowing).The length of each crop stage of specific crop is given in a table. Obtaining soil loss ratios(SLR)for individual crop stage periods are essential to derive the value of C factor.By analysis of 156 plot soil loss observations from two experimental field stations,soil loss ratios for each crop stage period of 7 crops are presented.In Ansai,soil consolidation caused the esodibility of fallow plots to decrease significantly after the only tillage in spring and regression analysis shows that monthly average erodibility(Soil Loss/ PI 30)decreases linearly within six months after tillage with the R 2=0.858.In order to keep the compared fallow conditions principally consistent,each soil loss was adjusted to the average level of the fallow plots by multiplying a modifying factor.Factor in the first month after tillage is 0 68;the second month,0.79;the third month,0.94;the fourth month,1.16;the fifth month,1.51;the six month,2.17.Then SLR of every stage of 4 crops was calculated.In Tianshui station,measured soil losses from cropped plots were compared with seedbed within 20 days after planting or plots two months after harvest(quasi fallow)because of no experimental plot kept fallow.When SLR was calculated,all chosen observation data from 27 rainfall events in each of which “quasi fallow plots” can be identified was grouped according to crop stage of different crops.For each rainfall event,12 plot observations were divided again into 4 sub groups according to slope.There is a “quasi fallow plots” among each sub group.The ratio of total soil loss from each crop stage to the total soil loss from corresponding “quasi fallow plots” with same slope is calculated as the SLR of that crop stage. On the bases of soil loss ratios presented here and erosion index distribution data,annual average crop factors for the seven crops including lentil,

39
Zhang Y, Liu B Y, Zhang Q Cet al., 2003. Effect of different vegetation types on soil erosion by water.Acta Botanica Sinica, 45(10): 1204-1209.The C factor in Universal Soil loss Equation reflecting the effect of vegetation on soil erosionby water is one of the important parameters for estimating soil erosion rate and selecting appropriate landuse patterns. In this study, the C factor for nine types of grassland and woodland was estimated from 195plot-year observation data of six groups of soil erosion experiments on Loess Plateau. The result indicatesthat the effects of woodland and grassland on soil erosion keep approximately uniform after two or threeyears?growth. The estimated woodland C factor ranges from 0.004 to 0.164, and the grassland C factorranges from 0.071 to 0.377, showing that the effect of woodland and grassland on soil conservation isgreatly better than that of cropland. The study results can be used to compare or estimate the soil lossfrom land with different vegetation cover, and are the useful references for land use pattern selection andthe project of returning cropland to forest or grassland.

DOI

40
Zhang Y X, Gao J N, Shao Het al., 2014. The terraced fields environmental impact assessment in data-scarce areas based on the embedded terraced module SWAT model.Nature Environment and Pollution Technology, 13(2): 283-288.The terraced field widely distributed in Loess Plateau where serious soil and water loss happens, has a significant influence on watershed hydrological environment. At present, for the deficiency of watershed scale terraced fields hydrological environment impact assessment model and lacking of measured data, the terraced fields environmental impact assessment has attracted many attentions of the researchers. This paper adopts the hydrologic analogy combined with a scale physical model method, to infer the runoff and sediments in data-scarce area. Using the embedded terraced module SWAT model to assessment of terraced fields environmental impact, the results show that was a new way to conjecture the hydrologic data in data-scarce area. And the terraced field module can meet the accuracy requirement, the NS sufficient were both above 0.5 in calibration and verifying period. The soil erosion modulus of terraced fields contained in and removed from the watershed, was respectively 5.3% and 16.2% greater than the real. This indicates that the embedded terraced module SWAT model could be used in terraced fields environmental impact assessment in Loess Plateau small watershed.

41
Zheng J Y, Yin Y H, Li B Y, 2010. A new scheme for climate regionalization in China.Acta Geographica Sinica, 65(1): 3-12. (in Chinese)lt;p>A new scheme for climate regionalization in China was established based on the daily observations for 609 meteorological stations during the period 1971-2000.During regionalization,current basic theories,classification methodologies and criteria system were used,besides,five principles were taken into consideration,mainly included zonal and azonal integration,genetic unity and regional relative consistent climate integration,comprehensiveness and leading factors integration,bottom-up and top-down integration,spatial continuity and small patch omission.The new scheme consists of 12 temperature zones,24 moisture regions and 56 climatic sub-regions.</p>

42
Zhao L S, Liang X L, Wu F Q, 2014. Soil surface roughness change and its effect on runoff and erosion on the Loess Plateau of China. Journal of Arid Land, 6(4): 400-409.As an important parameter in the soil erosion model, soil surface roughness (SSR) is used to quantitatively describe the micro-relief on agricultural land. SSR has been extensively studied both experimentally and theoretically; however, no studies have focused on understanding SSR on the Loess Plateau of China. This study investigated changes in SSR for three different tillage practices on the Loess Plateau of China and the effects of SSR on runoff and erosion yield during simulated rainfall. The tillage practices used were zero tillage (ZT), shallow hoeing (SH) and contour ploughing (CP). Two rainfall intensities were applied, and three stages of water erosion processes (splash erosion (I), sheet erosion (II) and rill erosion (III)) were analyzed for each rainfall intensity. The chain method was used to measure changes in SSR both initially and after each stage of rainfall. A splash board was used to measure the splash erosion at stage I. Runoff and sediment data were collected continuously at 2-min intervals during rainfall erosion stages II and III. We found that SSR of the tilled surfaces ranged from 1.0% to 21.9% under the three tillage practices, and the order of the initial SSR for the three treatments was ZT&lt;SH&lt;CP. For the ZT treatment, SSR increased slightly from stage I to III, whereas for the SH and CP treatments, SSR decreased by 44.5% and 61.5% after the three water erosion stages, respectively, and the greatest reduction in SSR occurred in stage I. Regression analysis showed that the changes in SSR with increasing cumulative rainfall could be described by a power function (<em>R</em><sup>2</sup>&gt;0.49) for the ZT, SH and CP treatments. The runoff initiation time was longer in the SH and CP treatments than in the ZT treatment. There were no significant differences in the total runoff yields among the ZT, SH and CP treatments. Sediment loss was significantly smaller (<em>P</em>&lt;0.05) in the SH and CP treatments than in the ZT treatment.

DOI

43
Zhu T X, 2012. Gully and tunnel erosion in the hilly Loess Plateau region, China.Geomorphology, 153/154: 144-155.A total of 704 channels, 967 tunnel inlets and 547 mass movements were identified in the study watershed. On the basis of their location and morphology, all the channels were classified into four types: headwater gullies, hillside gullies, valleyside gullies and ephemeral river channels. Tunnels are associated with 79% of headwater gullies, 48% of hillside gullies, 3% of valleyside gullies and none of ephemeral river channels. Mass movements are dominated by falls in headwater gullies, falls and slides in hillside gullies, and soil creeps in ephemeral stream channels. Statistical tests indicate that there are significant differences in physiographic variables between tunneled and untunneled gullies. Tunnel formation in gullies is intricately affected by topographic conditions, land uses, knickpoint distribution, soil materials and mass movements.

DOI

Outlines

/