Orginal Article

Evaluation of farmland losses from sea level rise and storm surges in the Pearl River Delta region under global climate change

  • KANG Lei 1, 2 ,
  • Ma Li , 1 ,
  • LIU Yi 1
Expand
  • 1. Key Laboratory of Regional Sustainable Development Modeling, Institute of Geographic Sciences and Natural Resources Research, CAS, Beijing 100101, China;
  • 2. University of Chinese Academy of Sciences, Beijing 100049, China

Author: Kang Lei (1989-), PhD, specialized in economic geography and regional development. E-mail:

*Corresponding author: Ma Li (1975-), Associate Professor, specialized in economic geography and regional development. E-mail:

Received date: 2015-10-05

  Accepted date: 2015-11-10

  Online published: 2016-04-25

Supported by

National Basic Research Program of China, No.2012CB955702

Copyright

Journal of Geographical Sciences, All Rights Reserved

Abstract

The Pearl River Delta on China’s coast is a region that is seriously threatened by sea level rise and storm surges induced by global climate change, which causes flooding of large areas of farmland and huge agricultural losses. Based on relevant research and experience, a loss evaluation model of farmland yield caused by sea level rise and storm surges was established. In this model, the area of submerged farmland, area of crops, and per unit yield of every type of crop were considered, but the impact of wind, flooding time, changes in land use and plant structure were not considered for long-term prediction. Taking the Pearl River Delta region in Guangdong as the study area, we estimated and analyzed the spatial distribution and loss of farmlands for different scenarios in the years 2030, 2050, and 2100, using a digital elevation model, land-use data, local crop structure, rotation patterns, and yield loss ratios for different submerged heights obtained from field survey and questionnaires. The results show that the proportion of submerged farmlands and losses of agricultural production in the Pearl River Delta region will increase gradually from 2030 to 2100. Yangjiang, Foshan, and Dongguan show obvious increases in submerged farmlands, while Guangzhou and Zhuhai show slow increases. In agricultural losses, vegetables would sustain the largest loss of production, followed by rice and peanuts. The greatest loss of rice crops would occur in Jiangmen, and the loss of vegetable crops would be high in Shanwei and Jiangmen. Although losses of peanut crops are generally lower, Jiangmen, Guangzhou, and Shanwei would experience relatively high losses. Finally, some measures to defend against storm surges are suggested, such as building sea walls and gates in Jiangmen, Huizhou, and Shanwei, enforcing ecological protection to reduce destruction from storm surges, and strengthening disaster warning systems.

Cite this article

KANG Lei , Ma Li , LIU Yi . Evaluation of farmland losses from sea level rise and storm surges in the Pearl River Delta region under global climate change[J]. Journal of Geographical Sciences, 2016 , 26(4) : 439 -456 . DOI: 10.1007/s11442-016-1278-z

1 Introduction

Global climate change has become a great concern of governments, experts, and the public. Global warming has now been confirmed as a fact. Among the problems caused by global climate change, sea level rise has become a major focus of the international community. Sea level rise would intensify marine and coastal disasters such as storm surges, loss of tidal flat wetlands, coastal erosion, and salt water intrusion (Kleinosky et al., 2007). Losses caused by all types of marine disasters also show an increasing trend. Recent research has demonstrated that, if sea level were to rise by 1 m, almost 5 million km2 of land would be flooded, affecting more than one billion people and a third of all farmland on earth (Wu et al., 2006).
This paper mainly focuses on the influence of sea level rise and storm surge disasters caused by global climate change. A storm surge is the abnormal fluctuation of water level resulting from severe atmospheric disturbances, such as strong winds and air pressure changes (usually referred to as typhoons, extratropical cyclones, and other disastrous weather systems), which causes the tide level within the affected area to far exceed the usual level. The disasters caused by rising coastal water are commonly known as storm surge disasters (Sun, 2008; Wang et al., 2010). China has a long coastline of more than 18,000 km, crossing temperate and tropical zones from north to south. Storm surge disasters can occur across all coastal areas, making China one of the countries most affected by storm surge disasters. Since 2005, the direct economic losses from storm surge disasters have been greater than those from any other marine disasters. The economic losses in 2005 were the largest to date, at 32.98 billion yuan. The proportion of the direct economic loss caused by storm surge disasters to that of those caused by all types of marine disasters continued to increase from 2010 to 2014. Moreover, losses from 2012 to 2014 exceeded 10 billion yuan, accounting for more than 80% of the direct losses caused by all marine disasters (CNOA, 2005-2014). Because of global warming, the risk of coastal areas suffering a storm surge disaster has increased significantly. Therefore, it is of great practical significance to the study of storm surge disasters under the background of global climate change, and to estimate and forecast of the developing trend for fully understanding the severity and risk of disasters.
At present, scholars inside and outside of China have conducted numerous relevant studies on storm surge disasters, mainly focusing on the following aspects: 1) Studies of the characteristics, types, and causes of storm surges. For example, geographic-meteorological causes, occurrence rules (Gan et al., 2012; Dong et al., 2015; Nicholls et al., 1999; Lowe et al., 2001), and spatial and temporal distribution characteristics of storm surges were analyzed based on historical data in some areas of China (Dong et al., 2014; Wu and Liu, 2014). 2) Studies on the risk of and vulnerability to storm surge disasters. Such studies have similar approaches to general research on natural disaster vulnerability. Based on the index system, some certain mathematical methods were used to evaluate the risk and vulnerability levels of storm surge disasters in some regions (Xiao et al., 2011; Tan, 2012; Yin, 2011). 3) Loss evaluation of storm surge disasters (Zhao et al., 2011; Yin and Wang, 2010; Fang et al., 2007; Genovese and Green, 2015; Yin et al., 2012) and risk zonation of storm surge disaster losses (Zhao and Chen, 2011). The impact of storm surge disasters on coastal areas involves land, population, industrial and agricultural production, marine industry, and many other fields, causing many aspects of socio-economic losses. Commonly, evaluation of economic losses from storm surge disasters involves selecting a series of indicators to evaluate the overall economic losses (Vrisou and Kok, 2001). Chinese scholars usually classify storm surge disaster losses as direct and indirect losses, determine the value of each type of loss, and then add them together to obtain the total loss (Guo, 2013). Thus, a variety of methods to calculate disaster caused by economic losses were developed, including the methods of property loss rate, model of loss growth, and surface comprehensive loss model to estimate the direct economic losses, and the direct investigation and evaluation method or experiential coefficient method to determine the indirect economic losses (Zuo, 2003). 4) Prediction study of storm surges and disasters. These studies generally use statistical methods, collecting history and status data to perform prediction analysis based on qualitative methods or combining qualitative methods with quantitative ones to obtain the highest possible tide level of storm surge, the possible submerged area, or the losses. For example, Ye and Yu (2002) analyzed the spatial distribution and seasonal variation of storm surge disasters in China, and explored long-term prediction methods based on statistics of historical storm surge disasters in Chinese coastal areas. Chen and Wang (2000) and Hu and Jin (2007) used mathematical methods to predict the highest possible water level and periodicity of storm surges in Shanghai.
As described above, relevant research of storm surge disasters have mainly focused on the analysis of historical rules or the assessment of status risk, and the evaluation of storm surge disasters and losses in the context of global warming and sea level rise is still in the exploratory stage. In particular, evaluations or predictions of storm surge disasters are mainly preoccupied with populations, GDP, and other macro-economic aspects. However, storm surge disasters often lead to farmlands being submerged, so agriculture is one of the primary hazard-affected elements of storm surge disasters. The evaluation of vulnerability of coastal areas in China to typhoon storm surges under the background of sea level rise showed that submerged croplands accounted for the largest proportion (Wang et al., 2011). Farmlands are an essential part of agricultural environment and production, yet in the existing research, it is rare to see single evaluations of agricultural loss. Evaluations of losses from submerged farmlands are particularly rare, and there is currently no widely used assessment method. There are also very few studies on the increasing severity of storm surge disasters in the context of global climate change. For the prosperous coastal areas of Guangdong, sea level change and its impact on the Guangdong coasts and Pearl River mouth has been a particular concern (Feng et al., 2013; Tang et al., 2009; You et al., 2012). Sea level rise has become an important factor in speeding up erosion of the Guangdong coasts, leading to frequent occurrences of salty tides at the Pearl River mouth. However, there have been few reports of quantitative research on the impact of sea level rise on the region.
Accordingly, in this paper a loss evaluation model of farmland yield caused by sea level rise and storm surge was established based on relevant research and experience. Combined with field investigation data, we estimated the farmland losses caused by disasters during different periods, and conducted a comparative analysis. For this paper, with support of GIS spatial analysis, we selected the Pearl River Delta of Guangdong Province as the study area. In the context of global climate change and under different scenarios of storm surges, the extent of farmland submergence due to sea level rise and storm surges in the study area was extracted based on climate change simulations for the years of 2030, 2050, and 2100. Choosing rice, peanuts, and vegetables as the main crops, this paper estimated and predicted the production losses of these crops due to submergence in each city in the Pearl River Delta region, taking consideration of crop planting area, and yield and crop loss ratios under different submergence depths. At last depicted the potential losses of farmlands caused by storm surge disasters for different time scenarios in the future were depicted quantitatively, in order to understand the impact of storm surge disasters on regional agriculture more deeply, objectively, and accurately, and to provide a scientific basis for quantitation and positioning of cultivation patterns, production and disaster prevention, and disaster mitigation for the Pearl River Delta region.

2 Materials and methods

2.1 Study area

The Pearl River Delta is China’s second largest river delta, located in the central and southern coasts of Guangdong Province. Based on the effective range of storm surge disasters, and contrary to the traditional economic and geographic definition of the Pearl River Delta region, we excluded Zhaoqing (which is located at a high elevation and is thus not affected by storm surges) from the study area, and added Yangjiang and Shanwei, near the Pearl River mouth. Thus, the study area in this paper included Guangzhou, Shenzhen, Zhuhai, Foshan, Jiangmen, Dongguan, Zhongshan, Huizhou, Yangjiang, and Shanwei covering an area of about 1.1×10⁴ km2 (Figure 1). With its broad plains, dense drainage system, long coastline, terrain and hydrological conditions, the study area is very suitable for agricultural development. Due to the good geographic location near Hong Kong and Macao and high level of urbanization, the region is one of the most important places in Guangdong in terms of rice and vegetables crops. However, with intensifying global warming and rapid economic development and urbanization, sea level rise, severe storm surges, and coastal erosion, the Pearl River Delta has become increasingly vulnerable (Han et al., 2010).
Figure 1 Location of the Pearl River Delta region

2.2 Data sources

The basic geographic data used in this study includes 1:50,000 land use data from 2010 (vector data) and the 10 m × 10 m resolution digital elevation model (DEM) for the Pearl River Delta region provided by the Guangzhou Institute of Geography. The land use data is the result of the second national land investigation, using the national standard The Present Land-use Conditions Classification of GB/T 21010-2007. In addition, the planting areas and yield of main crops come from Statistical Yearbook of Guangdong of 2011. The sea levels used in this paper are the predicted values for the rate of sea level rise on the Guangdong coasts and the predicted values of future sea level using the EEMD-BP model based on a long series (1959-2011) of monthly mean tide levels of standard stations of the global sea level monitoring network. The water-increase values of storm surges were the 100-year storm values from Li’s group (Li and Li, 2013; He et al., 2015). They predicted the values according to previous storm surge records of nearly 30 years from 17 tide level stations distributed in the central coastal area in Guangdong. The total height was obtained by adding together the predicted sea level rise value and water-increase values of storm surges (Table 1).
Table 1 Scenarios of future sea level rise and storm surges in the Pearl River Delta region
Scenario 2030 2050 2100
The predicted submerged elevation High-estimation 4.5006 m 4.5822 m 4.7862 m
Low-estimation 3.2376 m 3.2992 m 3.4532 m

2.3 Extraction of submerged farmland due to storm surge

Storm surges and sea level rise will become the main meteorological disasters in the world. The latest research from IPCC shows that the global average sea level has risen by 0.19 m during the period from 1901 to 2010 (IPCC, 2013). Sea level is expected to rise by 9-88 cm, and the optimal estimation is 48 cm (Ji and Shi, 1996; Kong and Chen, 2012). However, because of the global scale of estimation, the results present a larger error for China. Since the Pearl River Delta region is one of the most complex water systems in the world (Chen and Chen, 2012), sea level changes in the region show high complexity and uncertainty, and are influenced by many factors such as offshore sea level, runoff, tides, and topography (Shi et al., 2012; Kong et al., 2010). For this paper, we used the results of sea level changes of the Pearl River Delta from Li’s research group (Li and Li, 2013; He et al., 2014). As previously stated, in the process of obtaining results, a good correlation of tide sequences was observed between the selected stations. Consistency of the data is good enough to correctly reflect the regional sea level changes (He et al., 2014) and the data are relatively accurate and suitable for the study area in this paper. Without considering the seawall protection ability, and based on the GIS technology and DEM data of the study area, setting the year 2010 as the benchmark, and taking the predicted submerged elevation including sea level rise and storm surges of 2030, 2050, and 2100 as the basis, we extracted the possible submerged area, with high and low estimations for different time scenarios.
We combined the extracted submerged area for different scenarios in different periods, with land use data for 2010 in the Pearl River Delta region and obtained the spatial distribution of submerged farmlands. Then, we took the actual height of the submerged farmlands into consideration, and calculated their submerged height, which is the difference between the submerged elevation and actual elevation, by means of the raster calculator tool in ArcGIS.

2.4 Disaster conditions and loss rate of main crops

Instead of obtaining crop loss rates through a literature review, we conducted on-the-spot investigations and used basic principle of statistics to summarize and classify submerged farmlands and crop loss rates according to their submerged heights. First, we collected data and literature on meteorology, crops, and disaster damage, and selected and determined the investigation area, and designed a questionnaire. Then, we selected 6 counties, including Raoping, Huidong, Huilai, Jiangmen, Yangdong, 18 towns, and 54 villages on the Guangdong coast to conduct field surveys and interviews from November to December in 2012. We obtained 540 completed questionnaires on the farmland area, crops planted per mu (15 mu = 1 ha), crop yield, disaster type and intensity, and disaster duration between 2010 and 2012. Finally, we classified the submerged farmland and crop loss rates with different submerged heights by summarizing the questionnaires (Table 2). The planting system of the Pearl River Delta region involves three harvests each year, and the superior crop is double cropping rice. Crop rotations are practised in this region, are mostly rotated with early rice, late rice, and economic crops (e.g., peanuts, cassava.) or early rice, late rice, and vegetables. The storm surges mainly occur from June to October, usually 4-5 times per year, on average. The region’s main planting scheme is as follows: early rice is seeded around February or March and harvested around June or July; late rice is seeded around June or July and harvested around November. Vegetables are grown all year round, and peanuts are planted from April to October. According to the local climate conditions and crop planting rules, and the overlap between crop planting time and storm surge occurrence time, the rice (early rice and late rice), vegetables, and peanuts are major crops affected by storm surge disasters. Loss of these crops constitutes the main part of the agricultural yield losses caused by sea level rise and storm surge disasters.
The key point of agricultural loss calculation is to determine the loss parameters of crops under different submerged levels. The submerged loss rate is one of the most important parameters. Studies have shown that the submerged heights are different, and the crop loss rates are also different (Shi, 1990). For the same crop, different loss rates occur with different submerged heights; the higher the submerged height, the greater the loss rate. The crop loss rates at different submerged heights were determined based on the investigation results, as shown in Table 2.
Table 2 Crop loss ratios under different submerged heights in the Pearl River Delta region (%)
Submerged height (cm) Vegetables Peanuts Rice
<30 20 26.52 24.79
30-50 40 30.63 34.89
50-80 80 35.83 36.11
80-120 85 45.83 40.57
120-150 100 50.5 54.21
>150 100 100 100

2.5 Loss evaluation of crops submerged by storm surge

Based on the farmland area, submerged farmland area, planting areas, and yields of different crops, this paper took the city as a unit and used the model to calculate the crop yield losses in each city within the Pearl River Delta region according to equation (1). Then, the total losses of submerged farmlands in the region were calculated.
where V is the total loss of different crops in each city; j is the grade of submerged farmland, with values ranging from 1 to 6; i is the crop type; Cij is the area of submerged crop i with submerged height grade j; Gij is the yield of crop i; Eij is the loss rate of crop i with submerged grade j.
Then, Cij can be calculated as:
where Cij is the area of submerged crop i with submerged grade j in the administrative unit; Aj is the area of the submerged farmland in the administrative unit with submerged grade j; C0 is the actual planting area of crop i in the corresponding administrative unit; A0 is the actual area of the farmland in the corresponding administrative unit.

3 Results

3.1 Prediction analysis of future farmland submergence in Pearl River Delta region

Storm surges and disasters may lead to farmlands being submerged. In the context of global climate change, prediction of farmland and the overall submergence in coastal areas such as the Pearl River Delta region was essential based on qualitative methods.
3.1.1 Prediction of overall submergence
In this study, we extracted the spatial extent of submerged farmland resulting from storm surges in the Pearl River Delta region at each time point in the future by means of ArcGIS (Figure 2), and summed up the areas of submerged farmlands. According to the statistical results, from 2030 to 2100, with the increase of sea level rise and storm surges, the area of submerged farmlands will increase continuously, but the increasing trend appears to be easing. Specifically, in 2030 the total area of submerged farmland is 95188.39 ha in the low-estimation scenario and 137,726.69 ha in the high-estimation scenario, accounting for 18.53% and 26.82% of all farmlands, respectively. By 2050, the area of submerged farmlands in the low-estimation and high-estimation scenarios would increase to 95,423.93 ha and 138,089.42 ha, respectively, which is 0.25% and 0.26% higher than in 2010. In 2100, the area would increase by 0.63% and 0.70% compared with 2050.
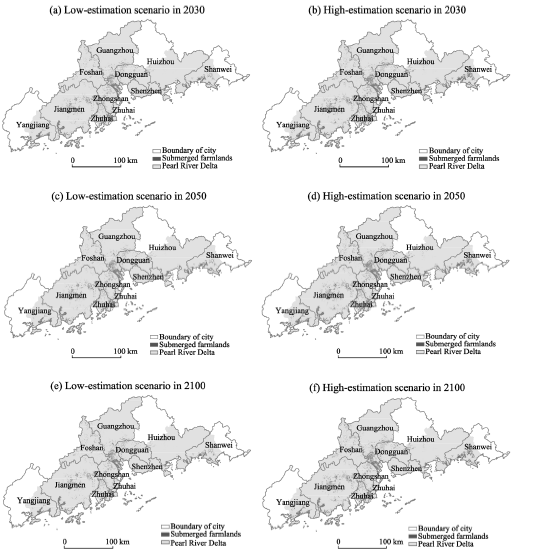
Figure 2 Future spatial distribution of submerged farmlands under different submerged heights caused by sea level rise and storm surges in the Pearl River Delta region
From the perspective of cities (Table 3), under the influence of sea level rise and storm surge disasters in different time scenarios, the area of submerged farmland in Jiangmen is the largest. Taking the scenario in 2030 as an example, the areas of submerged farmlands in low-estimation and high-estimation scenarios in Jiangmen are 29,054.78 ha and 39,236.8 ha, respectively. Next are Guangzhou and Zhuhai, where the areas of submerged farmland reached over ten thousand hectares in the low-estimation scenario, at 19,462.75 ha and 10,400.83 ha, respectively. Among them, Taishan, south of Xinhui District, and southeast of Enping in Jiangmen are adjacent to the South China Sea. The coastline of Jiangmen is 615 km long, accounting for 1/5 of that of Guangdong Province. Moreover, the southeastern part of Taishan and Enping are located on the gulf, and the tides will result in a sharp rise in sea level when entering the bank, causing widespread submerge. Southern Guangzhou and Zhujiang are a part of the Pearl River mouth, which is a compound estuary with a horn mouth and river network. When a strong transit typhoon pushes the seawater inward from the horn mouth, seawater spreads easily into the river network. In addition to the low-lying coastal areas, a storm surge disaster would cause large areas of submergence. Similarly, in Zhongshan and Foshan, which are also on the Pearl River mouth, the low-estimated areas of submerged farmland are more than 7000 ha. Besides, Shanwei is located on the eastern part of the Pearl River mouth facing the South China Sea to the south and the Taiwan Straits to
Table 3 Future estimates and statistics of submerged farmland areas for each city in the Pearl River Delta region under different scenarios of sea level rise and storm surge (ha) the east. Storm surge disasters due to typhoons would cause large areas of farmland to be submerged with a low-estimation of nearly ten thousand hectares.
2030 2050 2100
City Low-estimation High-estimation Low-estimation High-estimation Low-estimation High-estimation
Guangzhou 19462.75 25585.39 19500.64 25649.55 19609.74 25786.43
Shenzhen 113.05 174.42 113.13 174.59 114.87 175.31
Zhuhai 10400.83 12778.43 10400.92 12778.43 10401.19 12778.83
Foshan 7027.02 11785.66 7061.93 11817.74 7145.29 11900.38
Huizhou 1847.21 5406.00 1847.21 5406.00 1847.21 5407.12
Shanwei 9687.18 17683.60 9719.22 17701.91 9802.11 17753.99
Dongguan 5852.58 8046.46 5879.61 8066.82 5936.81 8109.69
Zhongshan 8286.49 9776.66 8288.93 9779.15 8295.36 9781.61
Jiangmen 29054.78 39236.80 29116.03 39317.22 29280.68 39538.11
Yangjiang 3456.50 7253.27 3496.31 7398.01 3588.59 7823.26
Total 95188.39 137726.69 95423.93 138089.42 96021.85 139054.73
From the increased submerged areas of farmland caused by sea level rise and storm surge, in the low-estimation scenario, the submerged area in Yangjiang would increase the most, by 1.15% from 2030 to 2050, and 2.64% from 2050 to 2100. Next, the submerged area in Foshan would increase 0.5% by 2050 and 1.18% by 2100, and in Dongguan the submerged area would increase 0.46% by 2050 and 0.97% by 2100. For these cities, with the increase of submerged elevation, the disaster hazard would distinctly increase. In addition, the submerged areas in Guangzhou and Zhuhai each year are large but increasing slowly. Especially in Zhuhai, the submerged area in different years has barely changed. This may be related to regional elevation. The average elevation in Zhuhai is relatively high. Guangzhou has an average elevation greater than 40 m and only the southern part, located in the Pearl River mouth, tends to be affected by storm surges. On the other hand, Guangdong and Zhuhai belong to the core development zone of the Pearl River Delta region with high level of urbanization. The farmlands are generally distributed in low areas, and the rest of the region is dominated by urban construction. Therefore, the submerged farmland area would not continue to expand significantly. The high-estimation analysis is similar.
3.1.2 Prediction of farmlands with different submerged heights
From the distribution of submerged heights in the Pearl River Delta region (Figure 3 and Table 4), in the low-estimation scenario, the main distribution was the farmland with a submerged height of 30 cm. The area is nearly 35,000 ha, accounting for 36% of the total submerged farmland. Next are farmlands with submerged heights of 80-120 cm, more than 30,000 ha and 32%. Farmlands with submerged heights greater than 150 cm account for more than 25,000 ha, over 26%. By 2100, the grade distribution will change slightly. The submerged height with the largest proportion is 30-50 cm, followed by 120-150 cm, and >150 cm. In the high-estimation scenario, most of the submerged farmlands have a submerged height interval of greater than 150 cm and 50-80 cm. Yearly comparisons indicate that the area of farmlands with higher submerged heights has increased. Taking the low-estimation scenario as an example, in 2030, the area of farmlands with a submerged height less than 30 cm is 34,969.53 ha, decreasing slightly to 34,888.20 ha in 2050, and decreasing significantly to 1155.50 ha in 2100. The area of farmlands with submerged heights of 30-50 cm has the most significant increase, from less than 1000 ha in 2050 to 34,564.41 ha in 2100. Farmland with other levels of submerged heights all increase to different extents.
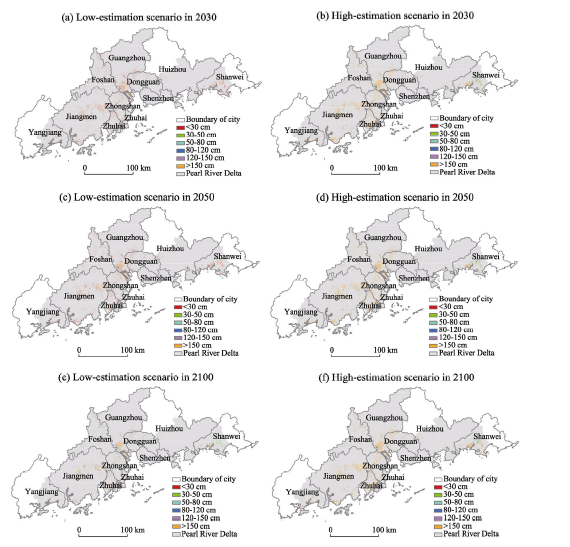
Figure 3 Future distribution of farmlands with different submerged grades under different scenarios of sea level rise and storm surges in the Pearl River Delta region
Table 4 Future estimates and statistics of farmlands with different submerged heights under different scenarios of sea level rise and storm surge in the Pearl River Delta region (ha)
Submerged
height (cm)
2030 2050 2100
Low-estimation High-estimation Low-estimation High-estimation Low-estimation High-estimation
<30 34969.53 1248.19 34888.2 1284.78 1155.5 1393.04
30-50 996.68 737.03 1021.05 779.14 34564.41 838.25
50-80 1405.93 38771.32 1407.89 38713.34 1482.76 38610.98
80-120 1783.21 1540.95 1798.32 1557.07 1809.44 1685.78
120-150 30947.32 1203.16 30949.37 1199.17 30797.96 1156.06
>150 25085.72 94226.04 25359.1 94555.92 26211.78 95370.62
From the distribution change of the submerged height classification in each city, the low-estimation scenario was analyzed. From 2030 to 2100, farmlands with submerged heights of less than 30 cm in all the cities decrease, those greater than 150 cm increase in most cities, and in some cities the level remains constant. In Jiangmen and Foshan, farmlands with submerged heights below 30 cm decrease, and those with other submerged heights increase to varying degrees. In Guangzhou, farmlands with submerged height below 30 cm significantly decrease, and those in the range of 30-50 cm and above 150 cm increase markedly. In Shanwei and Zhuhai, areas of farmlands submerged by more than 30 cm decrease most significantly, yet the farmlands with submerged heights of 30-50 cm, 120-150 cm, and above 150 cm continue to increase. In Huizhou, only farmlands with submerged heights of 30-50 cm increase from 0 to 1686.32 ha, and other submerged farmlands do no change significantly in 2030, 2050, and 2100. All the above results show that with sea level rise, submerged farmlands with higher submerged heights would increase. The higher the submerged height, the greater the agricultural losses. Obviously, the submerged loss of the whole region would increase, and the damage to agriculture caused by storm surges would become more severe.

3.2 Predictive evaluation of farmland production losses in the Pearl River Delta
region

Based on the prediction of the submergence and different submerged heights of the farmland, the paper focused on the prediction of main crop yield losses in 2030, 2050 and 2100 in different scenarios to clarify the risk of and vulnerability to storm surge disasters.
3.2.1 Prediction of future main crop yield losses in each city
To make the time points correspond to land-use data, we calculated the main crop losses caused by storm surges in the future based on the crop yields of the Pearl River Delta and Guangdong Province in 2010 (Table 5), and acquired yield losses of different crops in each city, as well as the proportion accounting for the total yield of the whole study area. In 2030, the proportion of rice yield loss in Jiangmen, Guangzhou, and Shanwei is higher. Among them, the rice yield loss in Jiangmen is the highest of all cities, amounting to 84,215.45 tons when low-estimating and 158,611.04 tons when high-estimating, respectively accounting for 3.21% and 6.04% of the total rice yield in the Pearl River Delta. The regions with higher proportions of peanut crop loss include Shanwei, Jiangmen, Guangzhou, etc. In the low-estimation scenario, the peanut crop yield loss in Jiangmen is the highest, at 2971.60 tons, followed by Guangzhou at 2435.99 tons, and Shanwei at 2021.39 tons. In the high-estimation scenario, the peanut crop loss in Shanwei ranks on the top at 6079.56 tons, followed by Jiangmen with a loss of more than 5500 tons, further followed by Guangzhou and Yangjiang. Guangzhou is the city with the highest vegetable yield loss, followed by Zhongshan, then Foshan and Jiangmen. The vegetable yield loss in Guangzhou is more than 540,000 tons, accounting for more than 5% of total vegetable yield in the study area in the low-estimated scenario. In the high-estimated scenario, the loss is greater than 910,000 tons, and the proportion reaches 8.62%. The distribution of the crop yield loss accounting for the total yield of Guangdong Province is similar. The rice yield loss proportion is the highest, at 0.79% and 1.50% in low-estimation and high-estimation scenarios, respectively, and followed by Guangzhou. The peanut yield losses are commonly lower, but the loss proportions in Jiangmen, Guangzhou, and Shanwei are relatively high. Guangzhou has the highest proportion of vegetable yield loss, significantly higher than other cities.
Table 5 Prediction of future yield losses in the Pearl River Delta region (ton)
Year City Rice Peanut Vegetable
Low-estimation High-estimation Low-estimation High-estimation Low-estimation High-estimation
2030 Guangzhou 44250.58 80894.28 2435.99 4486.31 543554.90 911988.78
Shenzhen 0.00 0.00 0.10 0.33 1765.37 5575.28
Zhuhai 11138.30 20098.71 272.44 498.54 67771.14 105780.57
Foshan 5116.29 14673.56 396.95 1144.22 147810.86 393660.84
Huizhou 2796.75 17315.66 371.33 2191.06 13337.00 125669.49
Shanwei 33841.96 102444.30 2021.39 6079.56 111099.73 343857.01
Dongguan 1361.14 3402.31 17.63 44.61 87187.01 174153.96
Zhongshan 13576.67 24521.15 148.90 273.56 251815.27 370180.06
Jiangmen 84215.45 158611.04 2971.60 5666.90 148206.39 251388.43
Yangjiang 14565.46 45469.40 1373.26 4262.24 32283.07 100692.40
2050 Guangzhou 44639.75 81125.77 2457.99 4499.40 545807.69 914217.72
Shenzhen 0.00 0.00 0.10 0.34 1780.08 5586.24
Zhuhai 11138.63 20099.55 272.45 498.57 67774.00 105783.56
Foshan 5152.17 14746.68 399.82 1149.85 149189.54 394747.15
Huizhou 2796.75 17316.38 371.33 2191.24 13337.00 125675.57
Shanwei 34161.79 102741.42 2040.94 6097.18 112019.25 344359.76
Dongguan 1377.48 3417.51 17.81 44.82 88286.41 174870.86
Zhongshan 13616.11 24542.48 149.32 273.82 252269.09 370339.58
Jiangmen 84370.01 159005.43 2977.47 5680.63 148519.36 251916.70
Yangjiang 14827.65 46201.10 1396.41 4329.56 32887.11 102185.00
2100 Guangzhou 47787.00 81659.83 2569.66 4529.02 594658.37 919894.34
Shenzhen 0.00 0.00 0.11 0.34 2325.41 5611.74
Zhuhai 11678.93 20101.01 278.22 498.61 73192.26 105787.18
Foshan 5788.34 14912.33 425.10 1162.67 177264.07 397644.78
Huizhou 3691.22 17319.43 419.97 2191.84 22366.52 125692.26
Shanwei 39089.44 103461.80 2194.19 6139.36 136623.15 345721.44
Dongguan 1517.80 3454.87 18.83 45.34 100786.15 176421.63
Zhongshan 14361.25 24569.57 153.93 274.14 270467.39 370721.07
Jiangmen 88808.87 160097.57 3054.90 5720.41 161054.99 253251.39
Yangjiang 17042.22 48276.50 1526.59 4525.91 39368.10 106694.87
In a short period (2030-2050), the crop yield losses in most cities do not show great changes, however, there is an increasing trend of yield loss and proportional loss for each type of crop in all cities in the long term (2030-2100). The yield losses and proportions of rice, peanuts, and vegetables in Guangzhou, Jiangmen, and Yangjiang show a continual increase. For example, in 2030, the rice yield losses in Guangzhou in the low-estimation and high-estimation scenarios are 44,250.58 tons and 80,894.28 tons, respectively, accounting for 1.68% and 3.08% of the total rice yield in the Pearl River Delta region, rising to 44,639.75 and 81,125.77 tons, with the proportions rising to 1.70% and 3.09% in 2050. By 2100, the yield loss and proportions would rise to 47,787.00 tons and 81,659.83 tons, and 1.82% and 3.11%. The crop yield and proportions in most other cities would all rise to some extent. As noted above, assuming that the planting structure and crop output do not change much, with the sea level rise, main crop losses throughout the areas caused by storm surge disasters would intensify, and agricultural losses in the whole region would increase.
3.2.2 Prediction of future total farmland yield losses
The crop yield losses and the proportion for different submerged heights in each city and the entire Pearl River Delta was showed in Table 6. In the future, the loss of vegetables will be the largest, followed by rice, and then peanuts. Taking the year of 2030 as an example, the loss of vegetables in the low-estimation scenario is 1,404,800 tons, accounting for 13.28% and 5.17% of the total vegetable yield in the Pearl River Delta and Guangdong Province. In the high-estimation scenario, the vegetables yield losses nearly double, reaching
Table 6 Future yield losses and proportions of main crops under different scenarios of sea level rise and storm surge in the Pearl River Delta region
Rice Peanut Vegetable
2030 Low-estimated losses (×104 tons) 21.09 1.00 140.48
Proportion accounting for the study area (%) 8.03 5.60 13.28
Proportion accounting for Guangdong (%) 1.99 1.15 5.17
High-estimated losses (×104 tons) 46.74 2.46 278.29
Proportion accounting for the study area (%) 17.79 13.79 26.30
Proportion accounting for Guangdong (%) 4.41 2.83 10.24
2050 Low-estimated losses (×104 tons) 21.21 1.01 141.19
Proportion accounting for the study area (%) 8.07 5.64 13.34
Proportion accounting for Guangdong (%) 2.00 1.16 5.19
High-estimated losses (×104 tons) 46.92 2.48 278.97
Proportion accounting for the study area (%) 17.86 13.86 26.36
Proportion accounting for Guangdong (%) 4.42 2.84 10.26
2100 Low-estimated losses (×104 tons) 22.98 1.06 157.81
Proportion accounting for the study area (%) 8.75 5.96 14.91
Proportion accounting for Guangdong (%) 2.17 1.22 5.80
High-estimated losses (×104 tons) 47.39 2.51 280.74
Proportion accounting for the study area (%) 18.04 14.04 26.53
Proportion accounting for Guangdong (%) 4.47 2.88 10.33
2,782,900tons or 26.3% in the Pearl River Delta, and more than 10% in Guangdong Province. The next greatest loss is for rice, which reaches 210,900 tons in the low-estimated scenario, accounting for 8.03% and 1.99% in the Pearl River Delta and Guangdong Province, respectively. When high-estimated, the loss increases to 467,400 tons with proportion of 17.79% and 4.41%. The changes in peanut yield loss and its proportion is similar to that of rice, and the yield loss in the high-estimation scenario is more than twice the loss in the low-estimation scenario.
Next, we consider the low-estimation scenario as an example. In contrasting different years in the future, the vegetable yield loss in 2100 increases by 12.33% as compared with that in 2030 with rising sea level and storm surges, experiencing the greatest increase in the three types of crops. The rice yield loss is the second largest, and the loss in 2100 is 8.96% greater than that in 2030, and the peanut loss increases by 6.31%. The results show that with increasing storm surge disasters, crop damage from the disasters would intensify, and the damage to agriculture in the entire region would increase severely. The situation is closely related to the planting structure. In this region, the sown area proportion of vegetables is generally high, thus it is more likely to be affected by storm surges, leading to large damaged areas and high yield loss. The loss of rice also cannot be ignored because the timing of storm surges has a distinct overlap with the rice growing season, especially late rice. The external forces caused by storm surges would lead to rice lodging, which can reduce the yield and quality of rice crops, even killing the rice, causing huge losses.

4 Discussion

The scope of submerged farmlands in the Pearl River Delta region shows an overall expanding trend in the future. The study area is located north of the South China Sea. The climate warming causes an obvious sea level rise, and would inevitably lead to intensifying storm surges (Shi et al., 2012). We can now foresee that the scope of the disaster will expand, so it is necessary to strengthen the monitoring, prevention, and management of storm surge disasters.
Storm surges cause large tracts of farmlands to be submerged and destroyed, and are the most important cause for agricultural losses. In addition, since parts of submerged farmlands and agriculture irrigation systems would be inundated with seawater, the salt content in the soil and irrigation water would rise sharply (Fang et al., 2007; Ye et al., 1999), affecting crop growth and regional agricultural production. This type of influence is a cumulative process, which is not taken into account in this study.
After establishing the loss evaluation model of farmland yield, we used the basic data, including land use status, crop planting areas, and crop yield, and took the increasing of sea level rise and storm surge as variables. Then, we evaluated and predicted the submerged farmland scope and yield loss and how their trends are affected by climate change. However, the interaction among key variables, including submerged area and macro adjustment of future crop plantation were not considered, and the spatial and temporal changes in agricultural losses influenced by the above interaction were not analyzed, either. Land use and changes in planting structure are unpredictable, and their characteristics are too difficult to estimate. Planting structure is especially affected by multiple functions of the market economy and government decision-making. Therefore, this study assumes that the future planting industrial structure and agricultural production technology in the Pearl River Delta region will not experience any fundamental changes. This study mainly focuses on the changing trends in farmland losses from sea level rise and storm surges caused by global climate change. In particular, this study attempts to highlight the establishment of a loss evaluation model of farmland yield through determining parameters such as the submerged scope of farmlands, crop planting proportion, and loss ratio of different crops for different submerged heights so that we can pertinently apply loss evaluation to agricultural loss due to storm surge disasters. Based on this, the effects of storm winds in the storm surge, land use, planting structure, and other parameters were not considered. In subsequent further studies, we can try to discuss and analyze the spatial and temporal change characteristics of agricultural losses affected by other factors such as changes in planting structure.
With its significant position and high risk of storm surge disasters, the Pearl River Delta region has attracted fully attention to the region’s storm surge research. Current research commonly focuses on comprehensive risk assessment of storm surge disasters in terms of nature, society, economy, culture, and policy (Zhao et al., 2007). In terms of submerged farmlands as related to agricultural production, in this study we quantitatively evaluated and analyzed the agricultural loss caused by storm surges and the future trends based on the land-use data for 2010, future sea level rise and storm surge data, local crop structure, rotation patterns, and yield loss ratios under different submerged heights obtained by field survey and questionnaires. The results will help obtain a clear understanding of the effects of storm surges on crops and agriculture, and draw attention from relevant departments to the potential impact of sea level rise. Furthermore, the results will also provide references for disaster prevention, disaster management, post-disaster compensation, and sustainable agricultural development, which is beneficial to guiding the adjustment of agricultural planting structure, improve disaster prevention and resilience, conserve and rationally utilize farmland resources, and further reduce direct agricultural losses from storm surges. Storm surges in the Pearl River Delta region are severe, and would cause great direct agricultural losses, making it harder to work on disaster prevention and mitigation (Yu et al., 2009). On the basis of the evaluation and analysis of storm surge disasters and losses, disaster mitigation for this region should involve the following: 1) The most important action would be to strengthen engineering measures to defend against storm surges. For example, we could construct a moisture-proof seawall and coastal floodgate along the coastal areas in Jiangmen, Huizhou, and Shanwei. In the event of a storm surge, these cities and farmlands would be submerged, and the agricultural losses would be huge. It is necessary to appropriately raise the standards of bund construction, in order to minimize the damage and losses caused by storm surge disasters. 2) Coastal ecological protection should be strengthened, and a coastal shelter forest system should be constructed. Coral reefs and mangroves are natural cover to protect the coast from tide wave erosion, so the relevant departments should strengthen biological measures for preventing storm surge disasters. 3) Storm surge observation stations should be constructed in heavy disaster areas to strengthen capabilities in monitoring, early warning, and forecasting of disasters.

5 Conclusions

Taking the Pearl River Delta region in Guangdong as the study area, in this paper we established an evaluation model of farmland yield loss caused by sea level rise and storm surges, and estimated and analyzed the spatial distribution and farmland losses for different scenarios in the years 2030, 2050, and 2100, using a digital elevation model, land-use data, local crop structure, rotation patterns, and yield loss ratios under different submerged heights obtained via field survey and questionnaires. This paper reveals the impact of sea level rise and storm surge disasters on agriculture in the context of global climate change, in order to provide scientific basis for positioning and quantification for regional crop planting distribution and production, and disaster prevention and mitigation.
(1) In terms of the overall submergence: The total area of submerged farmlands in the Pearl River Delta region is 95,188.39 ha in the low-estimation scenario and 137,726.69 ha in the high-estimation scenario in 2030, increasing 0.25% and 0.26% in 2050, and 0.63% and 0.70% in 2100. In the city administrative units, with the increasing sea level rise and storm surges, the areas of submerged farmlands in Guanghzou and Zhuhai increase a little, but those in Yangjiang, Foshan, and Dongguan increase more obviously from 2030 to 2100.
(2) In terms of the future grade distribution of submerged heights in the Pearl River Delta region each year: With the rise of sea level, farmlands with lower submerged heights in each city in the Pearl River Delta region will decrease, but the farmlands with higher submerged heights will increase. The higher the submerged height, the greater the agricultural losses. Obviously, the damage to agriculture caused by storm surges would become more severe.
(3) In terms of the loss of main crops: The yield loss of rice is the highest in Jiangmen. Yield losses of vegetables at high proportions occur in Shanwei, Jiangmen, and some other cities. Losses of peanut crops are commonly low, but relatively high in Jiangmen, Guanghzou, and Shanwei.
(4) The prediction of farmland yield losses states that: In the long term (2030-2100), the yield loss proportions of rice, vegetables, and peanuts show an increasing trend. The yield loss proportion of vegetables has the largest increase, followed by rice, and then peanuts. Thus, it can be seen that with intensifying sea level rise and storm surges, the damage to all types of crops will become more serious to varying degrees, and the agricultural losses for the entire Pearl River Delta region will become even more severe.

The authors have declared that no competing interests exist.

1
Chen Manrong, Wang Shaoping, 2000. Storm-tide disaster and its forecast in Shanghai City.Journal of Catastrophology, 15(3): 26-29. (in Chinese)

DOI

2
Chen Xiaohong, Chen Yongqin, 2002. Hydrological change and its causes in the river network of the Pearl River Delta.Acta Geographica Sinica, 57(4): 429-436. (in Chinese)lt;p>This paper aims to summarize and illustrate a variety of human-induced hydrologic and geomorphic changes in the Pearl River Delta (PRD) and to analyse the causes and effects.The hydrologic characteristics of the river network have been altered in the following three main aspects. First, stage has become higher or lower over the past decades in an uneven manner in the delta. From the early 1950s to the 1980s, scattered and small embankments were enlarged and combined to expand land mass and reduce flood hazards in the PRD. However, reduction of water surface area and concentration of flow into major channels generally caused stage to go up slightly. Secondly, corresponding to the stage changes, the stage-discharge relationship has been substantially modified, as evidenced by over 2 m drop of stage for the same amount of discharge. Thirdly, the ratio of flow partition into two channels at several river bifurcation points has continuously changed over the past decade. Closely associated with the hydrologic changes are alterations of river channel and estuarine morphologies. Such geomorphic changes primarily include noticeable or even alarmingly severe modification of river channel bed, extension of river mouth and contraction of estuary in the study region. It was found that the hydrologic and geomorphic changes that have occurred within a relatively short period of time are mainly consequences of a wide variety of human activities, coupled with influences of natural events, including (a) channel dredging of sand for construction usage, (b) combination of embankments and construction of dams, (c) channel constriction and reduction or complete loss of floodplain, (d) sea level rise, and (e) channel bed erosion by record floods.</p>

DOI

3
China National Oceanic Administration (CNOA), 2005-2014. China Marine Disaster Bulletin [EB/OL], .

4
Dong Jianxi, Li Tao, Hou Jingminget al., 2014. The characteristics of temporal and spatial distribution of storm surge in Guangdong Province and storm surge hazard study at Yangjiang City.Acta Oceanologica Sinica, 36(3): 83-93. (in Chinese)The characteristics of temporal and spatial distribution of storm surge in Guangdong Province are studied by historical storm surge. The result indicate that most of storm surge occurred in July and September. The frequency and intensity of storm surge in Leizhou Island are higher than other places in Guangdong Province. The main storm surge disaster occurred from July to October,the districts effected seriously by storm surge are Yangjiang and Leizhou Island. In addition,a study on storm surge hazard research of Yangjiang has been carried out,the result show storm surge effected by a typhoon with central pressure of 970 hPa and 940 hPa is 185 cm and 310 cm respectively.

DOI

5
Dong Sheng, Gao Junguo, Li Xueet al., 2015. A storm surge intensity classification based on extreme water level and concomitant wave height.Journal of Ocean University of China, 2(2): 237-244.

DOI

6
Fang Hao, Li Shanfeng, Ye Xiaobin, 2007. The evaluation on economic loss caused by storm tides in Tianjin.Marine Environmental Science, 26(3): 271-274. (in Chinese)

DOI

7
Feng Weizhong, Zhang Juan, You Daweiet al., 2013. A discussion on reasons for impact of over-estimated sea level rise on storm surge disaster forecasting of the Pearl River Estuary.Tropical Geography, 33(5): 640-645. (in Chinese)This paper collected the historical tidal data and the actual loss data of storm surge disasters of the Pearl River Estuary, and made an analysis on the sea level rise values from IPCC-AR4 and some evaluation reports according to marine and hydrology standards. The analysis identifies that some papers have overestimated the effect of sea level rise on storm surge disaster forcasting of the Pearl River Estuary. The reasons are as follows: 1)There’re some errors in report [10]: a. AAL/GDP was defined as a linear relationship, GDP and AAL/GDP were used to compute AAL. That is logically wrong, because storm surge disaster loss does not increase year by year, and it is not directly related to GDP growth. b. The 2005 values of per capita annual income in Guangzhou and Shenzhen were both estimated to be $ 6193, which is a serious high valuation, about 50% higher than the actual value. c. The evaluated values of storm surge water level are obviously too high. 2) The following are the errors in [19] and [20]. a. the evaluation method to directly overlay the sea level rise value and return period tidal level is not scientific. b. The estimations of global sea level rise in 2100 have no basis. 3) The historical highest value of the recorded tidal level in [21] may be too high.

8
Gan Shendong, Zhang Weisheng, Zong Huchenget al., 2012. Analysis of typhoon storm surge disasters along the south China coast and disaster prevention measures.Hydro-science and Engineering, (6): 51-58. (in Chinese)Such aspects as formation characteristics,the cause of the disasters,the law of disaster loss,disaster intensity and impact factors of the typhoon storm surge are systematically summarized in this paper.Especially the characteristics of the typhoon storm surge-induced disasters from 1989鈥2009 are analyzed,and then it is pointed out that both the frequency and the intensity of the typhoon storm surge disasters have an increasing trend along the south China coast in recent years,so do those of the super typhoon storm surges.Finally,we discuss how to efficiently defend against the disasters caused by typhoon storm surges so as to give a basis for prevention and defense against the disasters induced by the typhoon storm surges in the Zhujiang River delta and Hainan Province,which often suffer great losses from typhoon storm surges.

DOI

9
Genovese E, Green C, 2014. Assessment of storm surge damage to coastal settlements in Southeast Florida.Journal of Risk Research, 18(4): 407-427.Coastal cities are growing at a very rapid pace, in terms of both population and physical assets, and great uncertainty surrounds the future evolution of hurricane intensity and sea-level rise. The combination of these trends will contribute to large financial losses due to property damage in the absence of specific protections. Southeast Florida represents a clear hot spot of coastal flood exposure: more than 5鈥塵illion inhabitants live in the counties of Miami Dade, Broward, and Palm Beach, and the population is still growing. It is also a low-lying area where tropical hurricanes hit frequently. This article illustrates a methodology to assess coastal flood damage in urban settlements and it aims to determine more general lessons useful for all coastal cities. We consider the impact of different storm surges predicted by the SLOSH model and investigate flood risk considering different types of hurricanes. For each event, we apply a specific damage function and determine whether the considered storm surges potentially lead to an asset loss, considering both properties and their contents. The results show that, in the absence of protections, losses will be very high for large storm surges, reaching up to tens of billions of US dollars. In the second part of the analysis, we demonstrate how economic impact changes when protections are built up, considering different heights of protections. These results could be used as inputs into a robust decision-making process to determine the future of coastal protection in southern Florida.

DOI

10
Guo Kaiying, 2013. Assessment on storm surge disaster’s economic losses in our country [D]. Qingdao: Ocean University of China. (in Chinese)

11
Han Xibin, Long Jiangping, Li Jiabiaoet al., 2010. Research progress on the vulnerability of the Pearl River Delta.Tropical Geography, 30(1): 1-7. (in Chinese)

DOI

12
He Lei, Li Guosheng, Li Kuoet al., 2014. Changes and trends of sea level in the Pearl River Delta in the last 50 years.Geographical Research, 33(5): 988-1000. (in Chinese)Low spatial resolution of tide gauge records and shortness of satellite altimetry data are the main obstacles in studying regional long sea level change. The present study proposes a reconstruction of consistent regional sea level anomalies(CRSLA) in the Pearl River Delta over the period 1959-2011 by combining satellite altimetry dataset with tide gauge records using empirical orthogonal function(EOF) and principle components analysis method. The results indicate that the reconstruction method addresses issues such as the relative shortage of satellite altimetry data and the sparse and discontinuous nature of tide gauge records, demonstrating the applicability of this technique in investigation of long-term sea level change. Moreover, the rate of regional sea level rise obtained based on CRSLA(4.08 mm/yr) indicates acceleration over recent decades. Compared with the estimation from single tide gauge, the reconstruction explains the leading characteristics of regional sea level change with a low noise level. Both river flow and El Ni?o-Southern Oscillation events have considerable impacts on sea level variability in the Pearl River Delta.

DOI

13
He Lei, Li Guosheng, Li Kuoet al., 2015. Multi-scale prediction of regional sea level change based on EEMD and BP neural network.Quaternary Sciences, 35(2): 374-382. (in Chinese)lt;p>The statistical model is one of the primary methods for sea level prediction. However, the conventional methods are still considered insufficient due to the complexity of the unstable and nonlinear sea level time series, and the prediction accuracy needs to be improved. Zhapo tide gauge (21&deg;35'N,111&deg;50'E)is a standard tide gauge with long records in the Pearl River delta, China. In this study the monthly records (01/1959~12/2011) of Zhapo, which was collected from Global Sea Level Observing System (GLOSS), was taken as an example, a hybrid method combining the data analysis method ensemble empirical mode decomposition (EEMD) and the artificial neural network (ANN) with back propagation algorithm (BP) was proposed to improve the prediction accuracy of sea level. EEMD extracted the frequency contributions called intrinsic mode functions (IMF) from the targeted time series oscillatory signal according to their unique fluctuation characteristic. 9 IMFs were obtained from the series of Zhapo tide gauge by using EEMD, and 6 of them passed the significance test on the level of 95%, suggesting that these 6 IMFs have statistical meaning. And the corresponding cycles such as seasonal cycle, semi-annual cycle, annual cycle, ENSO event cycle, semi nodical period and nutation cycle and so on are the significant characteristics in sea level change around Zhapo. The 6 IMFs were taken as the input factors of the BP neural network used for prediction. A BP neural network with three layers, which was optimized by setting the essential parameters such as the number of the hidden layers and the number of neurons in each layer, the learning rates, the momentum factor, and the number of training iterations and so on, was adopted in this study for modeling the sea level prediction. By reconstructing the outputs of the BP neural network, the prediction of the original time series was obtained. To evaluate the accuracy of the hybrid method, two predictions produced by the hybrid method and BP neural network directly were conducted in this paper. The results show that EEMD can extract the multiple time scales from the original time series, and the BP neural network is applicable for future sea level prediction. Comparing with the prediction by using BP neural network directly (<em>R</em>=0.76, RMSE=36.74mm, ME=-3.46), the EEMD-BP hybrid method performs better (<em>R</em>=0.89, RMSE=28.16mm, ME=2.31). The results suggest that EEMD-BP model significantly improves the prediction accuracy, and the preprocessing such as smoothing and denoising is strongly recommended for the prediction of unstable and nonlinear time series. The results of this study also reveals that the sea level has increased at a rate of 2.22mm/a over the period 1959~2011 in the Pearl River delta, and the prediction shows that it is expected to increase to 2.75mm/a by 2050.</p>

DOI

14
Hu Changxin, Jin Yun, 2007. Quasi-periodicity and its forecast of windstorm tide disaster in Shanghai.Urban Roads Bridges & Flood Control, (4): 26-29. (in Chinese)

15
IPCC, 2013. Working Group 1 Contribution to the IPCC Fifth Assessment Report Climate Change 2013: The Physical Science Basis Summary for Policymakers.

16
Ji Zixiu, Shi Yafeng, 1996. Sea level rise, coastal disaster and coastal protection.Journal of Natural Disasters, 5(2): 56-64. (in Chinese)

17
Kleinosky L R, Yarnal B, Fisher A, 2007. Vulnerability of Hampton Roads, Virginia to storm-surge flooding and sea level rise.Natural Hazards, (40): 43-70.lt;a name="Abs1"></a>Sea-level rise will increase the area covered by hurricane storm surges in coastal zones. This research assesses how patterns of vulnerability to storm-surge flooding could change in Hampton Roads, Virginia as a result of sea-level rise. Physical exposure to storm-surge flooding is mapped for all categories of hurricane, both for present sea level and for future sea-level rise. The locations of vulnerable sub-populations are determined through an analysis and mapping of socioeconomic characteristics commonly associated with vulnerability to environmental hazards and are compared to the flood-risk exposure zones. Scenarios are also developed that address uncertainties regarding future population growth and distribution. The results show that hurricane storm surge presents a significant hazard to Hampton Roads today, especially to the most vulnerable inhabitants of the region. In addition, future sea-level rise, population growth, and poorly planned development will increase the risk of storm-surge flooding, especially for vulnerable people, thus suggesting that planning should steer development away from low-lying coastal and near-coastal zones.

DOI

18
Kong Lan, Chen Xiaohong, 2012. Status quo and impact of sea level rise and its countermeasures.Pearl River, (5): 35-42. (in Chinese)The climate change leads to sea level rise which threats coastal areas seriously,resulting in damage and losses with varying degrees.Sea level rise has become an important global environmental problem and attached great importance by all sectors of society.In this study,the research on the trends of global and Chinese sea level rise is summarized;the effects of sea level rise are analyzed.In order to prevent the enormous harm caused by sea level,specific countermeasures are made to prevent and treat sea level rise.If the prevention for the future was combined with the treatment of status quo,the hazards of sea level rise can been mitigated from the overall,which can ensure Chinese coastal resources,environmental,economic and social sustainable development in the twenty-first century.

19
Kong Lan, Chen Xiaohong, Zhang Qianget al., 2010. Impacts of rising sea level on water level changes along the Pearl River Estuary, China.Ecology and Environmental Sciences, 19(2): 390-393. (in Chinese)Water level changes across the Pearl River Delta are subject to uncertainty and ambiguity and are difficult to be predicted.However,water level changes in both space and time have tremendous influences on water resource management in the Pearl River Delta.In this case,based on long water level series at the Denglongshan station and long sea level series at the Zhapo station,we thoroughly analyzed correlations amongst mean water levels at the Denglongshan station,sea levels and tidal anomalies by using gray relational analysis technique.Our results indicate that the gray relational degree of the relation between sea level changes and annual mean water level is 0.736,implying considerable influences of sea level changes on the annual average water levels.Principle component analysis method was performed on the hydrological components such as streamflow of Makou+Sanshui,sea levels at the Zhapo station,and annual maximum water level,annual minimum water level,annual mean low water level and annual mean tidal anomalies at the Denglongshan station,and the results show that:1) the first component is tidal variations;2) the second component is rising sea level;and 3) the third component is annual maximum water level.The contribution rate of the second component represented by rising sea level to the annual mean water level is 20.1%.Therefore,we can say that the influence of the rising sea level on the annual mean water levels at the Denglongshan station is still considerable,though the influences from the rising sea level are somewhat smaller when compared to tidal variations.

DOI

20
Li Guosheng, Li Kuo, 2013. Integrated assessment on risk of storm surges in the central coastal area of Guangdong Province. Journal of Southwest University (Natural Science Edition), 35(10): 1-9. (in Chinese)

21
Li Kuo, Li Guosheng, 2010. Calculation of return period for storm surge in the Pearl River Delta Region.Progress in Geography, 29(4): 433-438. (in Chinese)lt;p>The Pearl River Delta Region is one of the few regions in our country which are seriously threatened by storm surges. Affected by global warming and sea-level rise, the return period for storm surge in this area is obviously changing. According to Gumbel and Pearson Ⅲ, the return periods of 11 tide stations for storm surge in the Pearl River Delta Region are calculated separately and the results are compared. Gumbel and Pearson Ⅲ distribution curves of extreme storm surge are mapped. The results show that the Gumbel distribution curves in most tide stations agree better with the experience frequency dots than Pearson Ⅲ distribution curves, but the Pearson Ⅲ distribution curves in the other tide stations agree better with the experience frequency dots than the Gumbel distribution curves. It is the best way to integrate Gumbel and Pearson Ⅲ methods. We analyze the basic characteristics of the return periods for storm surge in this area. Finally, we summarize the relationship between storm surges and the typhoon path, astronomical tide and the terrain. All the calculated results would be useful for the planning and design department to make decisions. This research would provide a scientific basis for the government for storm surge prediction, coastal engineering design and estimation of disaster demage.</p>

DOI

22
Lowe J A, Gregory J M, Flather, R A, 2001. Changes in the occurrence of storm surges around the United Kingdom under a future climate scenario using a dynamic storm surge model driven by the Hadley Centre climate models.Climate Dynamics, (18): 179-188.lt;a name="Abs1"></a>&#8194;A potential consequence of climate change is an alteration of the frequency of extreme coastal storm surge events. It is these extreme events which, from an impacts point of view, will be of more concern than the slow inundation of coastal areas by century scale changes in mean sea level. In this study, a 35&#8201;km resolution storm surge model of the North west European continental shelf region has been driven by winds and pressures from the Hadley Centre nested regional climate model. Simulations of both present day and future climate (the end of the twentyfirst century) have been performed. The results suggest that, in addition to the effect of rising mean sea level, at many locations around the United Kingdom coastline future changes in local meteorology will lead to further significant changes in the return periods of extreme storm surge events. At most sites, this meteorologically forced change represents a reduction in return period.

DOI

23
Nicholls R J, Hoozemans F M J, Marchand M, 1999. Increasing flood risk and wetland losses due to global sea-level rise: Regional and global analyses. Global Environmental Change: Human and Policy Dimensions, (9): 69-87.

24
Risouvan Eck N V, Kok M, 2001. Standard method for predicting damage and casualties as a result of floods, in The Netherlands Delft.Ministry of Transport Public Work and Water Management, 22-41.

25
Shi Cui, Chen Xiaohong, Zhang Qiang, 2012. Change-points of water levels in the Pearl River Delta in January and July for the last decades.Tropical Geography, 32(3): 233-240. (in Chinese)

DOI

26
Shi Guoqing, 1990. A discussion on loss rate of flood and its determination method. Journal of Economics of Water Resources, (2): 37-42. (in Chinese)

27
Sun Xiangping, 2008. China Offshore Regional Seas. Beijing: China Ocean Press, 157-158. (in Chinese)

28
Tan Lirong, 2012. Assessment on comprehensive vulnerability of storm surge disasters of China's coastal regions [D]. Shanghai: East China Normal University. (in Chinese)

29
Tang Chaolian, You Dawei, Chen Teguet al., 2009. Sea-level changes along the coast of Guangdong Province during 1986-2008.Tropical Geography, 29(5): 423-428. (in Chinese)

DOI

30
Wang Guodong, Kang Jiancheng, Yan Guodong, 2010. A review on risk assessment of storm surge of coastal cities.Journal of Catastrophology, 25(3): 114-118. (in Chinese)

DOI

31
Wang Kangfasheng, Yin Zhane, Yin Jie, 2011. Analysis on typhoon-induced storm surge vulnerability of China’s coastal areas on rising sea level background.Journal of Tropical Oceanography, 30(6): 31-36. (in Chinese)Coastal area is not only an important center of population, economic and social development of a country but also where natural disaster happens frequently. Based on the typhoon-induced storm surge data from 1989 to 2008, the SRTM3 DEM data, the county district data of 2009, 100 meter grid land-use data of 2005, square kilometer population and GDP data of 2003 of China’s coastal areas, the authors analyze the vulnerability of typhoon-induced storm surge to China’s coastal areas on rising sea level background. The authors use linear regression method to predict sea level rise, use regression method to predict the recurrence period of storm surge and the heights of climax tides, use altitude-area method to mark the area of inundated land, and use Geo-statistics method to show area, population and GDP of each vulnerable district. The results indicate that the Zhujiang River Delta, the Changjiang Delta, alluvial plain north of the Changjiang River in Jiangsu province, Laizhou Bay, Huanghe Delda, Bohai Bay and Liaodong Bay would be seriously influenced by the storm surges. So, much more attention should be paid to these areas in the near further. Agriculture land, water, and construction land are the most likely influenced land use by storm surges.

DOI

32
Wu Tao, Kang Jiancheng, Wang Fanget al., 2006. The new progresses on global sea level change.Advances in Earth Science, 21(7): 730-737. (in Chinese)<p>The research of global sea level change of the last 10 years has been comprehensively reviewed and the main results of it have been obtained:(1) the global sea level rising ratios was around 2.5 mm/a to 3.84 mm/a, and the main contribution is from the thermal expansion of sea water; (2) there were some space differences for sea level rise, and the value in the West Pacific Ocean and the East Indian Ocean was especially more 10 times higher than the global average; (3) the seasonal fluctuation of sea level was obvious in areas of the Pacific Ocean and the Atlantic Ocean with north latitude 30-40 degree. When&nbsp; the season of the highest sea level was compared with the term of the typhoon and hurricane occurring annually, it could be found&nbsp; that there were global dangerous seacoasts, which were vulnerable by sea level rise, located in the regions of the Northwest Pacific Ocean and the North Atlantic Ocean with north latitude 20-50 degree during the seasons of Typhoon in August and October. The region includes coast areas as Chinese Mainland East Seacoast, Japanese Seacoast, American East Seacoast, Mexico Bay Seacoast and Caribbean Seacoast.</p>

33
Wu Wei, Liu Qiuxing, Yu Fujianget al., 2012. Inundation risk assessment of typhoon storm surge along Taizhou coastal areas.Marine Forecasts, 29(2): 25-31. (in Chinese)

DOI

34
Xiao Qihua, Zhang Jianxin, Huang Dongmei, 2011. Fuzzy decision method of fast evaluation of urban storm surge disasters: Taking Xiamen City as an example.Journal of Catastrophology, 26(2): 77-80. (in Chinese)

DOI

35
Ye Lin, Yu Fujiang, 2002. The long-range change and forecast of storm surge disasters in China.Marine Forecast, 19(1): 89-96. (in Chinese)This paper gives the statistics of storm surge disasters which happened along the China coastal line in history and after 1949. Based on the statistics the distributions of storm surge disasters in time and space and its changes of season will also be given The methods of

36
Ye Xujun, Wang Zhaoqian, Wang Chenghonget al., 1999. Impacts of typhoon storm on farmland ecological environments in the eastern coastal area of Zhejiang Province and their countermeasures.Eco-Agriculture Research, 7(4): 40-42. (in Chinese)

37
Yin Jie, 2011. Study on the risk assessment of typhoon storm tide in China coastal area [D]. Shanghai: East China Normal University. (in Chinese)

38
Yin Kedong, Wang Hui, 2010. The principal component model research of storm surge disaster loss evaluation.Statistics and Decision, (19): 63-64. (in Chinese)

39
Yin Kedong, Wei Qian, Li Xingdong, 2012. The evaluation techniques of the socio-economic loss caused by storm surge disaster.Marine Environmental Science, 31(6): 835-837, 842. (in Chinese)

40
You Dawei, Tang Chaolian, Chen Teguet al., 2012. Sea level changes along Guangdong coast over the last century.Tropical Geography, 32(1): 1-5. (in Chinese)

DOI

41
Yu Donghua, Wu Chaoyu, Lv Bingquanet al., 2009. Disaster of storm surge and the countermeasures in Guangdong coastal areas. Journal of Zhejiang Ocean University (Natural Science), 28(4): 440-444, 449. (in Chinese)

42
Zhao Lingdi, Chen Minghua, 2011. Risk zoning of economic loss caused by storm surge in coastal provinces and cities of China.Journal of Natural Disaster, 20(5): 100-104. (in Chinese)Storm surges is one of the major natural disasters in coastal area of China,which has caused incalculable loss.In this paper,we selected 11 coastal provinces(municipalities,autonomous regions,)'storm surge data from the year 1989 to 2008 as a research sample,while the cluster analysis based on factor scores and evaluation of entropy methods were used to evaluate the disaster risk of storm surge in these areas.According to extent of loss,these areas can be divided into three kinds: Shanghai has the smallest risk of storm surge disaster as the First District;the provinces of Hainan,Fujian,Zhejiang and Guangdong have the greatest risk as the Second District;the other provinces(municipality,autonomous region) have the medial risk as the Third District.This result gives us a new perspective to understand the occurrence of storm surge and the loss caused by it.

DOI

43
Zhao Qingliang, Xu Shiyuan, Wang Junet al., 2007. A review of risk assessment of storm surge on coastal cities.Progress in Geography, 26(5): 32-40. (in Chinese)lt;p>The United Nations International Decade for Natural Disaster Reduction (IDNDR) gives rise to an increasing level of attention to the risks posed by a range of natural hazards and the development of strategies by which to reduce those risks. After many years of development, risk assessment of storm surge becomes a distinctive study field and an important part of risk management of storm surge. At present, more focus has been put on the numerical prediction of storm surge, the estimation of the height of storm surge and return period, the assessment of the hazard impact and the exposure and the vulnerability of the hazard- affected bodies, the regionalization of the natural disaster risk and the assessment of disaster losses, instead of the study of the comprehensive risk assessment of storm surge in coastal cities and the consequential disaster chain. Forming a indicator system for the risk assessment on the point of nature, society, economy and so on and making a comprehensive storm surge risk research based on 3S are an important field of storm surge study. This paper points out that the future study should be to develop scenario- based methodologies for storm surge risk assessment and the auxiliary risk- based decision supporting systems, to enhance compilation of the map of retreat and to set up sustained disaster risk management system in metropolises. The quantitative assessment of disaster prevention programs and disaster losses should also be stressed.</p>

DOI

44
Zhao Xin, Wang Xiaoxia, Li Li, 2011. Assessment and analysis of storm surge disaster economic losses: A case of Shandong Province.Chinese Fisheries Economics, 29(3): 91-97. (in Chinese)

DOI

45
Zuo Jinzhong, 2003. A discussion on flood disaster evaluation methods.Shanxi Water Resources, (1): 7-8. (in Chinese)

Outlines

/