Orginal Article

Changes in inland lakes on the Tibetan Plateau over the past 40 years

  • FANG Yue 1, 2, 3 ,
  • Cheng Weiming , 2, 4 ,
  • Zhang Yichi , 5 ,
  • WANG Nan 2, 3 ,
  • ZHAO Shangmin 6 ,
  • ZHOU Chenghu 1, 2 ,
  • CHEN Xi 1 ,
  • BAO Anming 1
Expand
  • 1.Xinjiang Institute of Ecology and Geography, CAS, Urumqi 830011, China
  • 2.State Key Laboratory of Resources and Environmental Information System, Institute of Geographic Sciences and Natural Resources Research, CAS, Beijing 100101, China
  • 3.University of Chinese Academy of Sciences, Beijing 100049, China
  • 4.Jiangsu Center for Collaborative Innovation in Geographical Information Resource Development and Application, Nanjing 210023, China
  • 5.Key Laboratory of Water Cycle and Related Land Surface Processes, Institute of Geographic Sciences and Natural Resources Research, CAS, Beijing 100101, China
  • 6.Department of Surveying and Mapping, College of Mining Technology, Taiyuan University of Technology, Taiyuan 030024, China

Author: Fang Yue (1986-), PhD, E-mail:

*Corresponding author: Cheng Weiming (1973-), Professor, E-mail: ; Zhang Yichi (1978-), E-mail:

Received date: 2015-01-15

  Accepted date: 2015-10-10

  Online published: 2016-04-25

Supported by

The Major State Basic Research Development of China, No.2015CB954101 National Mountain Flood Disaster Investigation Project, No SHZH-IWHR-57 The National Science and Technology Basic Special Project, No.2011FY11040-2 National Natural Science Foundation of China, No.41171332 The Surveying and Mapping Geoinformation Nonprofit Specific Project, No.201512033

Copyright

Journal of Geographical Sciences, All Rights Reserved

Abstract

Inland lakes and alpine glaciers are important water resources on the Tibetan Plateau. Understanding their variation is crucial for accurate evaluation and prediction of changes in water supply and for retrieval and analysis of climatic information. Data from previous research on 35 alpine lakes on the Tibetan Plateau were used to investigate changes in lake water level and area. In terms of temporal changes, the area of the 35 alpine lakes could be divided into five groups: rising, falling-rising, rising-falling, fluctuating, and falling. In terms of spatial changes, the area of alpine lakes in the Himalayan Mountains, the Karakoram Mountains, and the Qaidam Basin tended to decrease; the area of lakes in the Naqu region and the Kunlun Mountains increased; and the area of lakes in the Hoh Xil region and Qilian Mountains fluctuated. Changes in lake water level and area were correlated with regional changes in climate. Reasons for changes in these lakes on the Tibetan Plateau were analyzed, including precipitation and evaporation from meteorological data, glacier meltwater from the Chinese glacier inventories. Several key problems, e.g. challenges of monitoring water balance, limitations to glacial area detection, uncertainties in detecting lake water-level variations and variable region boundaries of lake change types on the Tibetan Plateau were discussed. This research has most indicative significance to regional climate change.

Cite this article

FANG Yue , Cheng Weiming , Zhang Yichi , WANG Nan , ZHAO Shangmin , ZHOU Chenghu , CHEN Xi , BAO Anming . Changes in inland lakes on the Tibetan Plateau over the past 40 years[J]. Journal of Geographical Sciences, 2016 , 26(4) : 415 -438 . DOI: 10.1007/s11442-016-1277-0

1 Introduction

Alpine lakes in remote alpine regions generally remain in a natural state because there is minimal impact from human activities. Therefore, these lakes are regarded as sensitive indicators of global climate change (Guo et al., 2003; Hu et al., 2007) and variations in the level and area of alpine lakes reflect regional change (Ding et al., 2006). Moreover, alpine lakes are important water resources in many arid and semiarid regions (Fan and Li, 1984; Qin, 1999) and changes in these resources have significant effects on local climate (Hu et al., 2002; Angel and Kunkel, 2010). Over the past 40 years, climate change has been an important factor in the evolution of alpine lakes (Shi and Zhang, 1995) because the water cycle in drainage basins has being changed related to rainfall, evaporation, and meltwater from glaciers and snow (Ma et al., 2003). Therefore, it is important to understand the causes and effects of changes in alpine lakes.
Changes in alpine glaciers are another important indicator of climatic change. The nine mountain ranges of the Tibetan Plateau have a total of 36,734 glaciers and constitute the main alpine glacier area in the world (Liu et al., 2015). Many scientists have analyzed the relationship between climate change and glacier retreat based on topographic and remote sensing data (Aizen et al., 2007; Kutuzov and Shahgedanova, 2009; Wang et al., 2011). There has been a marked decrease in the area of alpine glaciers over the past 40 years (Bolch, 2007; Kong and Pang, 2012). A marked decrease in glacier area has also been observed in the mountains of the Tibetan Plateau in China (Bolch et al., 2010; Yao et al., 2013) and in the peripheral, lower-elevation ranges of Central Asia near densely populated forelands (Sorg et al., 2012).
A clear understanding of the impact of climate change on inland lakes and glacial retreat is crucial for the accurate evaluation of water resources and for the prediction of future changes. Numerous studies have shown that the surface areas of inland lakes in arid and semiarid regions have decreased considerably since 1950 (e.g., Fan and Li, 1984; Hu et al., 2002; Gao and Jia, 2005; Ding et al., 2006; Li et al., 2011; Bai et al., 2011; Kropáček et al., 2012). The levels of most lakes in the basin regions of Qinghai in China (Gao and Jia, 2005), Australia (Jones et al., 2001), Africa (Mercier et al., 2002), and parts of North America such as North Dakota (Donald and Thomas, 1997) have declined because of the combined effects of drought, warming, and human activities. Moreover, many lakes (e.g., Aibi Lake, Ayding Lake, and Lop Nur) in Xinjiang in northwest China are shrinking and some have dried up completely (Fan and Li, 1984; Qin, 1999; Bai et al., 2011). Conversely, water levels in a small number of mountain lakes in Xinjiang (Gao and Jia, 2005; Ding et al., 2006; Hu et al., 2007; Bai et al., 2011) and on the Tibetan Plateau (Liu et al., 2009; Zhang et al., 2011a; Wang et al., 2013; Zhang et al., 2014a; Yan and Zheng., 2015) have risen in response to increased precipitation and melt glacier (Aizen et al., 1996; Kutuzov and Shahgedanova, 2009). The results of these studies indicate that lakes could be affected by climate change.
Traditionally, lake change can be monitored using direct observations from meteorological or hydrological stations (Chu et al., 2012; Meng et al., 2012; Qi and Zheng, 2006; Zhang et al., 2011b), which can address changes in lake water levels and shorelines at local spatial and temporal scales. However, most lakes on the Tibetan Plateau are located in sparsely populated areas and data from systematic observations are lacking. Thus, Many scientists obtained changed water level and area of lakes on the Tibetan Plateau by means of remote sensing techniques and field survey (Liu et al., 2008; Wang et al., 2011; Zhang et al., 2011a; Wang et al., 2013; Zhang et al., 2014a; Yan and Zheng, 2015), but there are few researches on the regional temporal differences and spatial heterogeneity of these alpine lakes, and reasons for changes in these lakes were rarely analyzed in detail from water-supplying factors, such as precipitation and glacier meltwater over the past decades.
Thus, the purpose of this article is to analyze the temporal differences and spatial heterogeneity of alpine lakes on the Tibetan Plateau, to address the reasons for changes in these lakes in detail using data from previous research over the past 40 years. Firstly, typical 35 alpine lakes on the Tibetan Plateau were selected to investigate changes in lake water level and area. The temporal differences of these lakes could be divided into several groups according to falling or rising tendency for area variations. The spatial heterogeneity of area changes of these lakes was analyzed by means of geomorphological regions. And the water level changes of these lakes were analyzed by means of former research. Secondly, reasons for changes in these lakes on the Tibetan Plateau were analyzed, including precipitation and evaporation from long-term meteorological records, glacier meltwater from the first and second Chinese glacier inventories. Finally, some key problems, e.g. challenges of monitoring water balance, limitations to glacial area detection, uncertainties in detecting lake water-level variations and variable region boundaries of lake change types on the Tibetan Plateau were discussed. This research has most indicative significance to regional climate change.

2 Regional setting

The Tibetan Plateau, referred to as the “Water Tower of Asia” and “The Third Pole”, has important roles in global climate dynamics and the Asian monsoon system (Krause et al., 2010). The Tibetan Plateau has both the highest number of lakes (1055, 39.2%) and the largest total lake area (41,831.7 km2, 51.4%) among the regions of China. Of these 1,055 lakes, 389 are more than 10.0 km2 each and occupy a total area of 39,603.7 km2 (Ma et al., 2010). The highland region of the Tibetan Plateau are the highest terrain in China, which includes plains, tablelands, hills and mountains with mean elevations more than 4000 m and 75% feature glaciers and periglacial landforms. The present study area can be divided into six geomorphological regions according to tectonic and landform features: the Himalayan Mountain region, the Kunlun Mountain region, the Qilian Mountain region, the Karakoram Mountain region, the Qaidam Basin, and the Changtang Plateau (Li et al., 2013) (Figure 1).
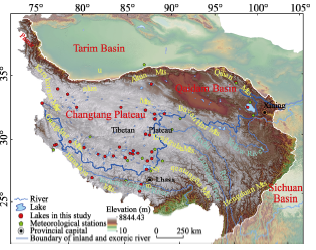
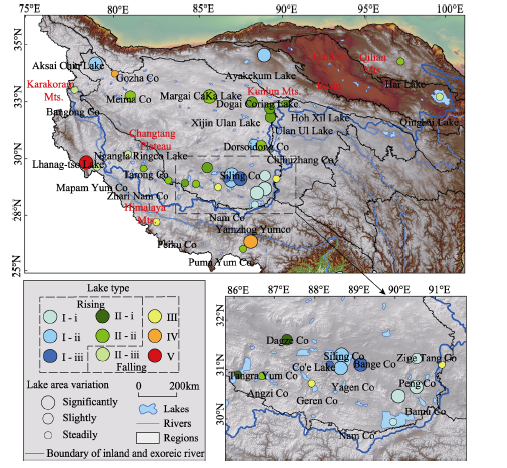
Figure 1 Location and inland lakes of the Tibetan Plateau in China

3 Materials

3.1 Documented lake changes

Lake water level and area data for 35 lakes on the Tibetan Plateau recorded over the past 40 years were obtained from previous studies and used to investigate changes in the lakes associated with climate change and human activities. Details of the 35 lakes and the previous studies are summarized in Table 1.
Table 1 Summary of the 35 alpine lakes on the Tibetan Plateau included in the present study
Lake Name Elevation(m) Supplement Geomorphological regions Sources
Qinghai Lake 3200 Runoff, spring, precipitation Qaidam Basin Shao et al. (2007); Liu et al. (2008) ; Song et al. (2013); Zhang et al. (2014a); Yan et al. (2015)
Har Lake 4078 Glacier melting, precipitation Qilian Mountains Guo et al. (2003); Shao et al. (2007); Song et al. (2013);Yan et al. (2014)
Ulan Ul Lake 4917 Runoff, glacier melting Changtang Plateau Shao et al. (2007); Song et al. (2013); Jiang et al. (2014); Yan et al. (2014)
Xijin Ulan Lake 4769 Runoff, glacier melting Changtang Plateau Wang et al. (2013); Yao et al. (2013);
Yan et al. (2014)
Dogai Coring Lake 4782 Glacier melting Changtang Plateau Wang et al. (2013); Yao et al. (2013);
Yan et al. (2014)
Hoh Xil Lake 4878 Glacier melting Changtang Plateau Wang et al. (2013); Yao et al. (2013);
Yan et al. (2014)
Chibuzhang Co 4931 Glacier melting, runoff Changtang Plateau Shao et al. (2007); Wan et al. (2014); Yan et al. (2014)
Ayakekum Lake 3876 Glacier melting Altun Mountains Shao et al. (2007); Song et al. (2013);
Li et al. (2014)
Aksai Chin Lake 4990 Runoff Changtang Plateau Li et al. (2014)
Siling Co 4530 Glacier melting, precipitation Gangdise Mountains Shao et al. (2007); Bian et al. (2010); Zhang et al. (2011c); Liao et al. (2013); Song et al. (2013)
Nam Co 4718 Precipitation,
glacier melting
Gangdise Mountains Wu et al. (2007); Niu et al. (2008);
Chen et al. (2009); Zhu et al. (2010);
La et al. (2011); Ma et al. (2012);
Liao et al. (2013); Song et al. (2013); Song et al. (2014)
Yamzhog Yumco Lake 4440 Precipitation, glacier melting Himalaya
Mountains
Liu (1995); Shao et al. (2007);
Bian et al. (2009); Chu et al. (2012); Liao et al. (2013); Song et al. (2013); Zhao et al. (2014)
Zige Tang Co 4560 Runoff,
precipitation
Tanggula
Mountains
Lei et al. (2009); Song et al. (2013)
Zhari Nam Co 4613 Glacier melting, precipitation Changtang Plateau Shao et al. (2007); Zhang et al. (2011b); Liao et al. (2013); Song et al. (2013); Deji et al. (2014); Zhang et al. (2014b)
Tangra Yum Co 4528 Precipitation, runoff Changtang Plateau Shao et al. (2007); Huang et al. (2012); La et al. (2012); Liao et al. (2013); Song et al. (2013)
Cuona Lake 4800 Runoff,
precipitation
Changtang Plateau Huang et al. (2012)
Mapam Yum Co 6638 Glacier melting, precipitation Himalayan
Mountains
Guo et al. (2007); Niu et al. (2008);
Ye et al. (2008); La et al. (2011);
Song et al. (2013); Li et al. (2014); Zhang et al. (2014b)
Lhanag-tso Lake 4573 Runoff Himalayan
Mountains
La et al. (2011); Liao et al. (2013)
Co’e Lake 4562 Runoff,
precipitation
Gangdise Mountains Bian et al. (2010); Huang et al. (2012)
Yagen Co 4866 Runoff,
precipitation
Tanggula Mountains Bian et al. (2010)
Dorsoidong Co 4749 Glacier melting, runoff Tanggula Mountains Song et al. (2013)
Bange Co 4527 Runoff,
precipitation
Changtang Plateau Huang et al. (2012)
Dagze Co 4461 Glacier melting, precipitation Changtang Plateau Qiao et al. (2010); Song et al. (2013)
Geren Co 4650 Runoff,
precipitation
Gangdise Mountains Huang et al. (2012)
Angzi Co 4683 Runoff,
precipitation
Changtang Plateau Huang et al. (2012); Song et al. (2013)
Bamu Co 4555 Runoff,
precipitation
Tanggula Mountains Huang et al. (2012)
Peng Co 4522 Runoff,
precipitation
Tanggula Mountains Huang et al. (2012)
Margai CaKa Lake 4785 Precipitation, glacier melting Changtang Plateau Li and Sheng (2013)
Meima Co 4920 Glacier melting Changtang Plateau Li and Sheng (2013)
Ngangla Ringco Lake 4715 Glacier melting, precipitation Gangdise Mountains Shao et al. (2007); Zhang et al. (2014b); Song et al. (2013)
Puma Yum Co 5030 Runoff, glacier melting Himalayan
Mountains
Niu et al. (2008); Liao et al. (2013); Song et al. (2013); Zhang et al. (2014b)
Bangong Co 4242 Runoff, glacier melting Kunlun Mountains Shao et al. (2007); Song et al. (2013)
Peiku Co 4590 Runoff,
precipitation
Himalayan
Mountains
Liao et al. (2013); Zhang et al. (2014b)
Gozha Co 5080 Glacier melting Changtang Plateau Liao et al. (2013)
Tarong Co 4566 Precipitation, glacier melting Himalayan
Mountains
Zhang et al. (2014b)

3.2 Meteorological data

Meteorological data from 1970 to 2010 were obtained from the China Meteorological Data Sharing Service System (http://cdc.nmic.cn/home.do). In the present study, datasets of monthly 0.5° × 0.5° grid-based precipitation/temperature over China from 1970 to 2010 were selected to analyze climate changes in different regions on the Tibetan Plateau (Table 2).
Table 2 Locations of alpine lakes on the Tibetan Plateau
Regions Lakes
Himalayan Mountain region Ngangla Ringco Lake, Lhanag-tso Lake, Mapam Yum Co
Yamzhog Yumco Lake, Puma Yum Co, Cuona Lake, Peiku Co, Tarong Co
Karakoram Mountain region Bangong Co
Changtang Plateau Nam Co, Siling Co, Tangra Yum Co, Zhari Nam Co, Angzi Co, Geren Co, Yagen Co, Co’e Lake, Dagze Co, Bamu Co, Peng Co, Zige Tang Co, Bange Co, Dorsoidong Co, Chibuzhang Co, Ulan Ul Lake, Xijin Ulan Lake, Dogai Coring Lake, Margai CaKa Lake, Meima Co, Gozha Co, Aksai Chin Lake
Kunlun Mountain region Ayakekum Lake
Qaidam Basin Qinghai Lake
Qilian Mountain region Har Lake

3.3 Chinese glacier inventories

The first and second Chinese glacier inventories were compiled based on remote sensing images. Prior to the 2000s there were 46,298 glaciers with an area of 59,406 km2 in China (Liu et al., 2000). Currently there are 48,571 glaciers with a total area of 51,800 km2. About 80% of the total area of glaciers in China is distributed in an altitudinal band between 4,500 and 6,500 m above sea level, with regional differences depending on the general elevations of various mountains. The glaciers are spatially distributed among 14 mountain ranges and plateaus in Western China, including the Kunlun, Karakoram, and Himalayan Mountains (Liu et al., 2015).

4 Analysis of variations in lake area and water level

Because the absence of sufficient traditional observational data of alpine lakes on the Tibetan Plateau, the data analysis from previous research on water area and water level of 35 alpine lakes showed the consistency in the last 40 years. The lake changes presented an obvious spatial and temporal heterogeneity throughout the entire Tibetan Plateau.

4.1 Changes in lake water area of the Tibetan Plateau

4.1.1 Temporal heterogeneity of lake area
Based on temporal heterogeneity, changes in area of the large lakes on the Tibetan Plateau could be grouped into five types and six subtypes: rising (subtypes: linear rising, concave exponential rising, and convex logarithmic rising), falling-rising (subtypes: gentle falling-steep rising, steep falling-steep rising, and steep falling-gentle rising), rising-falling, fluctuating, and falling.
Lakes classified as rising (type I) showed marked increases in water area with substantial increasing in area by >30% in the past 40 years. Type I lakes classified as linear rising (subtype i) showed similar steady linear increases in area over the past 40 years. The type I (subtype i) lakes were Bamu Co, Peng Co, Zige Tang Co and Nam Co with increases in area of 35.32%, 30.96%, 20.22%, and 4.01%, respectively (Figure 2).
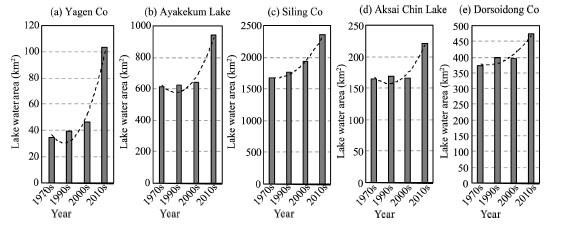
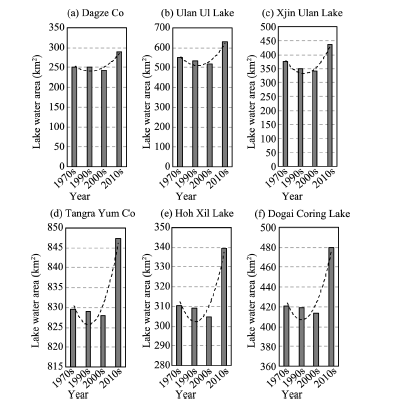
Figure 2 Variation in water area during the past 40 years for linear rising lakes (type I, subtype i)
Type I lakes classified as concave exponential rising (subtype ii) showed steady increases from the 1970s to the 2000s, but more pronounced increases in the 2010s. The type I (subtype ii) lakes were Yagen Co, Ayakekum Lake, Siling Co, Aksai Chin Lake, and Dorsoidong Co. Yagen Co, to the south of Siling Co, showed the largest increase in area of 194.99% (Bian et al., 2010). Siling Co, with an increase of 39.86%, has expanded by more than 600 km2 since the 1970s and has become the largest alpine lake in Tibet (Figure 3).
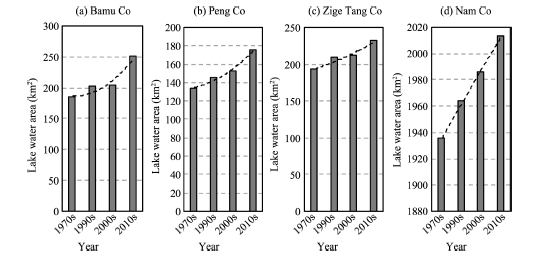
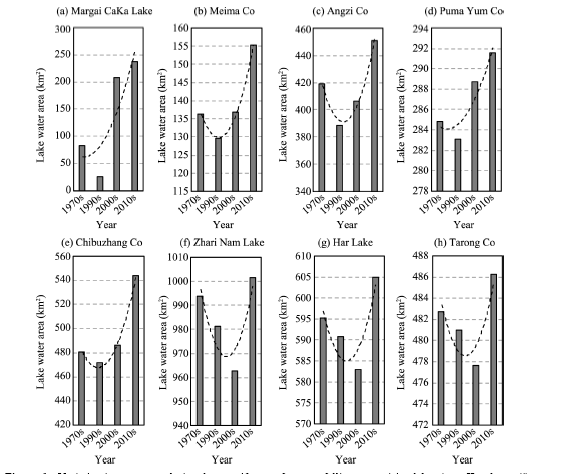
Figure 3 Variation in water area during the past 40 years for concave exponential rising lakes (type I, subtype ii)
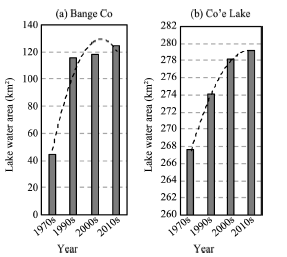
Figure 4 Variation in water area during the past 40 years for convex logarithmic rising lakes (type I, subtype iii)
Type I lakes classified as convex logarithmic rising (subtype iii) showed rapid increases in area from the 1970s to the 1990s but less dramatic increases since the 1990s. The type I (subtype iii) lakes were Bange Co and Co’e Lake (Figure 4). Bange Co showed a marked increase in area of 177.30% during the past 40 years.
Lakes classified as falling-rising (type II) showed decreases in area earlier during the study period followed by increases in area in recent years. Type II lakes classified as gentle falling-steep rising (subtype i) showed gradual decreases in area from the 1970s to the 2000s followed by marked increases in area since the 2000s. These lakes were Dagze Co, Ulan Ul Lake, Xijin Ulan Lake, Tangra Yum Co, Hoh Xil Lake and Dogai Coring Lake (Figure 5). Overall increases in area of Xijin Ulan Lake, Dagze Co, Ulan Ul Lake, and Dogai Coring Lake were 16.53%, 15.59%, 14.84%, and 14.22%, respectively (Yao et al., 2013).
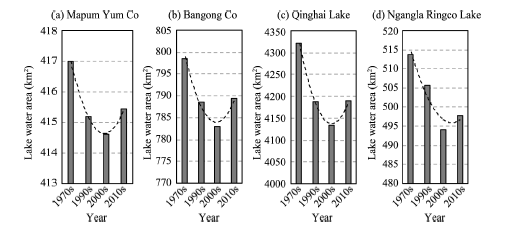
Figure 5 Variation in water area during the past 40 years for gentle falling-steep rising lakes (type II, subtype i)
Type II lakes classified as steep falling-steep rising (subtype ii) showed marked and rapid decreases in area from the 1970s to 1990s followed by marked and rapid increases. The type II (subtype ii) lakes were Margai CaKa Lake, Meima Co, Chibuzhang Co, Angzi Co and Puma Yum Co with overall increases in area of 186.40%, 13.78%, 13.24%, 7.16%, and 2.38%, respectively. Chibuzhang Co, Zhari Nam Co, Har Lake, and Tarong Co showed small overall increases in area during the study period (Figure 6).
Figure 6 Variation in water area during the past 40 years for steep falling-steep rising lakes (type II, subtype ii)
Type II lakes classified as steep falling-gentle rising (subtype iii) showed marked and rapid decreases in area from the 1970s to 2000s followed by slight increases since the 2000s, with overall decreases in area. The type II (subtype iii) lakes were Mapam Yum Co, Bangong Co, Qinghai Lake and Ngangla Ringco Lake. For example, Qinghai Lake underwent a decrease in area of 3.12% during the past 40 years (Figure 7).
Figure 7 Variation in water area during the past 40 years for steep falling-gentle rising lakes (type II, subtype iii)
Lakes classified as rising-falling (type III) showed increases in area from the 1970s to 1990s followed by decreases in area from the 1990s to the 2010s. The type III lakes were Cuona Lake, Geren Co and Peiku Co. The area of Cuona Lake increased 1.11% during the study period, while Geren Co and Peiku Co decreased by 1.48% and 3.74%, respectively (Figure 8).
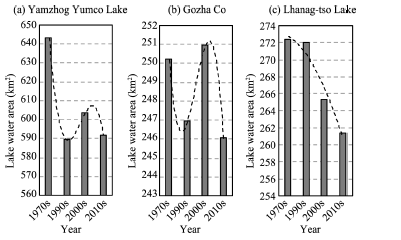
Figure 8 Variation in water area during the past 40 years for rising-falling lakes (type III)
Lakes classified as fluctuating (type IV) showed decreases and increases in area during the study period. The type IV lakes were Yamzhog Yumco Lake and Gozha Co, showing overall decreases in area of 7.97% and 1.67%, respectively, during the study period (Figures 9a and 9b).
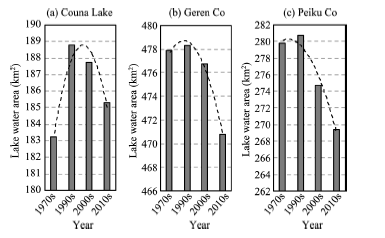
Figure 9 Variation in water area during the past 40 years for fluctuating lakes (type IV) (a) and (b), and falling lakes (type V) (c)
Only one lake was classified as falling (type V). Lhanag-tso Lake showed a steady linear decrease in area during the study period with an overall decrease of 4.94% (Figure 9c).
4.1.2 Spatial heterogeneity of lake area
Investigation of the changes in inland alpine lakes at regional scales or across the whole Tibetan Plateau revealed strong spatial and temporal variability during the past four decades. The changes were consistent with geomorphological boundaries. The Tibetan Plateau can be divided into nine subareas based on geomorphologic characteristics. The lakes in the present study were mainly distributed in the Qilian Mountains, the Qaidam Basin, the Kunlun Mountains, the Karakoram Mountains, the Changtang Plateau, and the Himalayan Mountains (Figure 10).
Figure 10 Types of lake area variation on the Tibetan Plateau over the past 40 years

I (i): Linear rising; I (ii): Concave exponential rising; I (iii): Convex logarithmic rising; II (i): Gentle falling-steep rising; II (ii): Steep falling-steep rising; II (iii): Steep falling-gentle rising; III: Rising-falling; IV: Fluctuating; V: Falling

In the Qilian and Kunlun Mountains and the Qaidam Basin, the alpine lakes were sparsely distributed. Qinghai Lake, located in the Qaidam Basin, showed an overall decrease in area of 3% between the 1970s and 2000 (Zhang et al., 2014b) but the lake showed an obvious increase in area since the 2000s (Zhang et al., 2014b). Har Lake, located in the Qilian Mountains, showed a falling-rising pattern (type II, subtype ii) during the last four decades with a marked increase in area since the 2000s for a total increase in area of 9.6 km2 (Song et al., 2013). Ayakekum Lake in the Kunlun Mountains increased from 614.62 km2 in the 1970s to 940.41 km2 in 2010. Specially, the area increased markedly since the 2000s, accounting for 91% of the increase in area over the past 40 years.
On the Changtang Plateau the lakes were mainly concentrated in the Hoh Xil region to the north and the Naqu region to the south. Ulan Ul Lake, Xijin Ulan Lake, Hoh Xil Lake, and Dogai Coring Lake were located in the east of the Hoh Xil region and water area increased in these lakes by 14.84%, 16.53%, 9.36%, and 14.22%, respectively, during the study period (Song et al., 2013). These lakes followed a falling-rising pattern from the 1970s to 2010s, with rapid increases in area since the 2000s (Yao et al., 2013). Margai CaKa Lake and Meima Co, located in the west of the Hoh Xil region, followed a similar falling-rising pattern, but with more marked decreases from the 1970s to the 1990s. The area of Margai CaKa Lake increased greatly during the 1990s and increased 186.4% overall during the past 40 years (Li and Sheng, 2013). Most of the lakes in the northeast of the Naqu region, including Yagen Co, Bange Co, Siling Co, Bamu Co, Peng Co, Zige Tang Co, Co’e Lake, and Nam Co, showed a marked and steady increase in area between the 1970s and 2010s. Yagen Co showed the largest increase in area (195%) of the 35 lakes in the present study. The majority of the lakes in the southwest of the Naqu region, including Dagze Co, Zhari Nam Co, and Tangra Yum Co, decreased in area between the 1970s and 2000s and increased in area from the 2000s. However, overall the area of these lakes changed little over the 40-year study period.
In the Himalayan and Karakoram Mountains most of the lakes including Yamzhog Yumco Lake, Peiku Co, Mapam Yum Co, Lhanag-tso Lake, Bangong Co, and Ngangla Ringco Lake showed fluctuations in area, but the lake areas were smaller in 2010 compared with the 1970s. Yamzhog Yumco Lake experienced the most severe shrinkage of 51.29 km2 in the past four decades. The area of Lhanag-tso Lake has also been falling continuously over the past four decades. Puma Yum Co and Tarong Co showed a small overall increase in area after decreasing during the 1970s to 2000s.

4.2 Changes in lake water level of the Tibetan Plateau

Lake water level is an important parameter for water storage estimation, and a sensitive indicator of lake water balance and regional climatic variability at timescales of years to decades (Ponchaut and Cazenave, 1998). Traditionally, water-level changes in lakes have been monitored using gauge data (Mercier et al., 2002). For some specific lakes, trends in water-level changes can be calculated from continuous observation data. However, for many lakes, particularly those in remote areas and in developing countries, routine in situ measurements of water change are not available (Chipman and Lillesand, 2007). As an alternative, altimetry data for specific lake areas obtained from different satellite campaigns can be used to detect changes in water levels (Urban et al., 2008). Methods to derive time series of lake water levels from the Ice, Cloud, and land Elevation Satellite Geoscience Laser Altimeter System (ICESat/GLAS) data have been summarized by Phan et al. (2012) and Wang et al. (2013).
Water-level changes for 26 typical inland lakes on the Tibetan Plateau were examined based on ICESat altimetry data (Zhang et al., 2011b; Song et al., 2013; Wang et al., 2013). Among the 26 lakes, 22 showed an upward tendency and four showed a downward tendency for water level during 2003 to 2009 (Table 3). Siling Co, Meima Co, Aksai Chin Lake, Angzi Co, and Dorsoidong Co had marked rises in water level. The average rise in lake level during 2003 to 2009 was 0.17 m/year. Water levels increased by 0-0.2 m/year in 34.62% of the lakes, by 0.2-0.4 m/year in 42.31%, and >0.4 m/year in 7.69%, while in 15.38% of the lakes levels decreased by 0.42-0 m/year. The water-level changes in different lakes over the Tibetan Plateau also showed considerable spatial heterogeneity. In accordance with the findings for water area discussed in section 4.1, most lakes in the inner and northern part of the plateau tended to show increases in water levels, while the lakes in the Himalayan Mountains tended to show decreases in water levels.
Table 3 Variations in water levels of alpine lakes on the Tibetan Plateau (m)
Sources Wang et al., 2013 Zhang et al., 2011b Song et al., 2013
Name 2003 2009 Change 2003 2009 Change 2003 2009 Change
Yagen Co 4871.01 4871.66 0.65
Ayakekum Lake 3833.458 3834.797 1.339 3878.89 3880.49 1.6 3878.89 3880.49 1.6
Siling Co 4539.37 4543.76 4.39 4539.41 4543.74 4.33 4539.37 4543.76 4.39
Zige Tang Co 4567.83 4569.74 1.91 4567.87 4569.64 1.77 4533.811 4535.675 1.864
Nam Co 4690.71 4691.816 1.106 4723.38 4725.43 2.05 4722.74 4725.5 2.76
Aksai Chin Lake 4824.511 4826.738 2.227
Dorsoidong Co 4932.96 4934.99 2.03 4932.96 4934.99 2.03
Meima Co 4894.563 4897.509 2.946
Chibuzhang Co 4897.243 4898.635 1.392
Angzi Co 4656.866 4658.989 2.123 4686.8 4688.78 1.98 4686.37 4689.24 2.87
Puma Yum Co 4983.02 4982.482 -0.538 5011.28 5010.77 -0.51 5010.3 5011.25 0.95
Har Lake 4031.418 4032.069 0.651 4076.97 4077.68 0.71 4076.75 4077.68 0.93
Xijin Ulan Lake 4732.163 4733.921 1.758 4771.89 4773.69 1.8 4771.71 4773.69 1.98
Ulan Ul Lake 4817.656 4819.054 1.398 4855.92 4858.21 2.29
Dogai Coring Lake 4781.508 4782.68 1.172 4819.1 4819.95 0.85 4818.64 4820.18 1.54
Hoh Xil Lake 4846.519 4847.82 1.301 4887.13 4888.36 1.23 4886.93 4889 2.07
Tangra Yum Co 4506.757 4508.091 1.334 4536.68 4537.46 0.78 4566.78 4568.82 2.04
Zhari Nam Co 4582.81 4583.666 0.856 4612.38 4614.57 2.19 4612.72 4614.51 1.79
Tarong Co 4538.862 4540.081 1.219 4567.37 4568.58 1.21 4566.78 4568.82 2.04
Mapam Yum Co 4563.032 4562.781 -0.251 4586.35 4586.76 0.41 4585.95 4587.1 1.15
Bangong Co 4219.819 4220.274 0.455
Qinghai Lake 3149.412 3149.951 0.539 3193.35 3194.02 0.67 3193.06 3194.1 1.04
Ngangla Ringco Lake 4688.559 4688.9 0.341 4716.39 4716.69 0.3 4715.48 4716.79 1.31
Geren Co 4664.91 4665.18 0.27
Peiku Co 4553.01 4552.049 -0.961 4578.61 4578.61
Yamzhog Yumco Lake 4411.003 4408.481 -2.522 4441.53 4438.85 -2.68 4438.94 4442.37 3.43

5 Reasons for changes in lakes on the Tibetan Plateau

The level and area of endorheic lakes are sensitive to complex changes in precipitation, evaporation, and input for glacier meltwater. Recent studies have indicated that the Tibetan Plateau has been experiencing rapid warming since the 1960s (Wang et al., 2008).

5.1 Climatic changes

5.1.1 Precipitation
The annual mean precipitation decreases from the southeast to the northwest across the Tibetan Plateau and adjacent areas. During the past 40 years, precipitation increased in the east and north of the Tibetan Plateau, whereas it decreased slightly or remained relatively stable in the south and west (Liao et al., 2013). In the present study, changes in precipitation were investigated using data on the mean values around lakes in each region of the Tibetan Plateau. The results were in accordance with the findings of previous studies (Figure 11).
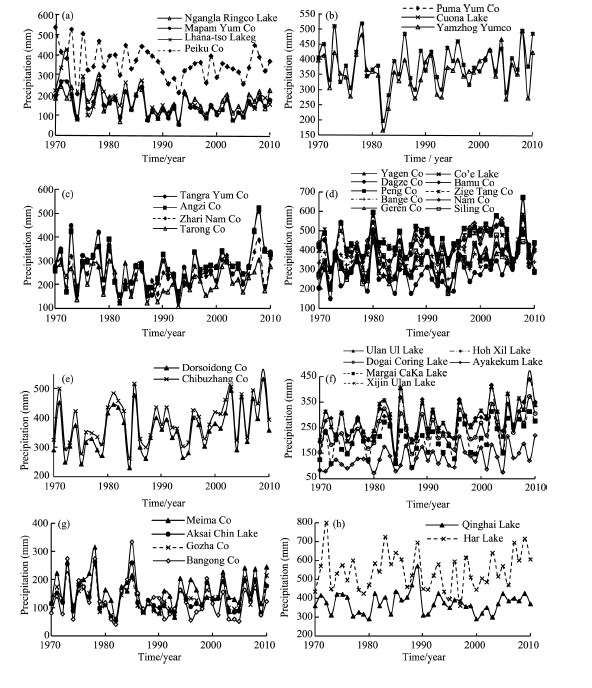
Figure 11 Variations in annual precipitation of different regions on the Tibetan Plateau over the past 40 years (a) west of the Himalayan Mountains; (b) east of the Himalayan Mountains; (c) west of the Naqu region; (d) east of the Naqu region; (e) north of the Naqu Region; (f) east of the Hoh Xil region and Kunlun Mountains; (g) west of the Hoh Xil region and Karakoram Mountains; (h) the Qaidam Basin and Qilian Mountains
In the past 40 years, annual mean precipitation at most lakes increased. The largest increase of 28.3 mm/10 years (10a) occurred at Co’e Lake. However, the annual mean precipitation decreased at the lakes in the west of the Himalayan Mountains on the south of the Tibetan Plateau and the largest change of -28.4 mm/10a occurred at Lhanag-tso Lake. Precipitation also decreased in the western Himalayan Mountains and the Karakoram Mountains. The changes in precipitation at Ngangla Ringco Lake, Lhanag-tso Lake, Mapam Yum Co, Bangong Co, and Peiku Co were -10.1 mm/10a, -28.4 mm/10a, -19 mm/10a, -12.4 mm/10a, and -23.1 mm/10a, respectively. In the east of the Himalayan Mountains where Yamzhog Yumco Lake, Puma Yum Co, and Cuona Lake are located, precipitation increased steadily. Precipitation also increased at most lakes in the Naqu region. The fastest rate of increase in annual precipitation occurred in the central part of the Tibetan Plateau with precipitation at Siling Co and Dorsoidong Co increasing at a rate of more than >20 mm/10a. Precipitation at the lakes in the southeast of the Naqu region, such as Nam Co, increased by about 15 mm/10a while at the lakes in the southwest of the Naqu region, such as Tangra Yum Co, precipitation increased by <10 mm/10a. In the Hoh Xil region located in the north of the Tibetan Plateau, the annual precipitation decreased from east to west. At the lakes in the northwest of the Hoh Xil region, such as Meima Co, Gozha Co, and Aksai Chin Lake, the mean annual precipitation was consistently low at about 150 mm/year. The annual precipitation at Ulan Ul Lake was 283.2 mm with a slight increase of 24.5 mm/10a. The annual precipitation in the northeast of the Tibetan Plateau was also consistently low. In the past 40 years, Qinghai Lake experienced a sharp increase in precipitation in the late 1980s, then returned to previous levels and remained stable for the past 20 years. The annual precipitation at Har Lake increased slightly by 5.9 mm/10a. Precipitation at Ayakekum Lake in the Kunlun Mountains increased markedly.
5.1.2 Temperature
Temperatures throughout the Tibetan Plateau rose from 1961 to 2010 (Du, 2001; Niu et al., 2004; Shi et al., 2007; You et al., 2010; Figure 12). However, the temperature changes in different regions of the Tibetan Plateau showed considerable spatial heterogeneity.
In the past 40 years, temperature in the regions of the lakes studied in this paper rose at a rate of 0.4 ± 0.1°C/10a. The temperature around Zhari Nam Co rose most rapidly, increasing by 0.496°C/10a. Temperatures in the Himalayan Mountains have been fluctuating with an average increment of 7.05°C/10a and temperatures in Naqu have been rising at a steady rate with an increase in average annual temperature from -2.38°C in 1970 to -0.30°C in 2010. The temperature in this region decreased abruptly after 1997 but increased again the following year and has continued to increase rapidly. Hoh Xil has low temperatures year round and the average annual temperature in this region was about -4.47°C. The temperatures in the Karakoram Mountains and western Hoh Xil were lower than those in the east of the region and the temperatures fluctuated markedly. In eastern Hoh Xil temperatures increased considerably in the past 10 years. Located in the northeast of the Tibetan Plateau, the Qaidam Basin and Qilian Mountains showed similar increases in temperature. The mean temperature changes at Qinghai Lake and Har Lake were 0.35°C/10a and 0.47°C/10a, respectively.
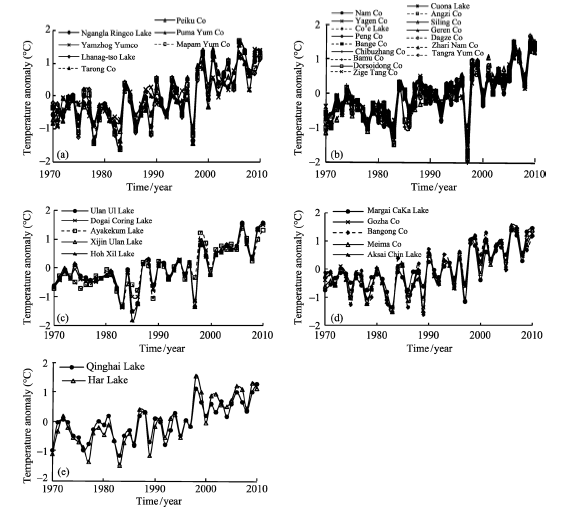
Figure 12 Variations in the annual temperature anomaly of different regions on the Tibetan Plateau over the past 40 years (a) Himalayan Mountains; (b) the Naqu region; (c) east of the Hoh Xil region and Kunlun Mountains; (d) west of the Hoh Xil region and Karakoram Mountains; (e) Qaidam Basin and the Qilian Mountains
5.1.3 Evaporation
Evaporation is a critical component of the water cycle and its variations affect lake water balance. Potential evapotranspiration across the Tibetan Plateau has decreased considerably as a result of decreased wind speed (Zhang et al., 2007, 2009) and solar radiation (Tang et al., 2011). The evaporation on the Tibetan Plateau has been calculated based on the Penman-Monteith model. The results of this study and previous analyses (Liu et al., 2009; Li and Sheng, 2013) indicate that evaporation in most of the northeastern Tibetan Plateau and adjacent areas decreased in the past 40 years, but the changes are inconsistent. Average evaporation in the Qaidam Basin decreased markedly from the 1970s to 2010s. During the period 1961-2000, the mean annual evaporation at Qinghai Lake was 17,862.91 mm and the annual evaporation change was -295.13 mm/10a. According to a study by Yao et al. (2013) conducted in Hoh Xil, evaporation at Gerze, Shiquanhe, and Wudaoliang stations was -2.5 mm/year, 1.8 mm/year, and 1.1 mm/year, respectively. Jia et al. (2009) found that evaporation in the Qilian Mountains and Hexi Corridor increased between 1967 and 1974, decreased between 1974 and 1993, and increased again after 1993. The annual evaporation change rate was -1.67 mm/year, which indicated that the evaporation in this region showed a decreasing tendency in the past 40 years.

5.2 Glacier changes

In the past 100 years, glaciers on the Tibetan Plateau have been retreating. Based on the two phases of the Chinese glacier inventory, glaciers on the Tibetan Plateau have been declining in number, area, and storage during the past several decades (Table 4). The rate of glacier retreat has increased rapidly since the 1980s under the influence of global warming. The magnitude of glacial retreat is the greatest at the south and east margins of the Tibetan Plateau and at the north of the Tibetan Plateau. There has been less marked retreat in the central Tibetan Plateau and the Changtang Plateau (Pu et al., 2004).
Table 4 Changes in glaciers in different regions of the Tibetan Plateau
Mts (Plateau) The First Chinese Glacier Inventory The Second Chinese Glacier Inventory
Number Area Storage Number Area Storage
Karakoram Mountains 3454 6231 868 5316 5988.67 592.86
Kunlun Mountains 7694 12266 1283 8922 11524.13 1106.34
Altun Mountains 235 275 16 466 295.11 15.36
Qilian Mountains 2815 1931 93 2683 1597.81 84.48
Changtang Plateau 958 1802 162 1162 1917.74 157.29
Tanggula Mountains 1530 2213 184 1595 1843.91 140.34
Gangdise Mountains 3538 1766 81 3703 1296.33 56.62
Nyainqêntanglha Mountains 7080 10701 1001 6860 9559.2 835.3
Himalayan Mountains 6475 8412 709 6027 6820.98 522.16
Sources Liu et al., 2000 Liu et al., 2015
Lakes supplied by glacier melting are mainly distributed in the Hoh Xil region, the Qilian Mountains, the east of the Himalayan Mountains, and the Kunlun Mountains. Glaciers in the Kunlun Mountains showed a rapid decline and since the 1970s glaciers in the east of the Kunlun Mountains decreased more than those in the west of the region (Liu et al., 2002; Shangguan et al., 2004). Glaciers in the Himalayan Mountains have decreased most rapidly. Many small glaciers have disappeared in the last 20 years (Liu et al., 2006). Glaciers in the Qilian Mountains have decreased in number, area, and storage. For example, the glaciers on Shulenan Mountain, which supplies Har Lake, retreated in the past 40 years and the rate of melting increased after the 1990s as a result of high temperatures in summer. The glaciers in the Altun Mountains showed a slight tendency to increase in area but a tendency to decrease in storage (Zhang et al., 2011c).
Glaciers in the Gangdise, Tanggula, and Karakoram Mountains also decreased in area. Glaciers in the Changtang Plateau degenerated much more slowly than those in other regions of western China (Wang et al., 2011).

5.3 Analysis of the reasons for lake changes

In combination of data from previous studies with meteorological data, the reasons for spatial and temporal heterogeneity in lake changes can be analyzed qualitatively.
Lakes located in the Naqu region increased in area and were mainly recharged by glacier melting and precipitation. From the 1970s to 2010, annual mean precipitation increased rapidly in this region, which further contributed to the increase in the area of the lakes such as Siling Co and Yagen Co. The lakes located in the west of Naqu increased in area at a relatively lower rate. They were mainly recharged by runoff and precipitation. The long delivery distance from glaciers to the lakes resulted in more loss by evaporation.
The Hoh Xil region has experienced increased precipitation, higher temperatures, and a decrease in evaporation. The lakes in this region, such as Ulan Ul Lake and Hoh Xil Lake, are mainly recharged by glacier melting and runoff. Yao et al. (2013) pointed out that the lakes in this region are far from the feeding glaciers and the long delivery distance and infiltration reduced water supply to the lakes. Therefore, increasing precipitation and declining evaporation may be the main reason for the increase in area of lakes in this region.
Lakes in the Himalayan Mountains such as Yamzhog Yumco, Mapam Yum Co, and Lhanag-tso decreased in area or remained stable. In the past 40 years precipitation decreased in the west Himalayan Mountains and increased slightly in the east. Though evaporation throughout the Tibetan Plateau has decreased in the past 40 years, changes in precipitation played a more critical role in determining lake area changes. The water supply from precipitation at Yamzhog Yumco was 88.86%, whereas glacier melting water and evaporation accounted for only 8.91% and 10.11%, respectively, of the total supply (Li et al., 2014). Therefore, the decline in precipitation caused the decrease in area of lakes including Peiku Co, Lhanag-tso Lake, and Yamzhog Yumco Lake. Bangong Co, Mapam Yum Co, Tarong Co, and Ngangla Ringco Lake, which are mainly recharged by glacier melting and precipitation, but increased evaporation played a greater role than increased glacier melting and precipitation during the 1970s to 2000s. However, in the past 10 years, continued glacier melting and increased precipitation caused increases in lake area. Puma Yum Co and Yamzhog Yumco Lake are located close to each other but they showed different changes in area after the 2000s, which may be related to the impact of the Yamzhog Yumco Lake Pumped Storage Power Station (Mima et al., 2013).
Precipitation and temperature increased in the Qilian Mountains, and there was a slight increase in glacier melting between 1970 and the early 1990s. The annual mean temperature began to increase at a rapid rate in the late 1990s, accompanied by an increase in glacier melting. While evaporation increased more than precipitation, the lakes in this region still decreased in area during the 1970s to 2000s. In recent years, rapid glacier melting and increasing precipitation has caused an increase in area of some lakes in this region. Har Lake, recharged mainly by the glacier meltwater from Shule Mountain, decreased in area from the 1970s to 2000s and then increased steadily in the past 10 years. On the whole, the area of lakes in this region has remained stable as a result of increasing glacier melting (Jia et al., 2009).
Qaidam Basin is located in the northeastern Tibetan Plateau. Evaporation was much larger than precipitation in this region. The dry and warm climate caused the area of the Qinghai Lake to decrease steadily from the 1970s to the early 2000s. Recently, as a result of increasing precipitation and increased runoff caused by rising temperatures, the lake area has begun to increase steadily.
The annual mean precipitation in the Karakoram Mountains has been decreasing and the annual mean temperature has been increasing in the past 40 years. Bangong Co is mainly recharged by runoff, and the decreased precipitation and increased temperature have led to a decrease in lake area (Shao et al., 2007).
The Kunlun Mountains region has a dry climate with strong evaporation. Lakes in this region underwent considerable decreases in area during the 1970s and 2000s and glaciers on the Kunlun Mountains declined markedly between the two phases of Chinese glacier inventory (Liu et al., 2000; Liu et al., 2015). The annual mean precipitation and temperature in this region increased considerably and evaporation decreased in recent years. For these reasons, the lakes in the Kunlun Mountains have increased in area since the 2000s.

6 Discussion

6.1 Challenges of monitoring water balance

There is a paucity of lake observations (e.g., lake bathymetric surveys, runoff records and climate data) over the Tibetan Plateau. This lack of data has led to inconsistent measurements of lake variations, inaccurate numerical simulations and predictions, and inadequate explanations for climate-driven mechanisms. Possible reasons for water-level changes are only given qualitatively. More research is needed to determine the contribution of different factors to water-level changes in alpine lakes.
Because of limited data, water-level changes in the medium-sized and small-sized lakes of the Tibetan Plateau are estimated on the basis of their similarities to the 35 alpine lakes investigated in the present study, although deviations are possible.

6.2 Limitations to glacial area detection

The permafrost has different distribution areas and types, leading to different patterns of degradation in different areas. Because of inaccessibility, complex terrain, and sparse meteorological stations, especially in the western Tibetan Plateau and at higher elevations, it is currently difficult, if not impossible, to quantify the difference between meltwater from glaciers and perennial snow cover, precipitation, and evaporation for each sub-basin or for all sub-basins. Therefore, it is not possible to directly quantify the satellite-measured lake-level increase to water budget, although the linkage between glacier melting and lake-level increase appears strong. Ongoing measurements will enrich the database for future research. Variations in regional or sub-basin glaciers and snow area and their relationship to lake-level and water-volume changes also warrant further study.

6.3 Uncertainties in detecting lake water-level variations

Previous studies have demonstrated that lake water-level changes determined from the ICESat/GLAS altimetry are in good agreement with those determined from in situ gauge observations (Urban et al., 2008; Zhang et al., 2011c). However, because of the limited observations from ICESat/GLAS, some intra-annual fluctuations of water level cannot be detected. Therefore, bias in water-level trends may be inevitable for limited campaigns. The limited spatial resolution of the Gravity Recovery and Climate Experiment (GRACE) prevents its application to hydrologic processes and water balance at the spatial scale in some single lake basins. To more accurately estimate the contribution of increasing lake water storage to the mass budget shown in the GRACE signals, further investigation of the relationship between the seasonal and inter-annual variability of the GRACE mass budget and lake water storage changes is required.

6.4 Variable region boundaries of lake change types

Li and Sheng (2013) analyzed the spatial heterogeneity of lake changes based on water supply and showed that increases in lake area were closely related to the distribution of glaciers. A study by Liu et al. (2002) found that the lakes supplied by glaciers increased in area whereas lakes distributed in the source regions of the Yellow River decreased in area. The sub-regions in the present paper were based on geomorphological boundaries, which reflected the imbalance in the distribution of precipitation, temperature, evaporation, and glaciers in different geomorphological regions. The lake changes showed consistency with these influencing factors and obvious spatial heterogeneity.

7 Conclusions

In this study, spatial and temporal heterogeneity in lake area and water level of typical alpine lakes on the Tibetan Plateau has been analyzed based on data from prior studies and long-term meteorological records.
(1) In terms of temporal changes in area, the 35 alpine lakes could be divided into five groups: rising, falling-rising, rising-falling, fluctuating, and falling. The rising-type lakes could be further divided into three subtypes: linear rising, concave exponential rising and convex logarithmic rising. The falling-rising-type lakes could also be further divided into three subtypes: gentle falling-steep rising, steep falling-steep rising, and steep falling-gentle rising. The area of the rising-falling-type lakes increased before the 1990s and decreased after the 1990s, the area of the fluctuating-type lakes showed increases and decreases, and the area of the falling-type lakes decreased in the past four decades.
(2) For spatial and temporal variation of these lakes over the past decades, they presented very different rising or falling trend, for example, Yagen Co showed the largest increase in area of 194.99%. Siling Co has expanded by more than 600 km2 since the 1970s and has become the largest alpine lake in Tibet. While, Lhanag-tso Lake showed a continuous linear decrease in area with an overall decrease of 4.94%, Yamzhog Yumco Lake showed the largest decrease in area of 7.97% during the study period.
(3) In terms of spatial changes, the alpine lakes distributed in the Himalayan Mountains, Changtang Plateau, Kunlun Mountains, Qilian Mountains, Karakoram Mountains, and Qaidam Basin regions displayed various change patterns. Lakes in the Himalayan Mountains, Karakoram Mountains, and Qaidam Basin tended to decrease in area while lakes in the Naqu region and Kunlun Mountains increased in area. Lakes in the Hoh Xil region and Qilian Mountains showed increases and decreases in area.
(4) Based on ICESat altimetry data of 26 typical alpine lakes on Tibetan Plateau, 22 of them showed an upward tendency and 4 of them showed a downward tendency for water level during 2003 to 2009. The average rise in lake level during 2003 to 2009 was 0.17 m/year. The water-level changes in different lakes over the Tibetan Plateau also showed considerable spatial heterogeneity. Most lakes in the inner and northern part of the plateau tended to show increases in water levels, while the lakes in the Himalayan Mountains tended to show decreases in water levels.
(5) The changes in lake area were in accordance with regional climate change. Increasing precipitation and glacier melting were the main reasons for increases in the area of lakes in the Naqu region, Kunlun Mountains, and Karakoram Mountains. Decreased precipitation caused the lakes in the Himalayan Mountains to decrease in area. Slight increases in precipitation, the long distance from the glaciers, and increased evaporation caused the fluctuation in lake area observed in the Hoh Xil region and Qilian Mountains. The dry climate in the Qaidam Basin since the 1970s caused decreases in lake area, but as the climate turned from dry to wet in the past 10 years, the lakes in this area showed a tendency to increase in area.

The authors have declared that no competing interests exist.

1
Aizen V, Aizen E, Melack J, 1996. Precipitation, melt and runoff in the northern Tien Shan.Journal of Hydrology, 186: 229-251.Precipitation and snow distribution, melt of glaciers and snow, and runoff formation in two basins in the northern Tien Shan are calculated and described. Major climatic features are a spring-summer precipitation maximum occurring simultaneously with ice and snow melt. Precipitation increases with altitude except in winter when an air temperature inversion occurs. Air temperature is a good predictor of glacial melt. Typical hydrographs have two floods: one is formed from melt of seasonal snow cover, and the other is formed from melt of glacial ice. The second flood is usually larger than the first. In mountain basins of the northern Tien Shan direct runoff from rainfall averages about 7-12% of annual volume. The glacial runoff is 18-28% of average annual runoff in basins with area of glaciation not less than 30-40%, but during summer it can increase to 40-70% of average annual runoff. Surface runoff from seasonal snow melt during spring and summer is 18% of average annual runoff, the groundwater component is 34-38% of average annual runoff.

DOI

2
Aizen V, Kuzmichenok V, Surazakov Aet al., 2007. Glacier changes in the Tien Shan as determined from topographic and remotely sensed data.Global and Planetary Change, 56: 328-340.This research presents a precise evaluation of the Tien Shan glacier's recession based on data of geodetic surveys 1861-1869, aerial photographs from 1943, 1963, 1977, 1981, 1:25,000 scale topographic maps, SRTM, and ASTER data from 2000/2003 for the Akshiirak glacierized massif in the central Tien Shan with 178 glaciers covering 317.6 km , and for the Ala Archa glacier basin in the northern Tien Shan with 48 glaciers covering 36.31 km . The Tien Shan glaciers retreated as much as 3 km from the 1860s to 2003. From 1943 to 1977, Akshiirak and Ala Archa shrunk 4.2% and 5.1% respectively, and from 1977 to 2003 the area shrunk 8.6% and 10.6%, respectively. The volume of the Akshiirak glaciers was reduced by 3.566 km from 1943 to 1977 and 6.147 km from 1977 to 2000. The total reduction of the Tien Shan glacier is 14.2% during the last 60 yr. The northern and central Tien Shan have not experienced a significant increase of precipitation during the last 100 yr, but they have experienced an increase in summer air temperatures, especially observable since the 1970s, which caused an acceleration of the Tien Shan glaciers recession.

DOI

3
Angel J, Kunkel K, 2010. The response of Great Lakes water levels to future climate scenarios with an emphasis on Lake Michigan-Huron.Journal of Great Lakes Research, 36: 51-58.

DOI

4
Bai J, Chen X, Li Jet al., 2011. Changes of inland lake area in arid Central Asia during 1975-2007: A remote-sensing analysis.Journal of Lake Sciences, 23(1): 80-88. (in Chinese)

5
Bian D, Bian B, La Bet al., 2010. The Response of water level of Selin Co to climate change during 1975-2008.Acta Geographica Sinica, 65(3): 313-319. (in Chinese)<p>An analysis is made about the response of Selin Co lake area change to climate change, based on RS, GIS and modern climate statistical methods with the aid of TM and CBERS remote sensing data from 1980-2008 as well as temperature, precipitation, the amount of evaporation, the biggest depth of frozen soil from 1975-2008 at the stations such as Shenzha, Bange and Anduo etc. Based on the digitized 1:100,000 topographic map in 1975 and through analyses of remote sensing data after the 1980s, it is found that water levels of Selin Co, Co'e and Yagen Co lakes present a distinct expanding trend in the past 30 years. In 2008, the water level areas of the above three lakes are 2196.23 km2, 279.24 km<sup>2</sup> 103.07 km<sup>2</sup> and they increase by 574.46 km2, 11.59 km2 and 68.13 km2 respectively compared to 1975. Moreover, Selin Co expands at a rate of 20%, with an average of 420 km2/10a, thus it has become the largest salty inland lake, exceeding the area of Nam Co lake in Tibet during the period 1999-2008. The main reasons for lake area expansion is the increase in snow/ice meting water under the background of global warming, followed by the increase of precipitation, decrease of the evaporation and degradation of permafrost.</p>

6
Bian D, Du J, Hu Jet al., 2009. Response of the water level of the Yamzho Yumco to climate change during 1975-2006.Journal of Glaciology and Geocryology, 31(3): 404-409. (in Chinese)

7
Bolch T, 2007. Climate change and glacier retreat in northern Tien Shan (Kazakhstan/Kyrgyzstan) using remote sensing data.Global and Planetary Change, 56: 1-12.On the average, the decrease in glacier extent was more than 32% between 1955 and 1999 in the investigated valleys of Zailiyskiy and Kungey Alatau. The glacier retreat was not homogeneous, but depended strongly on the size, location and climate regime at the glaciers. The area loss of the continental-type glaciers with very predominant summer accumulation, as for those situated in the deeply incised Chon-Kemin valley between Zailiyskiy and Kungey Alatau, was conspicuously less, in parts, than the loss at the more maritime glaciers on the northern slope of Zailiyskiy Alatau. This is consistent with the small increase in summer temperatures. However, under dryer conditions with high solar radiation input, such as with glaciers in the Chon-Aksu valley in Kungey Alatau, the area retreat of the continental-type glaciers can be even more pronounced than that of the more maritime glaciers.

DOI

8
Bolch T, Menounos B, Wheate R, 2010. Landsat-based inventory of glaciers in western Canada, 1985-2005.Remote Sensing of Environment, 114: 127-137.We report on a glacier inventory for the Canadian Cordillera south of 60掳N, across the two western provinces of British Columbia and Alberta, containing ~30,000 km2 of glacierized terrain. Our semi-automated method extracted glacier extents from Landsat Thematic Mapper (TM) scenes for 2005 and 2000 using a band ratio (TM3/TM5). We compared these extents with glacier cover for the mid-1980s from...

DOI

9
Chen F, Kang S, Zhang Yet al., 2009. Glaciers and lake change in response to climate change in the Nam Co basin, Tibet.Journal of Mountain Science, 27(6): 641-647. (in Chinese)Meteorological data,topographic maps,remotely sensed data and field observation data of the Nam Co Basin were used to analyze the characteristics of climate change,glacier and lake variations during the past 37 years.The results showed that the annual temperature rose distinctly while the annual precipitation had an indistinctive increase for the basin since 1970.The magnitude of warming in winter was much higher than in summer.Affected by the climate warming,the glaciers in the Nam Co Basin were undergoing an overall shrinkage.During the 1970 to 2007,the glacier area reduced 37.1 km2 accounted for 18.2 % of the whole glacier area in the Nam Co Basin.The annual glacier change ratio is-1.0 km2/a.The GPS surveying results showed that the terminals of Zhandang glacier and Lanong glacier had retreated 381.8 m and 489.5 m with the annual change ratio of 10.3 m/a and 13.4 m/a respectively.At the same time,the area of the Nam Co Lake increased 72.6 km2 with an annual increase rate of 2.0 km2/a。During the three period 1970~1991,1991~2000 and 2000~2007,the annual increase rate has been growing.The water level of the Nam Co Lake has a notable increase in summer season which is coincident with the expanding of lake area.

DOI

10
Chipman J, Lillesand T, 2007. Satellite based assessment of the dynamics of new lakes in Southern Egypt.International Journal of Remote Sensing, 28: 4365-4379.Lakes in arid landscapes are indicators of environmental change and important sources of water for human use. In regions without in situ hydrologic measurements, remote sensing may provide the only means to monitor long-term changes in water storage. We used a synergistic combination of multiple satellite remote-sensing methods to provide the first comprehensive assessment of the dynamics of a newly formed chain of large lakes in the hyper-arid Toshka Depression of southern Egypt. A total of 145 MODIS and AVHRR satellite images were used to monitor changes in lake surface area, which increased to a maximum of 1740聽km2 before declining to 900聽km2. Two methods were tested for satellite-based measurement of lake levels and volumes, one based on analysis of a digital elevation model and one using data from the ICESat GLAS laser altimeter. This study shows the power of satellite remote sensing for long-term monitoring of regional-scale hydrologic transformations.

DOI

11
Chu D, Pu Q, Wang Det al., 2012. Water level variations of Yamzho Yumco Lake in Tibet and the main driving forces.Journal of Mountain Science, 30(2): 239-247. (in Chinese)There are over 1 000 lakes on the Tibetan Plateau(TP) and their areas account for 49.5% of the total lake area in China.Lakes on the TP play critical roles in the water cycle and ecological and environment systems of the Plateau.A better understanding of lake variations on the Tibetan Plateau is important for evaluating climate change and regional environment consequence under global warming.In this paper,the water level variations of Yamzho Yumco Lake,a representative inland lake and one of three holy lakes on the TP and scenic spot located at southern TP,and correlations with main climate variables(precipitation,temperature,and evaporation etc.) are analyzed using hydrological and meteorological data from 1974 to 2009 in Baidi Hydrological Station within Yamzho Yumco Lake basin.The results show that annual mean water level of the lake is 19.06 m and the highest level reaches to 21.37 m in 1980 with the lowest level record of 17.08 m in 2009.Water level of the lake generally has been decreasing since1974 when hydrological record started.In detail,annual water level was decreasing from 1974鈥1977 with the mean annual decreasing rate(MADR) of 0.26 m/year,and increasing from 1977 to 1980 with the mean annual increasing rate(MAIR) of 0.4 m/year.The highest historical water level recorded in 1980.The significant decreasing trend occurred from 1980 to 1996 with MADR of 0.21 m/year.1996 is an increasing turning point for water level changes until 2004.since 2004 there has been a obvious decreasing trend until 2009 with MADR of 0.57 m/year.For the annual water level changes from 1974 to 2009,the decreasing period of time is 56% of the total hydraulically record time and the increasing period of time is 44% of the total hydraulically record time.From 1974 to 1984 and 2001 to 2005 the water level is above the mean annual water level and the rest is lower than the mean annual water level.The lowest monthly water level is in Jun and the highest value is in October.There is two-month time lag between the highest monthly water level and precipitation.Water level changes of the lake are mainly caused by precipitation fluctuation.Temperature is dedicated to water level changes through glaciers and snow melting within the basin under continuous increase in temperature.There is a negative correlation between evaporation and water level variations,which means that higher evaporation leads to decrease in water level of the lake.Particularly,the fluctuation of inter-annual precipitation is the main driving forces for water level variations.The impact of human activity and the engineering measures such power plant construction on the water level variation is limited.Yamzho Yumco Pumped Storage Power Station has been in operation in 1998 and the basin environment ameliorates under background of warm and humid climate and its impact on water level variations are limited.The design goal of the power plant is that during summer the water is pumped from Yarlung Zangbo River to the lake using extra power and in other seasons the power station generates power.However,if the water between lake and river can not keep in balance and meet the design goal of the power station,the impact of the power station on water level variations can not be ignored.

DOI

12
Deji Y, La B, Laba Zet al., 2014. Lake area variation of Thari Namtso and its meteorological causes based on multi-sensor satellite data.Journal of Lake Sciences, 26(6): 963-970. (in Chinese)

13
Ding Y, Liu S, Ye Bet al., 2006. Climatic implications on variations of lakes in the cold and arid regions of China during the recent 50 years. Journal of Glaciology and Geocryology, 28(5): 623-632. (in Chinese)The study objects in this work are lakes in the Tibetan Plateau,Inner Mongolia and Xinjiang regions.Dynamic relations between lake and climate change are revealed through analyzing the variations of typical lakes and climate change in each lake regions.The relationship between variations in area of lake and climate change in phase is analyzed in a regional scale.It is found that the lakes locating in the cold and the arid regions of China have highly sensitivity to the climate change.The lakes in the Inner Mongolia lake region are affected mainly by precipitation in view of climate.As a whole,precipitation has more noticeable impact on the lakes in the Xinjiang lake region.But Air temperature also has definite impact due to glaciers in the region.Precipitation and air temperature have the different effects on different lakes on the Tibetan Plateau.The relationship between lake and climate change is even more complicated in a regional scale.The lakes,as a whole,tend to shrink under the conditions of precipitation increasing and air temperature rising on the Tibetan Plateau.

14
Donald O, Thomas C, 1997. Dynamics of water-table fluctuations in an upland between two prairie-pothole wetlands in North Dakota.Journal of Hydrology, 191: 266-289.Data from a string of instrumented wells located on an upland of 55 m width between two wetlands in central North Dakota, USA, indicated frequent changes in water-table configuration following wet and dry periods during 5 years of investigation. A seasonal wetland is situated about 1.5 m higher than a nearby semipermanent wetland, suggesting an average ground water-table gradient of 0.02. However, water had the potential to flow as ground water from the upper to the lower wetland during only a few instances. A water-table trough adjacent to the lower semipermanent wetland was the most common water-table configuration during the first 4 years of the study, but it is likely that severe drought during those years contributed to the longevity and extent of the water-table trough. Water-table mounds that formed in response to rainfall events caused reversals of direction of flow that frequently modified the more dominant water-table trough during the severe drought. Rapid and large water-table rise to near land surface in response to intense rainfall was aided by the thick capillary fringe. One of the wettest summers on record ended the severe drought during the last year of the study, and caused a larger-scale water-table mound to form between the two wetlands. The mound was short in duration because it was overwhelmed by rising stage of the higher seasonal wetland which spilled into the lower wetland. Evapotranspiration was responsible for generating the water-table trough that formed between the two wetlands. Estimation of evapotranspiration based on diurnal fluctuations in wells yielded rates that averaged 3-5 mm day. On many occasions water levels in wells closer to the semipermanent wetland indicated a direction of flow that was different from the direction indicated by water levels in wells farther from the wetland. Misinterpretation of direction and magnitude of gradients between ground water and wetlands could result from poorly placed or too few observation wells, and also from infrequent measurement of water levels in wells.

DOI

15
Du J.2001. Change of temperature in Tibetan Plateau from 1961-2000.Acta Geographica Sinica 56(6): 690-698. (in Chinese)<p>Using the data of monthly mean temperature, maximum and minimum temperature from 1961 to 2000 in Tibet, the linear trends of the annual and seasonal temperature are analyzed. The results show that, the mean temperature displayed warming trend in most parts of Tibet, especially in autumn and winter. The asymmetry was detectable in Tibet, the type of asymmetry was mainly the increase of Tmax and Tmin, while Tmin increase was bigger than that of Tmax. The increase of Tmax occurred mainly in summer and Tmin in winter. The decrease of daily temperature range (DTR) was in all seasons (except summer). Warming was displayed at all latitudes, the increase was the strongest in spring and autumn, secondly in winter, the trend was stronger on the higher altitude than on the lower altitude. In addition, the linear trend of the warming for annual mean temperature over Tibet during the past forty years indicated an increase of 0.26 <sup>o</sup>C / 10 a, it is obviously higher than in other parts of China and in the whole globe. There were more anomalous cold years in the 1960s, whereas anomalous warm years in the 1990s.</p>

DOI

16
Fan Z, Li J, 1984. Recent changes in the lakes of Xinjiang.Geographical Research, 3(1): 77-86. (in Chinese)The lakes of Xinjiang have had greatly changes since liberation. All the lakes there can be divided into 5 types according to their change in area.. 1. dried up, 2. almost dried up, 3. shrinking, 4. changed mot much and, 5. expanding.The lakes in desert area tend to dry up, (for examples, the Nop Nor, the Manasi lake etc.) the lakes in the plain tend to shrink, (the Bositeng lake, the Wulungu lake etc.) and the lakes in mountain area remain their niginal out-look, (the sailimu lake, the Kanasi lake etc.)Recent changes in the lakes mainly include salinization of water quality and shrinkage in area and deepth. In the year 1958 the mineralization of the Bositeng lake was less than 0.4g/l, while in 1975 it rose to 1.5g/l, and in 1980 to 1.8g/l.The average annual increase was 0.06g/l which is quite amazing, in the year 1959 the Wulungu lake was 482.8 M. above-sea-level, while in 1969 it went down to 480.0 M. and in 1980 to 478.8M. 4 M. It has a total drop of about the last two decades.These changes make a profound impact on the ecosystem of the lakes. The area of desertifaication increased rapidly from 12% to 52% during the year from 1958 to 1978 around the Nop Nor region where a big lake had disappeared Biological resourses were degenarated in most of the lakes. Fishery output of the Wulungu lake decreased from 4000 tons to less an one thousand ton per years.Reed resourses of the Bositeng lake decreased from 0.4 million tons to 0.25 million tons per year during the same period.The cause of the changes is basically due to the influence of human activities. Large-scale reclamation reeds a huge amount of irrigation water from the rivers and it has to drain off salt water into the lakes. On the other hand, recent cyclical decrease of runoff is another important reason of the changes.The methods to prevent the lakes from becoming arid land and the way to utilize the lakes for multiple purposes are also discussed

DOI

17
Gao H, Jia Y, 2005. The evolution characteristics of typical inland lakes in Northwest China during the past 40 years and their mechanism.Journal of Arid Land Resources and Environment, 19(5): 93-96. (in Chinese)According to the measured data of typical inland lakes in northwest China, this research has revealed the characteristics of lake evolution and their mechanismduring the past 40 years. The research results show that the climate in Sailimu Lake is turningto warm-wet, the precipitation is increasinggradually, and the lake area is enlarging steadily. The climate in Qinghai Lake has no obvious change, while the runoff, which enters the lake has being decreased year after year, so the lake area is shrinking. As Chaerhan Salt Lake, the quantities of runoff which comes into the lake is few while evaporation is very large so that the lake is in the status of dry and semi-dry, and easier to shrink. The main factors, which influencelake evolution are climate change and human activities.

18
Guo L, Ye Q, Yao Tet al., 2007. The glacial landforms and the changes of glacier and lake area in the Mapam Yumco Basin in Tibetan Plateau based on GIS.Journal of Glaciology and Geocryology, 29(4): 517-524. (in Chinese)Based on remote sensing(RS) and geographical information systems(GIS) techniques,using 4 periods of data,including 1:50000 topographic maps that were published in 1974,digital images from Landsat TM in 1990,Landsat ETM+ in 1999,ASTER in 2003 and Digital Elevation Model(DEM),in this paper the glacial landforms in Mapam Yumco Basin in Tibetan Plateau are mapped,and the glacial landform area,variations of glacierized area and lakes in the past 30 years are studied.It is found that the glaciers in Mapam Yumco Basin have been retreating since 1974.In the recent years,glacier retreat is accelerated.It also shows that glacier melt rate on the sunny side is faster than those in the shadow slope,and smaller glaciers in steeper slopes melt faster than those in flat terrain.From 1974 to 2003,glacier wastage was about 7.27 km<sup>2</sup>or 6.77% of the total area,with an average retreat rate of 0.24 km<sup>2</sup>&middot;a<sup>-1</sup>.Lake area was obviously in reduction in the last 30 years,shrinking from 1974 to 1999,but expanding from 1999 to 2003 to some extent.Many small lakes have disappeared.Lake shrinkage was smaller and smaller and then has shifted to lake expansion since 1999.But generally speaking,lake area was in shrinkage from 1974 to 2003,with a total area decrease of 37.58 km<sup>2</sup>accounting for 4.81% of the total area,and an average retreat rate of 1.25 km<sup>2</sup>&middot;a<sup>-1</sup>.In addition,the glacier and lake variations with meteorological data during the last 30 years in the basin were analyzed.According to meteorological data from the Burang Station(with an elevation of 3 900 m a.s.l.),which is located in the southwest of Mapam Yumco basin,the average air temperature increases very obviously.Temperature increase in the Mapam Yumco basin consists with a prevailing warming over the Tibetan Plateau during the last decades.Annual precipitation and annual evaporation decreased slightly as shown in its linear fitting.The glacier retreat was most likely due to the negative glacial mass balance and was affected by rising temperature and decreasing precipitation over the Tibetan Plateau.Early lake decrease was likely to be caused by less precipitation in the basin.On the other hand,lake expansion has accelerated since 1999,which was most likely due to more water supplies from intensive melting of glaciers,in addition to less water loss due to evaporation and less precipitation income in the basin.

19
Guo N, Zhang J, Liang Y, 2003. Climate change indicated by the recent change of inland lakes in northwest China.Journal of Glaciology and Geocryology, 25(2): 211-214. (in Chinese)Inland lakes are sensitive indicators of climate change. High mountain lakes, due to less influence from human activity, can reflect the climate state accurately. On the other hand, the lake at the end of an inland river may change under the effect of both the human activity and the natural variation. In this article, area changes of some inland lakes in Northwest China in recent years were analyzed using data from NOAA/AVHRR and EOS/MODIS. The results show that the Har Lake in higher west part of the Qilian Mountains is expanding; the Big Sugan Lake and the Small Sugan Lake in lower west part of the Qilian Mountains are stable. There is more precipitation in the Heihe valley in 2002. The area of inland and higher mountain lakes in Xinjiang increases notably in 2002. This suggests an increase in precipitation and meltwater of snow and ice in these regions. Attention should be given to these changes.

20
Hu R, Jiang F, Wang Yet al., 2007. On the importance of research on the lakes in arid land of China.Arid Zone Research, 24(2): 137-140. (in Chinese)

21
Hu R, Ma H, Fan Zet al., 2002. The climate trend demonstrated by changes of the lakes in Xinjiang since recent years.Journal of Arid Land Resources and Environment, 16(1): 20-27. (in Chinese)Consisted of the oases,desert basins,plains,and surrounding mountains,the Xinjiang territory system is one of the main arid areas in northwest China.The adjacent mountain systems are the water source areas of all the streams,shallow groundwater,springs,and lakes because runoff formation does not occur in the desert basin and plain systems.The rivers from the mountains to the desert basins and plains are the main water feeding channels.Since 1995, the water level of Bosten Lake,Ayding Lake raises obviously,and their water area is continuously enlarge.Under the effect of global climate changes,it is considered that the regional climate and the hydrologic phenomena in Xinjiang change towards a direction which is advantageous to the social and economic development and these trends will maintain during the first 10 years of the 21st century according to many factors,such as the obvious rise of water level and enlargemet of surface area of the lakes,slight rise of temperature,and obvious increase of precipitation.

DOI

22
Huang W, Liao J, Shen Get al., 2012. Lake change in past 40 years in the Southern Nagqu District of Tibet and analysis of its driving forces.Remote Sensing for Land and Resources, 94: 122-128. (in Chinese)This study was based on remote sensing images and DEM of SRTM.Areas of twelve lakes in southern Nagqu district in the period of 1970-2010 were derived by visual interpretation,and levels of nine lakes in the period of 1990-2010 were calculated using lake area data and DEM.Then the change regulations of precipitation,temperature,evaporation,frozen ground,glacier and snow line in this region were analyzed.Correlation analysis between the lake area and the climate change was performed,and the causes of lake change were studied on the basis of a simple hydrological model.According to the results,all lake areas increased during the last 40 years except for Gyaring Co,and the lake area expansion notably happened during 2000-2010,with the total increased area of all 12 lakes in this decade being 743.88 km2,which accounted for about 63.95% of all the increased area in the past 40 years;in addition,the levels of the nine lakes tended to rise too.The main reasons for lake change are attributed to the melting of snow cover,glaciers and frozen grounds and the increasing of precipitation caused by climate warming in the past 45 years.Besides,the decreasing evaporation is also a reason for lake expansion.

DOI

23
Jia W, He Y, Wang Xet al., 2009. Temporal and spatial change of the potential evaporation over Qilian Mountains and Hexi corridor from 1960 to 2006.Advances in Water Science, 20(2): 159-167. (in Chinese)Based on the daily data from 20 meteorological stations from 1960 to 2006 and the combination of the Penman-Monteith model,the change trend in potential evaporation (PE) over Qilian mountains and Hexi corridor is analyzed in this study.With the method of Spline under ArcGIS, the spatial distribution of PE is drawn in order to research the regional difference.And the multiple regression method is used to discuss the dominant factor affecting the PE.The results indicate that the annual PE is higher before 1980s than after,and experiences the process from the decrease before 1967 to the increase since then, and to decrease after 1974 to the increase after 1993.There is a decreasing trend in general because the change rate of the annual PE varies at-1.67 mm.The potential evaporation increases in autumn,however,decreases in other seasons,especially in spring.The wind speed is a dominant factor influencing PE.When autumn comes,the temperature becomes the key factor influencing PE.

24
Jiang L, Yao Z, Liu Zet al., 2014. Variations of lake area and boundary of Ulan Ul Lake in Hoh Xil region during 1976-2012 and their reasons.Wetland Science, 12(2): 155-162. (in Chinese)

25
Jones R, McMahon T, Bowler J, 2001. Modelling historical lake levels and recent climate change at three closed lakes, Western Victoria, Australia (c.1840-1990).Journal of Hydrology, 246: 159-180.

26
Kong Y, Pang Z, 2012. Evaluating the sensitivity of glacier rivers to climate change based on hydrograph separation of discharge.Journal of Hydrology, 434/435: 121-129.姝The magnitude and variability of water system's response to climate change impacts have been assessed through a detailed analysis of discharge composition of two selected typical glacier rivers originated from Tianshan Mountains,Xinjiang Uygur Autonomous Region in West China,which is considered as the water tower of Central Asia.Here we demonstrate climate change in the last 60 years using meteorological data (1951-2009) in the region.Both of the temperature and precipitation show a remarkable rise before and after year 1990 and these changes are much more significant in North Xinjiang than it is in South Xinjiang.Response of water systems towards climate change is then assessed by comparing annual discharge change of Urumqi River(10.0%) in the North and Kumalak River(38.7%) in South Xinjiang.We found significant inconsistency of the climate change impact on water resources.Furthermore,we quantitatively determine the ratio of ice-melt water using isotope hydrograph separation as well as other conservative tracers.Results show that Urumqi River is recharged by less than 9%of ice-melt water,while Kumalak River contains more than 57%of ice-melt water in their discharges.The extent of glacier input to a water system governs its sensitivity towards climate change.The method has overwhelming potential for un-gauged watersheds and may offer ways of adaptation to climate change in terms of water resources management for flood control and sustainable agriculture.

DOI

27
Krause P, Biskop S, Helmschrot Jet al., 2010. Hydrological system analysis and modelling of the Nam Co Basin in Tibet.Advances in Geosciences, 27: 29-36.The Tibetan Plateau and the adjacent high mountain regions of the Himalayas play an important role in the global climate dynamic through its impact on the Asian monsoon system, which in turn is impacting the water resources of this extremely vulnerable region. To provide further knowledge about the changing impact of rainfall patterns, spatial and temporal variability of snow cover contribution, amount of snow and ice melt runoff, evapotranspiration as well as dynamics of wetlands and permafrost water balance studies are required. This is of particular importance in terms of global climate change because of a severe gap in the knowledge of the short, mid and long term implications on the hydrological system. This study concentrates on the macroscale catchment of the lake Nam Co, located at 4718 m a.s.l. at the foot of the Nyainqentanglha Mountains in central Tibet (30掳 N, 90掳 E). The water balance of the Nam Co basin is dominated by semi-arid climate, snow and ice melt runoff and high evaporation rates due to the high radiation input and the low air humidity. The observed temperature rise, glacier retreat, permafrost decay and lake level increase indicate significant system changes and the high sensitivity of the Tibetan Plateau on global warming. The development of a suitable water balance model and its preliminary application was the main objective of this study. The development was done with the Jena Adaptable Modelling System JAMS along with existing scientific process components of the J2000 module library which were partly further developed to reflect the specific conditions of the high elevation Nam Co basin. The preliminary modelling exercise based on gridded data from a downscaled ECHAM5 data set provided reasonable estimates about the important hydrological water balance components of the Nam Co basin. With the modelling results the observed lake level rise could be reproduced and it could be shown that the runoff from the glaciered areas seems to be the most important component to explain the increasing amount of lake water.

DOI

28
Kropáček J, Brauna A, Kang Set al., 2012. Analysis of lake level changes in Nam Co in central Tibet utilizing synergistic satellite altimetry and optical imagery. International Journal of Applied Earth Observation and Geoinformation, 17: 3-11.The fluctuations of closed basin lakes on the Tibetan Plateau are a valuable record of climate change induced water balance alterations within the catchments. Since these basins are remote and hard to access, multisensoral remote sensing is a valuable method to gather the necessary water budget components with appropriate spatial coverage and with high temporal resolutions. Thus the lake level elevation changes of the central Tibetan lake Nam Co were examined in example by a comparison of satellite altimetry (RA-2/ENVISAT, GFO radar altimeters and GLAS/ICESat laser altimeter for the period 2000鈥2009) and the evaluation of a time series of optical satellite data dating back to 1976 (Landsat) and 1965 (Corona) in order to validate hydrological water budget modelling results. The combination of all three altimeters revealed a rising trend of lake level on average by 0.31m/year in the period 2000鈥2009 which corresponds to a total volume change of 6.2km 3 . This is in a good agreement with simulated average lake level rise of 0.35m/year obtained from distributed hydrological modelling ( Krause et al., 2010 ). The movements of lakeshore measured on the satellite imagery confirm the trend revealed by the altimetry data and they also indicate the rising trend since 1965. While GFO provides a dense time series of data the more accurate ENVISAT/RA-2 data unfortunately feature large data gaps over Tibet. The measurements from time limited campaigns of ICESat validate the results of radar altimetry and they provide unlike radar altimeters a valid height over lake ice during winter and spring period. The results show that the presented approach is a valuable contribution to understand the impact of changing climate on the hydrology of Tibetan lakes.

DOI

29
Kutuzov S, Shahgedanova M, 2009. Glacier retreat and climatic variability in the eastern Terskey-Alatoo, inner Tien Shan between the middle of the 19th century and beginning of the 21st century.Global and Planetary Change, 69: 59-70.

30
La B, Bian D, Chen Tet al., 2012. Possible causes of area change of lake Tangra Yumco, Tibet based on TM images.Meteorological Science and Technology, 40(4): 685-688.By means of the TM satellite remote sensing data(1999 to 2004,2008,and 2009) and temperature,precipitation meteorological data(1999 to 2009),an analysis is conducted by means of ARCGIS,ARCVIEW,ENVI saftware.It is concluded that the area of Lake Tangra Yumco presented an enlarging trend significantly in nearly 11 years.The area of Lake Tangra Yumco increased to 852.01 km2 in 2009 from 836.97 km2 in 1999,and the most obvious enlargement is found in the southeastern part of the lake.The rising temperature,which resulted in the melting of the glaciers and permanent snow cover around the basin,and the increasing precipitation of the lake are the major causes.

31
La B, La B, Chen T, 2011. Change research and cause analysis of inland lakes in Tibet based on MODIS image.Meteorological and Environmental Sciences, 34(3): 37-40. (in Chinese)According to the 2002-2009 MODIS satellite remote sensing data and 2000-2009 meteorological data such as temperature,surface temperature,precipitation,relative humidity,the article concludes that the lake area change is significant in Tibet.The area of Selincuo lake,Dangreyongcuo lake,Zharinanmucuo lake present enlarging trend,respectively 241.97 km2,12.8 km2,11.69 km2 in 8 years;The area of Namucuo lake and Yangzhuoyongcuo lake present reducing trend significantly,respectively 52.17 km2,96.61 km2.The rising of temperature and surface temperature caused snow ice melting and permafrost shallow,which are the root causes of lake area larger.While precipitation reduced is the root cause of lake area reduced.In addition,several typical Tibetan inland lakes are little change in ice-formation time.

32
Lei Y, Zhang H, Wang Set al., 2009. Change in Lake Area of Zige Tangco on central Tibetan Plateau since the 1970s and its mechanisms.Journal of Glaciology and Geocryology, 31(1): 48-54. (in Chinese)

33
Li B, Pan B, Cheng Wet al., 2013. Research on geomorphological regionalization of China.Acta Geographica Sinica, 68(3): 291-306. (in Chinese)According to research achievements of Chinese regional geomorphology over nearly 30 years, including landscape classification and landform mapping, this paper systematically discusses the specific steps and methods, principles and the standards for geomorphological regionalization. It is suggested that the basis and standard of geomorphological zoning at all levels not only include the similarities and differences of the combinations of geomorphology type together with the landform genesis, but also its dimension. Based on 1:4000 000 geomorphplogical map of China and the GIS technology, we made an analysis of reasons for the Chinese regional differentiation of the essential geomorphological types and their genesis and divided the whole China into six major geomorphological regions and 38 districts. Region I (eastern hilly plains) is located in the northern part of the low terrain unit of China, in which the largest plain areas of China are distributed. Plains and platforms are dominant and the fluvial accumulation landforms are well developed. This region includes seven districts. Region II (southwestern low-middle mountains) is located in the southern part of the low terrain unit of China, which is dominated by low-elevation hills and low- or middle-relief mountains with only 30% of its area occupied by plain and platforms. Fluvial geomorphologies are typical with a developed karst landform in Southwest China, which can be divided into five districts. Region III (central and northern middle mountains and plateau) is located in the northeastern part of the middle terrain unit of China, characterized by the plateau landform composed of the low- or middle-relief mountains, hills, platforms and plains. Loess landform is well developed. This region includes five districts. Region IV (northwestern middle and high mountains and basins) is located in the northwestern part of the middle terrain unit of China. It is composed of middle to high mountains interposed by flattened basins and is characterized by arid desert geomorphology, where mountains with basins are made up of plains, platforms and hills. This region can be divided into five districts. Region V (southwestern subalpine mountains) is located in the southern part of the middle terrain unit. With a typical karst landform, middle or high mountains with middle or high reliefs are widespread and are scattered by wide valley basins. This region includes five districts. Region VI (Tibetan Plateau) covers the high terrain unit of China. It is composed of plains and high mountains with elevations higher than 4000 m and 3/4 area of the region, and is characterized by glacier and periglacial landforms. This region can be divided into nine districts.

DOI

34
Li J, Fang H, Bao Aet al., 2011. Spatio-temporal analysis of recent changes of lake area and lake water level at high mountains in Central Asia.Resources Science, 33(10): 1839-1846. (in Chinese)Inland lakes are major surface water resources in arid regions of Central Asia. They provide sparsely distributed but valuable fresh water resources for the fragile environments and human activities, which act as the essential components of the hydrological cycle and local ecosystems. Lakes in alpine regions are sensitive to natural changes, which can serve as an important indicator of global climate change and regional environment variations. Lake changes are mainly manifested by their level or area changes, which can provide evidence of spatial and temporal characteristics of regional water resource changes. Mapping these lakes and detecting their changes are therefore of great significance to understand the relevance of lake variations to climate changes, and they are also crucial to evaluating impacts of economic development on ecological balances. However, lake studies in these remote mountainous areas seem to be limited due to low accessibility and lack of observation data. Satellite remote sensing provides an efficient tool to analyze the status and variations in these lakes. In this paper, Landsat/CBERS were used to map lake area changes, and Jason, ICEsat/GLAS were employed to extract lake level information, forming a time series of level and area changes of 16 lakes over the past ten years. The spatial and temporal characteristics of lake level changes were also analyzed with information on glaciers and dams, so as to unravel the responses of level and area changes of different types of lakes to climate change and human activities. It is shown that remote sensing has a good performance of mapping lake level and area changes, and lake levels in October have good performance of describing the temporal processes of lake level changes. Glaciers are vital to alpine closed lakes, and the characteristics of level changes are classified into two modes based on glacier distribution: lakes in the northern Tibetan Plateau (the Kunlun Mountains, Karakorum Mountains, and the Pamir Plateau) and the middle Tienshan Mountain, both of which have glaciers in their drainage basins, and lake levels over these areas are increasing. While lakes in the Altai Plateau and Tienshan have no glacier-melting water to feed, lake levels are decreasing in these areas. Level changes of open lakes and some plain closed lakes have significant correlation with the dam distribution. Water levels of lakes having dams decrease dramatically, whereas open lakes without dams remain generally stable. This indicates that overexploitation of water resources in Central Asia has resulted in lake level decline.

35
Li J, Sheng Y, 2013. Spatiotemporal pattern and process of inland lake change in the Qinghai-Tibetan Plateau during the period of 1976-2009.Arid Zone Research, 30(4): 571-581. (in Chinese)In this paper, the dynamic variation of the inland lakes in the Qinghai-Tibetan Plateau was investigated based on the mapping of the lakes in 4 years (1976, 1990, 2000 and 2009) and the Landsat time series images so as to reveal the spatiotemporal variation of the lakes in the plateau under climate change in recent decades. The temporal processes and spatial patterns of change of the lakes were analyzed at drainage basin scale, and the mechanism of inland lake change was discussed from the aspects of regional climate factors and recharge water sources of the lakes. The results showed that the inland lakes in the plateau were holistically in a shrinkage during the period of 1976-1990 but in an expansion during the period of 1990-2009, and the total lake area was expanded by 27.3% during the period of 1976-2009. Considering from the spatial patterns of lake change, the lakes recharged by groundwater were in a dramatic expansion or shrinkage, but those recharged by glacial melt water were stable or in a slight expansion. Recharge water sources of the endorheic basins affected strongly the lake change rate, the change of climate factors, such as precipitation, evaporation and air temperature, could be used to explain the shrinkage or expansion of the lakes. Therefore, regional climate change is the key factor causing the dramatic change of the inland lakes in the Qinghai-Tibetan plateau, and the recharge water sources could be regarded as the main factor affecting the regional difference of lake change.

36
Li L, Li J, Yao Xet al., 2014. Changes of the three holy lakes in recent years and quantitative analysis of the influencing factors.Quaternary International, 349: 339-345.中国科学院机构知识库(中国科学院机构知识库网格(CAS IR GRID))以发展机构知识能力和知识管理能力为目标,快速实现对本机构知识资产的收集、长期保存、合理传播利用,积极建设对知识内容进行捕获、转化、传播、利用和审计的能力,逐步建设包括知识内容分析、关系分析和能力审计在内的知识服务能力,开展综合知识管理。

DOI

37
Li Z, 2014. Glacier and lake changes across the Tibetan Plateau during the past 50 years of climate change.Journal of Resources and Ecology, 5(2): 123-131.In this paper, recent glacier and lake changes research on the Tibetan Plateau was reviewed. Emphasis was placed on a discussion of the relationship between glacier shrinkage and lake change. In the context of global climate change, the glaciers of the Tibetan Plateau have generally retreated, while the lakes have generally expanded. First, the research on glacial terminal retreat, glacial area and volume variations across the Tibetan Plateau over the last few decades are reviewed and analyzed; the temporal-spatial change characteristics of the glaciers are discussed. Secondly, the lake area, volume and water level changes are reviewed and analyzed; the temporal-spatial change characteristics of the glaciers are discussed. The results indicate that the retreat speed in the outer edge of the Tibean Plateau was overall faster than that in the inland area. The areas and water levels of the lakes that are fed by glacial water increased. Finally, the limitations of the present studies and future work are discussed.

DOI

38
Liao J, Shen G, Li Y, 2013. Lake variations in response to climate change in the Tibetan Plateau in the past 40 years.International Journal of Digital Earth, 6(6): 534-549.The Qinghai-Tibetan Plateau plays an important role in global climate and environmental change and holds the largest lake area in China, with a total surface area of 36,900 km(2). The expansion and shrinkage of these lakes are critical to the water cycle and ecological and environmental systems across the plateau. In this paper, surface areas of major lakes within the plateau were extracted based on a topographic map from 1970, and Landsat MSS, TM and ETM+ satellite images from the 1970s to 2008. Then, a multivariate correlation analysis was conducted to examine the relationship between the changes in lake surface areas and the changes in climatic variables including temperature, precipitation, evaporation, and sunshine duration. Initial results suggest that the variations in lake surface areas within the plateau are closely related to the warming, humidified climate transition in recent years such as the rise of air temperature and the increase in precipitation. In particular, the rising temperature accelerates melting of glaciers and perennial snow cover and triggers permafrost degradation, and leads to the expansion of most lakes across the plateau. In addition, different distributions and types of permafrost may cause different lake variations in the southern Tibetan Plateau.

DOI

39
Liu C, Shi Y, Wang Zet al., 2000. Glacier resources and their distributive characteristics in China.Journal of Glaciology and Geocryology, 22(2): 106-112. (in Chinese)According to the statistics of Chinese glacier inventory, which was finished in accordance with the guidelines of world glacier inventory and published in 11volumes with 21copes, China has 46 298 glaciers with 59406 km<sup>2</sup> of area and 5590 km<sup>3</sup> of ice reserve. Glacier area in China accounts for 14.5% of the global and 47.6% of Asian mountain glacier area, respectively, that is to say, China is a country with best developed mountain glaciers in the middle and low-latitude. The glacier inventory was compiled in accordance with the mountain systems and river systems. Some 14 systems are distributed from north to south in west China, including the Altay Mts., Tianshan Mts., Kunlun Mts. and Himalayas etc. Among them, the glaciers in five mountains, namely the Tianshan Mts., Karakorum Mts., Kunlun Mts., Nyainqentanglha Mts. and Himalayas, occupy 79% in area and 84% in ice reserve of the total in China, respectively. It is particularly worth noting that the huge west Kunlun Mountain has 6580 glaciers with a glacier area of 10844 km<sup>2</sup> being the largest glaciated region in China. The glaciers in the interior region of China occupy 60% in area and 64% in ice reserve of the total in China, respectively. Among them the number of glaciers in the Tarim water system, dominated by the Tarim River and surrounded by the Tianshan Mts., Pamirs, Karakorum Mts. and Kunlun Mts., is largest, with area and ice reserve accounting for 56% and 65% of the total of the interior region, respectively. Glaciers of exterior region are located in the source area of the Yangtse River, Yellow River and the Yarlung Zangbo River etc. The glaciers in the basin of the Yarlung Zangbo River are most developed, their area and ice reserve occupy 61% and 70% of the total in the exterior region. Basins with a glacier area of more than 1000 km<sup>2</sup> are basins of the Pumqu River, Yangtse River, Nujiang River and the upper Indus River etc. The glacier inventory data and the new knowledge about glacier and snow line elevation distribution have important scientific and practical significance to the water resource utilization and snow and ice hazard control in mountain regions in western China.

40
Liu J, Wang S, Yu Set al., 2009. Climate warming and growth of high-elevation inland lakes on the Tibetan Plateau.Global and Planetary Change, 67: 209-217.The growth of two high-elevation inland lakes (at 4600m) was analyzed using satellite imagery (2000–2005) and data were collected over the last decade (1997–2006) at a plateau meteorological station (at 4820m) and stream gauging data from a station (at 4250m) in central Tibet. We examined the lake water balance responses to meteorological and hydrological variables. The results show that the lake areas greatly expanded by a maximum of 27.1% (or 43.7km 2 ) between 1998 and 2005. This expansion appears to be associated with an increase in annual precipitation of 51.0mm (12.6%), mean annual and winter mean temperature increases of 0.41°C and 0.71°C, and an annual runoff increase of 20% during the last decade. The changes point to an abrupt increase in the annual precipitation, mean temperature and runoff occurring in 1996, 1998 and 1997, respectively, and a decrease in the annual pan evaporation that happened in 1996. The timing of lake growth corresponds closely with abrupt increases in the annual precipitation and runoff and with the decrease in the annual evaporation since the mid-1990s. This study indicates a strong positive water balance in these permafrost highland lakes, and provides further evidence of lake growth as a proxy indicator of climate variability and change.

DOI

41
Liu R, Liu Y, 2008. Area changes of Qinghai Lake in the latest 20 years based on remote sensing study.Journal of Lake Sciences, 20(1): 135-138. (in Chinese)

42
Liu S, Ding Y, Li Jet al., 2006. Glaciers in response to recent climate warming in western China.Quaternary Sciences, 26(5): 762-771.lt;p>Glaciers in China are primarily located in the Qinghai-Xizang (Tibet) Plateau and surrounding high mountains. The China Glacier Inventory (CGI) indicates that there are over 46377 glaciers in Western China, accounting for 52 percent of the total area in Central Asia. Meteorological records indicate that air temperature in Western China has risen by 0.2℃ per decade, and the 1990s is likely the warmest decade of the millennium; similarly, most of Western China also has seen an increase in precipitation during the past 50 years, for example, precipitation increased by 18 % during the last half of the last century in northwestern provinces. Using remote sensing and Geographical Information System (GIS) methods, we have monitored the changes over 5000 glaciers in the past 50 years. We conclude that 82.2 % of all the monitored glaciers retreated, while the remaining glaciers were enhanced. It should be mentioned that the enhanced glaciers were not necessarily enhanced over the entire observational period; in the past two decades while regional climate warming has been much evident many of the once expanded glaciers started to retreat. As a whole, glaciers that have been monitored show a total area loss of 4.5 % from the late 1950s to the late 1990s. Investigation on glacier changes over the past few decades reveal some regional differences, which is mainly attributed to different dynamical responses of glaciers with different sizes and physical properties along with climate changes of that region. For example, glaciers in central and northwestern parts of the Qinghai-Xizang Plateau were relatively stable, while those in mountains surrounding the Plateau experienced extensive wastage. It is concluded that strong warming and reduced precipitation are likely key drivers for the extensive reduction of ice cover in the eastern and southern parts of the Plateau. In contrast, recent cooling in the northwestern and central parts of the Plateau may partially explain the relatively stable condition of those glaciers. The modest warming trend and increase in precipitation in the southeastern part of the Plateau could account for the modest changes in glaciers there. Although precipitation has increased in Northwest China (Tianshan, Qilian Shan, Eastern Pamirs, and so on), the strong warming may be the principal factor driving glacier retreat although large glaciers with heavy debris covering their ablation areas may also contribute to the variations of ice extent in the region. Glacier recession is a key factor in the variability of water resources in the arid river systems of Northwest China. The recent increase in discharge of these rivers may be partially related to the increase in glacial runoff caused by loss of ice during glacier retreat. Although the glaciers that we (and others) have monitored account for only 10 % of the total number and 24 % of the total area of glaciers in China, our results may be extrapolated to infer glacier changes in various mountain regions of China.</p>

DOI

43
Liu S, Lu A, Ding Yet al., 2002. Glacier fluctuations and the inferred climate changes in the Nyainqêntanglha Mountains in the source area of the Yellow River.Journal of Glaciology and Geocryology, 24(6): 701-707. (in Chinese)The paper analyzes glacier variations during the Last Glacial Maximum (LGM), the Little Ice Age (LIA) maximum, and the period between 1966 and 2000 by applying aerial photos, satellite images, topographical maps and a derived digital elevation model (DEM) in the A’ny&#234;maq&#234;n Mountains in the source area of the Yellow River. The results indicate that glaciers in the LGM covered 3.1 times of the present glacier area in this region. Glaciers have shrunk since the LIA maximum and the decrease in area accelerated in the period between 1966 and 2000. A method has been used for extracting the glacier equilibrium-line altitude (ELA). Based on current climatic data, mean summer air temperatures at the ELA are reconstructed for some periods, indicating that mean summer temperature dropped by 2.1℃ in LGM, which corresponded to an ELA decrease of about 420 m with respect to that in 2000. There was a colder summer in the LIA maximum, when mean summer temperature was 0.6℃ lower than that of the present.

44
Liu S, Yao X, Guo Wet al., 2015. The contemporary glaciers in China based on the Second Chinese Glacier Inventory. Acta Geographica Sinica, 70(1): 3-16. (in Chinese)<p>The Second Chinese Glacier Inventory (SCGI) was compiled based on remote sensing images after 2004 including Landsat TM/ETM+ and ASTER images, and the digital elevation models (DEMs) from SRTM. The SCGI shows that there are 48,571 glaciers with a total area of 5.18&#x000D7;10<sup>4</sup> km<sup>2</sup> and ice volume of 4.3&#x000D7;10<sup>3</sup>-4.7&#x000D7;10<sup>3</sup> km<sup>3</sup> in China (including glaciers measured from 1:50,000 or 1:100,000 topographic maps made from the 1960s to the 1980s because of no high quality remote sensing images for the contemporary glacier inventories). The number of glaciers with the area below 0.5 km<sup>2</sup> reaches 33,061 and accounts for the majority part (66.07%) of glaciers in China. Glaciers with areas between 1.0 km<sup>2</sup> and 50.0 km<sup>2</sup> are totaled as ~3.40&#x000D7;10<sup>4</sup> km<sup>2</sup> (~2.65&#x000D7;10<sup>3</sup> km<sup>3</sup> in ice volume) and constitute the main part of glaciers in China. The Yengisogat Glacier (359.05 km<sup>2</sup>), located in the Shaksgam Valley, north slope of the Karakoram Mountain, is the largest glacier in China. The glaciers are spatially distributed in 14 mountains and plateaus in western China. The Kunlun Mountains has the largest number of glaciers in China, followed by Tianshan Mountains, Nyainq&#x000ea;ntanglha Range, the Himalayas and Karakoram. Glaciers in the above five mountains account for 72.26% of the total glacier number in China, however, over 55% of the total area of glaciers and 59% of the total ice storage in China are concentrated in the Kunlun Mountains, Nyainq&#x000ea;ntanglha Range and Tianshan Mountains. The number and area of glaciers in Karakoram Mountains are less than those in the Himalayas, but the volume of the former is more than that of the latter because the glaciers in the Karakoram are generally larger. Some 4/5 of the total area of glaciers in China is mainly distributed in an altitudinal band between 4500-6500 m a.s.l. with regional differences depending on the general elevations of various mountains. Analogously, there is an obvious difference of glaciers in basins. The first level basin having the most glaciers is the East Asia interior drainage area (5Y) which occupies ~40% of glaciers in China. The Yellow River basin (5J) has the fewest glaciers where only 164 with an area of 126.72 km<sup>2</sup> are distributed. Xinjiang and Xizang autonomous regions are the two provincial units rich in glaciers, with ~9/10 of the total area and ice storage of glaciers in China.</p>

DOI

45
Liu T.1995. Changes of Yamzho Lake water stage in Xizang.Scientia Geographica Sinica, 15(1): 55-62. (in Chinese)The Yamzho Lake is the largest closed inland lake at the north foot of Mt.Himalayas,with a drainage area of 6100 km2.The lake covers an area of 621 km2 with an altitude of 4440 meters and a storage capacity of 16 billion m3.Precipitation is the main recharge source of the lake.Melt water makes up only 16 percent of the total recharge.Yearly lake level variation is within 0.6 meter.Due to self-regulation the highest water level of the lake does not appear in July or August when the rainfall is plentiful but in September or October.In a rainy year the lake level exhibits periodic variations and in a dry year the lake level has a fall tendency.The lake water level variation was influenced by temperature in the past 30 years.The analysis of the data for the last one hundred years shows that there is a tendency of lake level fall, the fall rate is 0.6meter/100 year.

46
Ma D, Zhang L, Wang Qet al., 2003. Influence of the warm-wet climate on Sayram Lake.Journal of Glaciology and Geocryology, 25(2): 219-223. (in Chinese)Located at the west of the Tianshan Mountains, the southwest of the Junger Basin, Sailimu Lake is the largest alpine lake in Xinjiang with a catchment area of 1 408 km<sup>2</sup> lake area of 457 km<sup>2</sup>. Its maximum depth reaches to 86 meters, and total water capacity is 210×10<sup>8</sup>m<sup>3</sup>. The altitude of the lake is 2 073 m. Surrounded by high mountains, it is an occluded lake. Since 1980s, there is a warm-wet trend of the climate in Sailimu Lake and its neighboring areas, indicated by increasing of the precipitation and rising of the air temperature. According to the meteorological records, the mean decadal temperature in 1980s is 0.4~0.6 ℃ higher than the mean temperature in former 20 years.The mean decadal temperature in 1990s is 0.3~0.4 ℃ higher than that in 1980s, 0.7~1.0 ℃higher than the mean temperature in former 20 years, and 0.6~0.8 ℃ higher than he mean temperature in former 30 years. In 1990, the precipitation amounts at Qiedeke station and Piliqing station are 5.4% and 7.0% more than the multi-year mean values respectively. At Wenquan station, precipitation in 1990s increases about 20.3% compared with the annual mean value. The correlation coefficient for the precipitation between the Sailimu Lake Meteorological station and the Wenquan Station is 0.948, which means that increasing of the precipitation and runoff in neighboring area will be a indication of increasing of those inSalimu lake. Therefore, the water level of Sailimu Lake will certainly rise because of the influence of the warm-wet climate.

47
Ma R, Yang G, Duan Het al., 2010. China’s lakes at present: Number, area and spatial distribution.Science China Earth Sciences, 54(2): 283-289.

48
Ma Y, Yi C, Wu Jet al., 2012. Lake surface expansion of Nam Co during 1970-2009: Evidence of satellite remote sensing and cause analysis.Journal of Glaciology and Geocryology, 34(1): 81-88. (in Chinese)By using remote sensing images of different periods, aerial topographic map and digital elevation model, the change in surface area of Nam Co during 1970-2009 is analyzed based on geographical information system (GIS) and remote sensing (RS) techniques. According to the correlative meteorological data, the possible reasons on lake area variation are discussed by analyzing the lake pan-evaporation and precipitation, glacier ablation, as well as influx water supply. It is found that lake surface has expanded since the 1970s and even more severe during the last ten years, with an expansion more than 50 km<sup>2</sup> from 2001 to 2009. Precipitation variation is the direct cause of the lake expansion. Furthermore, the decline of lake pan-evaporation is another reason for the extension.

49
Meng K, Shi X, Wang Eet al., 2012. High-altitude salt lake elevation changes and glacial ablation in Central Tibet, 2000-2010.Chinese Science Bulletin, 57(5): 525-534.

DOI

50
Mercier F, Cazenave A, Maheu C, 2002. Interannual lake level fluctuations (1993-1999) in Africa from Topex/Poseidon: Connections with ocean-atmosphere interactions over the Indian Ocean.Global and Planetary Change, 32: 141-163.

51
Mima C, Tian L, Wen Ret al., 2013. Recent water level change of Yamzhog Yumco Lake, Tibet.Journal of China Hydrology, 33(2): 64-69. (in Chinese)We studied the water level changes of the Yamzhog Yumco Lake from 1974 to 2010 and discussed the factors that caused the lake water level changes by comparing the meteorological data from the Langkazi meteorological station with the observed lake water level changes.We calculated the accumulated anomaly of annual precipitation and annual potential evaporation from the meteorological station and compared it with the water level changes of Yamzhog Yumco Lake.The results show that the accumulated anomaly of annual precipitation had consistency with the inter-annual water level change of the Yamzhog Yumco Lake before 2005,indicating a precipitation dominated lake water level change.The combination effect of precipitation and evaporation changes can account for 93% of the lake level change.From 2005 to 2010,however,the observed lake level deviated from the precipitation change trend.The study shows that the climate change can not interpret why the water level quickly decrease in the past years.Probably,the human activity is one of the main factors leading to the water level decrease in the Yamzhog Yumco Lake.

52
Niu T, Chen L, Zhou Z, 2004. The characteristics of climate change over the Tibetan Plateau in the last 40 years and the detection of climatic jumps.Advances in Atmospheric Sciences, 21(2): 193-203.lt;a name="Abs1"></a>Through analyzing the yearly average data obtained from 123 regular meteorological observatories located in the Tibetan Plateau (T-P), this article studies the characteristics of climate change in T-P in the last 40 years. From the distribution of the linear trend, it can be concluded that the southeastern part of T-P becomes warmer and wetter, with an obvious increase of rainfall. The same characteristics are found in the southwestern part of T-P, but the shift is smaller. In the middle of T-P, temperature and humidity obviously increase with the center of the increase in Bangoin-Amdo. The south of the Tarim Basin also exhibits the same tendency. The reason for this area being humid is that it gets less sunshine and milder wind. The northeastern part of T-P turns warmer and drier. Qaidam Basin and its western and southern areas are the center of this shift, in which the living environment is deteriorating. Analyzing the characteristics of the regional average time series, it can be found that in the mid-1970s, a significant sudden change occurred to annual rainfall, yearly average snow-accumulation days and surface pressure in the eastern part of T-P. In the mid-1980s, another evident climatic jump happened to yearly average temperature, total cloud amount, surface pressure, relative humidity, and sunshine duration in the same area. That is, in the mid 1980s, the plateau experienced a climatic jump that is featured by the increase of temperature, snow-accumulation days, relative humidity, surface pressure, and by the decrease of sunshine duration and total cloud amount. The sudden climatic change of temperature in T-P is later than that of the global-mean temperature. From this paper it can be seen that in the middle of the 1980s, a climatic jump from warm-dry to warm-wet occurred in T-P.

DOI

53
Niu Y, Li C, Xi Xet al., 2008. Plateau lake variation monitored by satellite remote sensing and the relation to climate change.Arid Land Geography, 31(2): 284-290. (in Chinese)In recent years,the lakes on Tibetan Plateau have significant changes.Based on the satellite data and climate data,this paper analyzes the variation of three inland lakes,Pumoyong Co(at the south of the Tibet),Nam Co(at the middle of Tibet) and Mapangyong Co(on the west of Tibet).Using CBERS CCD data from the year 1999 to 2006,the paper chooses the best wave bands,performs image progress such as fine correct,image register and mosaic separately,then detects the brim information and draws the change data of these lakes.With an ETM+ image of the same period of 2000 as assistant,the paper calculates and draws the spectral reflective curve to identify the change area.For avoiding the contingency,the lake areas of the recent continuous years are used to calculate the average area of each lake.The results show that The Pumoyong Co Lake and Nam Co Lake have expanded about 4.01 % and 4.55 %,respectively,and the Mapangyong Co Lake does not change much,only 1.31 % compared with the data of the year 1984.This paper also uses the meteorological analysis to find out why the three lakes have changed so differently.Taking the Pumoyong Co Lake for example,the paper calculates the related coefficients of water lever data and temperature,rainfall,evaporation and humidity data of the nineteen years to find main effective factors,which shows that temperature and rainfall have the direct effect on the lake level change.Then the paper analyzes the trend of the meteorological data including average temperature,rainfall,evaporation and humidity per year from the nearest meteorological stations of Langkazi,Dangxiong and Pulan.The result shows that the temperatures of three areas have the ascending trends,but the rainfall appears the different tendencies.The rainfalls at south and middle areas of the Tibet increase significantly,but the west part has a descending trend with about 25.8 % lower than the average data of before the year of 1998.This trend has good consistency to the results of remote sensing detecting,with shows that remote sensing method has high usability on the plateau lake monitoring.

54
Phan V H, Lindenbergh R, Menenti M, 2012. ICESat derived elevation changes of Tibetan lakes between 2003 and 2009.International Journal of Applied Earth Observation and Geoinformation, 17: 12-22.The Tibetan plateau contains thousands of small and big lakes. Changes in the water level of these lakes can be an important indicator for the water balance of the Tibetan plateau, but were until now extremely difficult to monitor: performing continuous in situ measurements at a large number of lakes is not feasible because of their remoteness, while radar altimetry is only capable of monitoring large lakes. Between 2003 and 2009 the Geoscience Laser Altimeter System (GLAS) on board of the Ice, Cloud and land Elevation Satellite (ICESat) obtained world-wide elevation profiles during 18 one-month campaigns. Using the GLAS data it is possible to obtain lake levels at decimeter accuracy. Available GLAS data over the Tibetan lakes is selected by means of the MODIS lake mask. As a result, lake level variations between 2003 and 2009 of 154 lakes of over a square kilometer size could be observed. For these lakes, an analysis of annual water level trends is made, and then their yearly gained or lost water volumes are estimated. In total, an area averaged increase in lake level of 0.20m/year over the Tibetan plateau is observed between 2003 and 2009. Most of the individual lakes considered in this paper have little or no levels apparently documented, and so the ICESat data provide the first baseline measurements of these lakes in the vertical.

DOI

55
Ponchaut F, Cazenave A, 1998. Continental lake level variations from Topex/Poseidon (1993-1996).Comptes Rendus de l'Académie des Sciences-Series IIA-Earth and Planetary Science, 326: 13-20.Le niveau d'eau des lacs continentaux fluctue en fonction des variations de précipitation et d'évaporation sur leur bassin de drainage, en réponse aux changements climatiques régionaux. Avec l'altimétrie satellitaire, les variations du nivean des lacs peuvent être suivies de fa04on quasi continue avec une précision de quelques centimètres. Dans cette note, nous présentons les variations de niveau de trois lacs américains (Supérieur. Michigan et Huron) et de trois lacs africains (Tanganyika. Malawi et Turkana) à partir des quatre années ( 1993–1996) de données altimétriques collectées par le satellite Topex/Poséidon. Tous les lacs étudiés montrent un cycle annuel dominant fortement corrélé avec celui des précipitations. Les lacs américains sont régulés et ne présentent done que de faibles variations interannuelles. Au contraire, les lacs africains ont une réponse marquée aux changements climatiques régionaux (éventuellement globaux). Les données Topex/Poseidon ont mis en évidence une forte diminution (supérievre à 20 cm.an 611 du niveau des lacs Tanganyika et Malawi. Cette tendance est à associer aux sécheresses récurrentes qui ont été enregistrées en Afrique de I'Est et du Sud depuis le début des années 1990. à la suite de la succession des récents événements ENSO.

DOI

56
Pu J, Yao T, Wang Net al., 2004. Fluctuations of the glaciers on the Qinghai-Tibetan Plateau during the past century.Journal of Glaciology and Geocryology, 26(5): 517-522. (in Chinese)In the past 100 years, glaciers on the Qinghai-Tibetan Plateau (QTP) have been general retreating continuously, although the retreat rate was twice depressed, and the glaciers were relatively positive mass balance or advanced a little. Glacier retreat rates have increased rapidly under the fluctuant global warming since the 1980s. The magnitude of the glacial retreat is the largest at the south and east margins of the QTP. Larger retreat occurs at the north of the QTP, and the least retreat occurs in the central of the QTP and the Qangtang Region. The glacial response to climatic change is more sensitivity at the margins of Qinghai-Tibetan Plateau than those inlands of Qinghai-Tibetan Plateau.

57
Qi W, Zheng M, 2006. Initial research on water level fluctuation discipline of Zabuye Salt Lake in Tibet.Scientia Geographica Sinica, 26(6): 693-701. (in Chinese)

58
Qiao C, Luo J, Sheng Yet al., 2010. Analysis on lake changes since ancient and modern ages using remote sensing in Dagze Co, Tibetan Plateau.Journal of Lake Sciences, 22(1): 98-102. (in Chinese)

59
Qin B, 1999. A preliminary investigation of lake evolution in 20-century in inland mainland Asia with relation to the global warming.Journal of Lake Sciences, 11(1): 11-19. (in Chinese)This paper summarizes lake changes in the arid or semi-arid inland mainland Asia since the beginning of 20-century, and further investigates the possible causing, especially the effects of climatic change. In the northern Mongolia and eastern inner Mongolia, the lakes show a general increase in water stand, which is caused by the increase in precipitation. Meanwhile, the temperature rising is favourable for melting the frost underground water and augmenting the soil tension water and runoff. In the western Central Asia, the water level of Caspian Sea has turned to rise since 1978, which is also associated with the increase in moisture condition in the catchment. In the mountainous central Asia, most lakes show a general decrease in water level. These lake level drop are caused either by the trend of dry and warm condition, or by the human activities, or by both. The rainfall record indicates a slightly reduction of rainfall, particularly the reduction of winter rainfall, which presumably related to the increase in winter temperature resulted in the shift of westerlies in winter time. Decrease in precipitation result in more water to be channeled and irrigated, therefore, the lake shrinkages will be speeded up.

60
Shangguan D, Liu S, Ding Yet al., 2004. Glacier changes at the head of Yurungkax River in the west Kunlun Mountains in the past 32 years.Acta Geographica Sinica, 59(6): 855-862.<p>Recent studies indicate that widespread wastage of glaciers in western China has happened since the late 1970s, but diverse places under different climate settings have marked regional discrepancy as to the amplitude in glacier shrinkages. In the present study, we investigate the changes of glaciers at the head of Yurungkax river (centered at 35o40'N, 81oE) in the heavily glaciated West Kunlun Mts. by using aerial photos (1970), Landsat TM (1989) and ETM+ (2001) imageries. A comparative analysis performed for glacier length/area variations since 1970 in the West Kunlun Mts. shows that the prevailing characteristic of glacier variation is ice wastage, however, changes in glacier area are very small in this region. Results indicate that a small enlargement of ice extent during 1970-1989 was followed by a reduction of over 0.5% during 1989-2001. It concludes that the enlargement of glaciers during 1970-1989 might be caused by the decrease in air temperature and the increase in precipitation during the 1960s and that glacier shrinkage during 1989-2001 might be reaction to increase in air temperature, but abundant precipitation acts as a role of buffer in variations of surface mass balance of glaciers in the research region.</p>

61
Shao Z, Zhu D, Meng Xet al., 2007. Characteristics of the change of major lakes on the Qinghai-Tibet Plateau in the last 25 years.Geological Bulletin of China, 26(12): 1633-1645. (in Chinese)On the Qinghai-Tibet Plateau there are three super large lakes, the Qinghai Lake, Nam Co and Siling Co, and eleven large lakes, the Zhari Nam Co, Tangra Yumco, Ayakkum Lake, Banggong Co , Har Lake, Ngoring Lake, Yamzho Yumco, Gyaring Lake, Chibuzhang Co, Ulan Ul Lake and the Ngangla Ringco. The authors studied the changes of these major lakes in the past 25 years, based on interpretations of the MSS images obtained during the middle 1970s and ETM+ images obtained in the late 1990s or at the beginning of the 21st century. The study shows that: the areas of the Har Lake and Ngoring Lake have remained relatively stable; the areas of the Qinghai Lake, Zhari Nam co, Tangra Yumco, Ayakkum Lake, Gyaring Lake, Ulan Ul Lake and Ngangla Ringco have been reduced to varying degrees, of which the areas of the Qinghai Lake and Ulan Ul Lake have decreased most sharply by 60.60 km2 and 59.80 km2 respectively; the areas of the Nam Co, Siling Co and Bangong Co have increased more or less, of which the area of the Siling Co has increased most sharply by 140.42 km2. The analysis on the changes in areas of major lakes has provided new materials for the study of the lake evolution, climatic change and environmental variation on the Qinghai-Tibet Plateau.

DOI

62
Shi Y, Shen Y, Kang Eet al., 2007. Recent and future climate change in Northwest China.Climatic Change, 80(3): 379-393.As a consequence of global warming and an enhanced water cycle, the climate changed in northwest China, most notably in the Xinjiang area in the year 1987. Precipitation, glacial melt water and river runoff and air temperature increased continuously during the last decades, as did also the water level of inland lakes and the frequency of flood disasters. As a result, the vegetation cover is improved, number of days with sand-dust storms reduced. From the end of the 19th century to the 1970s, the climate was warm and dry, and then changed to warm and wet. The effects on northwest China can be classified into three classes by using the relation between precipitation and evaporation increase. If precipitation increases more than evaporation, runoff increases and lake water levels rise. We identify regions with: (1) notable change, (2) slight change and (3) no change. The future climate for doubled COconcentration is simulated in a nested approach with the regional climate model-RegCM2. The annual temperature will increase by 2.7 ^ C and annual precipitation by 25%. The cooling effect of aerosols and natural factors will reduce this increase to 2.0 ^C and 19% of precipitation. As a consequence, annual runoff may increase by more than 10%.

DOI

63
Shi Y, Zhang X, 1995. The effect of climate change on surface water resources and future trend in the northwest arid region, China. Science in China (Series B), 25(9): 968-977. (in Chinese)

64
Song C, Huang B, Ke L, 2013. Modeling and analysis of lake water storage changes on the Tibetan Plateau using multi-mission satellite data.Remote Sensing of Environment, 135: 25-35.Estimation of the water storage changes in the lakes of the Tibetan Plateau (TP) is essential for an accurate evaluation of climate change in this alpine region and its impact on the surrounding hydrologic environment. Because of the remoteness and poor accessibility of these alpine lakes, and a lack of lake bathymetric data, estimating their mass budget over the TP poses a considerable challenge. However, the integration of optical remote sensing images, satellite altimetry data, and gravimetry data makes it possible to monitor the overall variations in lake water storage in this extensive region. The ICESat/GLAS altimetry data used in this study reveal that most of the lakes in the TP showed a significant upward tendency (0.2-0.6 m/year) in water level between 2003 and 2009, particularly those lakes that are supplied with a large proportion of glacial meltwater. A series of lake area data derived from Landsat MSSaM/ETM + imagery over the past four decades indicate that during the 1970-1990 period most of the lakes experienced severe shrinkage, with only some of those in central and western Tibet undergoing expansion. During the 1990-2011 period, in contrast, the majority of the lakes on the TP displayed a remarkably expansion tendency. The total lake area increased from 35,638.11 km(2) in the early 1970s to 41,938.66 km(2) in 2011. Based on the statistical relationships between the extent of the lake surface area and lake water levels from 2003 to 2009, an empirical model for each of the region's 30 lakes is established to estimate the lake water level from the corresponding area data, thereby reconstructing time series of lake level data for each lake from the 1970s to 2011. Based on time series of lake area and water level data, a time series of lake water volume is also reconstructed. The results show that total lake water storage increased by 92.43 km(3) between the early 1970s and 2011, with lakes with an area larger than 100 km(2) accounting for 77.21% of the total lake water volume budget. Moreover, the GRACE signals confirm a similar spatial pattern in water mass changes, i.e., a significantly positive water mass balance in the north and center of the TP and mass loss in southeastern Tibet and along the Himalayas. The water mass budget (6.81 km(3)/year) derived from satellite gravimetry signals in the Chiangtang Plateau are in good agreement with the estimated rising rate of 6.79 km(3)/year of lake water storage in this region based on the empirical model developed in this study. The mechanism of lake water storage changes is discussed and analyzed with reference to previous studies. (C) 2013 Ersevier Inc. All rights reserved.

DOI

65
Song C, Ye Q, Cheng X, 2015. Shifts in water-level variation of Namco in the central Tibetan Plateau from ICESat and CryoSat-2 altimetry and station observations.Science Bulletin, 60(14): 1287-1297.

66
Sorg A, Bolch T, Stoff Met al., 2012. Climate change impacts on glaciers and runoff in Tien Shan (Central Asia).Nature Climate Change, 29: 1-7.ABSTRACT 1 I n regions with little summer precipitation, glaciers play an important role in streamflow regimes, as meltwater from the ice is released when other sources such as snowmelt are depleted 1–3 . This situation is well reflected in the Tien Shan (Chinese for 'Celestial Mountains'), where glaciers contribute considerably to freshwater supply during summer in the densely populated, arid lowlands in Kyrgyzstan, Kazakhstan, Uzbekistan, Turkmenistan and Xinjiang/China 4,5 . As in many other parts of the world, glaciers in the Tien Shan have been retreating since the end of the Little Ice Age (LIA) in the mid-nineteenth century 6–8 — a tendency that has accelerated since the 1970s 9,10 . Intensified glacier melt strongly affects the quantity and seasonal distribution of runoff in Central Asia's glacier-fed watersheds 11,12 . Although in the first instance shrinking glaciers supply ample quantities of water in the form of increased glacial runoff, reduced glacier volume will ultimately result in a decrease in both glacier-fed and total runoff, if there are no increases in water amount from other sources, for example precipitation and/or thaw-ing of ice-rich permafrost, to offset water deficiency from reduced glacier melt. As a consequence, continued glacier shrinkage will eventually transform glacial–nival runoff regimes in the Tien Shan into nival–pluvial regimes, with a much larger year-to-year vari-ability in water yields 13 . Such an alteration in runoff may not only intensify ecological problems such as the drying of the Aral Sea 14–16 but also add to political instability in Central Asia 17 . Only a limited number of studies currently address the timing and evolution of expected glacier shrinkage 18,19 and related changes in runoff 20,21 . In this Review, we explore the range of changes in gla-ciation and related discharge in different climatic regions of the Tien Shan. Based on existing data, we present a comprehensive perspec-tive by addressing the following key questions: (1) How does climate change affect the Tien Shan mountains and what responses of gla-ciers and rivers have been observed? (2) Which alterations in glaciers and runoff can be expected based on future climate scenarios and what are the uncertainties? (3) What are possible impacts of altered water availability on social and political stability in Central Asia? Climate-driven changes in glacier-fed streamflow regimes have direct implications on freshwater supply, irrigation and hydropower potential. Reliable information about current and future glaciation and runoff is crucial for water allocation, a com-plex task in Central Asia, where the collapse of the Soviet Union has transformed previously interdependent republics into autonomous upstream and downstream countries. Although the impacts of climate change on glaciation and runoff have been addressed in previous work undertaken in the Tien Shan (known as the 'water tower of Central Asia'), a coherent, regional perspective of these findings has not been presented until now. Here we show that glacier shrinkage is most pronounced in peripheral, lower-elevation ranges near the densely populated forelands, where summers are dry and where snow and glacial meltwater is essential for water availability. Shifts of seasonal runoff maxima have already been observed in some rivers, and it is suggested that summer runoff will further decrease in these rivers if precipitation and discharge from thawing permafrost bodies do not compensate sufficiently for water shortfalls.

DOI

67
Tang W, Yang K, Qin Jet al., 2011. Solar radiation trend across China in recent decades: A revisit with quality-controlled data.Atmospheric Chemistry and Physics, 11: 393-406.Solar radiation is one of the most important factors affecting climate and environment, and its long-term variation is of much concern in climate change studies. In the light of the limited number of radiation stations with reliable long-term time series observations, this paper presents a new evaluation of the long-term variation of surface solar radiation over China by combining quality-controlled observed data and two radiation models. One is the ANN-based (Artificial Neutral Network) model and the other is a physical model. The two models produce radiation trends comparable to the observed ones at a few validation stations possessing reliable and continuous data. Then, the trend estimate is extended by the ANN-based model to all 96 radiation stations and furthermore extended by the physical model to all 716 China Meteorological Administration (CMA) routine stations. The new trend estimate is different from previous ones in two aspects. First, the magnitude of solar radiation over China decreased by about -0.23 W m(-2) yr(-1) between 1961 and 2000, which is greatly less in magnitude than trend slopes estimated in previous studies (ranging over -0.41 similar to -0.52 W m(-2) yr(-1)). Second, the "From Dimming to Brightening" transition in China during the late 1980s similar to the early 1990s was addressed in previous studies, but this study indicates the solar radiation reached a stable level since the 1990s and the transition is not noticeable. These differences indicate the importance of data-quality control and analysis approaches. Finally, an obvious transition from brightening to dimming around 1978 is found over the Tibetan Plateau, where aerosol loads are very low, indicating that the importance of cloud changes in altering solar radiation may be comparable to that of the aerosol changes.

DOI

68
Urban T, Schutz B, Neuenschwander A, 2008. A survey of ICESat coastal altimetry applications: Continental coast, open ocean island, and inland river.Terrestrial, Atmospheric and Oceanic Sciences, 19(1): 1-19.ICESat satellite laser altimetry provides an unprecedented set of global elevation measurements of the Earth, yielding great detail over ice, land and ocean surfaces. Coastal regions in particular, including seamless land-water transitions, benefit from the small footprint (50 to 90 m), high resolution (40 Hz, 芒藛录170 m along-track), and high precision (2 to 3 cm) of ICESat. We discuss the performance and character of ICESat data in three example coastal scenarios: continental coast (Louisiana-Mississippi Gulf Coast, USA, including Lake Pontchartrain), open ocean island (Funafuti, Tuvalu), and an inland river (confluence of Tapajos and Amazon rivers, Brazil). Water elevations are compared to tide gauge heights and to TOPEX and Jason-1 radar altimetry. In demonstrating the utilization of ICESat, we also present examples of: laser waveform shapes over a variety of surface types (water, land, and vegetation); vegetation canopy heights (detecting large-scale destruction from Hurricane Katrina comparing data before and after); sub-canopy surface water; measurements of waves; and examination of along-stream river slope and comparisons of river stage to hydrologically-driven GRACE geoid change.

DOI

69
Wan W, Xiao P, Feng Xet al., 2014. Monitoring lake changes of Qinghai-Tibet Plateau over the past 30 years using satellite remote sensing data.Chinese Science Bulletin, 59(8): 701-714. (in Chinese)

70
Wang B, Bao Q, Hoskins Bet al., 2008. Tibetan Plateau warming and precipitation changes in East Asia. Geophysical Research Letters, 35(14): L14702, 1-5.

71
Wang L, Xie Z, Liu Set al., 2011. Glacierized area variation and its response to climate change in Qangtang Plateau during 1970-2000.Journal of Glaciology and Geocryology, 33(5): 979-990. (in Chinese)

72
Wang X, Gong P, Zhao Yet al., 2013. Water-level changes in China's large lakes determined from ICESat/GLAS data.Remote Sensing of Environment, 132: 131-144.Water-level changes from 56 of the 100 largest lakes in China were derived from ICESat/GLAS data during the period of 2003 to 2009. An automated method for determining the trend of water-level change had been proposed in this study. Lake water footprints were first identified from the ICESat/GLAS GLA14 data product. Water level change was then determined from the footprints over lake water in each campaign. Trend of water-level changes was fitted with a line for each lake. Trends of water level changes from ICESat/GLAS matched well with gauge measurements in both Qinghai Lake and Nam Co. Our results showed that the trend of water-level change varied from -0.51 m/a to 0.62 m/a. Eighteen lakes showed a decreasing trend of water-level change and 38 lakes showed an increasing trend. Most lakes in Qinghai-Tibet Plateau showed an increasing trend which was probably caused by snow or glacier melts under climate warming. However, most lakes in the Yarlung Zangbu River basin showed a decreasing trend presumably resulting from intensified evaporation caused by climate warming and intensified western wind in the winter. Desertification and aggravated soil erosion in this region contributed to water level decrease. Lakes in northern Inner-Mongolia and Xinjiang and Northeast Plain of China showed decreasing trends with precipitation reduction and warming as the most probable reasons. Water consumption for agricultural use also contributed to water-level decrease in lakes of those regions. Lakes in East China Plain fluctuated presumably because most lakes were greatly affected by inflows of Yangtze River and human activities. Lakes in Yunnan-Guizhou Plateau also fluctuated. There were no obvious changes in climate warming or precipitation in this region. Published by Elsevier Inc.

DOI

73
Wu Y, Zhu L, Ye Qet al., 2007. The response of lake-glacier area change to climate variations in Nam Co Basin, central Tibetan Plateau, during the last three decades.Acta Geographica Sinica, 62(3): 301-311. (in Chinese)<p>Based upon the 1970 aero-photo topographic map and TM/ETM satellite images taken in 1976, 1991 and 2000, the authors artificially interpret boundary of lake water and glaciers and calculate their areas in different stages with the support of GIS. Results show that from 1970 to 2000, lake area increased from 1941.64 km<sup>2</sup> to 1979.79 km<sup>2</sup> with a rate of 1.27 km<sup>2</sup>/a, while glacier area decreased from 167.62 km<sup>2</sup> to 141.88 km<sup>2</sup> with a rate of 0.86 km<sup>2</sup>/a. The increased rate of lake area in 1991-2000 was 1.76 km<sup>2</sup>/a that was faster than 1.03 km<sup>2</sup>/a in 1970-1991, while in the same period of time, the shrinking rates of glaciers area were 0.97 km<sup>2</sup>/a and 0.80 km<sup>2</sup>/a respectively. Climatic factors such as air temperature, precipitation, maximum possible evaporation and their values in warm seasons and cold seasons over the past 30 years are analyzed with linkage of the lake and glaciers variations. The results suggest that temperature increasing is the main reason for accelerated melting of glaciers. Lake area enlargement is mainly induced from the increase of glacier melting water, while slight increase of precipitation and obvious decrease of evaporation are also important factors. Regional precipitation and evaporation and their linkages with lake area enlargement need to be thoroughly studied under the global warming and glaciers retreating.</p>

74
Yan L, Zheng M, 2015. The response of lake variations to climate change in the past forty years: A case study of the northeastern Tibetan Plateau and adjacent areas, China.Quaternary International, 371: 31-48.

75
Yan Q, Liao J, Shen G, 2014. Remote sensing analysis and simulation of change of Ulan Ul Lake in the past 40 years.Remote Sensing for Land and Resources, 26(1): 152-157. (in Chinese)In order to study the response relationship of the change of the Hoh Xil Lake to the climate change,the authors extracted surface area of the Ulan Ul Lake based on the remote sensing images( Landsat TM / ETM+) from 1970 to 2010,and examined the lake level elevation variations by GLAS / ICESat lase altimeter during the period of 2003- 2009. On the basis of the lake area and level elevation extracted from remote sensing data,the variations of water quantity were calculated. SWAT model( soil and water assessment tool) was used to simulate the runoff in the basin of the Ulan Ul Lake from 1970 to 2012. During the simulation,DEM,land- use classification,soil classification and meteorological data served as input data,and the model was calibrated and verified by the variations of water quantity. The results showed that the lake area decreased by 70 km2from 1970 to 1990,and increased by 129 km2from 1990 to the present; the correlation coefficient of the simulated and measured data is R2= 0. 82. These data suggest that the model is feasible,and the simulation results are in agreement with measured results from remote sensing. The average annual runoff of the Ulan Ul Lake was 103. 8 mm,and the peak of runoff occurred from July to September.

DOI

76
Yao X, Liu S, Li Let al., 2013. Spatial-temporal variations of lake area in Hoh Xil region in the past 40 years.Acta Geographica Sinica, 68(7): 886-896. (in Chinese)As one of the areas with numerous lakes on the Tibetan Plateau, the Hoh Xil region plays an extremely important role in the fragile plateau eco-environment. Based on topographic maps in the 1970s and Landsat TM/ETM+ remote sensing images in the 1990s and the period from 2000 to 2011, the data of 83 lakes with the area above 10 km<sup>2</sup> were obtained by digitization method and artificial visual interpretation technology, and the causes for lake variations were also analyzed. Some conclusions can be drawn as follows. (1) From the 1970s to 2011, the lakes in the Hoh Xil region firstly shrank and then expanded. In particular, the area of lakes generally decreased during the 1970s-1990s. Then the lakes expanded during the 1990s-2000 and their area was slightly higher compared with the 1970s. The area of lakes dramatically increased after 2000. (2) From 2000 to 2011, the lakes with different area scales in the Hoh Xil region showed an overall expansion trend. Meanwhile, some regional differences were also discovered. Most of the lakes expanded and were widely distributed in the northern, central and western parts of the region. Some lakes merged together or overflowed due to their rapid expansion. A small number of lakes with the trend of area decrease or strong fluctuation were scattered in the central and southern parts of the study area. And their variations were related to their own supply conditions or hydraulic connection with the downstream lakes or rivers. (3) The increase in precipitation was the dominant factor resulting in the expansion of lakes in the Hoh Xil region. The secondary factor was the increase in melt water from glaciers and frozen soil due to climate warming.

77
Ye Q, Yao T, Zheng Het al., 2008. Glacier and lake co-variations and their responses to climate changes in the Mapam Yumco Basin on Tibet.Geographical Research, 27(5): 1178-1190. (in Chinese)Glacier and lake variations in the Mapam Yumco Basin were studied by integrating series of spatial data from topographic maps and Landsat images in four different periods of time:1974,1990,1999 and 2003.The results indicate that glaciers and lakes in the Basin both retreated and advanced during the last 30 years.As a contribution to the studies of the impact of climate change on glaciers and lakes in high-altitude closed basins of the western Himalayas,we present spatial and temporal variations of glaciers and lakes in the Mapam Yumco Basin on the Tibetan Plateau,by means of Geographical Information System and Remote Sensing techniques.Our results show that both glacier and lake areas in the Mapam Yumco Basin decreased from 1974 to 2003.Glaciers in the basin have receded due to the warmer climate,in total by 7.53 km2(0.26 km2 a-1 or 0.25 % a-1)during 1974 2003(c.f.0.07 % a-1 nearby the Yamzhog Yumco Basin,and 0.18% a-1,the mean glacier recession rate over China since the 1960s).During the same period,lake area decreased by 34.16 km2(1.18 km2 a-1 or 4.37 % of whole lake area in the basin)in total,where decreased by 1.43 km2 a-1 on average(with lake shrinkage amounting to 1.70 km2 a-1 in some areas and lake growth to 0.27 km2 a-1 in others)during 1974-1990,by 1.55 km2 a-1(with lake shrinkage amounting to 2.15 km2 a-1 in some areas and lake growth to 0.60 km2 a-1 in others)during 1990-1999,while enlarged by 0.66 km2 a-1(with lake shrinkage amounting to 2.24 km2 a-1 and lake growth to 2.89 km2 a-1)during 1999-2003 over the past three decades.It is suggested that both enlargement and reduction of lakes were accelerated,which might be an indicator for an accelerated water cycle process over the Tibetan Plateau in a warming climate condition.

DOI

78
You Q, Kang S, Pepin Net al., 2010. Climate warming and associated changes in atmospheric circulation in the eastern and central Tibetan Plateau from a homogenized dataset.Global and Planetary Change, 72(1/2): 11-24.

79
Zhang G, Xie H, Duan Set al., 2011a. Water level variation of Lake Qinghai from satellite and in situ measurements under climate change. Journal of Applied Remote Sensing, 5: 053532-1-053532-15.

80
Zhang G, Xie H, Kang Set al., 2011b. Monitoring lake level changes on the Tibetan Plateau using ICESat altimetry data (2003-2009).Remote Sensing of Environment, 115: 1733-1742.In this study. ICESat altimetry data are used to provide precise lake elevations of the Tibetan Plateau (IF) during the period of 2003-2009. Among the 261 lakes examined ICESat data are available on 111 lakes: 74 lakes with ICESat footprints for 4-7 years and 37 lakes with footprints for 1-3 years. This is the first time that precise lake elevation data are provided for the 111 lakes. Those ICESat elevation data can be used as baselines for future changes in lake levels as well as for changes during the 2003-2009 period. It is found that in the 74 lakes (56 salt lakes) examined, 62 (i.e. 84%) of all lakes and 50 (i.e. 89%) of the salt lakes show tendency of lake level increase. The mean lake water level increase rate is 0.23 m/year for the 56 salt lakes and 0.27 m/year for the 50 salt lakes of water level increase. The largest lake level increase rate (0.80 m/year) found in this study is the lake Cedo Caka. The 74 lakes are grouped into four subareas based on geographical locations and change tendencies in lake levels. Three of the four subareas show increased lake levels. The mean lake level change rates for subareas I, II, III, IV, and the entire TP are 0.12, 0.26, 0.19, -0.11, and 0.2 m/year, respectively. These recent increases in lake level, particularly for a high percentage of salt lakes, supports accelerated glacier melting due to global warming as the most likely cause. (C) 2011 Elsevier Inc. All rights reserved.

DOI

81
Zhang G, Xie H, Yao Tet al., 2014a. Quantitative water resources assessment of Qinghai Lake Basin using snowmelt runoff model (SRM).Journal of Hydrology, 519: 976-987.国内

DOI

82
Zhang H, Lu A, Wang Let al., 2011c. Glacier change in the Shulenan Mountain monitored by remote sensing.Journal of Glaciology and Geocryology, 33(1): 8-12.

83
Zhang X, Ren Y, Yin Zet al., 2009. Spatial and temporal variation patterns of reference evapotranspiration across the Qinghai-Tibetan Plateau during 1971-2004.Journal of Geophysical Research, 114: D15105.

84
Zhang X, Wu Y, Zhang X, 2014b. Water level variation of inland lakes on the south-central Tibetan Plateau in 1972-2012.Acta Geographica Sinica, 69(7): 993-1001. (in Chinese)The changes of lake levels could keep a record of lake variation on the Tibetan Plateau. Under the background of global warming in recent years, it is of importance to understand regional responses to climate changes by revealing the lake level variation of the inland lakes on the Tibetan Plateau. The paper obtained the time-series of the five typical lake areas and levels from 1972 to 2012 in the south-central Tibetan Plateau, and used the multisensor remote sensing data to analyze the variation of lake levels in recent 40 years. The results show that the three inland lakes (Pumo Yumco, Taro Co and Zhari Namco) expanded by 0.89 m, 0.70 m and 0.40 m in water level, respectively, while the two lakes (Peiku Co and Mapang Yumco) presented a decreasing tendency in water level. On the whole, the period 2000-2012 experienced remarkable changes compared with the preceding period (1976-1999). In term of spatial changes, the lakes of Peiku Co and Mapang Yumco, located in south fringe of the Tibetan Plateau, have shown the consistency in lake level changes, and so are the lakes of Taro Co and Zhari Namco in the southwestern part of central Tibetan Plateau.

DOI

85
Zhang Y, Liu C, Tang Yet al., 2007. Trends in pan evaporation and reference and actual evapotranspiration across the Tibetan Plateau.Journal of Geophysical Research, 112, D12110.中国科学院机构知识库(中国科学院机构知识库网格(CAS IR GRID))以发展机构知识能力和知识管理能力为目标,快速实现对本机构知识资产的收集、长期保存、合理传播利用,积极建设对知识内容进行捕获、转化、传播、利用和审计的能力,逐步建设包括知识内容分析、关系分析和能力审计在内的知识服务能力,开展综合知识管理。

DOI

86
Zhao Y.2014. Dynamic variations of glaciers-lake in YamzhoYumco Basin of Tibet.Journal of Arid Land Resources and Environment, 28(8): 88-93. (in Chinese)Based on the Landsat satellite images,digital elevation model( DEM) data and meteorological data, with remote sensing and geographic information system technology,the glacier and lake variations from 1977 to 2012 in the basin as well as the causes were analyzed. Glaciers in the basin shrinked during last 35 years,and the trend of shrink accelerated after 2000. Glacier had decreased by 58. 45km2. Lake decreased firstly then expanded and decreased quickly at last during this period. Lake in the basin has decreased by 46. 19 km2. Air temperatures of the basin rose significantly,especially the winter air temperature. Glacier change was controlled by temperatures rise,but lake fluctuating depended on the combined effects of precipitation and evaporation. The connection between glaciers and lakes of the study area was not obvious. In recent years there was a warm- dry trend in this region,and big water resources pressures existed.

87
Zhu L, Xie M, Wu Y, 2010. Quantitative analysis of lake area variations and the influence factors from 1971 to 2004 in the Nam Co Basin of the Tibetan Plateau. Chinese Science Bulletin, 55(18): 1294-1303. (in Chinese)

Outlines

/