Orginal Article

Quantitative characterization and comprehensive evaluation of regional water resources using the Three Red Lines method

  • ZANG Zheng 1 ,
  • Zou Xinqing , 1, 2, 3 ,
  • XI Xu 4 ,
  • ZHANG Yu 4 ,
  • ZHENG Defeng 4 ,
  • SUN Caizhi 4
Expand
  • 1.School of Geographic and Oceanographic Sciences, Nanjing University, Nanjing 210023, China
  • 2.Collaborative Innovation Center of South China Sea Studies, Nanjing 210093, China
  • 3.Key Laboratory of Coastal and Island Development (Nanjing University), Ministry of Education, Nanjing 210023, China
  • 4.School of Urban Planning and Environmental Science, Liaoning Normal University, Dalian 116029, Liaoning, China

Author: Zang Zheng (1978-), PhD Candidate, specializes in management of natural resources. E-mail:

*Corresponding author: Zou Xinqing, Professor, E-mail:

Received date: 2015-07-03

  Accepted date: 2015-10-22

  Online published: 2016-04-25

Supported by

National Basic Science Personnel Training Fund, No J1103408 National Key Basic Research Program of China (973 program), No.2013CB956503

Copyright

Journal of Geographical Sciences, All Rights Reserved

Abstract

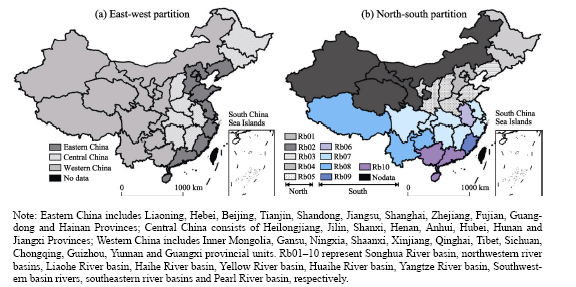
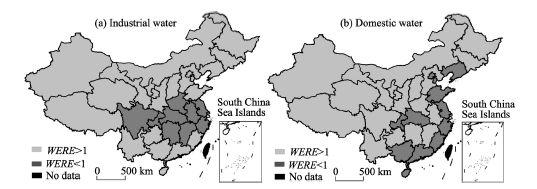
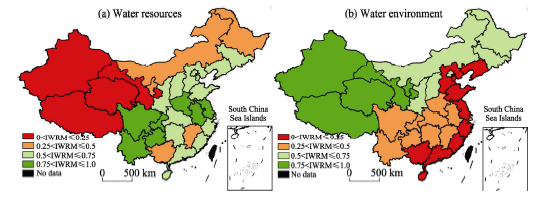
Based on the synergetic development of new industrialization, rapid urbanization and agricultural modernization (IUAM), and from the viewpoint of interactive relationships between water resources and regional population, eco-environment, economy and society, the concepts of water resources intensity (WRI), water environment intensity (WEI), water resources relative efficiency (WRRE) and water environment relative efficiency (WERE) are defined with reference to energy intensity, resources efficiency and environment efficiency theory. On the basis of benchmarking theory, the quantitative characterization and evaluation method of “Three Red Lines” (the upper limit of water resources allocation, the baseline of utilization efficiency of water resources and the upper limit of sewage discharge) is proposed. According to these concepts and models, an empirical analysis of the Three Red Lines of water resources on the Chinese mainland between 2003 and 2012 was carried out. The results showed that total water consumption in eastern, central and western parts of China possesses “club convergence” characteristics, which means these areas have similar internal conditions appeared convergence in the development. Inter-provincial differences in water consumption continue to decrease, but the north-south differentiation characteristics in the eastern and central regions were still relatively obvious, while provincial differences in the eastern part were at a minimum and the central region had the largest. Water Resources Efficiency (WRE) of all four sectors in the Southwest rivers and Huaihe River basins were generally high. Industrial WRRE in the Songhua River, Yangtze River and Pearl River basins, agricultural WRRE in the Songhua River, Yellow River and northwestern river basins and domestic WRRE in the Liaohe River, Yangtze River and Pearl River basins were all low. Eco-environmental WRRE in the southeastern rivers and Yangtze River basins were low but showed an upward trend. Other river basins, except for the Northwestern rivers basin, had high eco-environmental WRRE with a downward trend. Western China, especially the northwestern part, had a low relative intensity of the water environment (WERI) and high integrated water environment management (IWEM) performance, but the relative intensities of the water resources (WRRI) were fairly high, and the comprehensive performance of integrated water resources management (IWRM) in these regions was low. In southern China, especially the southeastern part, the IWEM was fairly high, but the overall IWRM was lower.

Cite this article

ZANG Zheng , Zou Xinqing , XI Xu , ZHANG Yu , ZHENG Defeng , SUN Caizhi . Quantitative characterization and comprehensive evaluation of regional water resources using the Three Red Lines method[J]. Journal of Geographical Sciences, 2016 , 26(4) : 397 -414 . DOI: 10.1007/s11442-016-1276-1

1 Introduction

With the rapid development of the global economy and of society in general, the overall demand for water by humans is increasing. In the context of global climate change, the multi-dimensional interactions between water resources shortage, water ecological degradation, water environmental pollution and regional eco-environmental protection, economic growth and social development at different spatio-temporal scales and levels emphasize the contradiction between the supply of and demand for local water resources and have become the critical factors restricting socioeconomic and development (in the context of global climate change, the mutual coupling of water resources shortage at different spatial-temporal scales, water ecological degradation, water environmental pollution and regional eco-environmental protection, economic growth and social development had become the critical factors which restricted economic and social development). Since the 1990s, the concept of sustainable development has become widely accepted throughout the world. Several western countries proposed that water resources should be managed as part of regional sustainable development through the concept of Integrated Water Resources Management (IWRM). This practice which originated 20 years ago as a guiding theoretical frame for national water affairs has developed into a management approach for regional sustainable development based on unified management of river basins (Shokoohi and Morovati, 2015; Nikolic et al., 2013), has evolved beyond the scope of simple water resources management and has become closely related to the development and utilization of basin natural resources, basin eco-environmental protection and basin socio-economic development (Anzaldia et al., 2014; Ching and Mukherjee, 2015; Hemamalinia et al., 2015).
At present, China is in a critical period of synergistic and interactive industrialization, rapid urbanization and agricultural modernization (IUAM). Rapid changes in urban and rural population, land use types and scales of industrial and agricultural production lead to a conflict between supply and demand of water resources and to water resources pollution, with consequent pressures on regional sustainable development (Wang et al., 2014; Yang and Liu, 2014). Sustainable utilization of water resources in some regions became critical (Ling et al., 2012; Li et al., 2014; Bao and Chen, 2015). In such a changing environment, a resources management scheme known as the Most Stringent Water Resources Management System (MSWRMS) was proposed by Ministry of Water Resources on the foundation of China’s basic water situation at the national conference on water conservancy held in 2009. At the conference, a proposal was put forward to establish a red line system of water resources management, and relevant departments were required to work out the “Three Red Lines”, including control of the amount of water resources, control of utilization efficiency of water resources and control of pollutants entering the water environment, to enhance IWRM. From then on, in accordance with No. 1 Document of central government and the 18th CPC National Congress, the MSWRMS and the Three Red Lines were established as the critical guiding ideology of China’s water conservancy for the next generation. Because uneven spatial-temporal distribution of water resources and complex relationships between humans and water resources create great difficulties for regional water resources management, some domestic scholars have carried out studies on the ideas underlying the MSWRMS and “Red Line Management of Water Resources”. Yang et al. (2012) summarized the concept of IWRM as used in other countries and compared it with the MSWRMS used in China. They concluded that the latter enriched and expanded the former. Huang and Geng (2011) discussed the innovative ideas of various water resources management systems, and then illustrated the general framework of water resources management systems on the basis of the Three Red Lines by referencing the experiences of water resources management in other countries. Chen and Huang (2011) analyzed the regional differences in the Three Red Lines management from the viewpoint of the uneven distribution of water resources in China. They proposed improved measures and approaches to eliminate the weak links in engineering construction and water resources management. Yang et al. (2013) proposed an evaluation index system by using an analytic hierarchic process (AHP) according to the current situation and characteristics of regional water resources management. This index system comprised nine criteria and 27 indicators involving three fields of the Three Red Lines. Tao et al. (2012) presented 27 control indicators based on the target of the MSWRMS and determined reference criteria of the relative indicators according to laws and regulations, market mechanism and the supply-demand conditions of water resources. Guan et al. (2013) established an evaluation system of water resources management consisting of 12 indicators on the basis of management contents of the Three Red Lines and completed grading evaluation by the Optimal Distance method. In addition, Liang and Zuo (2013), Sun and Chen (2011) and Liu et al. (2014) used Human-Water Harmony Theory, Comparative Analysis Method and AHP, respectively, to complete empirical research into the Three Red Lines of water resources management in the cities of Xinmi in Henan Province, Wuhan in Hubei Province and Beijing. They discussed the integrated management plan of water resources according to the local situation viewed from different aspects.
Following a reviewing of the literature, most studies were found to be based on the concept, the management system of the MSWRMS and the Three Red Lines at the macro level. There were far fewer quantitative evaluation studies. Among the latter, uncertainty of the meaning made promoting and applying research results difficult. In addition, the studies of water resources utilization efficiency (WUE) based on a single water sector (utilization efficiency of industrial water, agricultural water or domestic water consumption) were more common, and the isolated evaluation results could not fully support comprehensive decisions.
Against the background of IUAM that China has actively promoted and using the concepts of energy intensity, resources efficiency and environment efficiency as reference points, this paper puts forward the characterization method known as the Three Red Lines (the upper limit of the funding allocation to water resources, the baseline of utilization efficiency on water resources and the upper limit of sewage discharge) from the viewpoint of a compound system composed of regional water resources, the local population, the eco-environment and socioeconomic and development. Taking the water resources of the Chinese mainland as the input data, the Three Red Lines of water resources utilization between 2003 and 2012 at different spatial scales were characterized and evaluated using the above-mentioned concepts and models. The results of this empirical analysis provide a reference framework for other countries to implement the Three Red Lines management policy and explore an integrated management plan of regional water resources and water environment according to the Chinese experience.

2 Concepts and methods

Energy intensity, i.e. the consumption intensity of energy (Zheng et al., 2014), is one of the key indicators in measuring the relationship between economic development and energy consumption of a country or a region, and is usually characterized by energy consumption per GDP (tce/10,000 CNY). Linking energy and water usage is a challenge to achieving a sustainable future (Hussey and Pittock, 2012; The Royal Society, 2012), water resources consumption per GDP, which resembles to the concept of energy intensity, is an important indicator for measuring the WUE in the production of the gross national product, meaning the amount of water resources that were consumed to produce one unit of GDP. Higher consumption of water resources per GDP indicates higher dependence of the economy on water resources, whereas lower consumption indicates lower dependence.

2.1 Concept and method of characterization of WRI and WEI

Water is an important natural resource for production, domestic living and eco-environment (PDE), which constitutes a large, complex PRED system (made up of the population subsystem P, the water resources subsystem R, the eco-environment subsystem E and the development subsystem D) with regional population, the environment and socio-economic development. In order to more fully reflect the importance of water resources in sustaining human activity, promoting economic development and protecting the eco-environment, this paper defines the concept of intensity of water resources based on the concept of water resources consumption per GDP: water resources consumption for unit scales of PDE. The formula is given by
where WRA1, WRA2 and WRA3 represent human water consumption in production, living and eco-environmental conservation processes, respectively (m³). A1, A2 and A3 represent the water support sizes of production, living and the eco-environment, and they can be characterized by the quantity of economic output, population and available ecological occupied land area (10,000 CNY, person, hm2). By analogy, WRI1, WRI2 and WRI3 represent the WRI of the corresponding water sectors (m³/10,000 CNY, m³/person and m³ hm-2). The greater its value, the more consumption of PDE there is, and vice versa. Due to the differences in the process of water consumption, WRI can be further subdivided into industrial water consumption intensity, agricultural water consumption intensity and services water consumption intensity, urban residents living water consumption intensity and rural residents living water consumption intensity, natural ecosystem water consumption intensity, artificial ecosystem water consumption intensity and natural-artificial ecosystem water consumption intensity (limited by data constraints, industrial and agricultural consumption water, domestic consumption water, urban green space consumption water represented to case study in the following article).
Under the conditions of a specific period and a certain productivity level, natural resources utilization includes not only the low-entropy materials’ consumption (such as water, plants and mineral resources) but also the production of high-entropy waste products (such as exhaust gases, waste water and solid waste). Therefore, the demand by humans of PDE water includes both quantity and quality. Only water meeting a certain quality standard can satisfy the normal demands of PDE. Based on the pollutant discharge intensity in environmental science, as well as on formula (1) and related concepts, a macro model of water environment intensity (WEI) (based on the sewage discharge of a unit of PDE) is proposed as follows:
where WEI1, WEI2 and WEI3, respectively, stand for the pollution intensity of the water environment of the corresponding sectors (i.e. WEI, m³ 10,000 CNY, m³/person or m³ hm-2). WEA1, WEA2 and WEA3 represent the quantity of sewage produced in the process of obtaining and utilizing PDE water by humans and that cannot be normally or directly utilized (m³). A larger value of WEI shows the greater quantity of sewage accompanying PDE water per unit scale, and vice versa (limited by data constraints, we shall analyze the WEI model in the following case study from the perspective of industrial water and domestic water usage on the Chinese mainland).

2.2 Method of characterization of WRRI and WERI

According to the definition and characterization given above, WRI and WEI are both characterization values of resources efficiency and environment efficiency. For a particular area or period, they are closely related to human productivity levels, customs in daily life, eco-environmental conditions and the distribution of regional water resources. Thus WRI and WEI are dynamic concepts that include the connotation of a relative limit (Long et al., 2004).
Benchmarking Management is a modern enterprise administration technique. As an important instrument to assess organizational performance, and to promote management reform, the Benchmarking Management concept has recently spread to public service management to enable the criteria of performance assessment to be determined (Lai et al., 2011; Tsagarakis, 2013). For easy comparison, relative intensity of the water resources (WRRI) and relative intensity of the water environment (WERI) models were put forward by referencing Benchmarking Management theory:
where SC1-SC3 represent the benchmark values of optimal WRI (the upper limit) for some water sector in a certain period. WRRI1-WRRI3 are the relative intensities of regional water resources (WRRI, zero dimension). WRRI = 1 means that the WRI of the research region was in the pole position; WRRI < 1 means the WRI was better than the benchmarking value (the smaller the better), and vice versa. In the same way, the WERI was characterized by formula (4): WERI denotes the relative distance between the real WERI and the upper limit (SP1-SP3). A large value of WERI means a higher sewage discharge intensity of the region being evaluated; WERI = 1 indicates that it is a relative benchmark position.
Resources efficiency and environmental efficiency are the indicators used to measure the relationship between input and output. According to the definitions of WRI and WEI above, it is obvious that WRI and WRE are inversely related, as are WEI and Water Environment Efficiency (WEE). Thus, water resources consumption and water environmental pollutant production is the input (cost) of survival and development, and the PDE scale supported by them is the output. Therefore, relative efficiency models are proposed as follows, according to the relationship between WRRI and WERI:
where WRRE and WERE are, respectively, the relative efficiency of water resources and the relative efficiency of the water environment (subscripts 1-3 in WRRE and WERE correspond to the sectors and are dimensionless). WRRE or WERE > 1 denotes the WRRI or WERI of the research area is above the reference standard (Benchmarking). That is to say, large values of WRRE or WERE mean high water resources relative efficiency or water environment relative efficiency, while WRRE or WERE < 1 mean low water resources relative efficiency or water environment relative efficiency.

2.3 Characterization and evaluation of Three Red Lines model on water resources

According to the concepts and characterization methods discussed above, combining the management target of the Three Red Lines proposed at the National Water Resources Conference in 2009 and the fuzzy recognition models I-III (Table 1), the measuring standard to carry out Three Red Lines on IWRM is given in Table 1 (total control red line is indicated by the ratio between actual consumption of the evaluated area’s water sector (WRA1 - WRA3) and its benchmark value; it was found that the value of the conversion by the formula is equal to WRRI1 - WRRI3, which is model I).
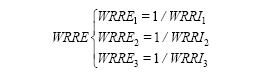
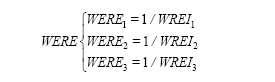
Table 1 Recognition and measuring standard of the Three Red Lines on IWRM and IWEM
Serial number Model Control objective Measuring standard
I WRRI1=?
WRRI2=?
WRRI3=?
WRA WRRI1-WRRI3 = 1 means consumption amount of water resources in the study area is exactly on the upper limit (red line) while WRRI1-WRRI3 < 1 or WRRI1-WRRI3 > 1 is under or over the red line of amount control.
II WRRE1=?
WRRE2=?
WRRE3=?
WRE WRRE1-WRRE3 = 1 means WUE in the study area is exactly on the upper limit (red line) while WRRE1-WRRE3 < 1 or WRRE1-WRRE3 > 1 under or over the red line of efficiency control.
III WERE1=?
WERE2=?
WERE3=?
WEE WERE1-WERE3 = 1 means water environment relative efficiency in the study research area is exactly on the upper limit (red line) while WERE1-WERE3 < 1 or WERE1-WERE3 > 1 under or over the red line of water environment relative efficiency.
As mentioned above, water resources and other elements that are coupled constitute a water resources system with n subsystems. Similarly, water environment and other elements that are coupled constitute a water environment system. With respect to PDE scales supported by water resources and water environment elements, they were divided into three subsystems (i.e. the water resources/environment-population subsystem, the water resources/environment-eco-environment subsystem and the water resources/environment-production subsystem). Each subsystem is formed of m elements. As mentioned above, the water resources/environment-population subsystem includes both urban and rural population, the water resources/environment-eco-environment subsystem includes the natural environment, the artificial environment and the artificial-natural environment, and the water resources/environment-production subsystem includes the agricultural, industrial and service production. To measure the performance of regional IWRM and IWEM, two measurement indicators are proposed using the comprehensive evaluation method:
where IWRM and IWEM stand for the integrated water resources management performance index and the water environment management performance index, respectively; i and j represent each subsystem’s water sector of the PRED system; wij is the normalized weight of each subsystem and each water sector. Therefore, the value of comprehensive performance ranges between 0 and 1 and is divided into four grades by the Delphi method. IWRM or IWEM∈(0, 0.25] means low performance, IWRM or IWEM∈(0.25, 0.5] means relatively low performance, IWRM or IWEM∈(0.5, 0.75] means relatively high performance and IWRM or IWEM∈(0.75, 1.0) means high performance.

3 Empirical analysis

To fully reflect the utilization of water resources in different areas or basins, taking into account data availability, we evaluated the temporal evolution and spatial distribution of water resources using the Three Red Lines management policy on the Chinese mainland (Figure 1. Hong Kong, Macao, Taiwan and the South China Sea Islands were not included) between 2003 and 2012, taking the Chinese mainland average value of the investigation period as a relative optimum reference standard and benchmark (Table 2). The data for PDE water consumption came from the Water Resources Bulletin (limited data: production water included only industrial and agricultural water, water for living purposed did not distinguish between urban and rural, ecological and environmental water were temporarily represented by the artificial ecosystem water, and each weighting factor of these four water sectors was taken as 0.25).
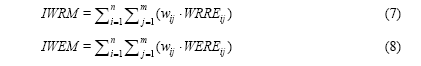
Table 2 Benchmarking of Chinese mainland integrated management target of water resources and water environment
Year 2003 2004 2005 2006 2007 2008 2009 2010 2011
A (A1+ A2+A3) 5322.7 5547.5 5633.0 5795.0 5818.7 5910.0 5965.1 6021.9 6106.9
SC SC11 207.3 173.5 150.5 131.0 113.8 93.8 88.3 74.9 63.0
SC12 1998.7 1715.8 1556.3 1481.2 1260.2 1085.6 1056.8 910.1 788.9
SC2 48.8 50.1 51.6 52.8 53.8 54.9 56.1 57.1 58.6
SC3 6728.3 6196.5 6313.0 7039.3 6186.6 6876.1 5165.8 5611.4 4993.6
SP SP1 37.4 31.2 28.5 23.4 20.0 16.2 14.9 12.3 11.3
SP2 19.3 20.2 21.9 22.9 23.8 25.1 26.8 28.5 29.8

Note: A means total water consumption (100 million tons); SC11 (ton/10,000 CNY); SC12 (ton/10,000 CNY); SC2 (ton/person); SC3 (ton/ha); SP1 (ton/10,000 CNY); SP2 (ton/person).

Considering the differences in water consumption between different industries, the quantities of industrial and agricultural water used in the production process were evaluated independently. With reference to the statistical data of the Water Resources Bulletin of China (Ministry of Water Resources of China, 2004-2013), eco-environmental water included only artificial supply to the environmental water of towns, as well as the recharge water of several rivers, lakes and wetlands, without including Yangtze water for supplying the Taihu River, environmental water in Zhejiang Province and recharge water for the Daxihaizi Tarim River in Xinjiang, the Tarim River and the Altay area. In addition, the data for economic output (industrial and agricultural production) of each research unit, the population at end of the year and the public green land area of each city were obtained from the China Statistical Yearbook (NBSC, 2004-2013a) and the China City Statistical Yearbook (NBSC, 2004-2013b). The statistical data for each first-grade region of water resources were analyzed and calculated by referencing data on the National Guide Rule of Water Resources Division and the Water Resources Bulletin for several basins. Some missing data were calculated by linear interpolation.

3.1 Analysis of trend in temporal evolution of quantity of water resources and relative utilization efficiency on Chinese mainland

3.1.1 Analysis of trend of temporal evolution of total quantity of water resources
Setting the target for the control of the quantity of water in each province as the benchmark (control benchmarking of each province over each year was determined by the proportion of total provincial allocation in 2015 proposed in Notification on Implementing the Assessment Method of the Most Stringent Water Resources Management System published by the General Office of the State Council as the basis for referring to total water supply on the Chinese mainland), the standard rates for the quantity of water resources for the 31 provinces between 2003 and 2011 and their standard deviations were calculated according to the models in Table 1 and related data, as shown in Figures 2 and 3.
As mentioned already, we separated the total control target of the Chinese mainland provinces and autonomous regions according to their proportion of the total amount of water used on the Chinese mainland in the same period. Combined with the total consumption of water resources for each province, the relative distance to the total control red line can be decided (i.e. water resources relative intensity values, Figure 2). The results indicated that total water consumption on the Chinese mainland is convergent on the whole and locally difference in research period.
In eastern China, the total quantity of water consumed by Beijing and Tianjin and in Liaoning and Shandong provinces was under the red line. Hebei exceeded the red line a few times, but in recent years its consumption has gradually reduced to below the red line, as there is relatively less availability of water in the northern basin (Figure 1). Over the entire study period, the total quantity of water consumed in Shanghai, Jiangsu and Guangdong provinces was above the red line. We can see therefore that water resources played an important role in the socioeconomic development of these three provinces. The total amount of consumption water in Zhejiang, Fujian and Hainan provinces were overweight in some years, which may be relative to the situation that water resources are abundant in the southern basin. The standard deviations (Figure 3) reflect the changing trend in the provincial differences. Figure 3 shows that the variation in water consumption in the eastern region during the study period was at first concave and then relatively flat, with values between 2003 and 2010 that were the lowest of the three regions. Although there is an obvious north-south differentiation phenomenon, there are relatively small internal differences between them, and the annual variability of the provincial differences was also low.
Figure 1 Diagram of administrative division at provincial level and compartment of first-grade region of water resources on the Chinese mainland
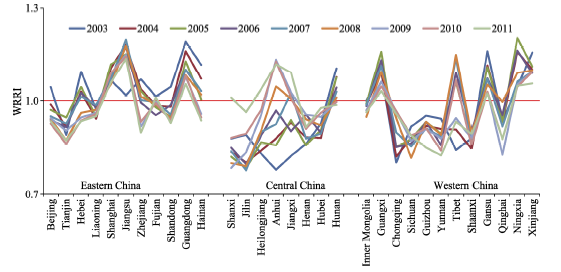
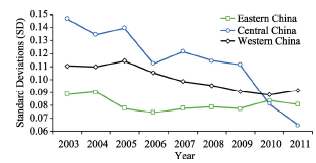
Figure 2 Variation in consumption rate of water resources for provinces on the Chinese mainland
Figure 3 Variation in total water consumption of provinces on the Chinese mainland
In central China, in addition to Hubei Province, the total quantity of water consumed in Anhui, Jiangxi and Hunan provinces located in the southern part of the basin was well above the average in some years, while Shanxi and the other three provinces in the northern basin were largely under the red line. Provincial differences in the central region were higher than those of the eastern and western regions between 2003 and 2009 (Figure 3), which coincides with the internal north-south variation phenomenon. The variations in water consumption data of Figure 3 show that the central region shrank each year except for 2007 and 2008, which were slightly higher than for 2006.
In western China, the total quantity of water in Inner Mongolia, Chongqing, Sichuan, Guizhou, Yunnan, Shaanxi and Qinghai provinces, which all contain northern basin and southern basin provinces, was under the red line. Guangxi, Gansu, Ningxia and Xinjiang provinces were above the red line in all years. The total water consumption of Tibet crossed the red line after 2008, but the north-south variation phenomenon is not particularly noteworthy. These results suggest that the usability of water resources in the western region may be made more complex by the coupling effect of water resources endowment and socioeconomic development. The variation in provincial consumption of the western region was between that of the eastern and central regions, while the overall trend is downward in all three regions, showing that total water consumption in China has “club convergence” features, which means these areas had similar internal conditions and appeared convergence in the development of total water consumption (Sun et al., 2014).
3.1.2 Analysis of the temporal evolution trend of WRRE
The WRRE on PDE water of ten first-grade regions on the Chinese mainland between 2003 and 2011 were calculated according to model II in Table 1, and the results are shown in Figure 3.
Figure 4 shows that the WRRE in the Huaihe River and the southwestern river basins were relatively high (above the red line in all years), while the WRRE of related water sectors in the other eight basins were below the water resource red line to some degree during the study period.
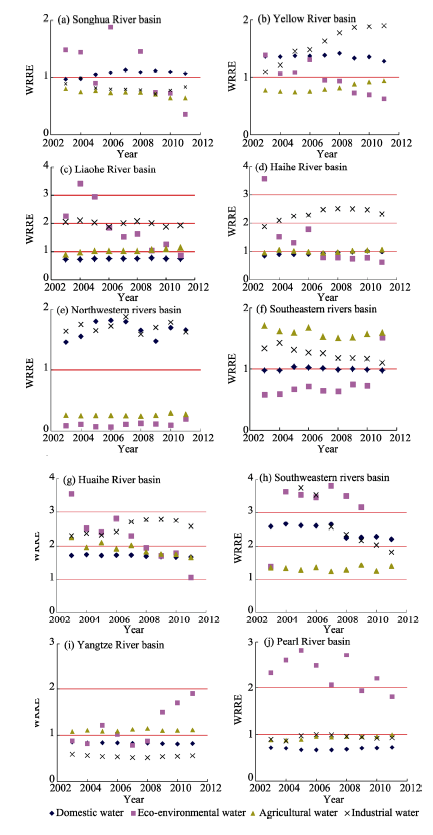
Figure 4 Variation of WRRE in all first-grade water resource regions on the Chinese mainland
Between 2003 and 2011, the WRRE in the basins of the Songhua River, the Yangtze River and the Pearl River were below the red line, which was related to the high proportion of older and heavy industries in the Songhua River basin and to abundant water resources in the Yangtze River and Pearl River basins. Thus, the industrial WRRI of these three basins was high and WRRE was low. The industrial WRRI in the river basins of southeast and southwest was high but maintained an upward trend during the study period. In contrast, the industrial WRRI in the other four regions of the north (Liaohe River, Yellow River, Haihe River and the northwestern rivers) exceeded the red line, which indicated that the industrial development mode is good for promoting industrial WUE in these regions with the continual optimization of industrial distribution (Lu et al., 2014).
The agricultural WRRE of the Songhua River, Yellow River and northwestern rivers were under the red line, particularly the agricultural WRRE in the northwestern river basins which was always abnormally low and closely related to the agricultural planting structure, climate and land resources, and other factors (Li et al., 2014). Thus, the relevant local government departments should use the water demand and water consumption characteristics of main grain crops to establish planting systems with efficient utilization of water resources in these regions (Li and Huang, 2010). The Songhua River basin is one of the most important commodity grain bases in China. Although it does not lack for sufficient water resources, their uneven distribution, decreasing from east to west and from north to south, led to a low agricultural WRRE.
In summary, the agricultural WRRE in other regions were close to or above the red line. However, considering the fundamental status of agriculture in China, and to ensure food security, it would be difficult to improve the efficiency of agricultural use of water, which is gradually increasing.
For the WRRE of residents’ domestic water use, the WRRE of the Liaohe, Yangtze and Pearl River basins were below the red line. Large city belts, such as the central and southern Liaoning, Beijing-Tianjin-Hebei, Yangtze River Delta and Pearl River Delta economic belts, are located in these basins. The Yellow River, Huaihe River, northwestern and southwestern river basins, which have large areas of agricultural population, had high domestic WRRE. Domestic water consumption per capita in these regions was lower than the national average, which was closely related to the eating and living habits of the local residents and to the natural abundance and regional allocation of water resources. The WRRE were always close to the red line in the Haihe River and Southeast rivers basins where the WRRE of residents’ domestic water usage were close to the national average.
As for the WRRE of eco-environmental water, during the research period the WRRE in the Huaihe River, Pearl River and southwestern river basins were above the red line. In the other four northern regions except for the northwestern river basins (Figure 1), the WRRE were high at the beginning but then showed a significant downward trend toward the baseline in recent years. The WRRE of the southeastern and Yangtze river basins were low in some years but have shown an upward trend recently. The WRRE in the northwestern river basins have been below the red line over the years as the condition of agricultural water resources consumption. Eco-environmental water resources in eco-fragile areas need to be improved urgently, but an impracticable goal of full eco-environmental protection would make reasonable utilization of regional water resources more complicated (Lu, 2009). Therefore, in the Northwestern inland regions with relatively scarce water resources, ecological planning should be scientifically determined by acknowledging regional realities, and urban public green spaces should be developed by adjusting measures to local conditions.

3.2 Analysis of spatial distribution of WRRE and WERE on the Chinese mainland

3.2.1 Analysis of spatial distribution features of WRRE and WERE
Using models II and III and relevant data, the WRRE and WERE of each water sector for each of the provinces in 2012 were calculated, and their spatial distribution is shown in Figures 5 and 6.
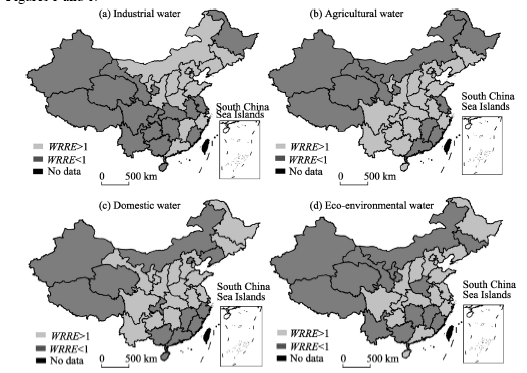
Figure 5 Spatial distribution of WRRE in each province on the Chinese mainland
From an analysis of the WRRE of different water sectors, Figure 5a shows that the industrial WRRE of 17 provinces on the Chinese mainland were below the red line in 2012. Except for Jiangsu, Shanghai, Fujian and Hainan provinces located in eastern China, the other 13 provinces are located in central and western China. From a north-south perspective, except for Zhejiang, Jiangxi and Guangdong provinces, the other 11 provinces having high industrial WRRE are located in the north, which is lacking in water resources. With the industrial WUE of these provinces tending to be stable (Lu et al., 2014), it will be crucial to continually promote new industrialization and the improved industrial WUE can reduce water consumption of industrial added value per 10,000 CNY in the northwestern, southwestern and south central regions in the future. Eleven of the provinces had agricultural WRRE that were below the red line. Among them, Jiangsu, Shanghai, Fujian and Guangdong provinces are located in eastern China, while the other seven provinces are located in central and western China (Figure 5b). The WRRE of domestic water consumption showed a distribution with high values in the center and low values in the southeast and northwest regions. There were 17 provinces above the red line while 14 provinces below the red line (Figure 5c). Low WRRE on eco-environmental water consumption had the same distribution as that of agricultural water, mainly located in central and western China. There were 18 provinces with pros and 13 provinces with cons (Figure 5d).
Figure 6 Spatial distribution of WERE in each province on the Chinese mainland
Figure 5 shows that in central and western China, especially in the western provinces that are short of water, the WRREs are generally low. On WERI, the midwest fares better than the east, and there were nine provinces with industrial WERI above the red line (WERE < 1) in 2012. These were clustered in the Yangtze and Huaihe river basins, and their regional industrial WEE were low (WERI > 1). On domestic water, there were 12 provinces that had high WERI. Except for Hebei and Shanghai provinces, nine of the 11 coastal provinces belong to this category. Their WERE on domestic water consumption were low, but the situation in the eastern region does not look favorable for the future (Figure 6b). A dense population and a high urbanization rate in these regions (Beijing, Chongqing and Hubei included) create great difficulties and uncertainties for improving environmental water quality (Huang et al., 2015).
3.2.2 Analysis of spatial distribution features of WRRE and WERE integrated management performance To illustrate the spatial distribution of WRRE and WERE on the Chinese mainland, the IWRM and IWEM of PDE water in 2012 were obtained from equations (7) and (8) and related data and are shown in Figure 7.
Figure 7a shows that low IWRMs (IWRM ≤ 0.5) were found for Xinjiang, Qinghai, Tibet, Inner Mongolia, Heilongjiang, Jiangxi and Guangxi provinces. Except for Heilongjiang and Jiangxi provinces, the other seven provinces are located in western China, where there is a shortage of water resources and economic development has fallen behind. Although these regions had low WERI (Figure 6), considering the general state of sustainable utilization of water resources in China, these provinces should follow the principle of water resources utilization that employs comprehensive planning, regional balance and deployment enhancement (Lu, 2011) and establishes authoritative organization of unity management on basin water resources to strengthen demand and supply coordination of regional water resources. From Figure 6b, we can see that compared with central and western China and the north, the IWEM of 20 provinces located in the eastern coastal areas and the south was low (IWEM≤0.5). The distribution area was the same as that which had low WERE (WERE < 1) in Figures 6a and 6b. The spatial distribution of IWRM and IWEM in China is similar to that of some regions in other countries (XNA, 2010a, 2010b). WUE in these regions lacking water resources is low and water environmental pollution in densely populated regions is heavy. Thus, affected provinces should refer to the idea of IWRM in other countries and explore sustainable utilization of regional water resources and coordinated development of PDE.
Figure 7 Grade distributions of IWRM and IWEM for the Chinese mainland
The above results indicate that western China, especially the northwestern part, has high WRRI and low WRRE. In the future, with the continuous development of agricultural modernization and rapid urbanization, and under the guidance of macro goals that ensure national food security, improved residents’ living standards and advanced ecological civil construction, it will be an important and crucial task to increase regional WUE. On the other hand, preventing the spread of contamination to less developed areas should be made more effective (Miao et al., 2015) and continue to promote regional water environment to a positive cycle. In this regard, the executive meeting of the State Council in May 2014 proposed the construction of 172 important hydraulic projects involved in step-by-step planning from the end of the 12th to the start of the 13th Five-Year Plan (Xiong, 2014) to promote the construction of inter-basin water transfer projects and water-saving irrigation projects in major grain-producing and ecologically vulnerable areas to ensure the water security of important economic regions and the livelihoods of both urban and rural residents. This is a critical moment to improve WUE and ease the conflict between water resources and PDE development in central and western China.

4 Conclusions and discussion

With reference to the concepts of energy intensity, resources efficiency and environmental efficiency, we have proposed in this paper the concepts of WRI and WEI that combine the concepts of annual water consumption per 10,000 CNY of industrial added value, annual water consumption per capita, water consumption per hectare of eco-environment, wastewater emissions per 10,000 CNY economic output and the pollution carrying capacity of the water environment. On the basis of these concepts, characterization models termed WRRI, WRRE, WERI and WERE have been proposed. Furthermore, the dynamic characterization and evaluation method of the upper limit of quantity allocation to water resources, the baseline of utilization efficiency of water resources and the upper limit of sewage discharge to the water environment were determined. By means of empirical analysis of data on the Chinese mainland during the period 2003 to 2011, we have reached the following preliminary conclusions:
(1) Between 2003 and 2011, the total water consumption on the Chinese mainland is convergent on the whole and locally different in the research period, and the eastern, central and western regions showed obvious “club convergence” features, while inter-provincial differences in the consumption of water continue to decrease. In relative terms, the overall inter-provincial differences in the total water consumption in the central region were the largest and the north-south differentiation appeared the most obvious. Differences between the eastern provinces were minimal, but also showed north-south differentiation characteristics. The western regional variations were between those of the eastern and central regions and displayed complex internal features.
(2) Between 2003 and 2011, the industrial WRE of the Songhua River, Yangtze River and Pearl River basins were low. The agricultural WRE was also low in the Songhua River, Yellow River and northwestern river basins, and the domestic WRE in the Liaohe River, Yangtze River and Pearl River basins were also high. The eco-environmental WRE was low but showed an upward trend in the southeastern and Yangtze river basins, while the eco-environmental WRE in the other four northern regions were high but showed an obvious downward trend. The WRE of all the water sectors in the Southwestern and Huaihe River basins were high.
(3) In 2012, WEI in western China, especially in the northwestern part, was low and the IWEM was high, while WRE and IWRM were both low. However, southern China, especially the southeastern part, showed high IWRM and low IWEM. In the Yangtze and Huaihe River basins, industrial WEI was high. The sewage emissions of the coastal provinces were higher than those of the non-coastal provinces.
Water resources in China are greater in the east than in the west and greater in the south than in the north. Domestic scholars in recent years have proposed numerous ideas to tackle this problem, such as water resources red lining and the establishment and implementation of the MSWRMS. The water resources of all countries and regions are limited, and there are numerous conflicts in the supply and demand of water resources among different regions, different sectors, upstream and downstream of a basin, and human production, living and eco-environment, so that management objectives related to the decomposition of different spatial-temporal scales are still to be solved and require continuous optimization in order to continue to improve this situation. This paper attempts to integrate management and evaluation of regional water resources on the foundation of a baseline (upper limit). Compared with previous research (Yang et al., 2013; Tao et al., 2012; Guan et al., 2013; Liang and Zuo, 2013, Sun and Chen, 2011), this paper proposes an upper limit of quantity allocation to water resources, a baseline of utilization efficiency of water resources and an upper limit on the amount of pollutant entering the water environment into IWRM to propose a dynamic characterization and evaluation plan. Through the strength of this concept, we hope to strengthen peer emphasis on comprehensive evaluation of water resources, and we have accordingly proposed the Three Red Lines method of a dynamic water characterization and evaluation model to make up for the deficiencies of qualitative research and to provide data to support relevant research results. On the basis of benchmarking theory, this paper attempts to put forward a water resources and water environment efficiency benchmark, which is both absolute strict and dynamic flexible. The benchmark should be reasonable in theory and necessary in practice so its implementation process can avoid the “one size fits all” problem. Based on this, combining different spatial-temporal scales, time series evolution and spatial patterns, and the quantity and quality of water resources, this paper discusses whether the WRI exceed the red line of water resources and the degree of the excess on the Chinese mainland between 2003 and 2012. The results show that the method is highly demonstrable and operable and can be widely used at different spatial-temporal scales.
It should be pointed out that evaluation and management of water resources involves national or regional politics, socioeconomic development etc., and needs long-term research and practice. As the current efficiency of water use in China and other relevant standards are far from perfect, this paper temporarily takes the mean value of Chinese mainland water resources as the benchmark for the model’s empirical analysis, and follow-up work will further investigate and establish the different spatial and temporal scales of water resources and water efficiency benchmarks. Based on integrated management objectives, we have attempted to elaborate the idea that each one of PDE is as important, so that each water department takes equally weight. Other applications may need to consider precedence to protect the status of the water sector and other issues in the spatial-temporal scales, and this can be determined by how flexible the actual situation is. Constrained as we are by data limitations, this article does not propose an all-empirical model: the water required by urban and rural residents for living is combined and not broken down into components, production water does not cover tertiary industrial water, water for the eco-environment is only evaluated for the artificial ecosystem system of water, and so on. More intensive work on these aspects remains to be carried out.

The authors have declared that no competing interests exist.

1
Anzaldia G, Rubiona E, Corcheroa Aet al., 2014. Towards an enhanced knowledge-based Decision Support System (DSS) for Integrated Water Resource Management (IWRM).Procedia Engineering, 89: 1097-1104.Currently, management tools are designed to solve specific water issues, they cannot interoperate and are losing decisional dependencies along the water supply distribution chain. This article reports a DSS, which uses decisional knowledge to improve daily operations. A specially designed Water Management Ontology (WMO) is used to encompass the water cycle from water management perspective and combined with two inference engines which provide recommendations to the water manager. This knowledge characterization permits to semantically represent human and natural paths interactions in order to discover hidden knowledge, hence founding new IWRM strategies to improve resource management and energy efficiency.

DOI

2
Bao C, Chen X J, 2015. The driving effects of urbanization on economic growth and water use change in China: A provincial-level analysis in 1997-2011.Journal of Geographical Sciences, 25(5): 530-544.

3
Chen J, Huang W, 2011. Explore water resources management issues related to the implementation of “Three Red Lines”.China Water Resources, (6): 118-120. (in Chinese)

4
Ching L, Mukherjee M, 2015. Managing the socio-ecology of very large rivers: Collective choice rules in IWRM narratives.Global Environmental Change, 34: 172-184.Integrated water resources management (IWRM) has been lauded as an integrative and participatory form of governance. However, critics claim that actual implementation remains problematic, because of deep path dependencies and the entrenched interests. This paper investigates this claim by looking at the formation of collective choice rules in integrated water resources management reforms in China’s Yellow River and the Ganges in India. The two rivers provide a natural experiment—similarity in physical scale, complexity, and integrated water resources management reforms, but highly different in social and policy contexts. Using the Q methodology and Ostrom’s Institutional Analysis and Development (IAD) framework, we find that, despite differences in policy contexts, narratives amongst the stakeholders in the two rivers are surprisingly similar, including a continued role for a negotiated local approach, and the presence of normative incentives for collective action, underwritten by deep historical meanings of the rivers. These narratives in turn provide some explanation for the choice of collective rules in use. They suggest that a modified form of integrated water resources management, taking into account narratives and collective choice rules, is useful for the governance of very large rivers across different contexts.

DOI

5
Guan G L, Xu X Y, Xu L, 2013. Study on evaluation system of water resources management according to “Three Red Lines”.Yangtze River, 44(7): 64-66. (in Chinese)In the implementation of the most strict water resources management,the responsibility and examination institution is needed to be established,the management goals of "three red line" should be quantified for practical implementation.In the light of water resources management contents of the "three red lines",the evaluation system of water resources management containing 12 indexes is put forward and the weight calculation and evaluation methods of each index is discussed.Taking Jiangyin City as example and according to local socio-economic status and development planning,we analyze the standard attainment condition of water resources management based on the "three red lines".The analysis results reflect the management level of 3 indexes of total water-use amount,water-use efficiency and pollution discharge limitation of the city.In general,the water resources management meets the national requirement for implementation of the most strict water resources management system.

6
Hemamalinia J, Mudgalb B V, Sophiac J D, 2015. Sustainability of tank eco-systems from IWRM perspective.Aquatic Procedia, (4): 633-640.Major focus of the research is to study the regional eco-hydrological changes over a period of time from 2000 to 2014 in terms of both quantity and quality to evolve sustainable pattern for protecting tank ecosystems and livelihoods of the community with IWRM perspectives. Various threats that deteriorate the conserved quantity and quality of water are assessed using primary and secondary data. The water quality analysis of tanks and the wells are done for two seasons. The Irrigation water quality indices are computed for four tanks, bore wells and open wells and compared with standards. The water quality results show that Pandravedu tank and the wells in its ayacut area are affected due to mixing of untreated dyeing industry wastewater and sewage water. Focussed group discussion revealed that due to water quality changes in Pandravedu tank there is reduction in paddy yield to about 40%, the water is also not suitable for livestock drinking, fish culture, and drinking purposes and hence community depend on other fresh water sources. These changing scenarios clearly reveal that the livelihoods of the community and tank ecosystem are under severe threat which needs immediate solution for future sustainability.

DOI

7
Huang C C, Zhang M L, Zou Jet al., 2015. Changes in land use, climate and the environment during a period of rapid economic development in Jiangsu Province, China.Science of the Total Environment, 536: 173-181.ABSTRACT Understanding changes in climate and environment on a regional scale can provide useful guidance for regional socio-economic development. The present study characterizes changes in the environment, climate, land use and cover types via in situ observed, statistical data and remote sensing images for Jiangsu Province, China, during the period 1980-2012. Statistical and spatial analyses indicate that the pace of urbanization in southern Jiangsu is more rapid than that in northern Jiangsu. Urbanization (92.7%) results primarily from the loss of farmland. While emissions of pollutants from industrial sources were well controlled, and wastewater, which more frequently derives from urban domestic sources, was found to be increasing. The rates of wastewater to population increased from 0.17卤0.017 to 0.32卤0.090 (billionton/million persons) during the two periods of 1980-2000 and 2000-2012. However, the rates of wastewater to Gross Domestic Product (GDP) decreased from 0.26卤0.20 to 0.014卤0.009 (billionton/billion Yuan), respectively. The significant increase in scattering radiance and Earth's albedo caused by the urbanization and its process (Pearson correlation coefficient (r) between urban land and scattering radiance=0.86, p<0.0001; r between farmland and scattering radiance=-0.92, p<0.0001) aggravates the warming in the regional scale. This correlation analysis indicates that temperature will decrease with the increase of woodland, grassland and farmland, and will increase with the increase of urbanized and unexploited lands. Added to warming caused by an increase in CO2, land use/cover change and human activities may be the primary reason for the rising temperatures in Jiangsu Province. The change in regional thermal conditions reduces both local humidity and land atmosphere flux exchange. The low atmosphere flux exhange contributes to the spread of atmospheric pollutants and the deposition of atmospheric particles. Copyright 漏 2015 Elsevier B.V. All rights reserved.

DOI PMID

8
Huang C S, Geng L H, 2011. Water resources management mode based on “Three Red Lines”.China Rural Water and Hydropower, (11): 30-31. (in Chinese)Carrying out the strictest water resources management system is related to the sustainable development of our country.Based on the Summary of the main water resources management modes and special emphasis at home and abroad,the innovation and developing idea of the management mode in China are discussed.The connotation and overall framework of water resources management mode based on "three red lines" is analyzed and the demand in water resources management is suggested.

9
Hussey K, Pittock J, .

10
Lai M C, Huang H C, Wang W K, 2011. Designing a knowledge-based system for benchmarking: A DEA Approach.Knowledge-Based Systems, 24(5): 662-671.First developed by Xerox in 1979, benchmarking provides measurement and comparison to improve processes and achieve higher performance. Benchmarking has proven a powerful tool for total quality management and process improvement. Successful benchmarking implementation is based on an effective benchmarking tool. To effectively implement benchmarking processes, this work proposes an integrated framework for the benchmarking tool and knowledge-based system using the data envelopment analysis (DEA) method, and then develops an intellectual benchmarking knowledge-based system (BKBS) for benchmarking, performance evaluation and process improvement. Accordingly, this work illustrates how the benchmarking knowledge-based system (BKBS) is implemented in a medical center. This system can help determine the particular benchmarking partners to evaluate the relative efficiency and fill the gaps between the benchmarking partners in the healthcare industry. Finally, the intellectual benchmarking knowledge-based system offers a very fast way to implement the benchmarking processes. (C) 2011 Elsevier B.V. All rights reserved.

DOI

11
Li B G, Huang F, 2010. Trends in China’s agricultural water use during recent decades using the green and blue water approach.Advances in Water Science, 21(4): 575-583. (in Chinese)China agricultural water use and management are facing enormous challenges in the 21st century.The core concepts of the paradigm shift in the global scientific research and public policy are regarding the agricultural water use and management in the last decade,i.e.,green water(GW),blue water(BW),the crop water productivity (CWP),and the broadly-defined agricultural water resources(BAWR),as well as matching between the cropland and the BAWR.Using these concepts,we propose an integrated framework for assessing China's agricultural water use of 1998-2007.The results reveal that among all the water that is potentially available for the cropland use,the GW contribution accounts for 57%and the remaining 43% are coming from BW.The CWP of major grain crops have already been at or approaching to the higher levels as measured by the international standards.Further improvement on the subject is thus limited.Based upon our estimated value of BAWR,the bottom line of water resources for the China's food security should then be set at 7 800&#215;10<sup>8</sup>m<sup>3</sup>.

12
Li Q, Chen H M, Wang Y P, 2014. The interactive effect of agricultural water and agricultural economic growth in Xinjiang.Resources Science, 36(8): 1679-1685. (in Chinese)Under the influence of factors such as the shortage of water resources,soil degradation,fragile ecological environment,the collaborative relationship is weak between agricultural economy of rapid development with the agricultural water of the high consumption in Xinjiang,which has the characteristics of鈥榦asis irrigation agriculture'. This article is based on panel data of Xinjiang of 14 ground state(city) from1997 to 2011. Using the co-integration theory to establish the panel VAR model of the agricultural water and agriculture economic growth,studied their interactive effect. We found that the three areas in Xinjiang exists long-term co-integration relationship between agricultural water and agricultural economic growth. In the short term two-way causal relationship link between agricultural water and agricultural economic growth in the eastern and northern region of Xinjiang. In the long run there is only one-way causal relationship between them. Regardless of long-term or short-term,only exist unidirectional causality in southern Xinjiang. The three areas in Xinjiang agricultural water have significant positive influence on economic growth. With the passage of time,the effect gradually strengthen in northern Xinjiang, followed in eastern Xinjiang,for the southern again. The impact of agricultural economic growth on agricultural water has significant regional difference and the rank ordering from the high impact to the low impact is the southern,northern and eastern. Therefore only according to the different causal relationship between agricultural water and agricultural economic growth in the southern,northern and eastern regions,establishing a scientific system of irrigation and water policy,optimizing the plant layout,improve the efficiency of agricultural water output and water saving technology,can effectively improve the agricultural comprehensive benefit.

13
Liang S K, Zuo Q T, 2013. Study of water resources allocation based on human-water harmony and “Three Red Lines”.Water Resources and Hydropower Engineering, 44(7): 1-4. (in Chinese)With the goal of Human-Water Harmony,a study on water resources allocation is made based on the comprehensive analysis and reasonable determination of the control indexes for the&ldquo;Three Red Lines&rdquo;,i.e. regional water consumption,water utilization efficiency and water pollution bearing capacity; in which the analysis on the harmony degree of the water resources allocation under various schemes is carried out in accordance with the quantitative method of Human-Water Harmony,and then the water allocation scheme which satisfies the control index of the&ldquo;Three Red Lines&rdquo; and has the maximum harmony degree is to be selected as the recommended scheme of the water resources allocation for providing a basis for implementing the most strict regional water resources management.

14
Ling H B, Xu H L, Fu J Yet al., 2012. Surface runoff processes and sustainable utilization of water resources in Manas River Basin, Xinjiang, China.Journal of Arid Land, 4(3): 271-280. (in Chinese)Water is the important resource to guarantee the existence and development of oases in arid areas. To improve the utilization efficiency of water resources in Manas River Basin, this paper investigated the trends and periods of runoff based on the runoff and climate data for the past 50 years. Subsequently, with the socioeconomic and water resources data, we studied a comprehensive evaluation on the water security in this area. The results indicated that the stream flows in the three hydrological stations of Hongshanzui, Kensiwat and Bajiahu have significantly increased and undergone abrupt changes, with periods of 18 and 20 years. According to assessment, water security in the Manas River Basin was at an unsafe level in 2008. In criterion layer, the ecological security index and the index of supply-demand situation are both at the relatively secure level; the quantity index and socioeconomic index of water resources are at the unsafe level and basic security level, respectively. Therefore, in order to achieve sustainable economic and social development within the Manas River Basin, it is vital to take a series of effective measures to improve the status of water security.

DOI

15
Liu X, Liu H L, Wang H Ret al., 2014 Indicator system and evaluation method of “Three Red Lines” of water resources management in Beijing.Journal of Natural Resources, 29(6): 1017-1028. (in Chinese)In order to perfect the most strictest water management system of China in the quantitative and operable manners, the"Three Red Lines"(TRL) indicator system, one kind of water resources management systems, was built in this paper by means of questionnaire survey, expert evaluation method and the analytic hierarchy process, and was designed to be implemented simultaneously with the national Five-Year Plan of the different periods as well. Then this paper proposed the TRL evaluation method, and took Beijing as an example to predict its goal values of the TRL target indicators of the year 2015 by the trend analysis method and the water quota method. Finally, we evaluated and classified the statuses of the TRL management of different districts of Beijing in 2011, and put forward corresponding proposals for improving water resources management specifically. For areas of level-5, such as Fangshan District and Daxing District, all four indicators were not up to the standard, whose total quality control, efficiency control and assimilative capacity all need to be strengthened. In particular, Fangshan District should pay more attention to its water quality amelioration, while Daxing District is bound to focus on the water use efficiency improvement. For areas of level- 4, the six urban districts should further control the water use efficiency. For areas of level-3, both Tongzhou District and Changping District need to strengthen the water pollution control. For areas of level-2, Mentougou District is supposed to emphasize water use control, Shunyi District and Yanqing District stress water pollution control. For areas of level-1, Huairou District, Pinggu District and Miyun District, all four indicators were satisfied which meant the ideal comprehensive management have been practiced there.

DOI

16
Long T R, Jiang W C, He Q, 2004. Water resources carrying capacity: New perspectives based on eco-economic analysis and sustainable development.Journal of Hydraulic Engineering, (1): 38-45. (in Chinese)

17
Lu D D, 2009. Deal with economic and social development water use and ecological system water use on perspective of “adjust”.China Water Resources, (19): 26-27. (in Chinese)

18
Lu D D, 2011. New strategy of western regional development: Enriching people and playing a main functional role should be the core.Resources Environment and Development, (1): 1-2. (in Chinese)

19
Lu D D, Jia S F, Bai Y P, 2014. Study of the necessity and possibility of water use decrease in northern China.Geographical Research, 33(2): 203-213. (in Chinese)How to utilize water resource sustainably has become one of the foci for the whole society. Water waste and low use efficiency have been the primary cause for China's water crisis. Northern China faces serious water shortage, where water resources have been overexploited for a long time, rivers became dried, the underground water was over exploited,and the river ecology and environment deteriorated. It has little possibility to further "broaden source". Although the South to North Water Transfer Project is being constructed, the cost is very high. In recent years, water use in most parts of northern China was still increasing slowly. According to the experience of developed countries, water use follows the law of Kuznets Curve: it increases along with economic development in the beginning, and reaches the peak and turns down when economic development reaches a higher level. So water use in northern China will certainly enter into a phase of low and even zero growth. The water use trend in recent years showed the premonition of turning into the stage of water use decrease:Agriculture water use decreased fluctuatedly, and the efficiency increased gradually; Industrial water use also decreased; Domestic water use, especially in cities and towns, increased, but it made up a very small percentage of the total water use. Therefore, the total water use quantity in northern China may enter into a stage of low increase or even decrease soon. In the long run, we estimate that the upper limit of total water use will be about 250 billion m3.In the aspects of government water resources management and water use idea, we should make adjustment in water demand planning, water use philosophy, water-saving measures and institutional arrangement, such as changing the tradition of overestimating water demand in making planning, and changing the traditional view of water as welfare, promote water price,and constructing a water-conserving society, etc.

DOI

20
Miao X, Tang Y, Wong C W, 2015. Environment: Polluters migrate to China’s poor areas. Nature, 518, (7540): 483. doi: 10.1038/518483.

21
National Bureau of Statistics of China (NBSC), 2004-2013. China City Statistical Yearbook: 2003-2012. Beijing: China Statistics Press. (in Chinese)

22
National Bureau of Statistics of China (NBSC), 2004-2013. China Statistical Yearbook: 2003-2012. Beijing: China Statistics Press. (in Chinese)

23
Nikolic V V, Simonovic S P, Milicevic D B, 2013. Analytical support for integrated water resources management: A new method for addressing spatial and temporal variability.Water Resources Management, 27: 401-417.Abstract<br/>This paper discusses the development of an analytical support system for implementation of the Integrated Water Resources Management (IWRM) process. The system integrates four analytical tools: (i) geographic information system; (ii) system dynamics simulation; (iii) agent-based model; and (iv) hydrologic simulation. The choice of tools is driven by their ability to (a) respond to the main requirements of the IWRM and (b) explicitly describe system behaviour as function of time and location in space. The system dynamics simulation captures temporal dynamics in an integrated feedback model that includes sectors representing physical and socioeconomic system components. Management policies established in the participatory decision making environment are easily investigated through the simulation of system behaviour. Agent-based model is used to analyze spatial dynamics of complex physical-social-economic-biologic system. The IWRM support system is tested using data from the Upper Thames River Watershed, Ontario, Canada, in collaboration with the Upper Thames River Conservation Authority.<br/>

DOI

24
Shokoohi A, Morovati R, 2015. Basinwide comparison of RDI and SPI within an IWRM framework.Water Resources Management, 29(6): 2011-2026.This study intends to evaluate the performance of RDI and SPI in Lake Urmia Basin, Iran. The data base used in this research was GPCC for precipitation and NCEP/NCAR for temperature. This study aims not only to evaluate the performance of RDI and SPI, but also to find out the reason of Urmia Lake drying up as second largest hyper saline lake in the world. According to the results, Urmia Lake basin faced the most severe drought condition in the past half century in 1998鈥2000, and afterwards it could not enter into a suitable wet state during the later years. Although it was found that both SPI and RDI performance in drought recognition was acceptable and matched in many cases; nevertheless, it was concluded that RDI is more sensitive to severe drought. While SPI had no long term trend, RDI showed negative trend and an abrupt change in around 1996 which could be addressed as a consequence of global warming. These characteristics gave a better perspective of drought phenomenon across the basin and introduced RDI as a conservative and reliable tool for studying drought in the Urmia Lake basin. In this study, it was acknowledged that drought cannot be the only reason for the lake drying up, because it was indicated that precipitation over the basin has been close to its long-term average in recent years while the lake level is continuously declining. Human activities such as dam construction during the drought periods, and also activities like extensive fish farming in rivers leading to Urmia Lake and overexploiting of surface and groundwater resources could be effective in intensifying the natural drought effects. The Current status of the Urmia Lake, once again emphasizes the importance of integrated water resources management and establishing a drought monitoring system in all basins, in which using indices like RDI can play a fundamental role. Copyright Springer Science+Business Media Dordrecht 2015

DOI

25
Sun C Z, Zhao L S, Zou Wet al., 2014. Water resource utilization efficiency and spatial spillover effects in China.Journal of Geographical Sciences, 24(5): 771-788.<p>Based on provincial panel data of water footprint and grey water footprint, and with the help of data envelopment analysis model considering and without considering the undesirable output, this paper estimates the water resources utilization efficiency in China from 1997 to 2011. The spatial weighting matrix based on economy-spatial distance function is established to discuss spatial autocorrelation of water resources utilization efficiency. With the help of absolute <em>&beta;</em>-convergence model, this paper concludes that there exists <em>&beta;</em>-convergence in the water resources utilization efficiency. Under the conditions of considering and without considering the undesirable output, it takes about 52.6 and 5.6 years respectively to achieve the extent of half of convergence. By mean of the spatial Durbin econometric model, this paper studies spatial spillover effects of the provincial water resources utilization efficiency in China. The results are as follows. 1) With considering and without considering the undesirable output, there is significant spatial correlation in provincial water resource efficiency in China. 2) Under the two cases, the spatial autoregressive coefficients (<em>&rho;</em>) are 0.278 and 0.507 respectively, at 1% significance level. There exist the spatial spillover effects of provincial water resources utilization efficiency. 3) With considering the undesirable output, these factors of the education funds, the transportation infrastructure, and the industrial and agricultural water consumption proportion have positive impacts. These factors of foreign direct investment, the industry value-added water consumption per ten thousand yuan, per capita water consumption, and the total precipitation have negative impacts. 4) Without considering the undesirable output, the factor of GDP per laborer has a greater positive significant influence on the water resources utilization efficiency. However the facts of industry value-added water consumption in ten thousand yuan and the transportation infrastructure have no significant influence. 5) Regardless of undesirable output of water resources utilization efficiency, the assessment of the present real water resources utilization in China will be distorted and policy-making will be misled. The water efficiency measure considering environmental factors (such as gray water footprint) is more reasonable.</p>

DOI

26
Sun K K, Chen J, 2011. Evaluation index quantification for “The Three Red Lines” of water resources management in Wuhan.Journal of Yangtze River Scientific Research Institute, 28(12): 5-9. (in Chinese)The Three Red Lines",as the core of the most stringent water resources management policy,consists of the red line of restricting water resources exploitation and utilization,red line of controlling water consumption efficiency,and red line of limiting water resources pollution.The implementation of each red line requires a corresponding evaluation index,which needs to be quantified as there exists disparity in different areas and industries.The article first makes an analysis on the relationship among the three red lines,and makes a quantification of each evaluation index with Wuhan Municipality as a case study.The quantification results could offer reference for the formulation of reasonable evaluation index for Wuhan's water resources management.

DOI

27
Tao J, Zuo Q T, Xue H Let al., 2012. Control indicators and determination methods of “Three Red Lines” of the strictest water resources management system.Water Saving Irrigation, (4): 64-67. (in Chinese)For realizing the specific quantitating of "three Red Lines" control indicators and implementing the most strictest water resources management system,this paper analyzed the connotation of "three Red Lines",and constructed the "three Red Lines" control indicator system from the three aspects of total amount control of water,water efficiency control and pollutant control of water function zone following the principles of core,representation,systematicness,operability and comparability.In addition,the determination method of each kind indicator was elaborated.At last,the control indicators and methods were applied to the city of Xinmi.

28
The Ministry of Water Resources of China, 2004-2012. Water Resources Bulletin of China in 2003-2011. Available at: (in Chinese)

29
The Royal Society, 2012. Energy and water linkage: Challenge to a sustainable future. (online)

30

31
Tsagarakis K P, 2013. Does Size Matter? Operating cost coverage for water utilities. Water Resour. Manage., 27: 1551-1562.

32
Wang X, Li X B, Xin L J, 2014. Impact of the shrinking winter wheat sown area on agricultural water consumption in the Hebei Plain.Journal of Geographical Sciences, 24(2): 313-330. (in Chinese)<p>This study firstly analyzed the shrinkage of winter wheat and the changes of cropping systems in the Hebei Plain from 1998 to 2010 based on the agricultural statistic data of 11 cities and meteorological data,including daily temperature,precipitation,water vapor,wind speed and minimum relative humidity data from 22 meteorological stations,and then calculated the water deficit and irrigation water resources required by different cropping systems,as well as the irrigation water resources conserved as a result of cropping system changes,using crop coefficient method and every ten-day effective precipitation estimation method. The results are as follows. 1) The sown areas of winter wheat in the 11 cities in the Hebei Plain all shrunk during the study period. The shrinkage rate was 16.07% and the total shrinkage area amounted to 49.62&times;10<sup>4</sup> ha. The shrinkage was most serious in the Beijing-Tianjin-Tangshan metropolitan agglomerate,with a shrinkage rate of 47.23%. 2) The precipitation fill rate of winter wheat was only 20%-30%,while those of spring maize and summer maize both exceeded 50%. The irrigation water resources demanded by the winter wheat-summer maize double cropping system ranged from 400 mm to 530 mm,while those demanded by the spring maize single cropping system ranged only from 160 mm to 210 mm. 3) The water resources conserved as a result of the winter wheat sown area shrinkage during the study period were about 15.96&times;10<sup>8</sup> m<sup>3</sup>/a,accounting for 27.85% of those provided for Beijing,Tianjin and Hebei by the first phase of the Mid-Route of the South-to-North Water Diversion Project.</p>

DOI

33
Xinhua News Agency (XNA), 2010a. The South African government will improve the quality and utilization efficiency of water resources. Website of Pearl River Water Resources Commission. Available at: (in Chinese)

34
Xinhua News Agency (XNA), 2010b. The pollution is increasingly serious in the Great Lakes of the US-Canada border. Website of Pearl River Water Resources Commission. Available at: (in Chinese)

35
Xiong H O, 2014. 172 Important hydraulic engineering projects constructed before 2020. The Beijing Business Today, 2014-05-22(2). (in Chinese)

36
Yang D, Zhang H, Guan X Ket al., 2013. Establishment of evaluation indicator system of “Three Red Lines” for the strictest regional water resources management.Water Resources and Power, 31(12): 182-185. (in Chinese)

37
Yang D R, Jiang N, Ma C, 2012. Thoughts on integrated water resources management and the most stringent water resources management system.China Water Resources, (20): 13-16. (in Chinese)

38
Yang Y, Liu Y, 2014. Spatio-temporal analysis of urbanization and land and water resources efficiency of oasis cities in Tarim River Basin.Journal of Geographical Sciences, 24(3): 509-525. (in Chinese)<p>This paper examines the spatial pattern of land and water resources as well as urbanization and their interactions in the Tarim River Basin, Xinjiang, China. In order to do so, we extract the data associated with efficiency of land and water resources and urbanization for the years of 1995, 2000, 2005 and 2008. Specifically the paper investigates the extent to which agglomeration of population and economic activities varies geographically and interplays with spatial pattern of resources efficiency through computation of Global Moran's I index, Getis-Ord Gi<sup>*</sup> index and a coordinated development model. The method used provides clear evidence that urbanization, land and water resources efficiency have shown uneven spatial pattern due to oasis distribution, climate, and initial phase of urban development. Some conclusions can be drawn as follows. (1) Agglomeration and dispersion of urbanization are not consistent with those of land and water resources efficiency. (2) Evolution of the hot and cold spots of urbanization, and land and water resources efficiency, in different trajectories, indicate that there are no significant interactions between them. (3) The evidence that numbers of hot and cold spots of the three factors present varying structures reveals the dominance of unequal urban development in the study area. (4) Significant differences are also found between sub-river basins in terms of the three factors, which is a reflection of the complex physical geography of the area. (5) The degree of coordinated development of cities in the Tarim River Basin is generally low in part as a reflection of difference in spatial patterns of the three factors. It is also shown that the pattern of the degree of coordinated development is relatively stable compared with evolution of hot and cold spots of the three factors.</p>

DOI

39
Zheng D F, Zang Z, Sun C Z, 2014. An improved ecosystem service value model and application in ecological economic evaluation.Resources Science, 36(3): 584-593. (in Chinese)

Outlines

/