Orginal Article

Global virtual-land flow and saving through international cereal trade

  • ZHANG Jingqi , 1 ,
  • *ZHAO Naizhuo , 2 ,
  • LIU Xingjian 3 ,
  • LIU Ying 2
Expand
  • 1. School of Humanity and Law, Northeast University, Shenyang 110169, China
  • 2. Department of Geosciences, Texas Tech University, Lubbock, TX 79409, USA
  • 3. Department of Urban Planning and Design, University of Hong Kong, Hong Kong, China

Author: Zhang Jingqi (1982-), Associate Professor, specialized in GIS & RS application of urban governance. E-mail:

*Corresponding author: Zhao Naizhuo (1981-), specialized in GIS & RS application. E-mail:

Received date: 2015-05-15

  Accepted date: 2015-07-31

  Online published: 2016-05-25

Supported by

National Social Science Foundation of China, No.15CGL078

Copyright

Journal of Geographical Sciences, All Rights Reserved

Abstract

With intense urbanization and sustained population growth, securing food production with limited land sources has increasingly become a pressing issue. Based on an analysis of international cereal (i.e., barley, buckwheat, maize, oats, rice, rye, sorghum, soybean, and wheat) trade and differences in yields of the cereal between export and import countries over the period of 2007 to 2011, we explore the great potential of land saving through the international cereal trade. By ‘land saving’, we refer to the reduced global total of lands required to produce a necessary amount of cereal when cereal is exported from a country with relatively large yield of the cereal to a country with relatively small yield of the cereal. Our scenario analysis suggests that international cereal trade would help mitigate the shortage of domestic arable land for many island countries (e.g., Japan) and countries in the arid Middle East and North Africa (e.g., Syria and Morocco). Furthermore, international cereal trade has the potential to generate ‘land saving’ of 50,092,284 ha of land per year, which is roughly the size of Spain. Drawing upon the definition of a similar concept - virtual water (Hoekstra and Hung 2002), we define virtual land as the area of land resources used for the production of goods. Through introducing the concept of virtual land, we believe land resources that are traditionally considered as stationary resources can flow with anthropogenic socioeconomic activities. The largest virtual-land flows (> 3,000,000 ha/year) exist between the United States (US) to China, Brazil to China, the US to Japan, the US to Mexico, and Argentina to China. However, not all virtual-land flows necessarily result in land saving. Thus, more endeavors are needed to plan the virtual-land flows for a larger land saving at the global scale.

Cite this article

ZHANG Jingqi , *ZHAO Naizhuo , LIU Xingjian , LIU Ying . Global virtual-land flow and saving through international cereal trade[J]. Journal of Geographical Sciences, 2016 , 26(5) : 619 -639 . DOI: 10.1007/s11442-016-1289-9

1 Introduction

Tackling the problem of supporting a rapidly growing population with increasingly limited natural resources is of vital importance for humankind. With intensified global connections and socioeconomic integration, scholars have begun to realize the potential of international trade as a venue for saving natural resources (Chapagain et al., 2006; Hoekstra and Chapagain, 2008; Fader et al., 2011). As a case in point, Hoekstra and colleagues (Hoekstra and Hung, 2002; Chapagain and Hoekstra, 2004; Chapagain et al., 2006; Hoekstra and Chapagain, 2007) have developed water footprint theory and proposed the concept of virtual water: the amount of freshwater that is consumed to produce goods (Hoekstra and Chapagain, 2007). Water saving can occur when a commodity is shipped from a site with relatively high to another site with relatively low water productivity (Chapagain et al., 2006). Following the definition of virtual water, we define virtual land as the area of land resources used throughout the production processes of the goods. In a sense when a country is importing/exporting goods, it is essentially importing/exporting the land used to produce these goods. In other words, land resources can ‘flow’ when commodities are traded from one country/region to another. Moreover, as countries’ productivity varies, producing the same commodities would require different amounts of land resources in different countries. These differences in required virtual land to produce certain goods allow for the possibility of land savings through trade at the global scale: we may produce more commodities with the existing amount of land resources or we may sustain the current level of production with less land resources. Such land savings would take place when commodities are traded from a country with more efficient land uses to a country with less efficient land uses. For example, producing 1 ton of wheat needs 0.35 ha of land per year in India but only 0.15 ha of land per year in France (FAO, 2014). If India imports 1 ton of wheat from France, at the national level India saves 0.35 ha of land while at the global scale 0.20 ha land resources are saved.
Cereal commodities are land-intensive and in high-demand. With existing land resources and cereal production capacity, a serious shortage of cereal supply will emerge in 2050 when global population is projected to be 50% larger than at present (Tilman et al., 2002). Since land resources are limited on earth, saving more land resources means additional cereal or other foods can be produced. Therefore, in addition to endeavors to improve the yield of grains, it is necessary to exploit the potential of land saving through international cereal trade. Many previous studies have shown that a certain volume of water resources can be saved by agricultural trade (Fraiture et al., 2004; Chapagain et al., 2006; Fader et al., 2011; Dalin et al., 2012), but very limited studies were performed on land saving through international trade. Würtenberger et al. (2006) and Qiang et al. (2013) have discussed country-specific land saving through agricultural trade for Switzerland and China respectively. Meanwhile, Fader et al. (2011) analyzed global land saving through agricultural trade during 1998 to 2002 however their analysis focused more on water footprints and water resources saving. Thus there exists a large lacuna in research on land saving/loss through international cereal trade at the global and the national levels.
The main objectives of this study are to investigate global virtual-land flows related to international cereal trade over recent five years (2007-2011) and explore land saving/loss generated by the cereal trade. To fulfill these objectives, we first select nine major cereals (i.e. barley, buckwheat, maize, oats, rice, rye, sorghum, soybean, and wheat). Then, we calculate and illustrate specific areas of land saving/loss led by trade of the nine cereals at the national and the global levels. Next, we discuss each country/region’s dependency on external virtual land. Finally we analyze major virtual-land flows related to cereal trade between large virtual-land-export and virtual-land-import countries and land saving/loss derived from the major virtual-land flows at the global scale.

2 Data and method

Our analysis focuses on nine major cereals (i.e., barley, buckwheat, maize, oats, rice, rye, sorghum, soybean, and wheat). A comprehensive dataset of production and trade of the nine kinds of cereals was obtained from the FAOSTAT that is established by the Food and Agriculture Organization of the United Nations (FAO) (2014). The dataset had the following variables for each country during 2007 to 2011: yield, harvested area, import quantity, and export quantity.
A country’s import/export quantity of cereals may vary greatly in different years. For example, China (here and hereafter referring to mainland China) exported 2,336,620 tons of wheat in 2007 but only 12 tons in 2010. Pakistan imported 1925 tons of rice in 2010 but in 2011 the imported quantity of rice by Pakistan rocketed to 21,052 tons. To obtain stable patterns of virtual-land flow and land saving/loss through international cereal trade of a country or the globe, we averaged data of cereal production and trade for the five-year study period (i.e. 2007 to 2011). At the national level virtual land can be saved or lost by importing or exporting cereals and so in this study imported virtual land (IVLc) and exported virtual land (EVLc) were calculated by equations 1 and 2 respectively:
where Ic,i,y and Ec,i,y represent import and export quantities of cereal i of country c in the year y respectively, and Yec,i,y represent yield of cereal i of country c in the year y. A county’s net land saving through cereal trade (NLSc) is calculated by equation 3:
If NLSc is larger than 0, it indicates the country c saved land resources through cereal trade. If NLSc is smaller than 0, it indicates the country c lost land resources through cereal trade.
At the global level virtual land can be saved through cereal trade when cereals are shipped from countries with more efficient land uses to countries with less efficient land uses. Consequently, global total virtual-land saving (GNLS) was computed by equation 4:
where GNLSi is saved virtual land through international trade of cereal i and n represents the number of countries involved in the international cereal trade during 2007 to 2011. If GNLS is smaller than 0, it implies that in most international trades cereals were shipped from less-efficient-land-use countries to more-efficient-land-use countries and consequently virtual-land loss rather than virtual-land saving occurred through international cereal trade. A few countries imported or exported cereals during 2007 to 2011 but lack corresponding data of yields. We assumed that yields of the cereals in such countries are global average yields of the cereals. The countries lacking yield data nearly all have very small import/export quantity of cereals, so our assumption did not generate substantial impacts on GNLS.
To further analyze impacts of international cereal trade on demand of a country, we calculated each country’s external land dependency (ELDc) by equation 5:
where HAc,y,i represents harvested area of cereal i of the country c in the year y. Hence, the larger an external land dependency (ELD) of a country, the more dependent the country is on international cereal trade and other countries’ land resources.
To map major virtual-land flows, we calculated the area of virtual land flowing between each two trading partners of cereal by equation 6:
where VLec-ic denotes the area of virtual land exported from the country of ec to the country of ic, Eec-ic,i,y denotes export quantities of cereal i from the country ec to the country ic in the year y, and Yeec,i,y represents yield of cereal i of the export country ec in the year y. We also calculated net land saving generated by the individual land flow between each two trading partners (NLSec-ic) by equation 7:
A positive value of NLSec-ic indicates that land resources are saved by the cereal trade between the two countries. Otherwise, land resources are lost by the trade at the global scale.

3 Results

3.1 Virtual-land flow and saving/loss at the national level

During 1997 to 2011, 201 countries (or regions) were involved in international cereal trade when 167 countries (or regions) saved land resources while 34 countries (or regions) lost land resources through the international cereal trade (Table 1 in appendix). China, Japan, Mexico, Morocco, Algeria, Venezuela, Germany, Spain, the Republic of Korea, and the Netherlands are the largest virtual-land-import countries. Imports of soybean, maize and/or wheat greatly shape the imported virtual land of the ten countries (Figure 1). Eight of the ten countries (i.e., China, Japan, Mexico, Morocco, Algeria, Venezuela, Republic of Korea, and Spain) have the largest net land-saving values and consequently saved the largest areas of land resources through cereal trade. Although they imported very large amounts of virtual land, Germany and the Netherlands also exported large areas of virtual land (1,527,475 ha and 895,418 ha, respectively). Indonesia and Nigeria replace Germany and the Netherlands and become the ninth and the tenth largest land-saving country respectively through cereal trade (Table 1).
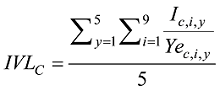
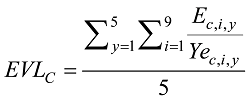
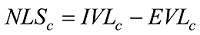
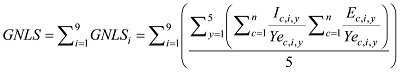
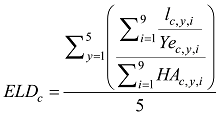
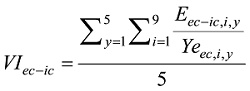
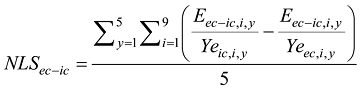
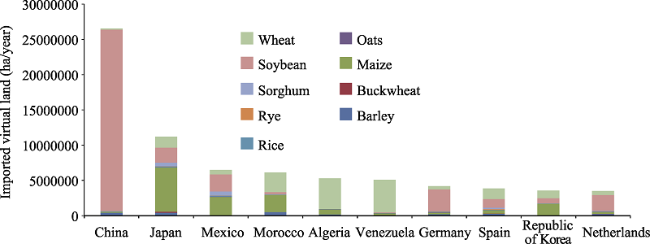
Figure 1 Imported virtual lands for the ten largest virtual-land-import countries
Table 1 Net land saving for ten countries with the largest land saving through international cereal trade (ha/year)
Country Barley Buck-
wheat
Maize Oats Rice Rye Sorghum Soybean Wheat Sum
China, mainland 428978 -81671 -88827 12896 -63483 0 -21012 25557987 36922 25781790
Japan 431432 128429 6279733 33427 105190 38876 493419 2134916 1556441 11201864
Mexico 37174 0 2552578 67634 121105 59 574826 2422318 474403 6250096
Morocco 508002 1 2480014 611 1271 0 70869 282336 2794927 6138032
Algeria 177007 0 738516 3328 53429 0 109 51 4311183 5283623
Venezuela 22 0 362312 259 30788 1 275 64168 4631608 5089433
Republic of Korea 15523 2524 1688240 1622 45090 3508 3693 722724 1064366 3547290
Spain 204313 134 469809 24364 -13070 72180 224056 1211139 1342817 3535743
Indonesia 12.47045 1 261584 217 218708 1778 332 1281372 1561662 3325665
Nigeria 161 346 -1068 9 869775 0 7923 -14962 2144898 3007082
During 2007 to 2011, 116,390,949 ha/year virtual land was exported and 81.21% of the exported virtual land was derived from ten countries (i.e., the United States, Brazil, Australia, Argentina, Canada, Russia, Ukraine, Kazakhstan, France, and Thailand). Exports of soybean, maize, wheat, or barley massively shape exported virtual land of the ten countries except Thailand (Figure 2). Exported virtual land of Thailand is mostly derived from exports of rice. Due to the very large exported virtual land, nine of the ten largest virtual-land-export countries (i.e., the United States, Australia, Brazil, Argentina, Canada, Russia, Ukraine, Kazakhstan, and France) experienced the largest net land loss in the world. India is the other top 10 net-land-loss country because of its very large net virtual-land loss in exports of maize and rice (Table 2).
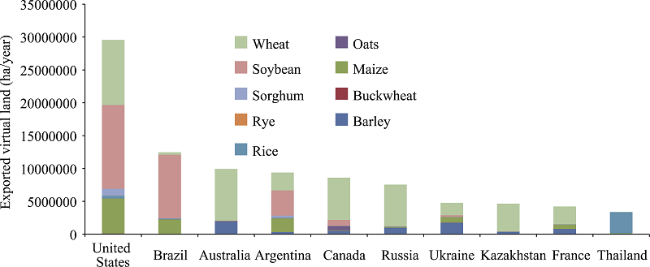
Figure 2 Exported virtual lands for the ten largest virtual-land-export countries
Table 2 Net land saving for ten countries with the largest land loss through international cereal trade (ha/year)
Country Barley Buck-
wheat
Maize Oats Rice Rye Sorghum Soybean Wheat Sum
US 17653 -15496 -5260252 777382 -332477 72504 -1048653 -12613184 -9089213 -27491736
Australia -1909820 232 -2971 -112716 6837 -830 -17183 -212 -7885973 -9922634
Brazil 108130 -186 -2048760 -3014 9416 26 -19919 -9648151 2106069 -9496388
Argentina -314566 0 -2120317 -887 -79277 6 -301830 -3414157 -2697611 -8928639
Canada -512797 -1443 145415 -634845 95259 -66811 1658 -741034 -6400894 -8115493
Russia -905298 -2556 -104323 -1536 32739 -26595 -507 591841 -6275804 -6692039
Ukraine -1767875 -715 -819118 -4835 13319 -15713 -25763 -240754 -1897307 -4758761
Kazakhstan -329121 -1269 -521 -3831 -3027 -497 1 4171 -4221700 -4555794
France -811921 3145 -600686 -10832 73780 -4268 6414 196389 -2618306 -3766286
India -61129 371 -1276268 2859 -1088450 -473 -82869 -21869 188562 -2339266

3.2 Virtual-land flow and saving at the global level

During 1997 to 2011 global total harvested area per year of the nine kinds of cereals is 755,549,880 ha, 15.4% of which (i.e., 116,390,949 ha) was exported as virtual land and consequently led to 50,092,284 ha/year virtual-land saving at the global scale. In other words, without the international cereal trade, an additional 50,092,284 ha of land, almost equal to the area of Spain, was needed to meet the demand for cereal in one year. Figure 3 shows that trade of soybean, maize and wheat have the largest contributions to global land saving. International trade of soybean, maize and wheat led to exports of 30,904,124 ha/year, 16,262,145 ha/year, and 48,994,862 ha/year virtual land, and consequent land saving of 18,353,082 ha/year, 13,838,961 ha/year, and 10,724,783 ha/year respectively. Trade of rice, barley, and sorghum also considerably contribute to land saving. With international trade of rice, barley, and sorghum 8,144,730 ha/year, 8,721,120 ha/year, and 1,761,535 ha/year virtual land was exported from 143 countries to 202 countries respectively which resulted in land saving of 2,658,103 ha/year, 2,177,040 ha/year, and 2,032,291 ha/year respectively. Relatively small virtual land was exported with international trade of oats, buckwheat, and rye and consequently relatively small areas of land resources of 2,658,103 ha/year, 92,752 ha/year, and 40,242 ha/year were saved from the trade of the three kinds of cereal respectively (Table 3).
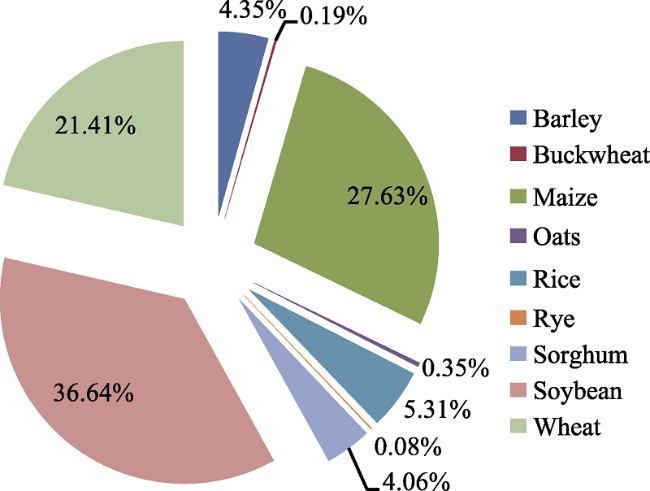
Figure 3 Contributions of different cereals to global land saving
Table 3 Virtual-land saving and land-saving efficiency for different cereals (ha/year for harvested area, imported virtual land, exported virtual land, and saved virtual land)
Barley Buck-
wheat
Maize Oats Rice Rye Sorghum Soybean Wheat Sum
Harvested area 52244089 2277652 163321757 10442451 159725031 5991368 42842243 98516364 220188925 755549880
Imported virtual land 10898160 235887 30101106 1226827 10802834 447742 3793826 49257205 59719646 166483233
Exported virtual land 8721120 143135 16262145 1051797 8144730 407500 1761535 30904124 48994862 116390949
Saved virtual land 2177040 92752 13838961 175030 2658103 40242 2032291 18353082 10724783 50092284
Land-saving efficiency 0.25 0.65 0.85 0.17 0.33 0.10 1.15 0.59 0.22 0.43

Note: Land-saving efficiency=Saved virtual land/exported virtual land

Although the largest virtual-land export derived from wheat trade (Table 3), trade of soybean and maize led to the largest virtual-land savings (Figure 3). That is because land-saving efficiency varies greatly for different cereals. In other words, when the same area of virtual land involved in different cereals is exported, the area of land saving is different. It can be seen (Table 3) that sorghum has the largest land-saving efficiency. During 2007 to 2011, 1,761,535 ha/year virtual land was exported with sorghum trade resulting in 2,032,291 ha/year land saving with land-saving-efficiency of 1.15. Compared to sorghum, oats and rye have very small land-saving efficiencies that are only 0.17 and 0.10 respectively (Table 3). Rice, barley, and wheat have medium land-saving efficiencies that are 0.33, 0.25, and 0.22 respectively. Although sorghum has a very large land-saving efficiency, its demand (i.e., an export quantity of 6,483,235 ton/year) is not very large. Soybean and maize both have relatively large land-saving efficiencies (0.59 and 0.85 respectively) and very large demands (export quantities of 84,521,025 ton/year and 106,061,257 ton/year respectively), so international trade of soybean and maize contributed to the largest virtual-land savings in the trade of the nine kinds of cereals.

4 Discussion

4.1 External land dependency

Globally there are 167 net virtual-land import countries with positive net-land-saving values through cereal trades, 62 of which exported virtual land larger than their domestic land producing cereals in area. Countries greatly dependent on international cereal trade (i.e. having very large ELD) are mostly located in West Asia (e.g. United Arab Emirates with ELD of 392, Qatar with ELD of 219, and Kuwait with ELD of 159) or North Africa (e.g., Djibouti with ELD of 12680), or are island nations (e.g., Mauritius with ELD of 969, Maldives with ELD of 89, and Papua New Guinea with ELD of 44) (Table 2 in appendix). These countries have to import a large area of virtual land to meet domestic demand on land resources due to their scarce lands suitable for cultivation or limited territories. Additionally, 24 countries/regions imported virtual land from international cereal trade but did not have any domestic land planting cereals. The 24 countries/regions (e.g. Bahrain, Hong Kong, Iceland, and Singapore) are nearly all island nations/regions (Table 2 in appendix).
It should be noted that as the largest population country China’s ELD is only 0.2688. As the second largest population country India’s ELD is -0.0238, which implies that India nearly need not import virtual land to meet domestic demand on cereal and even can export virtual land for other countries. As the third largest population country, the United States is the largest virtual-land export (and net virtual-land export) country. Even though having the largest populations, India, China, and the United States also have the largest domestic arable lands (98,280,538 ha, 95,926,026 ha, and 88,441,963 ha respectively) in the world. Thus, compared to population, domestic arable land may have greater impacts on virtual-land flow. In 2007 and 2008 China could export a considerably large amount of maize and wheat to the Democratic People’s Republic of Korea, Japan, and the Republic of Korea. These exports from China partly contribute to the adequate supply of cereal in global markets. However, with exceptional economic growth China’s demand on virtual land has increased remarkably. Since 2009 China has become a wheat net-import country and in 2010 China’s imported amount of maize began to be larger than its exported amount of maize. Moreover, the amount of soybean that China imported from the global markets increased massively during the period of 2007-2011. The changes in the balance of China’s cereal import and export resulted in an apparent increase in net imported virtual land in China (Table 4). Therefore, affluence is likely to be another dynamic of virtual-land flow.
Table 4 Changes of net imported virtual land in China from 2007 to 2011 (ha)
2007 2008 2009 2010 2011
Barley 220342 298505 465964 607120 552957
Buckwheat -94986 -71850 -77311 -95506 -68703
Maize -944805 -36605 -8739 264705 281310
Oats 1730 9410 14739 19229 19373
Rice 129463 99606 65213 35975 -12840
Rye 0 0 0 0 0
Sorghum -60852 -28967 -7329 8834 -16744
Soybean 20885180 21711957 25891107 30847583 28454109
Wheat -489017 -19756 186814 256646 249923
Sum 19647056 21962301 26530458 31944586 29459385

4.2 Major virtual-land flows and their contribution to global land saving

The largest two virtual-land flows generated by cereal trade exist between the United States to China and Brazil to China. At the national level the United States and Brazil lost 6,925,492 ha/year and 5,385,085 ha/year land resources respectively due to the cereal export to China. However, 11,574,575 ha and 9,136,082 ha lands are needed per year to produce the same amount of imported cereal if the cereals were produced in China. Hence, at the global scale 4,649,083 ha/year and 3,750,997 ha/year land resources were saved through cereal trade from the United States and Brazil to China. Table 5 shows that the United States and Brazil exporting soybean to China massively contributes to the land saving. Additionally, exports of maize and wheat from the United States to China also contribute to land saving, but exporting maize from Brazil to China generates land loss at the global scale.
Table 5 The 11 largest virtual-land flows (>1,000,000 ha/year) and land saving generated by the 11 individual virtual-land flows (ha/year)
Barley Buck-wheat Maize Oats Rice Rye Sorghum Soybean Wheat Sum
From
the US
to
China
Produced in the US 0 9 94321 0 300 169 449 6755511 74733 6925492
Produced in China 0 10 157551 0 350 106 488 11369400 46670 11574575
Land saving 0 1 63230 0 50 -63 39 4613889 -28063 4649083
From Brazil to China Produced in Brazil 0 0 8061 0 0 0 0 5375671 1353 5385085
Produced in China 0 0 3225 0 0 0 0 9132113 744 9136082
Land saving 0 0 -4836 0 0 0 0 3756442 -609 3750997
From the US to Japan Produced in the US 49492 19803 1530255 794 42203 1165 114437 920101 1143114 3821364
Produced in Japan 45194 43084 5742507 1054 60659 720 172295 1581127 951354 8597995
Land saving -4298 23281 4212253 260 18456 -445 57858 661026 -191760 4776631
The US to Mexico Produced in the US 13512 4 856712 4268 76305 86 506261 1221127 880524 3558799
Produced in Mexico 20641 4 2597371 6802 126503 113 568953 2362737 498360 6181482
Land saving 7129 0 1740659 2533 50198 26 62691 1141610 -382164 2622683
From Argentina to China Produced in Argentina 12669 0 231 0 0 0 1764 3062232 0 3076896
Produced in China 14429 0 268 0 0 0 2240 4962496 0 4979433
Land saving 1760 0 37 0 0 0 476 1900264 0 1902537
From Canada to the US Produced in Canada 131772 1588 33764 613713 0 45820 0 109596 820789 1757042
Produced in the US 116720 1773 31810 774724 0 64403 0 103019 756988 1849437
Land saving -15052 185 -1954 161011 0 18583 0 -63801 92395
From Argentina to Brazil Produced in Argentina 91391 0 3895 0 36100 24 11 315 1546233 1677969
Produced in Brazil 100754 0 6380 0 55288 30 20 311 1747153 1909937
Land saving 9363 0 2485 0 19188 5 9 -4 200921 231968
From the US to Republic of Korea Produced in the US 263 44 654768 475 11600 4422 365 193281 449706 1314923
Produced in Republic of Korea 418 38 1292935 449 12703 2806 946 333690 373658 2017643
Land saving 155 -5 638167 -26 1103 -1616 581 140409 -76048 702720
From Brazil to Spain Produced in Brazil 0 0 271063 54 1635 0 7787 793475 7 1074021
Produced in Spain 0 0 105264 50 1045 0 4621 896714 5 1007699
Land saving 0 0 -165799 -4 -590 0 -3166 103239 2 -66322
From the US to Nigeria Produced in the US 0 0 87 0 3058 0 0 1123 1032562 1036830
Produced in Nigeria 0 0 435 0 12575 0 0 3091 618377 634478
Land saving 0 0 348 0 9517 0 0 1968 -414185 -402352
From Australia to Japan Produced in Australia 347358 0 388 16860 0 0 4918 104 658657 1028285
Produced in Japan 191863 0 855 14456 0 0 5293 135 290267 502869
Land saving -155495 0 466 -2404 0 0 376 31 -368390 -525416
Table 6 exhibits virtual-land flows from the ten largest virtual-land-export countries to the ten largest virtual-land-import countries in which virtual-land flows from the United States to China, from Brazil to China, from the United States to Japan, from the United States to Mexico, from Argentina to China, from the United States to the Republic of Korea, from Brazil to Spain, and from Australia to Japan are larger than 1,000,000 ha/year. As the twelfth largest virtual-land-import country, Nigeria imported 1,036,830 ha/year virtual land from the United States during 1997 to 2011. Additionally, besides being the largest virtual-land-export countries the United States and Brazil import a large area of virtual land every year through international cereal trade. Virtual-land flows from Canada to the United States and from Argentina to Brazil are also larger than 1,000,000 ha/year (Table 5).
Table 6 A matrix of virtual-land flows from the ten largest virtual-land-export countries to the ten largest virtual-land-import countries (ha/year)
to from Algeria China Germany Japan Mexico Morocco Netherland Republic
of Korea
Spain Venezuela
Argentina 297011 3064227 12339 145593 207 157409 38059 19286 138130 51075
Australia 9000 583643 2564 1028285 0 5406 0 632115 21626 780
Brazil 128302 5385085 285728 256728 7102 155818 902309 278143 1074021 18196
Canada 194716 200730 48790 662470 302889 191865 166028 188006 80430 287538
France 600470 31545 280919 598 840 289953 563972 0 397441 0
Kazakhstan 2324 0 66539 699 0 8490 824 0 6124 0
Russian 6368 2108 8307 18074 0 39979 7298 12785 55256 0
Thailand 11746 112486 9465 82935 42 14 27118 20010 12629 41
Ukraine 47181 1626 14787 46115 0 30327 256155 179143 347056 0
US 130927 6925492 402548 3821364 3558799 245622 205316 1314923 437362 364466

Note: The areas of virtual land are calculated by yields of export countries.

Figure 4 shows the 11 most major virtual-land-flow routes (i.e. >1,000,000 ha/year). These virtual-land-flow routes are nearly the same with the virtual-water-flow routes explored by Hoekstra and Mekonnen (2012) even though besides agricultural products, industrial products were also included in Hoekstra and Mekonnen’s (2012) virtual-water-flow study. A combined consideration of Table 5 and Figure 4 can explore that the United States and Northeast Asia (i.e. China, Japan, and the Republic of Korea) are global centers of virtual-land export and virtual-land import, respectively. Compared to Fader et al.’s (2011) virtual-land-saving study that was conducted for the period of 1998-2002, this study shows that the status of the United States as the global virtual-land export center is not changed while the status of Northeast Asia as the global virtual-land import center becomes more apparent. During 2007 to 2011, 24.81% of virtual land was absorbed by the three Northeast Asian countries. However, not all cereal trade originating from the United States necessarily generated land saving at the global scale. For example, the cereal trade between the United States and Nigeria generated net land loss at the global scale (Table 6). It can be found (Table 7) that the yield of maize is rather large but that of wheat is relatively small in the United States. Consequently, when a large amount of maize is exported from the United States, a land saving at the global scale is very likely to be generated. Yet when a large amount of wheat is exported from the US, the cereal trade is likely to result in land loss at the global scale. Similarly, land loss may occur as well when China, Japan, and the Republic of Korea import cereal. Yields of the eight kinds of cereal are not very small in China, Japan, and the Republic of Korea, and some yields of China, Japan, and the Republic of Korea are even much larger than global averages (Table 7). A major reason for Japan and the Republic of Korea importing large amounts of cereal every year is that their limited territory cannot provide sufficiently large areas of farming land to produce cereal to meet their domestic demands. Despite the small ELD, China’s huge population inevitably produces a considerable dynamic demand on cereal and draws global virtual land to its territory. Therefore, a positive yield difference between export and import countries may not be a major dynamic of a virtual-land flow related to an international cereal trade and international cereal trade does not always result in land saving at the global scale.
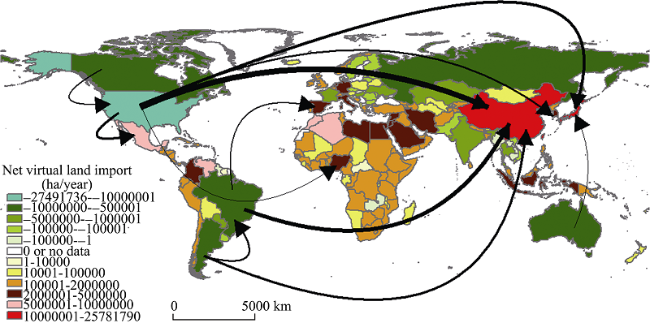
Figure 4 Net imported virtual land per country and directions of virtual-land flow related to international cereal trade over the period of 2007-2011 Note: Only the largest virtual-land flows (>1,000,000 ha/year) are shown.
Table 7 Average yields of cereal of the countries that are involved in the 11 largest virtual-land flows over the period of 2007-2011 (hg/ha)
Barley Buckwheat Maize Oats Rice Rye Sorghum Soybean Wheat
Argentina 33608 N/A 67713 18440 65654 15281 45124 26307 28715
Australia 17580 N/A 55434 13785 88503 5985 31559 20552 15803
Brazil 29383 11606 40314 20205 42969 12822 23577 28670 24678
Canada 31679 11500 89157 28296 N/A 23860 N/A 26644 27436
China 35883 8320 54375 27444 65637 30805 38360 16788 47390
Japan 32215 5176 25799 17232 60659 N/A N/A 16432 36174
Mexico 23418 N/A 31832 15298 47504 15000 36698 15423 51922
Nigeria N/A N/A 18472 N/A 17188 N/A 12694 9075 16697
Republic of Korea 28139 10135 48869 N/A 71266 N/A 16006 16760 36098
Spain 30518 N/A 103826 21333 73755 21217 41459 25335 32050
US 36507 8785 96569 22432 78329 17153 41927 28357 29541
Average of the world 28101 10841 43758 24022 37524 28398 28674 16297 30796

5 Conclusions

This study highlights that international cereal trade does not only greatly mitigate shortages of domestic arable land resources of individual countries/regions but also saves a considerably large area of land at the global scale.
(1) During 2007 to 2011 international cereal trade generated 50,092,284 ha/year land saving, roughly the size of Spain.
(2) Different cereals contribute to global land saving through international trade differently. Sorghum has the largest land-saving efficiency, but soybean trade saved the largest area of land resources amongst the selected nine cereals. That is due to the fact that soybean enjoys a relatively high land-saving efficiency and accounts for a very substantive portion of international cereal trade during 2007 to 2011.
(3) Although international cereal trade has led to a very large land saving, not all individual cereal trade between two countries save land resource at the global scale. For example, cereal trades from the United States to Nigeria and those from Australia to Japan led to land loss at the global scale. Thus, purely considered from an aspect of saving global land resources, more endeavor is still needed to plan cereal trade among individual countries.
(4) Additionally, we find that countries with very large population (e.g. China and India) are not necessarily dependent on virtual-land import. Domestic arable land area and economic level are also very likely to impact virtual-land flow.
Hence, in the future we will pay special attention to dynamics of virtual-land flow given that this study has shown that population pressure and positive differences on yields between export and import countries may not be crucial dynamics of virtual-land flow. The concept of telecoupling points out that with continued globalization, interactions between distant social and environmental systems is becoming increasingly intense (Liu et al., 2013). The concept of virtual land provides a framework to study the linkage between natural resources in physical spheres and anthropogenic activities in social systems. Thus, this study does not only explore great potential of land saving through international cereal trade but also addresses deeper thinking. In the era of globalization stationary natural resources can be re-allocated spatially through international trades. Future management of natural resources should be planned and executed in combined natural-social systems and not only in physical spheres.

Appendix

Table 1 in appendix Net land saving through cereal trade for 201 countries/regions
Country Net land saving
(ha/year)
Country Net land saving
(ha/year)
China, mainland 25781790 Chad 89898
Japan 11201864 Madagascar 88253
Mexico 6250096 Mauritius 76395
Morocco 6138032 Belarus 74177
Algeria 5283623 Mali 74023
Venezuela 5089433 New Zealand 73689
Republic of Korea 3547290 Mongolia 73688
Spain 3535743 Bolivia 72615
Indonesia 3325665 Turkmenistan 67181
Nigeria 3007082 Rwanda 66663
Syrian Arab Republic 2709493 Brunei Darussalam 59237
Iran 2708283 Uzbekistan 57307
Germany 2656802 Gabon 53846
Netherlands 2599105 Togo 53398
Egypt 2517040 Slovenia 50966
Italy 2511334 Fiji 50372
China, Taiwan 2370107 Burundi 45856
Libya 2288057 Namibia 43297
Colombia 2272798 Bahrain 42036
Jordan 2175838 Poland 40525
Saudi Arabia 2031040 Barbados 37782
Iraq 1898973 Malawi 37283
Yemen 1855308 New Caledonia 33984
Peru 1845530 Macedonia 33389
Portugal 1838485 Austria 33355
Turkey 1682336 Comoros 32637
Israel 1649835 Guinea-Bissau 28843
Tunisia 1516452 Malta 25056
Malaysia 1515052 Iceland 21120
Bangladesh 1464979 Bhutan 19551
Philippines 1334338 Solomon Islands 15646
Sudan (former) 1317915 Montenegro 11827
Zimbabwe 1243656 Grenada 9070
Belgium 1059951 Saint Vincent and the Grenadines 8614
Tanzania 908146 Timor-Leste 8285
Ecuador 873227 China, Macao 7430
Cuba 869336 Maldives 6366
Ethiopia 864130 Belize 5246
Dominican Republic 858426 Luxembourg 4693
Kenya 846853 French Polynesia 4131
Mozambique 831303 Seychelles 4054
Somalia 768800 Samoa 4001
Cyprus 667163 Central African Republic 3926
Cameroon 655903 Faroe Islands 3308
Honduras 632844 Vanuatu 3092
Côte d’Ivoire 617596 Bahamas 3085
United Kingdom 612499 Equatorial Guinea 2061
Guatemala 577794 Kiribati 1818
South Africa 570190 Sao Tome and Principe 1562
Azerbaijan 563093 Netherlands Antilles 1540
Costa Rica 552873 Guam 1367
United Arab Emirates 529476 Aruba 1236
Angola 512591 Saint Kitts and Nevis 919
Chile 499125 Saint Lucia 683
Lesotho 495154 Suriname 566
Greece 467651 Antigua and Barbuda 400
Senegal 463390 Dominica 373
Georgia 420378 Cayman Islands 134
Congo, DR 398694 Bermuda 89
Sri Lanka 388194 British Virgin Islands 78
Norway 385292 Tonga 47
Botswana 337530 Cook Islands 27
Ghana 310273 Tuvalu 14
Lebanon 307742 Nauru 12
Panama 295734 Saint Pierre and Miquelon 5
Kuwait 292829 Niue 4
Afghanistan 292335 Guyana -8251
Eritrea 273103 Laos -23863
El Salvador 257957 Myanmar -31085
Jamaica 247537 Denmark -47363
Haiti 240268 Cambodia -51372
Uganda 227905 Estonia -58421
Mauritania 205813 Croatia -61967
Niger 181457 Zambia -64596
Korea, DPR 175929 Slovakia -69767
Armenia 175220 Sweden -121542
Liberia 171749 Viet Nam -123817
Kyrgyzstan 171738 Republic of Moldova -133933
Congo 171554 Finland -163867
Bosnia and Herzegovina 162307 Latvia -174263
Papua New Guinea 159575 Czech Republic -296855
Tajikistan 154086 Lithuania -297548
Occupied Palestinian Territory 151591 Serbia -300503
Ireland 150592 Bulgaria -622897
Guinea 149275 Romania -709695
Benin 148063 Pakistan -763843
Swaziland 143101 Uruguay -900625
Singapore 141955 Thailand -1216772
Oman 140984 Hungary -1218750
Switzerland 138553 Paraguay -2298939
Nicaragua 137253 India -2339266
Cabo Verde 132540 France -3766286
Burkina Faso 117850 Kazakhstan -4555794
Gambia 115396 Ukraine -4758761
Qatar 114497 Russia -6692039
China, Hong Kong 113223 Canada -8115493
Nepal 106546 Argentina -8928639
Djibouti 101444 Brazil -9496388
Sierra Leone 95590 Australia -9922634
Albania 92221 US -27491736
Trinidad and Tobago 90963
Table 2 in appendix External land dependency for 207 countries/regions
Country Domestic harvested
area (ha/year)
Net virtual-land
import ha/year)
External land
dependency
Bahrain 0 42036 N/A
Bermuda 0 89 N/A
Aruba 0 1236 N/A
Cayman Islands 0 134 N/A
Cook Islands 0 27 N/A
Equatorial Guinea 0 2061 N/A
Faroe Islands 0 3308 N/A
French Polynesia 0 4131 N/A
Kiribati 0 1818 N/A
China, Hong Kong 0 113223 N/A
Iceland 0 21120 N/A
China, Macao 0 7430 N/A
Nauru 0 12 N/A
Netherlands Antilles 0 1540 N/A
Niue 0 4 N/A
Saint Kitts and Nevis 0 919 N/A
Saint Lucia 0 683 N/A
Saint Pierre and Miquelon 0 5 N/A
Seychelles 0 4054 N/A
Singapore 0 141955 N/A
Tonga 0 47 N/A
Tuvalu 0 14 N/A
British Virgin Islands 0 78 N/A
Samoa 0 4001 N/A
Djibouti 8 101444 12680.45
Mauritius 79 76395 969.4771
United Arab Emirates 1348 529476 392.7864
Barbados 102 37782 371.8745
Qatar 524 114497 218.5054
Saint Vincent and the Grenadines 41 8614 209.0683
Kuwait 1838 292829 159.2845
Jamaica 1812 247537 136.6398
Maldives 71 6366 89.41679
Guam 17 1367 82.36963
Oman 3179 140984 44.34845
Papua New Guinea 3649 159575 43.73127
Brunei Darussalam 1614 59237 36.69754
Jordan 61135 2175838 35.59059
New Caledonia 1069 33984 31.7904
Trinidad and Tobago 3441 90963 26.43648
Grenada 345 9070 26.30414
Bahamas 149 3085 20.67528
Israel 84125 1649835 19.61176
Cyprus 37032 667163 18.01575
Solomon Islands 1104 15646 14.17457
Netherlands 214211 2599105 12.13338
Congo 15033 171554 11.4115
Fiji 4416 50372 11.4068
Antigua and Barbuda 42 400 9.512762
China, Taiwan 274056 2370107 8.648252
Costa Rica 71569 552873 7.725073
Malta 3418 25056 7.33072
Libya 344875 2288057 6.634461
Portugal 302005 1838485 6.087596
Occupied Palestinian Territory 25614 151591 5.918301
Lebanon 56866 307742 5.411732
Japan 2082021 11201864 5.380283
Saudi Arabia 378857 2031040 5.36097
Dominican Republic 194428 858426 4.415143
Venezuela 1156968 5089433 4.398942
Cabo Verde 31517 132540 4.205284
Republic of Korea 1056738 3547290 3.356831
Belgium 323792 1059951 3.273554
Botswana 116100 337530 2.907228
Lesotho 176601 495154 2.803802
Dominica 134 373 2.776378
Yemen 716132 1855308 2.590733
Cuba 347296 869336 2.503153
Montenegro 4776 11827 2.47617
Swaziland 57835 143101 2.47432
Malaysia 681726 1515052 2.222379
Georgia 193377 420378 2.173876
Vanuatu 1436 3092 2.153605
Algeria 2595359 5283623 2.035796
Colombia 1117125 2272798 2.034507
Gabon 27552 53846 1.954316
Panama 159076 295734 1.859073
Comoros 19923 32637 1.638174
Peru 1180361 1845530 1.56353
Tunisia 1064240 1516452 1.424915
Somalia 547519 768800 1.404153
Honduras 453727 632844 1.39477
Norway 305381 385292 1.261676
Sao Tome and Principe 1280 1562 1.220426
Morocco 5202344 6138032 1.179859
Armenia 158815 175220 1.103296
Ecuador 836617 873227 1.043759
Senegal 471980 463390 0.981798
Gambia 118933 115396 0.970265
Switzerland 143224 138553 0.967389
Chile 525426 499125 0.949942
Mauritania 225367 205813 0.913233
Syrian Arab Republic 2978814 2709493 0.909588
Namibia 49214 43297 0.87977
Iraq 2194160 1898973 0.865467
Egypt 3071090 2517040 0.819592
Côte d’Ivoire 757427 617596 0.815387
Eritrea 348968 273103 0.782603
Liberia 227792 171749 0.753975
El Salvador 357343 257957 0.721875
Guatemala 812813 577794 0.710857
Italy 3795662 2511334 0.661633
Zimbabwe 1897122 1243656 0.655549
Albania 144483 92221 0.638282
Mexico 9807793 6250096 0.637258
Azerbaijan 926739 563093 0.607607
Spain 6101613 3535743 0.579477
Bosnia and Herzegovina 300516 162307 0.540096
New Zealand 136832 73689 0.53854
Slovenia 95287 50966 0.534869
Ireland 292372 150592 0.515071
Greece 1075372 467651 0.434874
Haiti 558282 240268 0.43037
Germany 6308509 2656802 0.421146
Cameroon 1572667 655903 0.417064
Kenya 2225932 846853 0.380449
Sri Lanka 1044338 388194 0.371713
Angola 1389877 512591 0.368803
Tajikistan 419941 154086 0.366924
Mongolia 216505 73688 0.340354
Mozambique 2524021 831303 0.329357
Bhutan 64497 19551 0.303131
Iran 8977052 2708283 0.30169
Nicaragua 465976 137253 0.29455
Kyrgyzstan 587278 171738 0.29243
China, mainland 95926026 25781790 0.268767
Guinea-Bissau 122888 28843 0.234711
Ghana 1327241 310273 0.233773
Nigeria 13199408 3007082 0.227819
Burundi 222385 45856 0.206202
Congo, DR 1972782 398694 0.202097
United Kingdom 3042437 612499 0.201318
Macedonia 170815 33389 0.19547
Sudan (former) 6850399 1317915 0.192385
Indonesia 17327619 3325665 0.191929
Philippines 7039240 1334338 0.189557
Belize 28034 5246 0.187119
Luxembourg 25402 4693 0.184755
Tanzania 4930370 908146 0.184194
Sierra Leone 570478 95590 0.167561
Rwanda 427070 66663 0.156093
South Africa 3663430 570190 0.155644
Uganda 1551600 227905 0.146884
Benin 1036465 148063 0.142854
Ethiopia 6143549 864130 0.140656
Turkey 12070141 1682336 0.13938
Bangladesh 11938752 1464979 0.122708
Guinea 1300539 149275 0.114779
Korea, DPR 1556132 175929 0.113055
Afghanistan 2933000 292335 0.099671
Timor-Leste 101481 8285 0.081642
Chad 1191948 89898 0.075421
Turkmenistan 909898 67181 0.073834
Togo 769537 53398 0.06939
Niger 2959222 181457 0.061319
Madagascar 1729575 88253 0.051026
Burkina Faso 2507613 117850 0.046997
Austria 773020 33355 0.04315
Bolivia 1896329 72615 0.038292
Belarus 1968230 74177 0.037687
Uzbekistan 1546120 57307 0.037065
Nepal 3155971 106546 0.03376
Mali 2399517 74023 0.030849
Malawi 1780026 37283 0.020945
Central African Republic 211306 3926 0.018582
Suriname 50169 566 0.011272
Poland 5598390 40525 0.007239
French Guiana 2937 0 0
Montserrat 16 0 0
Micronesia 145 0 0
Puerto Rico 313 0 0
Réunion 1847 0 0
Western Sahara 3210 0 0
Myanmar 8791644 -31085 -0.00354
Viet Nam 8793695 -123817 -0.01408
Cambodia 3010111 -51372 -0.01707
Laos 1013995 -23863 -0.02353
India 98280538 -2339266 -0.0238
Denmark 1445560 -47363 -0.03276
Pakistan 12853408 -763843 -0.05943
Guyana 126099 -8251 -0.06543
Zambia 972373 -64596 -0.06643
Slovakia 756406 -69767 -0.09224
Thailand 12551109 -1216772 -0.09695
Croatia 596105 -61967 -0.10395
Sweden 941866 -121542 -0.12904
Romania 5116961 -709695 -0.13869
Moldova 942070 -133933 -0.14217
Serbia 2038082 -300503 -0.14744
Finland 1075940 -163867 -0.1523
Russia 40285302 -6692039 -0.16612
Czech Republic 1470762 -296855 -0.20184
Estonia 289268 -58421 -0.20196
Brazil 41761186 -9496388 -0.2274
Kazakhstan 15545136 -4555794 -0.29307
US 88441963 -27491736 -0.31084
Ukraine 15163800 -4758761 -0.31382
Lithuania 917500 -297548 -0.3243
Argentina 26511894 -8928639 -0.33678
Latvia 507980 -174263 -0.34305
Bulgaria 1712390 -622897 -0.36376
France 9102805 -3766286 -0.41375
Hungary 2664717 -1218750 -0.45737
Australia 19594911 -9922634 -0.50639
Canada 15971880 -8115493 -0.50811
Paraguay 3948183 -2298939 -0.58228
Uruguay 1506166 -900625 -0.59796

The authors have declared that no competing interests exist.

1
Chapagain A K, Hoekstra A Y, 2004. Water footprints of nations. Value of Water Research Report Series, Vol. 16. UNESCO-IHE, Delft, the Netherlands.

2
Chapagain A K, Hoekstra A Y, Savenije H H G, 2006. Water saving through international trade of agricultural products.Hydrology and Earth System Sciences, 10: 455-468Many nations save domestic water resources by importing water-intensive products and exporting commodities that are less water intensive. National water saving through the import of a product can imply saving water at a global level if the flow is from sites with high to sites with low water productivity. The paper analyses the consequences of international virtual water flows on the global and national water budgets. The assessment shows that the total amount of water that would have been required in the importing countries if all imported agricultural products would have been produced domestically is 1605 Gm/yr. These products are however being produced with only 1253 Gm/yr in the exporting countries, saving global water resources by 352 Gm/yr. This saving is 28% of the international virtual water flows related to the trade of agricultural products and 6% of the global water use in agriculture. National policy makers are however not interested in global water savings but in the status of national water resources. Egypt imports wheat and in doing so saves 3.6 Gm/yr of its national water resources. Water use for producing export commodities can be beneficial, as for instance in Cote d'Ivoire, Ghana and Brazil, where the use of green water resources (mainly through rain-fed agriculture) for the production of stimulant crops for export has a positive economic impact on the national economy. However, export of 28 Gm/yr of national water from Thailand related to rice export is at the cost of additional pressure on its blue water resources. Importing a product which has a relatively high ratio of green to blue virtual water content saves global blue water resources that generally have a higher opportunity cost than green water.

DOI

3
Chapagain A K, Hoekstra A Y, Savenije H H Get al., 2006. The water footprint of cotton consumption: An assessment of the impact of worldwide consumption of cotton products on the water resources in the cotton producing countries.Ecological Economics, 60: 186-203.

4
Dalin C, Konar M, Hanasaki Net al., 2012. Evolution of the global virtual water trade network.PNAS, 109: 5989-5994.Global freshwater resources are under increasing pressure from economic development, population growth, and climate change. The international trade of water-intensive products (e.g., agricultural commodities) or virtual water trade has been suggested as a way to save water globally. We focus on the virtual water trade network associated with international food trade built with annual trade data and annual modeled virtual water content. The evolution of this network from 1986 to 2007 is analyzed and linked to trade policies, socioeconomic circumstances, and agricultural efficiency. We find that the number of trade connections and the volume of water associated with global food trade more than doubled in 22 years. Despite this growth, constant organizational features were observed in the network. However, both regional and national virtual water trade patterns significantly changed. Indeed, Asia increased its virtual water imports by more than 170%, switching from North America to South America as its main partner, whereas North America oriented to a growing intraregional trade. A dramatic rise in China's virtual water imports is associated with its increased soy imports after a domestic policy shift in 2000. Significantly, this shift has led the global soy market to save water on a global scale, but it also relies on expanding soy production in Brazil, which contributes to deforestation in the Amazon. We find that the international food trade has led to enhanced savings in global water resources over time, indicating its growing efficiency in terms of global water use.

DOI PMID

5
Fader M, Gerten D, Thammer Met al., 2011. Internal and external green-blue agricultural water footprints of nations, and related water and land savings through trade.Hydrology and Earth System Sciences, 15: 1641-1660.The need to increase food production for a growing world population makes an assessment of global agricultural water productivities and virtual water flows important. Using the hydrology and agro-biosphere model LPJmL, we quantify at 0.5 degrees resolution the amount of blue and green water (irrigation and precipitation water) needed to produce one unit of crop yield, for 11 of the world's major crop types. Based on these, we also quantify the agricultural water footprints (WFP) of all countries, for the period 1998-2002, distinguishing internal and external WFP (virtual water imported from other countries) and their blue and green components, respectively. Moreover, we calculate water savings and losses, and for the first time also land savings and losses, through international trade with these products. The consistent separation of blue and green water flows and footprints shows that green water globally dominates both the internal and external WFP (84% of the global WFP and 94% of the external WFP rely on green water). While no country ranks among the top ten with respect to all water footprints calculated here, Pakistan and Iran demonstrate high absolute and per capita blue WFP, and the US and India demonstrate high absolute green and blue WFPs. The external WFPs are relatively small (6% of the total global blue WFP, 16% of the total global green WFP). Nevertheless, current trade of the products considered here saves significant water volumes and land areas (similar to 263 km(3) and similar to 41 Mha, respectively, equivalent to 5% of the sowing area of the considered crops and 3.5% of the annual precipitation on this area). Relating the proportions of external to internal blue/green WFP to the per capita WFPs allows recognizing that only a few countries consume more water from abroad than from their own territory and have at the same time above-average WFPs. Thus, countries with high per capita water consumption affect mainly the water availability in their own country. Finally, this study finds that flows/savings of both virtual water and virtual land need to be analysed together, since they are intrinsically related.

DOI

6
Food and Agriculture Organization of the United Nations (FAO), 2014, FAOSTAT, available from: (last access: 4/16/2014.

7
Fraiture C, Cai X, Amarasinghe Uet al., 2004. Does international cereal trade save water? The impact of virtual water trade on global water use. Comprehensive Assessment Research Report 4. International Water Manage. Institute, Colombo.

8
Hoekstra A Y, Chapagain A K, 2007. Water footprints of nations water use by people as a function of their consumption pattern.Water Resources Management, 21: 35-48.lt;a name="Abs1"></a>The water footprint shows the extent of water use in relation to consumption of people. The water footprint of a country is defined as the volume of water needed for the production of the goods and services consumed by the inhabitants of the country. The internal water footprint is the volume of water used from domestic water resources; the external water footprint is the volume of water used in other countries to produce goods and services imported and consumed by the inhabitants of the country. The study calculates the water footprint for each nation of the world for the period 1997&#8211;2001. The USA appears to have an average water footprint of 2480,m<sup>3</sup>/cap/yr, while China has an average footprint of 700,m<sup>3</sup>/cap/yr. The global average water footprint is 1240,m<sup>3</sup>/cap/yr. The four major direct factors determining the water footprint of a country are: volume of consumption (related to the gross national income); consumption pattern (e.g. high versus low meat consumption); climate (growth conditions); and agricultural practice (water use efficiency).

DOI

9
Hoekstra A Y, Chapagain A K, 2008. Globalization of Water: Sharing the Planet’s Freshwater Resources. Oxford: Blackwell.

10
Hoekstra A Y, Hung P Q, 2002. Virtual water trade: A quantification of virtual water flows between nations in relation to international crop trade. Value of Water Research Report Series, Vol. 11. UNESCO-IHE, Delft, the Netherlands.ABSTRACT

DOI

11
Hoekstra A Y, Mekonnen M M, 2012. The water footprint of humanity.PNAS, 109: 3232-3237.This study quantifies and maps the water footprint (WF) of humanity at a high spatial resolution level. It reports on consumptive use of rainwater (green WF) and ground and surface water (blue WF) and volumes of water polluted (grey WF). Water footprints are estimated per nation from both a production and consumption perspective. International virtual water flows are estimated based on trade in agricultural and industrial commodities. The global WF in the period 1996-2005 was 9087 Gm3/yr (74% green, 11% blue, 15% grey). Agricultural production contributes 92%. About one fifth of the global WF relates to production for export. The total volume of international virtual water flows related to trade in agricultural and industrial products was 2320 Gm3/yr (68% green, 13% blue, 19% grey). The WF of the global average consumer was 1385 m3/yr. The average consumer in the US has a WF of 2842 m3/yr, while the average citizens in China and India have WFs of 1071 m3/yr and 1089 m3/yr, respectively. Consumption of cereal products gives the largest contribution to the WF of the average consumer (27%), followed by meat (22%) and milk products (7%). The volume and pattern of consumption and the WF per ton of product of the products consumed are the main factors determining the WF of a consumer. The study illustrates the global dimension of water consumption and pollution by showing that several countries heavily rely on foreign water resources and that many countries have significant impacts on water consumption and pollution elsewhere.

DOI PMID

12
Konar M, Dalin C, Hanasaki Net al., 2012. Temporal dynamics of blue and green virtual water trade networks.Water Resources Research, 48: W07509. doi: 10.1029/2012WR011959.Global food security increasingly relies on the trade of food commodities. Freshwater resources are essential to agricultural production and are thus embodied in the trade of food commodities, referred to as "virtual water trade." Agricultural production predominantly relies on rainwater (i.e., "green water"), though irrigation (i.e., "blue water") does play an important role. These different sources of water have distinctly different opportunity costs, which may be reflected in the way these resources are traded. Thus, the temporal dynamics of the virtual water trade networks from these distinct water sources require characterization. We find that 42 × 109 m3 blue and 310 × 109 m3 green water was traded in 1986, growing to 78 × 109 m3 blue and 594 × 109 m3 green water traded in 2008. Three nations dominate the export of green water resources: the USA, Argentina, and Brazil. As a country increases its export trade partners it tends to export relatively more blue water. However, as a country increases its import trade partners it does not preferentially import water from a specific source. The amount of virtual water that a country imports by increasing its import trade partners has been decreasing over time, with the exception of the soy trade. Both blue and green virtual water networks are efficient: 119 × 109 m3 blue and 105 × 109 m3 green water were saved in 2008. Importantly, trade has been increasingly saving water over time, due to the intensification of crop trade on more water-efficient links.

DOI

13
Liu J, Hull V, Batistella Met al., 2013. Framing sustainability in a telecoupled world. Ecology and Society, 18(2): 26.Interactions between distant places are increasingly widespread and influential, often leading to unexpected outcomes with profound implications for sustainability. Numerous sustainability studies have been conducted within a particular place with little attention to the impacts of distant interactions on sustainability in multiple places. Although distant forces have been studied, they are usually treated as exogenous variables and feedbacks have rarely been considered. To understand and integrate various distant interactions better, we propose an integrated framework based on telecoupling, an umbrella concept that refers to socioeconomic and environmental interactions over distances. The concept of telecoupling is a logical extension of research on coupled human and natural systems, in which interactions occur within particular geographic locations. The telecoupling framework contains five major interrelated components, i.e., coupled human and natural systems, flows, agents, causes, and effects. We illustrate the framework using two examples of distant interactions associated with trade of agricultural commodities and invasive species, highlight the implications of the framework, and discuss research needs and approaches to move research on telecouplings forward. The framework can help to analyze system components and their interrelationships, identify research gaps, detect hidden costs and untapped benefits, provide a useful means to incorporate feedbacks as well as trade-offs and synergies across multiple systems (sending, receiving, and spillover systems), and improve the understanding of distant interactions and the effectiveness of policies for socioeconomic and environmental sustainability from local to global levels.

DOI

14
Qiang W, Liu A, Cheng Set al., 2013. Agricultural trade and virtual-land use: The case of China’s crop trade.Land Use Policy, 33: 141-150.Trade liberalization has greatly accelerated the volume of traded agricultural products in past decades. As land resources become more limited in some countries, international trade plays an important role in compensating for land scarcity in these countries. This paper aims to measure and locate the virtual land use hidden in China's imports and exports, for both primary crops and processed products, from 1986 to 2009. The results show that as China's crop imports had grown greatly during the last decade, the net virtual land trade hidden in international trade had increased from -4.42 Mha in 1986 to 28.90 Mha in 2009. The main category of virtual land imports had changed from cereals to oil crops, which accounted for 82.2% of the total virtual land imports in 2009. Over the two decades the main source of virtual land imports had changed from North America to both South America and North America. International trade could also lower demand for land resources at the global level: our results showed that China's crop trade was contributing to global land savings by 3.27 Mha on annual average during 1986-2009. Economic development, and associated dietary changes and policy shifts were linked to the change of China's virtual land trade pattern. To make land use more sustainable at the global level, both importing and exporting countries of virtual land should consider ecological and socio-economic impacts of these trade flows in their policies. (C) 2013 Elsevier Ltd. All rights reserved.

DOI

15
Tilman D, Cassman K G, Matson P Aet al., 2002. Agricultural sustainability and intensive production practices.Nature, 418: 671-677.Nature is the international weekly journal of science: a magazine style journal that publishes full-length research papers in all disciplines of science, as well as News and Views, reviews, news, features, commentaries, web focuses and more, covering all branches of science and how science impacts upon all aspects of society and life.

DOI PMID

16
Würtenberger L, Koellner T, Binder C R, 2006. Virtual-land use and agricultural trade: Estimating environmental and socio-economic impacts.Ecological Economics, 57: 679-697.

DOI

Outlines

/