Orginal Article

The climate change variations in the northern Greater Khingan Mountains during the past centuries

  • ZHAO Huiying ,
  • *GONG Lijuan ,
  • QU Huihui ,
  • ZHU Haixia ,
  • LI Xiufen ,
  • ZHAO Fang
Expand
  • Heilongjiang Institute of Meteorological Science, Harbin 150030, China

Author: Zhao Huiying (1964-), Professor, specialized in the effect of climate changes on ecosystems. E-mail:

*Corresponding author: Gong Lijuan (1982-), Engineer, E-mail:

Received date: 2015-10-05

  Accepted date: 2015-12-21

  Online published: 2016-05-25

Supported by

National Natural Science Foundation of China, No.41165005.No.40865005

Copyright

Journal of Geographical Sciences, All Rights Reserved

Abstract

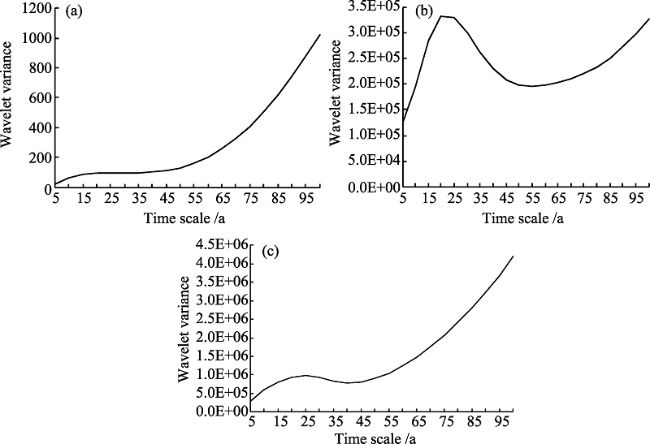
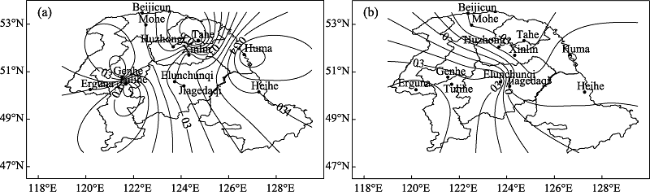
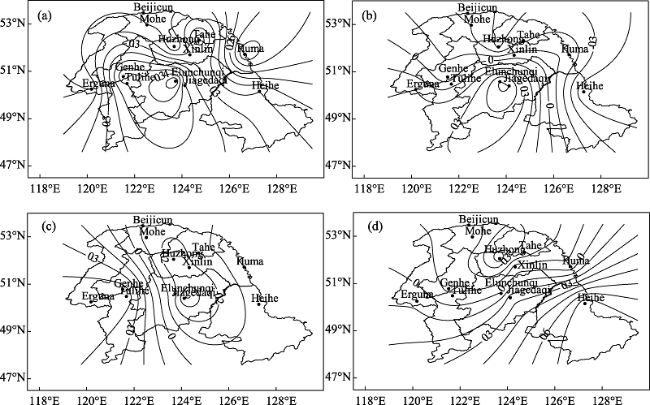
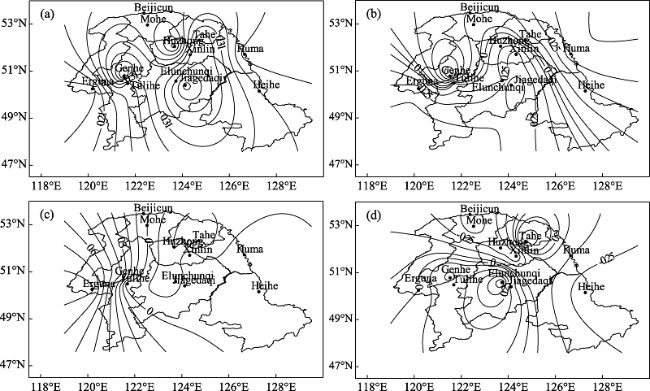
The Greater Khingan Mountains (Daxinganling) are China’s important ecological protective screen and also the region most sensitive to climate changes. To gain an in-depth understanding and reveal the climate change characteristic in this high-latitude, cold and data-insufficient region is of great importance to maintaining ecological safety and corresponding to global climate changes. In this article, the annual average temperature, precipitation and sunshine duration series were firstly constructed using tree-ring data and the meteorological observation data. Then, using the climate tendency rate method, moving-t-testing method, Yamamoto method and wavelet analysis method, we have investigated the climate changes in the region during the past 307 years. Results indicate that, since 1707, the annual average temperature increased significantly, the precipitation increased slightly and the sunshine duration decreased, with the tendency rates of 0.06℃/10a, 0.79 mm/10a and -5.15 h/10a, respectively (P≤0.01). Since the 21st century, the period with the greatest increase of the annual average temperature (also with the greatest increase of precipitation) corresponds to the period with greatest decrease of sunshine duration. Three sudden changes of the annual average temperature and sunshine duration occurred in this period while two sudden changes of precipitation occurred. The strong sudden-change years of precipitation and sunshine duration are basically consistent with the sudden-change years of annual average temperature, suggesting that in the mid-1860s, the climatic sudden change or transition really existed in this region. In the time domain, the climatic series of this region exhibit obvious local variation characteristics. The annual average temperature and sunshine duration exhibit the periodic variations of 25 years while the precipitation exhibits a periodic variation of 20 years. Based on these periodic characteristics, one can infer that in the period from 2013 to 2030, the temperature will be at a high-temperature stage, the precipitation will be at an abundant-precipitation stage and the sunshine duration will be at an less-sunshine stage. In terms of spatial distribution, the leading distribution type of the annual average temperature in this region shows integrity, i.e., it is easily higher or lower in the whole region; and the second distribution type is more (or less) in the southwest parts and less (or more) in the northeast parts. Precipitation and sunshine duration exhibit complex spatial distribution and include four spatial distribution types. The present study can provide scientific basis for the security investigation of homeland, ecological and water resources as well as economic development programming in China’s northern borders.

Cite this article

ZHAO Huiying , *GONG Lijuan , QU Huihui , ZHU Haixia , LI Xiufen , ZHAO Fang . The climate change variations in the northern Greater Khingan Mountains during the past centuries[J]. Journal of Geographical Sciences, 2016 , 26(5) : 585 -602 . DOI: 10.1007/s11442-016-1287-y

Forest has a close and complex relationship with climate. Climatic conditions are decisive factors for forest attributes. In September, 2013, Intergovernmental Panel on Climate Change issued the fifth assessment report on climate changes, which pointed out that global climate changes have imposed significant effects on many natural ecosystems on the earth. Especially, the sensitivity of forest ecosystems to global climate changes has led to the accelerated degradation of forest ecosystems on a global scale (IPCC, 2013). Accordingly, the mechanism of interaction between climate changes and forest ecosystems on multiple scales from different aspects is not only a core problem attracting the attention of ecologists and climatologists, but also the focus and a frontier question sharing the concerns of international community currently (Xie et al., 2009; Yang et al., 2012). With regard to the studies on climate changes based on tree ring, the foreign researches have conducted the tree-ring-based climate reconstruction for a long time and many studies were focused on the climate reconstruction based on tree-ring network in many arid and cold regions of North America (Briffa et al., 1998; Cook et al., 2002; D’Arrigo et al., 2005; Yadav et al., 2002). To construct a perfect tree-ring network, more than a hundred of regional tree-ring samples are required, in which temperature, precipitation, drought index and North Pacific Index should be adopted as the factors. Many satisfactory results have already been achieved in climatic sudden change analysis. The investigations on the climate changes in high-latitude regions of China over a century have started late, but with a high starting point. In these studies, the researches not only paid attention to the variation analysis from single meteorological factor (Cai et al., 2010; Gou et al., 2013; Shi et al., 2010), but also explored the characteristics and effects of regional climate changes (Lu et al., 2014; Sun et al., 2012; Wang et al., 2012; Yu et al., 2005). These achievements have laid solid theoretical basis and technical supports for revealing the evolvement rules of climate changes in the Greater Khingan Mountains (GKM), a high- latitude cold region.
The Greater Khingan (GKM) region is a first-grade National Nature Ecological Reserve, which is located at the southern margin of the permafrost of Eurasia (Wu et al., 2014). The GKM is in the alpine region, an environmental sensitive area in Northeast Asia. This region is abundant in forest resources, including China’s only primeval cold-temperature bright coniferous forest with the largest area and best preserve, with the constructive species of Larix gmelinii and Mongolian pine. Compared with the other forest regions in China, the GKM exhibits a series of unique features in terms of soil, disturbance regime, climate and vegetation. Few systematic studies were conducted on the climate changes in the northern GKM; moreover, due to the limitations in high-latitude data density and series length, the research achievements in regional climate changes lack of systematicness and comprehensiveness. Therefore, using the reconstructed data series of annual average temperature, precipitation and sunshine duration based on tree-ring width during the period from 1707 to 2013 in the northern GKM, we conducted a systematic investigation on temporal and spatial characteristics of the climate changes in the northern GKM, so as to further determine the rules of climate changes and identify the change characteristics. The present study aims to gaining an in-depth insight into the climate changes in this alpine region, which can not only lay solid foundations for the climate change investigations in the whole high-latitude region, but also provide significant scientific and application values for the homeland, ecological and water resource security as well as economic development programming in China’s northern borders.

1 Materials and method

1.1 Data acquisition and a general introduction to the study region

The northern GKM was selected as a case in the present study, with the latitude ranging from 50º10′ to 53º30′N and the longitude ranging from 119º40′ to 127º22′E. It is bounded on the north and northeast by the Heilongjiang River while on the west and northwest by the Erguna River, bordering to East Siberia and Far East in Russia across the two rivers each; the southeast extends to the line along Heihe City and Nenjiang County and is connected to the Lesser Khingan Mountains (Range). The study region covers an area of approximately 16.22×10⁴ km2 (exceeding the area of Liaoning Province). In terms of vegetation regionalization, it is an independent cold-temperate coniferous forest zone and characterized by a cold-temperate continental monsoon climate (Zhou, 1991). From south (east) to north (west), the annual temperature decreases from -1-0℃ to -5- -4℃, the annual temperature range increases from 35℃ to 52℃, and the annual precipitation decreases from 500-700 mm to below 200 mm (He et al., 2013). The soils are mainly dark brown coniferous forest soils, and the vegetation cover is the Khingan flora, in which the Khingan larch trees occupy a large proportion in tree species, followed by Mongolian pine and dragon spruce.
In the present study, the climatological data of the northern GKM consists of the climatic factors inverted by the tree-ring width data from 1707 to 2007 and the climatological observation data from 1961 to 2013. After being tested, the historical climatological data series are from 1707 to 2013 (lasting 307 years), with the climatic factors of annual average temperature, precipitation and sunshine duration. It should be noted that the data of all these climatic factors were calculated by averaging the data from April in the current year to March in the next year. According to requirements in the present study, these data series include three sections (Li et al., 2011; Li et al., 2014): specifically, from 1707 to 1960, since no instrument-measured data in this region, the climatological data were acquired by inverting the observation data from Erguna Municipal Meteorological Station (50°15′0″N, 120°10′48″E, with a height of 581 m) and Genhe Meteorological Station (50°46′48″N, 121°31′12″E, with a height of 779 m) through the constructed regression equations (these two meteorological stations are at the nearest distance from Angelin Forest Farm (51°25′12″N, 120°54′51″E) and Xinqing Forest Farm (51°23′3″N, 120°48′38″E) and have the same underlying surfaces and the tree-ring width data were collected in these two forest farms); from 1961 to 2007, the climatological data were calculated by averaging the data in Angelin and Xinqing tree-ring width inversion stations and the observation data of 11 meteorological stations (the station density was added); from 2008 to 2013, the climatological data were the average values of the observation data collected from 11 meteorological stations (the tree-ring width data were collected in 2007). Since the Beijicun Station was built later and the data series are incomplete, the data were deleted (only used for matching).
Based on the standard tree-ring chronology and meteorological data, we have investigated the meteorological data during the period from 1707 to 2007 using regression method (Qu et al., 2016). As stated in the previous research results, the constructed quantitative relationship between tree-ring width and meteorological factors could pass the credibility test. Moreover, the obtained 307-year meteorological data series could pass the consistency check (see details in Qu et al., 2016). More importantly, compared with the specific meteorological data, we are more concerned with the data series length, the density of the acquired data, the fluctuation changes of various meteorological factors, and the characteristics of regional climate changes. Therefore, the processing meteorological data series in this article can meet the technical requirements that the tree ring can be used for replacing meteorological data, and the meteorological series have certain reliability in the applications of present study. Figure 1 illustrates the distributions of tree-ring sample points and meteorological stations.
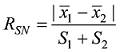
Figure 1 Illustration of the geological positions of the northern Greater Khingan Mountains and the distributions of meteorological stations and tree-ring sampling points

1.2 Method

1.2.1 Wavelet analysis
The descriptions of the time series’ pattern evolution characteristics and the position in each period at each moment using wavelet theory can enhance the short-time Fourier transform’s ability in dealing with practical problems and has become a new method of analyzing the series’ time-varying characteristics.
Assuming a wavelet function that satisfies a certain condition, the wavelet transform of the time series can be described as:
(1)
where Wf (a, b) denotes wavelet transform or wavelet coefficient, and varies with the variations of a and b (a denotes a frequency parameter and reflects the length of wavelet period, a> 0, while b denotes a time parameter and reflects the wave’s translation over time). The wavelet coefficient Wf (a, b) on different time scales (periods, with the unit of year, the same below) can reflect the system’s variation characteristics on different time scales. The turning point between positive and negative wave coefficients corresponds to the sudden change point. The greater the wavelet coefficient, the more significant the variations on this time scale (Ge et al., 2013; Guo et al., 2013; Zhao et al., 2012).
Mexican Hat Function can be expressed as:
(2)
The wavelet variance test was conducted for determining the main periods of several data series of annual average temperature, precipitation and sunshine duration:
(3)
where Wp(a) denotes the wavelet variance. On a certain time scale, wavelet variance reflects the periodic fluctuation intensity of the time series on this scale. The scale corresponding to the peak value thus can be regarded as the main time scale of this series, i.e., the main period.
1.2.2 Moving t-test (MTT)
The principle of moving t-test (MTT) is detailedly described below. The sudden change can be tested according to the fact whether the difference exists between two sets of sample average values. For a series x with the total sample size of n, a certain moment can be artificially set as the datum point, and two sub-series before and after this datum point with the length of n1 and n2 (generally n1=n2) are selected for moving calculation. Then, a statistic series of t can be acquired. The critical value can be determined by the given quantitative level. If the two sub-series before and after this datum point are considered to be with no significant difference; otherwise, it can be assumed that the sudden change occurs at the datum point. MTT method can be expressed as:
(4)
where s1 and s2 are the standard deviations of two sub-series. In this article, n=307 years, n1 and n2 were set as 20 years, and α=0.01 was adopted as the significance level of sudden change judgment, i.e., in the continuous years at different periods passed the test of significance level, the year with the greatest value of t was selected as the strongest sudden-change year.
1.2.3 Yamamoto method (YAMA)
Using MTT, since the moving step size was artificially set (Sun et al., 2005; Zhang et al., 2015), the sudden change point may drift. In the present study, the sudden change analysis was firstly conducted using MTT; the test was conducted on the detected sudden change point (if exists) using Yamamoto method (YAMA); if the results using two methods are consistent or approach with each other, the sudden change year can be identified.
Using YAMA method, the significant difference of the average values at different times can be tested by the signal to noise ratio (SNR):
(5)
where 
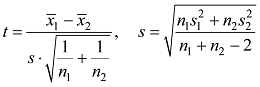
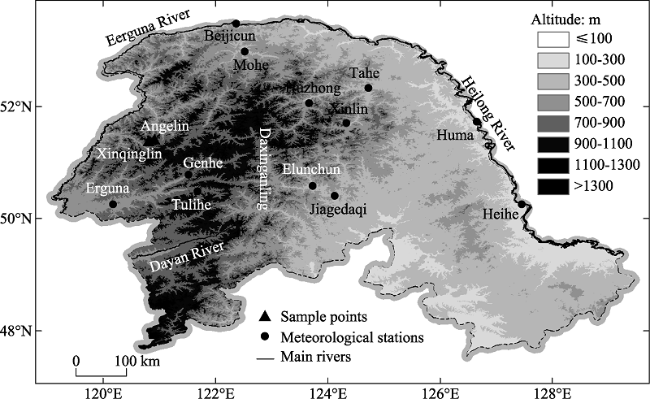
S1 and S2 denote the average values and variances at two different times. n1 and n2 of the time periods for comparison can be set in accordance with requirements, whose values affect the significance level of RSN. Generally, for a continuous random variable, the subsections are set uniformly, i.e., n=n1=n2. In the present study, n was set as 20, if RSN>0.60, it exceeds the significance level of α=0.01, and the point can be regarded as the sudden change point; if RSN>0.79, the point can be regarded as the strong sudden change point.
1.2.4 Climate tendency rate method
To calculate the climate tendency rate of the climatic series in the northern GKM (Zhao et al., 2008), the year t was adopted as the time factor and the climatic factor x was adopted as the simulation objection; then the linear regression equation between x and t was constructed as: x(t)=c+bt, in which c and b are the coefficients to be confirmed. Specifically, b denotes the tendency of climatic factors. If b>0, the climatic factors exhibit rising trends; if b≤0, the climatic factors exhibit downtrends. Therefore, b×10 is referred to as the climate tendency rate, with the unit of the ratio of the unit of climatic factors to 10 years.
1.2.5 Empirical orthogonal function (EOF) analysis
EOF analysis focuses on the matrix data’s structural characteristics and aims to extract the primary characteristic quantity of data. It is a common temporal and spatial characteristic distribution method. The annual average temperature, precipitation and sunshine duration were described as matrices: Xm×n (m=1, 2, …, 13; n=1, 2, …, 43). After standardization processing, these matrices can be decomposed into several new matrices (Huang et al., 2013):
Nm×n = Vm×p Tp×n (6)
where Vm×p denotes the spatial characteristic vector and Tp×n denotes the time coefficient. When p=n=43, the information of all the meteorological stations can be completely described. It means that the primary variation characteristics of climatic factors can be roughly expressed using the first several characteristic vectors.

2 Results and analysis

2.1 Interannual and interdecadal variation characteristics of climate changes

Used climate tend rate, MTT, YAMA and Mexican Hat wavelet function method, the changing trend, abrupt change test and periodic change of climate series in northern GKM were analyzed.
2.1.1 Tendency analysis of climate series
Figure 2 displays the climate series of the northern GKM from 1707 to 2013 and the variation curves after the moving average with the moving step size of 11 years. The climate tendency rate was calculated by the first-order linear tendency equation. As shown in Figure 2a, the annual temperature varies between -6.99 and -1.28℃, with a climate tendency rate of 0.06℃/10a (P≤0.01). Before the 20th century, the variation is slight, and the annual average temperature is approximately -5.08℃. After the 20th century, the annual average temperature increases gradually in the fluctuation; especially, a leap temperature increase appeared in the 1930s. Then the increase of the annual average temperature is smooth again, and this region entered into a continued warming period since the 1950s. During the period from 1951 to 2013, the annual average temperature is approximately -3.22℃, which exceeds by 1.86℃ compared with the data in the 18th and 19th centuries. Moreover, this region is stall in a warming stage. As shown in Figure 2b, the precipitation varies between 344.86 and 690.16 mm, with a climate tendency rate of 0.79 mm/10a (P≤0.01). The precipitation almost exhibits no variations and only increases slightly. During the period from 1707 to the end of the 19th century, the precipitation exhibits slight fluctuation changes, with the average precipitation of 436.71 mm. In the early 20th century, a low-precipitation-value period occurs, with the duration time less than 25 years. By the 1930s, the precipitation increases slightly and the fluctuation amplitude of precipitation increases significantly by the 1980s. During the period from 1981 to 2013, the annual average precipitation is 480.46 mm, exceeding by 43.74 mm compared with the value in the early 20th century. Moreover, the precipitation is in a slow increasing stage. As shown in Figure 2c, the sunshine duration in the northern GKM is 2233.36-2783.72 h, with a climate tendency rate of -5.15 h/10a (P≤0.01). Before the 1950s, the sunshine duration exhibits no obvious variation tendency; after the 1950s, it decreases significantly, which at least shows that the sprinkles and hazy weathers increase gradually.
Figure 2 Interannual variation tendency of the climatic series in the northern Greater Khingan Mountains during the period from 1707 to 2013 (a. annual average temperature; b. precipitation; c. sunshine duration, the same below)
Table 1 lists the variation of climate series in the northern GKM over different centuries from 1707 to 2013. One can observe that, the annual average temperature exhibits no distinct variations in the 18th and 19th centuries; but increases significantly in the 20th century. The annual average temperature in the 20th century is 0.83℃ higher than the value in the 19th century, with the warming amplitude of 0.32℃/10a. The results also passed the significance tests. The precipitation in this region decreases slightly in the 19th century, which is 3.73 mm lower than the value in the 18th century. After 1900, the precipitation increases gradually, with a climate tendency rate of 6.04 mm/10a (P≤0.01). During the period from 2000 to 2013, the precipitation is the greatest. On the whole, the sunshine duration decreases in this region. The sunshine duration from 1800 to 1999 is 2.75 h lower than the value in the 18th century; after 1901, the sunshine duration decreases significantly, with a climate tendency rate of -23.27 h/10a (P≤0.01). From 2000 to 2013, the sunshine duration decreases most remarkably, and the sunshine duration during this period is reduced by 100.14 h compared with the value in the 20th century.
Table 1 Variation of climate series in the northern Greater Khingan Mountains from 1707 to 2013
Year Annual average temperature Precipitation Sunshine duration
Average value/℃ Climate tendency rate /℃/10a Average value /mm Climate tendency
rate/mm/10a
Average value/h Climate tendency rate /h/10a
1707-1799 -5.04 0.02 438.64 0.85 2626.87 -1.44
1800-1899 -5.11 -0.01 434.91 -0.33 2624.13 -2.80*
1900-1999 -4.28 0.32** 446.50 6.04** 2551.71 -23.27**
2000-2013 -2.15 -0.01 470.44 116.57 2451.57 -116.22

Note: * denotes the results passed the significant test at the level of P =0.05; ** denotes the results passed the significant test at the level of P =0.01

2.1.2 Sudden change detection of climatic series
Using MTT and YAMA method, the sudden change detection was performed on the annual average temperature, precipitation and sunshine duration series during the period from 1707 to 2013 in the northern GKM, and the reliable sudden change years were determined through comparisons. Table 2 lists the results of years that passed the significance test at the level of P≤0.01. One can conclude that the annual average temperature exhibits sudden changes in 1866, 1960 and 1987, in which the sudden change in 1960 is most intensive; the precipitation exhibits sudden changes in 1867 and 1927, in which the sudden change in 1867 is most intensive; the sunshine duration exhibits sudden changes in 1866, 1960 and 1978, in which the sudden change in 1866 is most intensive. The years with most strong sudden changes of precipitation and sunshine duration are basically consistent with the years with sudden changes of annual average temperature, indicating that the climate in this region really underwent sudden changes or transitions in the mid-1860s. The sudden change directions were further determined using MTT analysis. It can be observed that annual average temperature and sunshine duration share the same sudden change points but different sudden change directions. The annual average temperature and precipitation varied suddenly from less to more while the sunshine duration varied suddenly from more to less, which are in good consistency with the variation tendencies of the above climatic series.
Table 2 Sudden change years of the climatic series in the northern Greater Khingan Mountains from 1707 to 2013
Factors Methods Sudden change years
Annual average
temperature
MTT 1771 1788 1846 1866 1960 1987
YAMA - - - 1866 1960 1987
Precipitation MTT 1771 1788 1847 1867 1900 1908 1927 1974 1979
YAMA - - - 1867 - - 1927 - -
Sunshine
duration
MTT 1771 1788 1866 1887 1934 1960 1978
YAMA - - 1866 - - 1960 1978
2.1.3 Periodic variation of climatic series
Figure 3 displays the Mexican Hat wavelet analysis results of the climatic series from 1707 to 2013, in which the negative isolines were denoted by the dash lines and represent that the factor values are comparatively lower, and the positive or zero isolines were denoted by the solid lines and represent that the factor values are comparatively greater. As shown in Figure 3a, the periodic oscillation of annual average temperature is intensive on a time scale below 10 years, exhibiting no obvious rules; as the time scale increases, the oscillations show obvious periodic rules on the time scale of 20-25 years, and the fluctuation variations on the calculated time domain can be observed, i.e., the annual average temperatures are sometimes lower and sometime higher and totally 8 alternations of warming and cooling occurred in this region. Moreover, the isolines of annual average temperature have still not been closed by 2013, suggesting that this region is in a warming period for some time to come. As shown in Figure 3b, the periodic oscillation of precipitation is also intensive on a time scale below 10 years, exhibiting no obvious rules; with the increase of time scale, the obvious rules can be observed in the periodic oscillation on the time scale of 20-25 years and totally 9 alternations of drying and wetting occurred in this region. Similarly, isolines of precipitation have still not been closed by 2013, suggesting that the precipitation in this region will be slightly more for some time in the future. As shown in Figure 3c, on the time scale of 25-30 years, the sunshine duration in this region shows significant periodic oscillations and totally 10 alternations of sunny and rainy can be observed. Until 2013, the isolines of sunshine duration have still not been closed, suggesting that the sunshine duration will be slightly less for some time in the future.
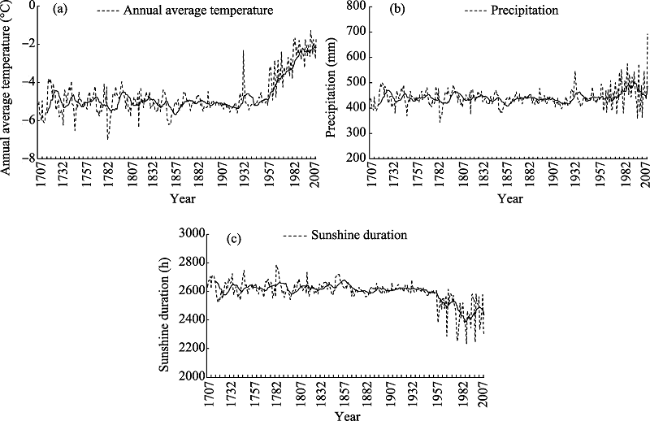
Figure 3 Wavelet analysis of climatic series in the northern Greater Khingan Mountains
Figure 4 displays the period analysis on the climatic series in the northern GKM during the period from 1707 to 2013 using the variance of wavelet coefficient. One can observe that, from 1707 to 2013, the wavelet variance of annual average temperature is 25 years; the wavelet variance of precipitation reaches a peak at 20 years, i.e., the primary period of the precipitation variation is 20 years; the sunshine duration variations are mainly the oscillations with the quasi-period of 25 years. According to the periodic characteristics, one can speculate that the annual average temperature will be in a wavelet period of continued warming from 2013 to 2030, the precipitation will be in a wavelet period characterized by slightly more precipitation from 2013 to 2029, and the sunshine duration will be in a wavelet period characterized by slightly less duration from 2013 to 2034. In other words, during the period from 2013 to 2030, the annual average temperature will be in a slightly-higher period, the precipitation will be in a slightly-more period and the sunshine duration will be in a slightly-less period.
Figure 4 Wavelet variances of climatic series in the northern Greater Khingan Mountains

2.2 Spatial analysis of climate changes

To analyze the spatial climate changes in the northern GKM, standardization processing and EOF analysis were conducted on the climatic series in this region, as the results presented in Figures 5-7.
Figure 5 Eigenvector fields of annual average temperature in the northern Greater Khingan Mountains (a. The first eigenvector field; b. The second eigenvector field)
Figure 6 Eigenvector fields of precipitation in the northern Greater Khingan Mountains
(a. The first eigenvector field; b. The second eigenvector field; c. The third eigenvector field; d. The fourth eigenvector field, the same below)
Figure 7 Eigenvector fields of sunshine duration in the northern Greater Khingan Mountains
As shown in Figure 5, after EOF expansion on the annual average temperature series, the variance contribution rate of the first eigenvector can reach up to 82.8%; the accumulated variance contribution rate of the first two eigenvectors is as high as 93.3%, suggesting that the first two eigenvectors can represent the variation of annual average temperature in this region. The typical field corresponding to the first eigenvector is positive and shows the consistency of annual average temperature variation in this region. As displayed in this typical field, the high-value distribution is concentrated along the Huma-Heihe line, and the eigenvectors values decrease gradually to the west and north; the secondary- high-value distribution is at the center of Genhe. The results demonstrate that, in these two regions of the northern GKM, the annual average temperature variation rates are relatively large; these two regions are also the sensitive regions to temperature changes. The typical field corresponding to the second eigenvector shows the variation characteristics that the southwest part is positive and the northeast part is negative. Zero-value lines are extended towards the northwest direction through Jiagedaqi and Elunchunqi, which represent the second temperature types in the study region. This type shows that the annual average temperature in this region shows the pattern characteristics of higher in the southwest part and lower in the northeast part or lower in the southwest part and higher in the northeast part.
Figure 6 displays the EOF analysis results of the precipitation series in the northern GKM. The accumulated variance contribution rate of the first four eigenvectors can reach up to 83.2%, suggesting that the first four eigenvectors can roughly represent the precipitation in the study region. These four eigenvectors were selected as the four basic distribution types in the study region, and thereby the precipitation in the study region can be classified into four types, namely, more (or less) in the whole region; more (or less) in the central region and less (or more) in the northeastern region; more (or less) in the eastern region and less (or more) in the western region; and more (or less) in the southern region and less (or more) in the northern region. The contribution rate of the first eigenvector to the total variance is up to 55.9%, and the typical field corresponding to the first eigenvector can be regarded as the most important typical field reflecting the precipitation variations in the study region. All this typical field is positive, i.e., the whole region is rainy or rainless and can be classified as the first distribution type. The high-value distribution is at the center of Elunchunqi, and the value decreases gradually to the north and east, reflecting that the region’s precipitation varies greatly. The contribution rate of the second eigenvector to the total variance is up to 11.2%, and zero-value isolines pass through Yilehuli Mountain and GKM. In terms of spatial distribution, the positive value region is located at the center of Elunchunqi that are surrounded by two mountains while the negative value region is located in the eastern Yilehuli Mountain and the northern GKM. The third eigenvector corresponds to the type of more (or less) in the eastern region and less (or more) in the western region, with the variance contribution rate of 8.8%. In terms of spatial distribution, the negative values in the eastern regions increase gradually towards the west, with the negative-value center in the Elunchunqi, i.e., the spatial pattern is characterized by the reverse variations between west and east. The contribution rate of the fourth eigenvector to the total variance is up to 7.4%. An opposed phase between north and south can be observed. A negative-value center exists in the north of Huzhong while the positive-value center is located in the south of Heihe, reflecting the fourth type of more (or less) in the southern region and less (or more) in the northern region. In other words, in this region, the precipitation is characterized by the reverse variations between south and north.
Figure 7 displays the EOF analysis results of the sunshine duration series in the northern GKM. The accumulated variance contribution rate of the first four eigenvectors can reach up to 85.0%, i.e., the first four eigenvectors can reasonably represent the spatial abnormal distribution of sunshine duration in the study region. The spatial distribution of the first eigenvector is characterized by the positive values in the whole region and in-phase distribution, suggesting that the spatial distribution of sunshine duration in the study region is mainly the consistency-type, i.e., the sunshine duration is easily more or less in the whole region. The maximum-value center is located at the center of Elunchunqi and the second high-value center is located at the center of Genhe. Since the contribution rate the first eigenvector to the total variance is up to 54.6%, more or less sunshine duration in the whole region is the leading spatial distribution type in the study region. The contribution rate of the second eigenvector to the total variance is up to 14.0%, suggesting that the variation type corresponding to the second eigenvector is also a typical spatial distribution of sunshine duration variation. This distribution type uses the Yilehuli Mountain and the GKM as the boundary. The values in the southern parts are positive while the values in the northern parts are negative. The positive-value center is located at the center of Elunchunqi, while the negative-value center is located at the center of Genhe. This spatial distribution is mainly affected by the geological characteristics. The contribution rate of the third eigenvector to the total variance is up to 9.3%. On the whole, the spatial distribution took the Mohe-Tulihe line as the boundary; the values in the eastern parts are negative while the values in the western parts are positive. This is a typical more (or less) in the eastern region and less (or more) in the western region. The greatest positive-value center is in the southern Eerguna while the greatest negative-value center is located in Tahe. The fourth eigenvector field varied greatly from the first three eigenvector fields. In terms of spatial distribution, the values in the middle parts are positive while the values in the eastern and western parts are negative. The positive-value center is located at the center of Jiagedaqi and Tahe. The contribution rate of the fourth eigenvector to the total variance is up to 7.1%, i.e., the fourth eigenvector reflects the fourth distribution type of sunshine duration in this study region.

2.3 Comparisons with the other research results

Table 3 lists the comparisons between the present research results and the results for Northeast China during the period from 1951 to 2007 as described by Fu et al. (2009). One can observe that, during the past 60 years, the warming tendency in the northern GKM is consistent with the warming tendency in Northeast China, with the annual average temperature tendency rates of 0.54℃/10a and 0.60℃/10a, respectively; the precipitations in the northern GKM and Northeast China both exhibit no obvious variation, with the precipitation tendency rates of 5.67 mm/10a and -0.27 mm/10a, but the variation tendencies are different during this period. Temperature and precipitation show a slight difference in spatial distributions, with almost identical distribution characteristics. By comparing the results from 1989 to 2007 with the results from 1971 to 1988, one can observe that spatial distributions of annual average temperature variations are basically identical, with the temperature increasing amplitudes of 0.67-1.73℃ and 0.98℃, respectively. As described by Fu et al. (2009), the temperature increasing amplitudes are slightly lower except the results in the northern GKM, i.e., certain differences can be observed. The results fit well the tendency of global warming, which is due to the multiplication of greenhouse gases and the variation of solar radiation.
Table 3 Comparisons of the annual average temperature and precipitation between the present study and the previous results in the northern Greater Khingan Mountains during the period from 1951 to 2007
Areas Meteorological Factors Comparisons
during the periods from 1989 to
2007 and from 1971 to1988,
respectively
Distribution areas Climate tendency rates from 1951
to 2007 (℃, mm/10a )
Northeast China
(from the literature)
Annual average temperature variation 0.67-1.73 Hulunbuir Pasture Land, Greater Khingan Mountains, Lesser Khingan Mountains, Songnen Plain, Liaoxi Mountain Land, Liaodong Peninsula, Sanjiang Plain, Changbai Mountains 0.60
Annual precipitation variation 5.40-67.27 Yilehuli Mountains, northern Greater Khingan Mountains, Lesser Khingan Mountains, northern Changbai Mountains, western Hulunbuir Pasture Land, eastern Inner Mongolian Plateau -2.70
Northern Greater
Khingan Mountains
(from this article)
Annual average temperature variation 0.98 Northern Greater Khingan
Mountains (50°10′-53°30′N,
119°40′-127°22′E)
0.54
Annual precipitation variation 13.26 Northern Greater Khingan Mountains (50°10′-53°30′N,
119°40′-127°22′E)
5.67
On the one hand, the northern GKM are mainly primeval forests, with sparse population. The temperature variation is tightly correlated with the topographic changes, and the temperature increasing amplitude decreases gradually with the rising of terrain. On the other hand, outside the northern GKM, the latitude is relatively low, with the vegetation of forests, grasslands and farmlands. The artificial heating and urbanization on account of dense population may also contribute to the warming in this region. The annual precipitation varies slightly in different regions, with the maximum annual precipitation increasing amplitude of 3.5 mm, which can almost be neglected. One can conclude that, in terms of the variations during two periods, the spatial variation amplitude of precipitation decreases gradually from high-latitude region to low-latitude region. This is due to the fact that, in the low-latitude regions, the artificial heating and urbanization have strong effects, the vegetation becomes sparser, and the landform transits from mountain lands to plain, i.e., the Northeast China Plain was formed. This may affect the general atmospheric circulation and the activities of cyclone. Compared with the results in Fu et al. (2009), the increasing amplitude of precipitation in the present study is smaller. This is because that the study regions are different and thus the average values of regional precipitation are different. On the whole, our research conclusions are reliable compared with the results in the other region.

3 Conclusions

In conclusion, the climate has been experiencing a significant change in the past 300 years in the northern GKM. There is an increasing trend of temperature. The precipitation increases slightly while the sunshine duration decreases. The variations of meteorological factors show distinctly regional difference.
(1) Decadal variations of climatic factors. In the northern GKM, the
annual average temperature increases at a rate of 0.06℃/10a (P≤0.01) during the period from 1707 to 2013. Specifically, in the 18th and 19th centuries, the annual average temperature in this region exhibits no obvious variations; in the 20th century, the temperature increases significantly, exceeding by 0.83℃ than the value in the 19th century, with the increasing amplitude of 0.32℃/10a (P≤0.01). The precipitation increased slightly on the whole, with the climate tendency rate of 0.79 mm/10a (P≤0.01). The precipitation decreased slightly in the 19th century and increases in the 20th century, with the climate tendency rate of 6.04 mm/10a (P≤0.01). During the period from 2001 to 2013, the precipitation is the greatest. Overall, the sunshine duration decreases, with the climate tendency rate of -5.15 h/10a (P≤0.01). The sunshine duration in the 19th century is reduced by 2.75 h compared with the value in the 18th century; in the 20th century, the sunshine duration decreases significantly, with the climate tendency rate of -23.27 h/10a (P≤0.01). From 2001 to 2013, the sunshine duration exhibits a greatest decline, which is 100.14 h smaller than the value in the 20th century.
(2) Abrupt change of climatic factors. The annual average temperature became warmer in 1866, 1960 and 1987, the precipitation increased suddenly in 1867 and 1927, and the sunshine duration decreased suddenly in 1866, 1960 and 1978. The strong sudden-change years of precipitation and sunshine duration basically coincide with the sudden-change years of average temperature, suggesting that in the mid-1860s, sudden change or transition of climate really occurred in the northern GKM. The climatic factors all exhibit obvious periodic changes and show different alternations with different periods. The annual average temperature and sunshine duration both have the primary periods of 25 years, while the precipitation has a significant period of 20 years.
(3) Spatial characteristics of climatic factors. The annual average temperature is characterized by integrality in the northern GKM. The high-value distribution is concentrated along the line of Huma (-0.7℃) and Heihe (0.7℃), and the eigenvectors values decrease gradually to the west and north; The secondary-high-value distribution is at the center of Genhe. The results suggest that, the annual average temperature variability is great in these two regions of northern GKM, where the temperature changes are also sensitive. As to the precipitation, the high-value distribution is at the center of Elunchunqi, and the value decreases gradually to the north and east. The spatial distribution of sunshine duration is mainly the consistency-type. The maximum-value center is located at the center of Elunchunqi and the secondary high-value center is located at the center of Genhe.

4 Discussion

The previous studies on the climate changes on the time scale over a century indicate that, since the 1950s, the concentrations of carbon dioxide (CO2) increase gradually under the influence of human activities and the earth has entered into an unprecedented era of climate changes (Stocker et al., 2013). Although the researchers now have accepted the viewpoint that the climate changes on a large time scale (for example, the global average temperature increases), the variation characteristics of various climatic factors on regional scale are still hard to determine (Millar et al., 2007). In other words, climate changes exhibit great uncertainties in different regions within a short time period (Walther et al., 2002), which is resulted from many reasons. In the present study, the annual average temperature in the northern GKM increases at a rate of 0.06℃/10a (P≤0.01). Although the present results basically fit well with the latest research results (the annual average temperature increases at a rate of (0.04-0.10℃)/10a (Ren et al., 2014), they are different from the previous estimations on China’s warming tendency over the past century. On the one hand, it indicates that our reconstructed meteorological data series in the northern GKM have high reliability (Tang et al., 2005); on the other hand, the differences originate from the differences in the study range, the length of climatic series and data sources. In the present study, the meteorological data before the 1950s were reconstructed based on the tree-ring data. Additionally, the data collected from the urban meteorological stations nearly for 60 years in the northern GKM may be affected by the enhanced urban heat island effect (He et al., 2013), leading to great uncertainties in the research on the climate changes in the northern GKM during the past 300 years. If the effects of urbanization on the data collected from the meteorological stations can be removed, the research on the mechanisms of climate changes in this region can be more accurate.
Generally, climate changes may lead to the changes in forest ecosystem structure and tree species. For example, the rising temperature can enhance the competitiveness of thermophilic species and contribute to their update and succession; however, the growth of chimonophilou plants may be suppressed (Xie et al., 2009; Wu et al., 2014). As the precipitation decreases, the growth of hygrophilous plants may be suppressed; even seriously, some leaves may fall or the tops may wither. This condition is conductive to the reproduction and invasion of some drought-enduring species. Climate changes can more easily change the plant’s phenology and thus affect the dependency or competitiveness between species, i.e., climate changes can affect the reproduction and survival of species (Li et al., 2014; Wu et al., 2014). Besides, climate changes can change the plants’ physiological and ecological characteristics and thereby play an important role in the formation of different species’ durability, reproductive capacity and migration ability in the new system. In a word, due to climate changes, some species may exit from the original forest ecosystem while some new species invade the system, i.e., the structure and species composition of the original forest ecosystem can thus be changed (Liu et al., 2015). Similarly, climate changes (for example, warming, increasing precipitation and reduced sunshine duration) not only changed the forest vegetation and the distribution pattern suitable for tree species in the northern GKM, but also may impose profound impacts on economic developments, ecology and environment in this region. Warming leads to the prolonging of plant vegetation season and the reduced occurrence probability induced by chilling damages, which will bring the newborn forestry climatic resources and can provide the possibility for the adjustment of forestry production system (Gao et al., 2013). The increased precipitation means the increased probability of extreme precipitation event, which could bring adverse effects on forestry production and wetland ecosystem. Meanwhile, the decline in sunshine duration may be bad for the plants’ photosynthetic efficiency and thus limited the release of the plants’ potential productivity. As a consequence, how to cope with the effects of the uncertainties of climate changes on the research on the forest ecosystem in the northern GKM is a major subject in the present study, which still requires more in-depth, systematic and comprehensive studies.

The authors have declared that no competing interests exist.

1
Briffa K R, Schweingruber F H, Jones P Det al., 1998. Reduced sensitivity of recent tree-growth to temperature at high northern latitude.Nature, 391: 678-682.Tree-ring chronologies that represent annual changes in the density of wood formed during the late summer can provide a proxy for local summertime air temperature. Here we undertake an examination of large-regional-scale wood-density/air-temperature relationships using measurements from hundreds of sites at high latitudes in the Northern Hemisphere. When averaged over large areas of northern America and Eurasia, tree-ring density series display a strong coherence with summer temperature measurements averaged over the same areas, demonstrating the ability of this proxy to portray mean temperature changes over sub-continents and even the whole Northern Hemisphere. During the second half of the twentieth century, the decadal-scale trends in wood density and summer temperatures have increasingly diverged as wood density has progressively fallen. The cause of this increasing insensitivity of wood density to temperature changes is not known, but if it is not taken into account in dendroclimatic reconstructions, past temperatures could be overestimated. Moreover, the recent reduction in the response of trees to air-temperature changes would mean that estimates of future atmospheric COconcentrations, based on carbon-cycle models that are uniformly sensitive to high-latitude warming, could be too low.

DOI

2
Cai Qiufang, Liu Yu, Bao Guanget al., 2010. Tree-ring-based May-July mean temperature history for Lüliang Mountains, China, since 1836.Chinese Science Bulletin, 55(20): 2033-2039. (in Chinese)

3
Cook E R, D’Arrigo R D, Mann M E, 2002. A well-verified, multiproxy reconstruction of the winter north Atlantic oscillation index since AD 1400.Journal of Climate, 15(13): 1754-1764.

4
D’Arrigo R, Wilson R, Deser Cet al., 2005. Tropical-north Pacific climate linkage over the past four centuries.Journal of Climate, 18: 5253-5265.Analyses of instrumental data demonstrate robust linkages between decadal-scale North Pacific and tropical Indo-Pacific climatic variability. These linkages encompass common regime shifts, including the noteworthy 1976 transition in Pacific climate. However, information on Pacific decadal variability and the tropical high-latitude climate connection is limited prior to the twentieth century. Herein tree-ring analysis is employed to extend the understanding of North Pacific climatic variability and related tropical linkages over the past four centuries. To this end, a tree-ring reconstruction of the December May North Pacific index (NPI) n index of the atmospheric circulation related to the Aleutian low pressure cell s presented (1600 1983). The NPI reconstruction shows evidence for the three regime shifts seen in the instrumental NPI data, and for seven events in prior centuries. It correlates significantly with both instrumental tropical climate indices and a coral-based reconstruction of an optimal tropical Indo-Pacific climate index, supporting evidence for a tropical North Pacific link extending as far west as the western Indian Ocean. The coral-based reconstruction (1781 1993) shows the twentieth-century regime shifts evident in the instrumental NPI and instrumental tropical Indo-Pacific climate index, and three previous shifts. Changes in the strength of correlation between the reconstructions over time, and the different identified shifts in both series prior to the twentieth century, suggest a varying tropical influence on North Pacific climate, with greater influence in the twentieth century. One likely mechanism is the low-frequency variability of the El Ni o Southern Oscillation (ENSO) and its varying impact on Indo-Pacific climate.

DOI

5
Fu Changchao, Liu Jiping, Liu Zhiming, 2009. Spacial and temporal differentiation rule of the climate change in northeast China in about 60 years.Journal of Arid Land Resources and Environment, 23(12): 60-65. (in Chinese)The methods of time series analysis and Creager interpolation,the technology of geographical information system(GIS),were adopted to conduct a resaerch into the spatio-temporal differentiation of climatic change about 60 years in the Northeast China.The results indicated that during the approximate 60 years from 1951 to 2007,the annual average temperature in the northeast showed a trend of increase while the annual rainfall showed a trend towards decline.There was big difference both in time and space.From 1951 to 1988,the temperature changed mildly,the increase scope was not much,and the temperature increases gradually from southwest to northeast.In the change of percipitation,except that in the Hulunbuir Plateau,the northern part of the Greater Hinggan Mountain and the hilly area of the Yilehuli,the rainfall increased slightly.In most areas of the northeast,the rainfall declined in different degrees,of which the rainfall in Liaohe Plain,Qian Mountain and surroundings of Bohai Sea declined sharply.From 1971 to 2007,the temperature had a general increase in the whole northeast region.The most obvious warming scope distributed in the Hulunbuir Plateau,the Greater and Smaller Hinggan Mountains and Songnen Plain;the slightest warming scope mainly distributed in the southern part of Liaohe Plain.In percipitation,the rainfall in the hilly area of Yilehuli,north of the Greater and Smaller Hinggan Mountains,northeast of Changbai Mountain,west of the Hulunbuir Plateau and east of Ner Mongolian plain increased in small scope,the area in which the rainfall declined sharply mainly distributed in Liaoxi Mountainous Region,Liaohe Plain,Liaodong peninsula and Qian Mountain.This study provided the scientific evidence for policy-making of the regional development of the Northeast area,the protection of the regional ecology and forecast of climatic change.

DOI

6
Gao Tao, 2013. Climate influence of the atmospheric circulation and sea surface temperature on Larix gmelinii (Rupr.) Rupr. growth: Focus on Genhe region as an example [D]. Hohhot: Inner Mongolia Agricultural University. (in Chinese)

7
Ge Quansheng, Liu Jian, Fang Xiuqiet al., 2013. General characteristics of temperature change and centennial warm periods during the past 2000 years.Acta Geographica Sinica, 68(5): 579-592. (in Chinese)The characteristics of warm/cold fluctuation for Northern Hemisphere (NH) and China during the past 2000 years were analyzed using the proxy-based temperature change series published recently. The duration of centennial warm periods before the 20th century and the difference between the warmth of the 20th century and the centennial warm periods that occurred prior to the 20th century were also investigated. The conclusions are summarized as follows: (1) Most of proxy-based NH temperature series show that the warm climate occurred in the periods of AD 1-270, 841-1290 and 1911-2000. In general, it was cool with multi-decadal temperature fluctuations from 271 to 840, and cold from 1291 to 1910. These centennial periods of warm/cold fluctuation over NH are corresponding to the Roman Warm Period (the 1st century BC to the mid-4th century AD), Dark Age Cold Period (the end of 4th century to the early of 10th century AD), Medieval Warm Period (the mid-10th century to the end of 13th century AD), Little Ice Age (the 15th to 19th century) and Warming Period in the 20th century illustrated by Lamb respectively. But they have different durations between the NH centennial warm/cold periods and those Warm/Cold Periods identified by Lamb. (2) The duration and amplitude of regional centennial phases of warm/cold fluctuation are different in China, but the timing of centennial periods of warm/cold over whole China, i.e. warm in AD 1-200, 551-760, 941-1300, 1901-2000 and cold in the others, which are consistent with that observed in NH approximately. (3) Most of proxy-based NH temperature change series show that the warmth in Medieval Warm Period is at least comparable to that during the Warming Period in the 20th century. The warmest 100-year and 30-year (i.e., warm peak duration) for whole China occurred in the periods of 941-1300 during the past 2000 years, which are slightly higher than in the 20th century respectively. Moreover, the temperature anomalies in the warmest 100-year and 30-year for whole China that occurred in the periods of 571-760 and 1-200 are comparable to and a little lower in the 20th century respectively.

DOI

8
Gou Xiaohua, Yang Tao, Gao Linlinet al., 2013. A 457-year reconstruction of precipitation in the southeastern Qinghai-Tibet Plateau.Chinese Science Bulletin, 58(11): 978-985. (in Chinese)

9
Guo Peipei, Yang Dong, Wang Huiet al., 2013. Climate change and its effects on climatic productivity in the Three-River Headwaters Region in 1960-2011.Chinese Journal of Ecology, 32(10): 2806-2814. (in Chinese)<p>Based on the air temperature and precipitation data from 13 meteorological stations in the ThreeRiver Headwaters (Yangtze River, Yellow River, and Lancang River) Region in 1960-2011, the climatic productivity in this Region was estimated by Thornthwaite Memorial model, and, through linear trend analysis, Kriging interpolation, MannKendall test, and Empirical Orthogonal Function (EOF) resolution, the spatiotemporal variations of the air temperature, precipitation, and climatic productivity were analyzed, with the responses of the climatic productivity to climate change studied. In this Region, the mean annual temperature and the mean temperature in winter and in summer in recent 52 years were featured by repeated cold and warm fluctuations, but overall, presented an obvious rising trend. The annual precipitation had no obvious variation trend, but the precipitation in winter and in growth season had an increasing trend. Spatially, the precipitation had opposite variation trend in the east and west as well as in the south and north. The climatic productivity had less increase before the 21st century, but increased obviously since then. The correlation coefficient of climatic productivity and air temperature was larger than that of climatic productivity and precipitation, illustrating that air temperature was the main factor limiting the climatic productivity. The warm and wet climate increased the climatic productivity by 8.67%, but the cold and dry climate decreased the climatic productivity by 8.91%. In the future, the region&rsquo;s climate would generally be warm and wet, and thus, the climatic productivity would be increased, which would be conducive to the improvement of natural herbage yield.</p>

10
He Wei, Bu Rencang, Xiong Zaipinget al., 2013. Characteristics of temperature and precipitation in northeastern China from 1961 to 2005.Acta Ecologica Sinica, 33(2): 519-531. (in Chinese)Northeastern China is one of the regions that would be mostly affected by the changing climates,and created the particular climate pattern and characteristics under climate changes.The pattern and characteristics of climate changes in Northeastern China was analyzed with the methods of the linear regression method,cumulative anomaly method,Mann-Kendall test method and Morlet wavelets analysis method based on daily average air temperature and daily precipitation data observed at 96 meteorological stations covered the Northeastern China from 1961 to 2005.The linear regression method was used to study the variation trends of mean temperature and precipitation on annual-scale and seasonal-scale in recent 45 years.The cumulative anomaly method and Mann-Kendall test method were used to test trends and abrupt changes of annual mean temperature and precipitation.The Morlet wavelet analysis method was used to detect the change interval of annual mean temperature and precipitation.The linear trend rates for annual and seasonal mean temperature and annual and seasonal precipitation were calculated at each meteorological station.Those rates were then interpolated using inverse distance weighted(IDW) interpolation to reveal their spatial distributions.The results showed that the climate in this region showed a significant warming trend,the annual mean temperature varied between 2.45 ℃ and 5.72 ℃,and the annual mean temperature has increased by 0.38 ℃/10 a(P0.01) in recent 45 years,and an abrupt change from low temperature to high temperature occurred in 1988—1989.In addition,all of the seasonal temperatures showed increasing trends,and the increase of temperature in winter were higher(0.53 ℃/10 a) than in the summer(0.24 ℃/10 a).The decade change of annual and seasonal mean temperature also showed spatially increasing trends and the higher the latitude,the more obvious the increasing trend.The calefactive range was larger in the northern Da Hinggan Mountains and Xiao Hinggan Mountains,and it was smaller in the Liaohe Plain,Liaodong Peninsula and southern Changbai Mountain.The annual precipitation varied between 430.40 mm and 678.72 mm,and the annual precipitation showed a decrease trend in recent 45 years,and decreased by 5.71 mm/10 a(P0.05),the precipitation in 1980s was more than in the other decades,and the abrupt change in precipitation occurred during in 1982—1983.The seasonal precipitation showed various trends,the spring precipitation and winter precipitation showed increasing trend,but the summer precipitation and autumn precipitation showed decreasing trend.The Liaodong Peninsula and southern Changbai Mountain showed significantly decreasing trend in precipitation,whereas,the northern Da Hinggan Mountains and Songnen Plain showed obviously increasing trend.The climate change interval analysis revealed that the annual mean temperature fluctuated significantly with the interval of 11 years,24 years and 6 years,and the annual mean precipitation fluctuated with interval of 16 years and 6 years,respectively.For this region,the climate was trended to be warmer and dryer in recent 45 years and the temperature and the precipitation showed different interval.

DOI

11
Huang Rui, Xu Ligang, Liu Junmin, 2013. Research on spatio-temporal change of temperature in the Northwest Arid Area.Acta Ecologica Sinica, 33(13): 4078-4089. (in Chinese)

12
IPCC, 2013. Working Group I Contribution to the IPCC Fifth Assessment Report, Climate Change 2013: The Physical Science Basis: Summary for Policymaker [R/OL]. [2013-10-28]: 3-32.

13
Li Miao, Xia Jun, Chen Sheminget al., 2011. Wavelet analysis on annual precipitation around 300 years in Beijing area.Journal of Natural Resources, 26(6): 1001-1011. (in Chinese)After making trend analysis and abrupt change analysis, a morlet wavelet analysis was used in this study for analyzing precipitation annual variability in about 300 years in Beijing Area. The complex construction of precipitation variability was revealed and precipitation period and mutation in multiple time scale was analyzed, finally a forecast about precipitation variability was made according to the main period. It is found that there exists a slowly increasing but non-significant trend for annual precipitation in Beijing Area, and the years of 1744, 1809, 1894 and 1996 are abrupt change points of annual precipitation reduction, while 1777, 1870 and 1948 are abrupt change points of annual rainfall increasing. Furthermore, the annual precipitation series in Beijing Area represents a non-uniform time-scale distribution in its calculation period with obvious local features. There exists a characteristic period of about 85-95 years for annual precipitation, while the periodic characteristics of 35-40 and 20-25 years are also relatively obvious. There are more or less alternatives changes in average precipitation at different time scales. Moreover, the analysis results show that there are main periods of 21 years, 35 years, and 85 years of which the 85-year period is the first order main period in this area. According to the first order main period, there will be a state of less precipitation in a period of 85 years after 2009 in Beijing Area.

DOI

14
Li Shicheng, He Fanneng, Zhang Xuezhen, 2014. An approach of spatially-explicit reconstruction of historical forest in China: A case study in Northeast China.Acta Geographica Sinica, 69(3): 312-322. (in Chinese)To research the climatic and ecological effects of historical land cover change, it is necessary to create historical land cover datasets with explicit spatial information. Using potential vegetation and satellite-based land use data, we determined the possible distribution extent of forest cover before reclamation. Then, some factors affecting land reclamation were selected to evaluate land suitability value of China for cultivation and then they were integrated into a model. Furthermore, historical forest gridding reconstruction model (the size of grid cell is 10 km by 10 km) was developed according to the land suitability value. As a case study, we reconstructed spatially explicit forest cover of 1780 and 1940 in Northeast China using this approach. The results demonstrated that the forest gridding reconstruction model we created can transform provincial forest area into spatially explicit data well. To test the model's rationality, we compared satellite-based forest cover and reconstructed forest cover of 2000. And the one sample t-test of the absolute error of them showed that the two-tailed significance was 0.12, larger than the significant level 0.05, suggesting that there was no significant difference between them and the gridding reconstruction method we designed was rational. The relative errors at county scale of forest cover reconstruction in 1780 of Northeast China were calculated. And the number of counties, whose relative error ranged from -30% ~ 30%, is 99, accounting for 74.44% of the totals (data missing counties are discharged).

DOI

15
Liu Shirong, Dai Limin, Wen Yuanet al., 2015. A review on forest ecosystem management towards ecosystem services: Status, challenges, and future perspectives.Acta Ecologica Sinica, 35(1): 1-9. (in Chinese)Forest ecosystems are the major components of terrestrial ecosystems. On the basis of their high primary productivity and abundant biodiversity,they play crucial roles in underpinning global ecosystems and human socialeconomic development. Population growth and rapid economic development are leading to increasing demand for forest resources and forest ecosystem services; in addition,modern human perceptions of and attitudes toward forest resource are changing. Strengthening of sustainable forest management to expand forest areas and improve forest quality and ecosystemfunctions constitutes the core task of China's forestry development strategy,ecological civilization initiative,and "Beautiful China"campaign. Here,we review historical and current developments in forest ecosystem management; in addition,we discuss the current problems and challenges faced by forest management in China. We explore future trends in China's forest management,based on ecosystem management principles and human welfare development for the multiple demands of forest ecosystem services. We consider four different future forest management strategies.( 1) A focus on changing from forest area expansion to enhancement of forest productivity and stand quality.( 2) A change from a unique focus on timber production to multiple management objectives with increased attention to ecological, social, and economic dimensions beyond traditional economic values in terms of timber production and non-timber products.( 3) Implementation of forest management across different scales,with a change from a stand level to an ecosystem level and even a landscape level.Spatial heterogeneity and forest dynamic changes across scales should be recognized,and forest landscape connectivity and diversity should be increasingly considered. Trade-offs and synergy among multiple services from various ecosystems across the forest landscape will be appropriately managed to meet the different interests of various stakeholders. Adoption of such a forest landscape management strategy will contribute to achieving optimal land use patterns in association with optimal resource utilization of biological,land,and water resources. This,in turn,will facilitate landscape sustainability and stability via a harmonized landscape configuration composed of mosaic land patches; in addition,it will improve the resilience of forest ecosystems to climate change.( 4) A forest ecosystem management system that is dependent mainly on updated forest monitoring data,digitized geo-spatial information,and intelligent decision-making process,rather than on traditional knowledge,experience,and subjective judgment. In summary,there is a clear need to develop decision-making support systems and forest landscape restoration and spatial management planning systems,in order to shape a knowledgeand information-based forest ecosystem management system.

DOI

16
Lu Shanna, Wang Xiaochun, 2014. Growth climate response and winter precipitation reconstruction of Pinus Sylvestris var. Mongolicain Ali River of Greater Khingan Range. Journal of Northeast Normal University (Natural Science Edition), 46(2): 110-116. (in Chinese)

17
Millar C I, Stephenson N L, Stephens S L, 2007. Climate change and forests of the future: Managing in the face of uncertainty. Ecological Applications, 17(8): 2145-2151.We offer a conceptual framework for managing forested ecosystems under an assumption that future environments will be different from present but that we cannot be certain about the specifics of change. We encourage flexible approaches that promote reversible and incremental steps, and that favor ongoing learning and capacity to modify direction as situations change. We suggest that no single solution fits all future challenges, especially in the context of changing climates, and that the best strategy is to mix different approaches for different situations. Resources managers will be challenged to integrate adaptation strategies (actions that help ecosystems accommodate changes adaptively) and mitigation strategies (actions that enable ecosystems to reduce anthropogenic influences on global climate) into overall plans. Adaptive strategies include resistance options (forestall impacts and protect highly valued resources), resilience options (improve the capacity of ecosystems to return to desired conditions after disturbance), and response options (facilitate transition of ecosystems from current to new conditions). Mitigation strategies include options to sequester carbon and reduce overall greenhouse gas emissions. Priority-setting approaches (e.g., triage), appropriate for rapidly changing conditions and for situations where needs are greater than available capacity to respond, will become increasingly important in the future.

DOI PMID

18
Qu Huihui, Zhao Huiying,Gong Lijuan, 2016. Climate data inversion for typical areas in northern of Greater Khingan Range for the last 300 years.Journal of Ecology and Rural Environment, 32(2): 184-191. (in Chinese)

19
Ren Guoyu, Ren Yuyu, Li Qingxianget al., 2014. An overview on global land surface air temperature change.Advances in Earth Science, 29(8): 934-946. (in Chinese)<p>Understanding of tempospatial pattern and the systimatic bias of the obeserved decadal to multidecadal variability and longterm trends of global land Surface Air Temperature (SAT) is needed for climate change studies and policymaking. This paper summarizes the state and problems of the current studies of global land SAT change, and points out the necessarty and possibility to launch a new study of global and regional SAT dataset and analyzing products. It is obvious from the overview that there exist some problems with the current three global datasets under use in global climate change research, and a major issue would be the inefficient treatments of the urbanization bias in the land SAT series. It is proposed that the Chinese global land SAT dataset developed in the China Meteorological Administration (CMA) be improved and completed, and the urbanization effect on SAT trends of global land stations be evaluated and adjusted. Based on the urbanbias adjusted SAT datasets, global and regional SAT series could be constructed and analyzed to reveal the spatial and temporal patterns of SAT variablity and change. Chinese scientists could play a more important role in the endouvour facing climate community.</p>

DOI

20
Shi Xinghe, Qin Ningsheng, Zhu Haifenget al., 2010. May-June mean maximum temperature change during 1360-2005 as reconstructed by tree of Sabina Tibetica in Zaduo, Qinghai Province.Chinese Science Bulletin, 55(19): 1924-1931. (in Chinese)

21
Stocker T F, Dahe Q, Plattner G K, 2013. Climate Change 2013: The Physical Science Basis. In: Working Group I Contribution to the Fifth Assessment Report of the Intergovernmental Panel on Climate Change Summary for Policymakers (IPCC, 2013): 867-952.

22
Sun Fenghua, Yang Suying, Chen Pengshi, 2005.Climatic warming-drying trend in Northeastern China during the last 44 years and its effects.Chinese Journal of Ecology, 24(7): 751-755. (in Chinese)Northeastern China is one of the areas mostly influenced by global change and has particular climate characteristics. According to the data from 1949, climate changes, including climate jumps and climatic warming-drying trend, during the last 44 years were analyzed with the methods of Yamamoto check and climate trend coefficient. Possible effects of this change on eco-environment were discussed. The results showed that the climate in the area trended to become warming-drying, with seasonal and regional differences. It was more obvious in summer and autumn and in sensitive areas such as Sanjiang Plain and Horqin sandy land. Eco-environment problems resulted from the climate change should be recognized.

DOI

23
Sun Yu, Wang Lili, Chen Jinet al., 2012. Reconstructing mean maximum temperatures of May-August from tree-ring maximum density in North Da Hinggan Mountains, China.Chinese Science Bulletin, 57(19): 1785-1793. (in Chinese)

24
Tang Guoli, Ren Guoyu, 2005. Reanalysis of surface air temperature change of the last 100 years over China.Climatic and Environmental Research, 10(4): 791-798. (in Chinese)The present paper gives a new country-averaged surface air temperature anomaly series for China for 1905—2001 period. We used monthly mean temperature dada obtained by averaging monthly mean maximum and minimum temperatures to avoid the in-homogeneity problems with data induced by differential observation times and statistic methods between early and late 20th century. The widely accepted procedures for creating area-averaged climatic time series and for calculating linear trend have been used. The new air temperature time series has been analyzed and its rationality also has been explained. The result shows that annual mean surface air temperature of the country for the past 97 years experienced a warming of 0.79 ℃, with a warming rate of 0.08 ℃/10 a which is slightly larger than global or northern hemispheric average as given by IPCC TAR. Two warm periods, which occurred respectively in the 1930s—1940s and the 1980s—1990s, are evident, with 1946 and 1998 as the warmest ones within the record period. It is interesting to note that the temperature anomalies of the 1990s are no higher than those of the 1940s, implying the larger contribution from warming of the cold periods to the long-term positive trend. Seasonal features of temperature changes for the last 97 years are characterized by the more rapid warming of wintertime and springtime, with summer showing an insignificant cooling trend during the 97-year period. However, the reanalysis did not take account for urbanization effect on temperature record. It is essential to pay more attention to the problem in the further study if we intend to better detect the regional change in climate.

DOI

25
Walther G R, Post E, Convey Pet al., 2002. Ecological responses to recent climate change.Nature, 416(6879): 389-395.Nature is the international weekly journal of science: a magazine style journal that publishes full-length research papers in all disciplines of science, as well as News and Views, reviews, news, features, commentaries, web focuses and more, covering all branches of science and how science impacts upon all aspects of society and life.

DOI PMID

26
Wang Weiwei, Zhang Junhui, Dai Guanhuaet al., 2012. Variation of autumn temperature over the past 240 years in Changbai Mountains of Northeast China: A reconstruction with tree-ring records.Chinese Journal of Ecology, 31(4): 787-793. (in Chinese)

27
Wu Shuang, Yan Xiaodong, Zhang Lijuan, 2014. The relationship between forest ecosystem emergy and forest ecosystem service value in China.Acta Geographica Sinica, 69(3): 334-342. (in Chinese)In this study, with the help of emergy value theory and ecosystem service value theory, we established the function relationship between forest emergy value and ecosystem service value in China using the global temperature and precipitation data during 1901-2009 and 1266 sample forest data of major vegetation types in China. Results indicate that: there was a high consistency of the spatial distribution of the Chinese forest ecosystem service value in 1994 between the simulated results by the established function relationship and the evaluation results from Costanza. In particular, the raster number of forest areas in China increased by about 14.02% from 1990 to 2009, and the mean forest ecosystem service value density increased by about 54.46 USD/hm<sup>2</sup>. In addition, the mean forest ecosystem service value density for Beijing, Shanghai, Jiangsu, Tianjin, Hebei decreased by about 86.87%, 85.45%, 81.99%, 46.48% and 23.07%, respectively, and the mean ecosystem service value density for Henan, Hunan, Jilin, Jiangxi, Heilongjiang and Zhejiang decreased by about 71.35%, 58.65%, 52.70%, 34.56%, 23.36% and 22.03%, respectively. There was also a severe forest destruction in Guangxi, Tibet, Gansu, Inner Mongolia, Sichuan, Yunnan, and Ningxia, and the mean forest ecosystem service value density of those provinces decreased by about 2.89%-22.36%. According to the fourth and seventh National forest survey reports, the forest areas have continually increased in recent years. However, the reports show that the forest ecosystem service value density in several provinces have decreased, and indicate that the forest ecosystem has not been fully recovered. Generally speaking, the forest ecosystem service value is lower than the global average level, suggesting that the forest eco-environment is not good enough in China, and human activities have a tremendous negative impact on the ecosystem.

DOI

28
Xie Chaozhu, Xie Lin, 2009. A high degree of concern about forest in climate change: The new mission of China’s forestry development. Journal of Beijing Forestry University (Social Sciences), 8(3): 34-36. (in Chinese)

29
Yadav R R, Singh J, 2002. Tree-ring-based spring temperature patterns over the past four centuries in Western Himalaya.Quaternary Research, 57(3): 299-305.A network of 12 tree-ring width chronologies of Himalayan cedar ( Cedrus deodara ) from the western Himalayan region, India, has been used to reconstruct mean spring (March–May) temperature variations back to A.D. 1600. The most conspicuous feature of the temperature reconstruction is the long-term cooling trend since the late 17th century that ended early in the 20th century. The warmest 30-yr mean for the 20th century was recorded during 1945–1974. However, this warming, in the context of the past four centuries is well within the range of natural variability, since warmer springs of greater magnitude occurred in the later part of the 17th century (1662–1691).

DOI

30
Yang Danhui, 2012. New Trends of global climate change action and China’s Negotiation Strategy. Journal of China University of Geosciences (Social Sciences Edition), 12(4): 8-13. (in Chinese)

31
Yu Dapao, Wang Shunzhong, Tang Linaet al., 2005. Relationship between tree-ring chronology of Larixol gensis in Changbai Mountains and the climate change.Chinese Journal of Applied Ecology, 16(1): 14-20. (in Chinese)The relationship of larch (<i>Larix olgensis</i>) radial growth in Changbai Mountains with climate change was assessed by dendrochronological techniques including correlation functions and single-years analysis.The results showed that larch growth was sensitive to environmental change,and temperature was the primary factor affecting larch growth.The larch growing in high and low elevations had a significantly different response to temperature.In high elevation,larch growth was significant correlated to the mean temperature of June,but in low elevation,it had a more complicated relationship to the environment.Besides the mean temperature of April and May,the temperature of last June and September and the humid index of last September significantly correlated with the larch tree ring-width.Therefore,it was not the same relationship of the same tree species with different environmental gradients.

32
Zhang Jian, Man Zhimin, Song Jinxiet al., 2015. Sequence reconstruction and characteristics diagnosis of areal precipitation in the middle Yellow River from May to October during 1765-2010.Acta Geographica Sinica, 70(7): 1101-1113. (in Chinese)<p>Based on the records of water level at hydrological points and flood report in the Yellow River Basin during the Qing Dynasty, we reorganized the data record of Wanjintan water level concerning Shanxian County (named Shanzhou in the Qing Dynasty, presently Sanmenxia City now), and rebuilt the areal precipitation change sequence in the middle Yellow River from May to October between 1765 and 2010. In this study, accumulative anomaly methods, wavelet analysis, and moving t-test technique were used to examine the characteristics of flood in different phases, periodicities, and mutability of precipitation in the past 246 years. Results showed that precipitation increased rapidly from 1816 to 1863, 1902 to 1918, and 1938 to 1989; the precipitation decreased from 1765 to 1815, 1864 to1901, and 1919 to 1937. According to the wavelet analysis, five types of time scales of the areal precipitation were identified, with the average periods being 72.7a, 46.8a, 30.3a, 22.5a and 11.2a, respectively. By the method of moving t-test technique, three periods of the abrupt change were found in the sequence of areal precipitation, namely 1824-1826, 1856-1874, and 1933-1937. The sequence tendency of a decadal areal precipitation coincided with other alternative indicators, which reflected the precipitation sequence alignment and external factors. The corresponding period including different phases, such as the 1810s, 1840-1850s, 1880-1900s, 1920s, 1970s and 1990s. It is shown that the reconstruction results were consistent on the basis of proxy data from historical documents and natural indicators, and that there were a lot of uncertainties in historical climate change.</p>

DOI

33
Zhao Huiying, Wu Liji, Hao Wenjun, 2008. Influences of climate change to ecological and environmental evolvement in the Hulun Lake wetland and its surrounding areas.Acta Ecologica Sinica, 28(3): 1064-1071. (in Chinese)Using meteorological data,water area and water level data,and ecological data in the Hulun Lake area,we analyzed influences of regional climate change to wetland ecosystem evolvement of the Hulun Lake area.Regression analyses shows(1)climate change presented a warmer and dryer trend during last 45 years that might be the major cause of water resources deficit and ecosystem degradation;(2)water area and level indicated a consistent trend with an average changing rate of 34.78km2/10a and 0.27m/10a,concretely,slowly increase during 1959-1963 and 1983-1991,decrease during 1964-1982 and 1992-2006 with maximum decrease from 2000 to 2006;(3)a positive correlation was detected between water area/level and precipitation with a changing rate of 2-19 km2 increases of water area per 10mm increase in seasonal and annual precipitation,whereas negative correlations were found between water area/level and air temperature and evaporation,respectively,with a changing rate of 28-80km2 and 4cm decreases of water area and water level per 1 increase in seasonal and annual temperature;(4)induced by warmer and dryer climate,the desertification area increased to over 100km2,degradation area of pasture accounted for 30% of the total area,the vegetation coverage decreased 15%-25% since 1974,and the primary production decreased 30%-50% and less than 20% in the most severe area.

34
Zhao Jingbo, Xing Shan, Zhou Qi, 2012. Frost and snow disaster and change periods in Guanzhong Plain in Ming Dynasty.Acta Geographica Sinica, 32(1): 81-86. (in Chinese)Based on collecting,reorganizing and analyzing the history data about the Guanzhong Plain during the Ming Dynasty,the grade series,stage changes and different grades' periodicity of the frost and snow disaster are studied in this study.The statistical results show that,frost and snow disaster of the Ming Dynasty had 22 times altogether,and occurred averagely one time per 12.6 years.The Guanzhong Plain's frost and snow disaster grade may be divided into mild,moderate and severe disaster in the Ming Dynasty,and their occurrence probabilities are 26%,52% and 22%.The disaster has been divided into four uneven periods in the Guanzhong Plain.The first period(1368-1448),and the third one(1508-1568) had the fewer disasters in the Guanzhong Plain,and there were the more disasters during the second period(1449-1507),and the fourth one(1569-1644).The frequency of frost and snow disasters was obvious upward in the Guanzhong Plain.Wavelets analysis has the characteristics of multi-resolution analysis and ability of expressing local features of signal in both time and frequency domains,which is a local analysis method.This novel method is suitable for complex natural disaster systematic.The spatial distribution,temporal evolution and multi-scale period of the frost and snow disaster are studied from the year of 1368 to 1644,applying wavelet analysis method and the history data about the Guanzhong Plain during the Ming Dynasty.The result of wavelet analysis shows,the mild,moderate,severe disaster occurrence periodicity is respectively 11,8 and 44 years.The change of frost and snow disaster in the Guanzhong Plain during the Ming Dynasty is significant.This phenomenon can indicate climate change of the Ming Dynasty.On the basis degree of the frost and snow disaster,mean annual temperature can be reconstructed.There was one cold climatic event in the Guanzhong Plain in Ming Dynasty,occurring between 1618 and 1631,and the temperature was obviously lower than the other time of Ming Dynasty and the modern.There are six disasters in the period,including one-time moderate frost and snow disaster,5-times severe frost and snow disasters.The frost and snow disaster occurred averagely one time per 2.3 year during the period.The degree and frequency frost and snow disaster is greater than that of the other time of Ming Dynasty.The result can indicate that there is the little ice age of Ming Dynasty.The results mentioned above indicate that the primary cause of the frequency of frost and snow disasters in the Guanzhong Plain was sudden drop of air temperature caused by sustainable snowfall,accumulated snow and cold snap.

35
Zhou Yiliang, 1991. China Greater Khingan Range Vegetation. Beijing: Science Press, 3-6. (in Chinese)

Outlines

/