
Journal of Geographical Sciences >
Uncertainty of forest biomass carbon patterns simulation on provincial scale: A case study in Jiangxi Province, China
Author: Wang Yifu (1990-), PhD Candidate, specialized in ecological modeling and system simulation. E-mail: wangyf@lreis.ac.cn
*Corresponding author: Yue Tianxiang (1963-), PhD and Professor, E-mail: yue@lreis.ac.cn
Received date: 2015-09-23
Accepted date: 2015-12-29
Online published: 2016-05-25
Supported by
National Fundamental R&D Program of the Ministry of Science and Technology of the People’s Republic of China, No.2013FY111600-4
Copyright
Forest vegetation carbon patterns are significant for evaluating carbon emission and accumulation. Many methods were used to simulate patterns of forest vegetation carbon stock in previous studies, however, uncertainty apparently existed between results of different methods, even estimates of same method in different studies. Three previous methods, including Atmosphere-vegetation interaction model 2 (AVIM2), Kriging, Satellite-data Based Approach (SBA), and a new method, High Accuracy Surface Modeling (HASM), were used to simulate forest vegetation carbon stock patterns in Jiangxi Province in China. Cross-validation was used to evaluate methods. The uncertainty and applicability of the four methods on provincial scale were analyzed and discussed. The results showed that HASM had the highest accuracy, which improved by 50.66%, 33.37% and 28.58%, compared with AVIM2, Kriging and SBA, respectively. Uncertainty of simulation of forest biomass carbon stock was mainly derived from modeling error, sampling error and statistical error of forest area. Total forest carbon stock, carbon density and forest area of Jiangxi were 288.62 Tg, 3.06 kg/m2 and 94.32×10⁹ m2 simulated by HASM, respectively.
Key words: forest carbon stock; HASM; AVIM2; Kriging; Satellite-data Based Approach (SBA)
WANG Yifu , *YUE Tianxiang , LEI Yuancai , DU Zhengping , ZHAO Mingwei . Uncertainty of forest biomass carbon patterns simulation on provincial scale: A case study in Jiangxi Province, China[J]. Journal of Geographical Sciences, 2016 , 26(5) : 568 -584 . DOI: 10.1007/s11442-016-1286-z
Table 1 C content of tree species (Li and Lei, 2010) |
| Tree species | CC |
|---|---|
| Pinus massoniana | 0.4596 |
| Pinus densata | 0.5009 |
| Pinus elliottii | 0.4596 |
| Pinus taeda | 0.4596 |
| Cunninghamia lanceolata | 0.5201 |
| Coniferous mixed forest | 0.5101 |
| Broad-leaved and coniferous mixed forest | 0.4978 |
| Cinnamomum camphora | 0.4916 |
| Schima superba | 0.4916 |
| Liquidambar formosana | 0.4916 |
| Oaks | 0.5004 |
| Sassafras tzumu | 0.4848 |
| Eucalyptus robusta | 0.5253 |
| Populus | 0.4956 |
| Broad-leaved mixed forest | 0.49 |
Table 2 Biomass empirical models for each tree species (Li et al., 2010). WA, WR, WS, WBa, WBr and WL are biomass of aboveground, root, stem, bark, branch and leaf, respectively (kg); D (cm) and H (m) are diameter at breast height and tree height, respectively; a and b are parameters. |
 |
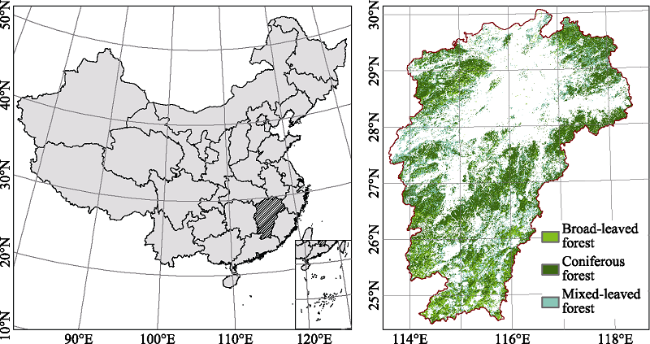
Figure 1 Location and distribution of forest in Jiangxi Province |
Table 3 The forest types contained by two land cover maps (of China) |
| GlobCover 2009 land cover map | GLC2000 | ||
|---|---|---|---|
| Class | Class name | Class | Class name |
| 20 | Mosaic cropland (50%-70%) / vegetation (grassland/shrubland/forest) (20%-50%) | 1 | Tree cover: broad-leaved, evergreen |
| 30 | Mosaic vegetation (grassland/shrubland/forest) (50%-70%) / cropland (20%-50%) | 2 | Tree cover: broad-leaved, deciduous, closed |
| 40 | Closed to open (>15%) broad-leaved evergreen or semi-deciduous forest (>5 m) | 3 | Tree cover: broad-leaved, deciduous, open |
| 50 | Closed (>40%) broad-leaved deciduous forest (>5 m) | 4 | Tree cover: needle-leaved, evergreen |
| 60 | Open (15%-40%) broad-leaved deciduous forest/woodland (>5 m) | 5 | Tree cover: needle-leaved, deciduous |
| 70 | Closed (>40%) needle-leaved evergreen forest (>5 m) | 6 | Tree cover: mixed-leaved type |
| 90 | Open (15%-40%) needle-leaved deciduous or evergreen forest (>5 m) | 7 | Tree cover: regularly flooded, fresh water |
| 100 | Closed to open (>15%) mixed broad-leaved and needle-leaved forest (>5 m) | 8 | Tree cover: regularly flooded, saline water |
| 110 | Mosaic forest or shrubland (50%-70%) / grassland (20%-50%) | 9 | Mosaic: Tree cover / Other natural vegetation |
| 120 | Mosaic grassland (50%-70%) / forest or shrubland (20%-50%) | 10 | Tree cover: burnt |
 =1.
=1.
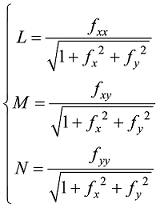
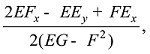
 , then the first fundamental coefficients can be formulated as:
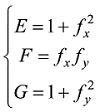
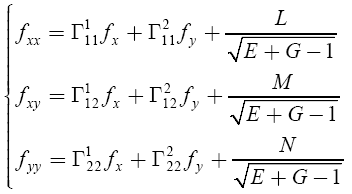
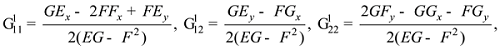

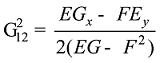 and
and 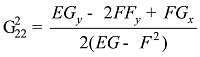 are the second kind of Christoffel symbols.
 (n ≥ 0) represents the iterants of f(x, y) at (xi, yj) in the nth iterative step, in which {
  } are interpolations based on sampling values {
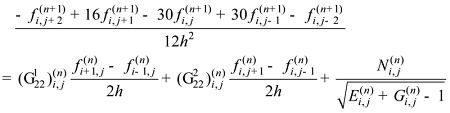
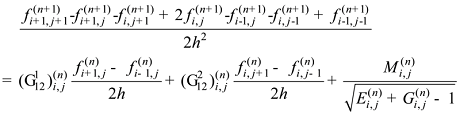
  }. In terms of numerical mathematics (Quarteroni et al., 2000), the iterative formulation of the HASM master equation set can be expressed as (Yue et al., 2013b; Zhao and Yue, 2014a),
 ,
,  and
and  are the iterants of the first fundamental coefficients at the nth iterative step;
  ,
,  and
and  represent the iterants of the second fundamental coefficients at the nth iterative step;
  ,
,  ,
,  and
and  are the iterants of the Christoffel symbols of the second kind at the nth iterative step, which depend only upon the first fundamental coefficients and their derivatives.
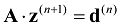

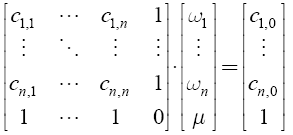
 is the value of the nth iteration of f(x, y) at grid cell (xi, yi);
  for
for  ,
,  .
. is value of z = f(x, y) at the pth sampled point (xi, yi),
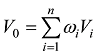
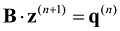
 There is only one non-zero element, 1, in every row of the coefficient matrix, S, making it a sparse matrix. The solution procedure of HASM, taking the sampled points as its constraints, can be transformed into solving the following linear equation set in terms of least squares principle
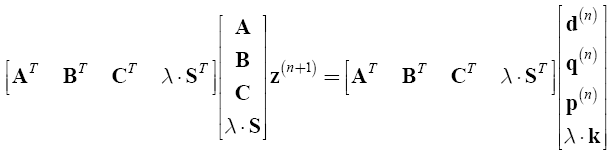
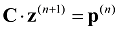
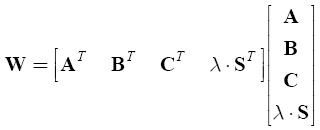 and,
and, 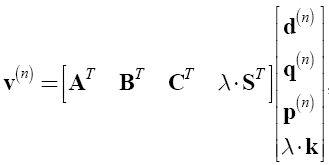 ,then HASM has the following formulation,
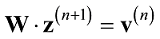
 φ2=
φ2=  P=
P=  Q=
Q=  ϕ1=
ϕ1=  ϕ2=
ϕ2=  EI is the iteration stopping criterion of HASM determined by an application requirement for accuracy.
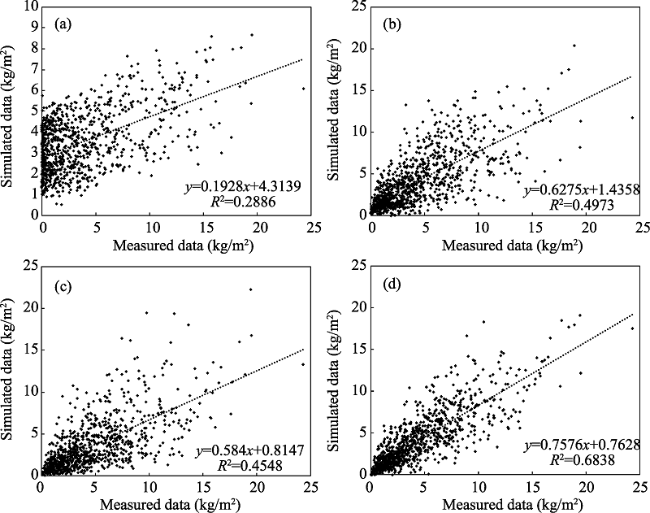
Figure 2 Comparison between observed and simulated results of forest vegetation C density (a. AVIM2; b. SBA; c. Kriging; d. HASM) |
Table 4 The accuracy of the four methods for forest vegetation C stock pattern simulation of Jiangxi Province in China |
| Methods | MAE (kg/m-2) | MRE (%) |
|---|---|---|
| AVIM2 | 2.63 | 79.79 |
| Kriging | 2.06 | 62.5 |
| SBA | 1.9 | 57.71 |
| HASM | 0.96 | 29.13 |
Table 5 Comparison of forest vegetation C stocks of Jiangxi Province estimated by different methods (Tg =1012 g). Forest vegetation C stocks include C stocks of forest stands, economic forests, woodlands, shrub forests, bamboos and trees in non-forest. C stocks of forest stands include C stocks of needle-leaved forests, broad-leaved forests and mixed-leaved forests. |
| Methods | Components | Area (109 m2) | Carbon density (kg/m2) | Carbon stock (Tg) | Periods | References |
|---|---|---|---|---|---|---|
| Volume-derived | Forest stands | 78.93 | 2.72 | 214.70 | 2001-2005 | Li X et al., 2011 |
| Volume-derived | Forest | 100.33 | 2.63 | 263.87 | 2001-2005 | Li X et al., 2011 |
| Volume-derived | Forest stands | 3.00 | 2004-2008 | Li H K et al., 2011 | ||
| Volume-derived | Forest | 289.07 | 2004-2008 | Li H K et al., 2011 | ||
| Volume-derived | Forest | 99.80 | 2.67 | 297.97 | 2004-2008 | This study |
| Volume-derived | Forest stands | 76.81 | 3.02 | 231.97 | 2004-2008 | This study |
| Volume-derived | Needle-leaved forests | 47.05 | 2.60 | 122.33 | 2004-2008 | This study |
| Volume-derived | Broad-leaved forests | 21.83 | 3.84 | 83.82 | 2004-2008 | This study |
| Volume-derived | Mixed-leaved forests | 7.94 | 3.25 | 25.82 | 2004-2008 | This study |
| Volume-derived | Economic forests | 12.03 | 1.19 | 14.26 | 2004-2008 | This study |
| Volume-derived | Bamboos | 8.52 | 2.06 | 17.54 | 2004-2008 | This study |
| Volume-derived | Woodlands | 0.45 | 0.99 | 0.44 | 2004-2008 | This study |
| Volume-derived | Shrub forests | 1.99 | 0.99 | 1.96 | 2004-2008 | This study |
| Volume-derived | Trees in non-forest | 31.80 | 2004-2008 | This study | ||
| Volume-derived | Forest stands | 72.78 | 2.86 | 208.15 | 1999-2003 | This study |
| AVIM2 | Forest | 94.32 | 3.71 | 349.93 | 2004-2008 | This study |
| Kriging | Forest | 94.32 | 3.04 | 286.73 | 2004-2008 | This study |
| SBA | Forest | 94.32 | 3.25 | 306.54 | 2004-2008 | This study |
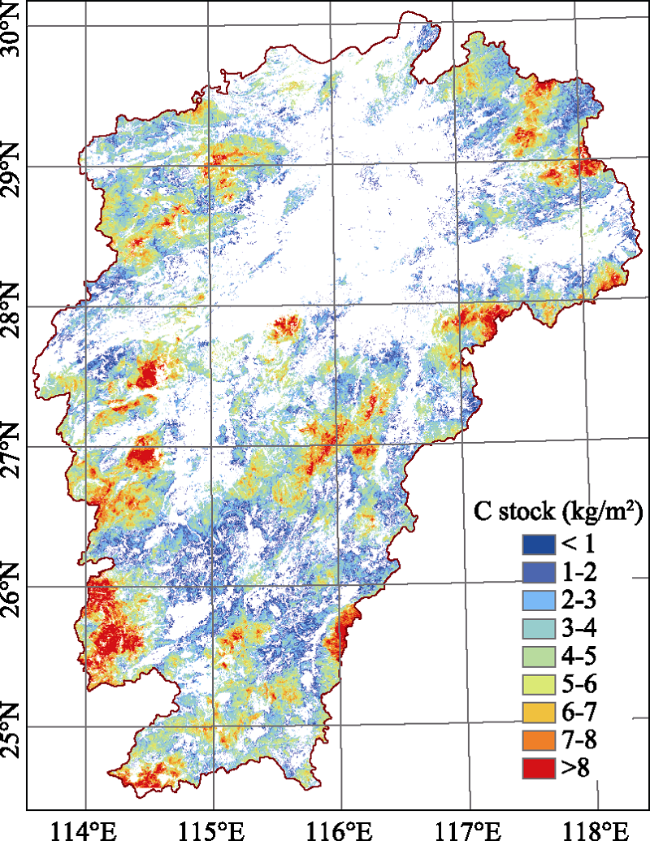
| HASM | Forest | 94.32 | 3.06 | 288.62 | 2004-2008 | This study |
| HASM | Forest | 94.32 | 2.88 | 271.64 | 1999-2003 | This study |
Figure 3 Forest vegetation C stock patterns simulated by HASM |
Table 6 Correlation coefficient (R) between biomass C density and factors. ** means the factor was significantly correlated to biomass C density, P < 0.01. |
| Factors | B1 | B2 | B3 | B4 | B5 | B7 | NDVI | RVI | Altitude | Aspect | Slope |
|---|---|---|---|---|---|---|---|---|---|---|---|
| R | -0.210** | -0.266** | -0.254** | 0.242** | -0.175** | -0.213** | 0.219** | 0.229** | -0.349** | 0.004 | -0.331** |
 R2=0.399 (22)
The authors have declared that no competing interests exist.
| 1 |
|
| 2 |
|
| 3 |
|
| 4 |
|
| 5 |
|
| 6 |
|
| 7 |
|
| 8 |
|
| 9 |
|
| 10 |
|
| 11 |
|
| 12 |
|
| 13 |
|
| 14 |
IPCC, 2007. Climate Change 2007: Impacts, Adaptation, and Vulnerability. New York: Cambridge University Press.
|
| 15 |
|
| 16 |
|
| 17 |
|
| 18 |
|
| 19 |
|
| 20 |
|
| 21 |
|
| 22 |
|
| 23 |
|
| 24 |
|
| 25 |
|
| 26 |
|
| 27 |
|
| 28 |
|
| 29 |
|
| 30 |
|
| 31 |
|
| 32 |
|
| 33 |
|
| 34 |
|
| 35 |
|
| 36 |
|
| 37 |
|
| 38 |
|
| 39 |
|
| 40 |
|
| 41 |
|
| 42 |
|
| 43 |
|
| 44 |
|
| 45 |
|
| 46 |
|
| 47 |
|
| 48 |
|
| 49 |
|
| 50 |
|
/
| 〈 |
|
〉 |