
Journal of Geographical Sciences >
Spatiotemporal measurement of urbanization levels based on multiscale units: A case study of the Bohai Rim Region in China
Author: Zhao Min (1991-), Graduate Student. E-mail: elaine_zhaomin@hotmail.com
*Corresponding author: Cheng Weiming (1973-), Professor, specialized in digital geomorphology and GIS. E-mail: chengwm@lreis.ac.cn
Received date: 2015-08-06
Accepted date: 2015-12-11
Online published: 2016-05-25
Supported by
Surveying and Mapping Geoinformation Nonprofit Specific Project, No.201512033
National Natural Science Foundation of China, No.41171332
Major State Basic Research Development Program of China, No.2015CB954101
National Science Technology Basic Special Project, No.2011FY110400-2
Copyright
Urbanization is a complex process reflecting the growth, formation and development of cities and their systems. Measuring regional urbanization levels within a long time series may ensure healthy and harmonious urban development. Based on DMSP/OLS nighttime light data, a human-computer interactive boundary correction method was used to obtain information about built-up urban areas in the Bohai Rim region from 1992 to 2012. Consequently, a method was proposed and applied to measure urbanization levels using four measurement scale units: administrative division, land-sea location, terrain feature, and geomorphological types. Our conclusions are: 1) The extraction results based on DMSP/OLS nighttime light data showed substantial agreement with those obtained using Landsat TM/ETM+ data on spatial patterns. The overall accuracy was 97.70% on average, with an average Kappa of 0.79, indicating that the results extracted from DMSP/OLS nighttime light data were reliable and could well reflect the actual status of built-up urban areas. 2) Bohai Rim’s urbanization level has increased significantly, demonstrating a high annual growth rate from 1998 to 2006. Areas with high urbanization levels have relocated evidently from capital to coastal cities. 3) The distribution of built-up urban areas showed a certain degree of zonal variation. The urbanization level was negatively correlated with relief amplitude and altitude. A high level of urbanization was found in low altitude platforms and low altitude plains, with a gradual narrowing of the gap between these two geomorphological types. 4) The measurement method presented in this study is fast, convenient, and incorporates multiple perspectives. It would offer various directions for urban construction and provide reference values for measuring national-level urbanization.
Key words: nighttime light data; urbanization level; multiscale units; Bohai Rim
ZHAO Min , *CHENG Weiming , LIU Qiangyi , WANG Nan . Spatiotemporal measurement of urbanization levels based on multiscale units: A case study of the Bohai Rim Region in China[J]. Journal of Geographical Sciences, 2016 , 26(5) : 531 -548 . DOI: 10.1007/s11442-016-1284-1
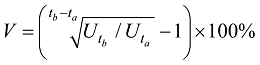
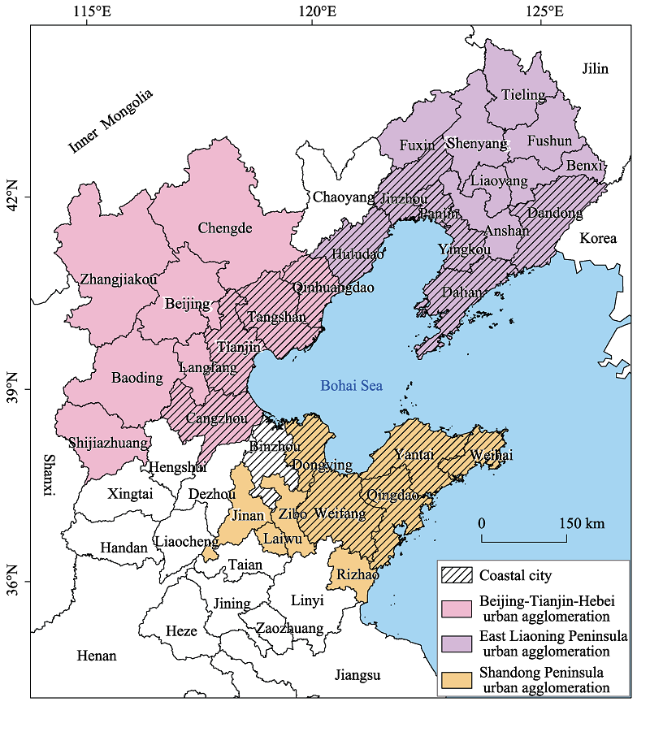
Figure 1 An overview of the Bohai Rim region |
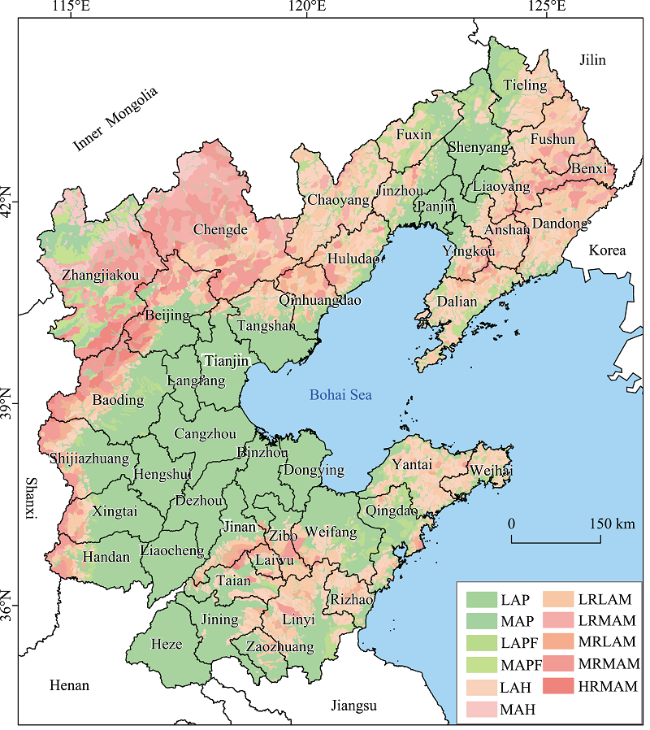
Table 1 Basic geomorphological types in the Bohai Rim |
| Altitude | Low altitude | Middle altitude |
|---|---|---|
| Relief | (< 1000 m) | (1000-3500 m) |
| Plain (< 30 m) | Low altitude plain (LAP) | Middle altitude plain (MAP) |
| Platform (> 30 m) | Low altitude platform (LAPF) | Middle altitude platform (MAPF) |
| Hill (< 200 m) | Low altitude hill (LAH) | Middle altitude hill (MAH) |
| Low relief mountain (200-500 m) | Low relief low altitude mountain (LRLAM) | Low relief middle altitude mountain (LRMAM) |
| Middle relief mountain (500-1000 m) | Middle relief low altitude mountain (MRLAM) | Middle relief middle altitude mountain (MRMAM) |
| High relief mountain (1000-2500 m) | — | High relief middle altitude mountain (HRMAM) |
| Highest relief mountain (> 2500 m) | — | — |
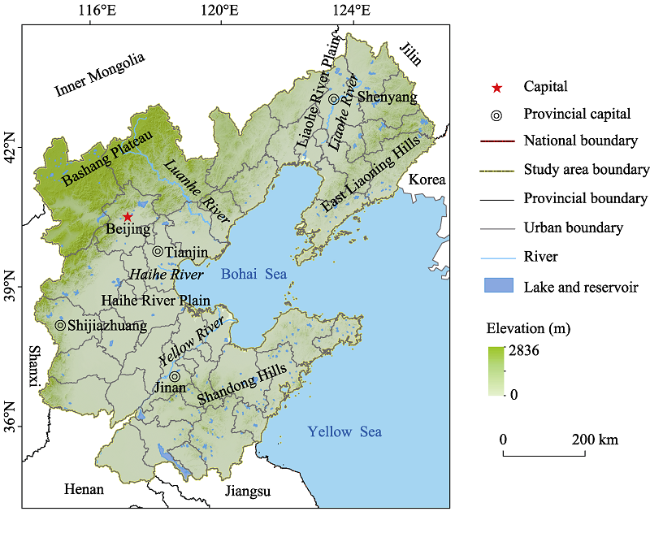
Figure 2 DMSP/OLS images of the Bohai Rim region from 1992 to 2012 |
Figure 3 Urban agglomerations and coastal cities in the Bohai Rim |
Figure 4 Geomorphological types in the Bohai Rim region |
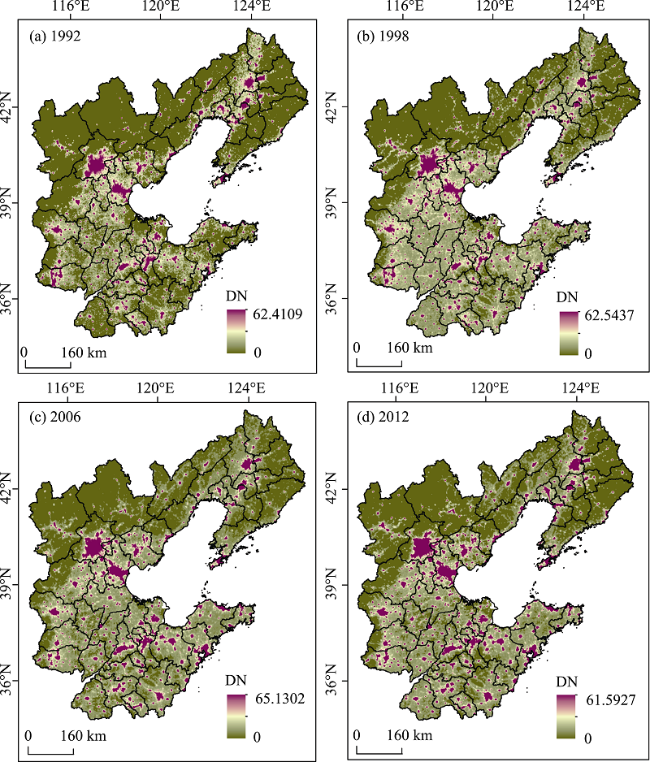
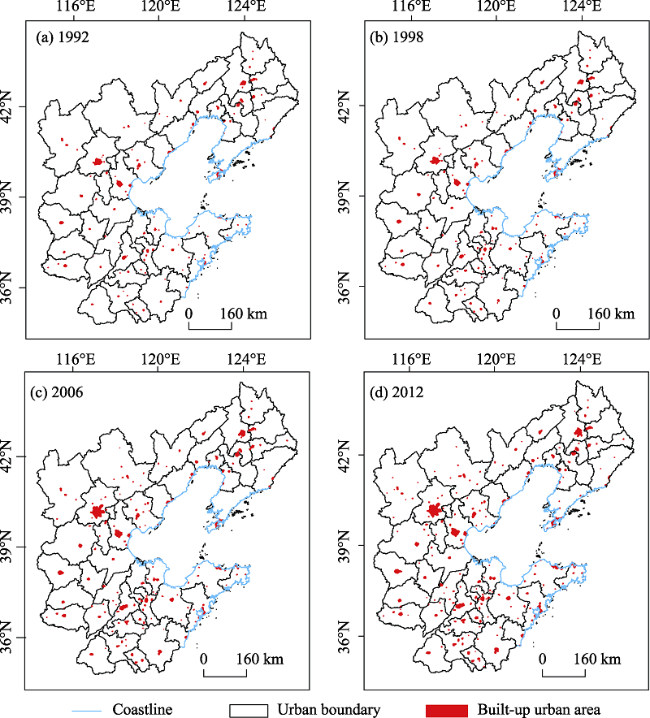
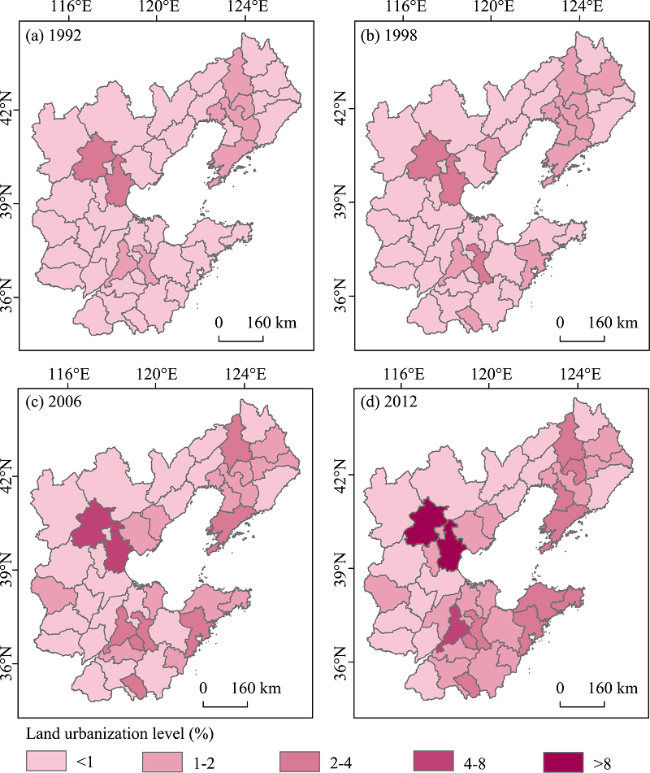
Figure 5 Built-up urban areas of the Bohai Rim derived from DMSP/OLS data for the years 1992, 1998, 2006, and 2012 |
Table 2 Relative errors between the extraction results and the statistical data |
| City | Relative error (%) | City | Relative error (%) | |||||||
|---|---|---|---|---|---|---|---|---|---|---|
| 1992 | 1998 | 2006 | 2012 | 1992 | 1998 | 2006 | 2012 | |||
| Beijing | -1.88 | 3.03 | -1.53 | 3.91 | Liaoning | -0.68 | 2.95 | 0.29 | -0.81 | |
| Tianjin | -1.91 | 2.67 | 2.41 | 3.18 | Panjin | -2.88 | 3.29 | -1.11 | 1.71 | |
| Shijiazhuang | -1.41 | -0.12 | -0.15 | -0.02 | Tieling | -1.09 | 2.81 | -3.82 | 3.77 | |
| Tangshan | -1.18 | 0.00 | -0.94 | 0.15 | Chaoyang | 2.37 | 0.82 | -1.10 | 2.00 | |
| Qinhuangdao | 0.65 | -1.52 | 0.43 | 6.61 | Huludao | 1.57 | -1.23 | 0.83 | -0.81 | |
| Handan | -0.69 | 1.26 | -0.70 | 1.12 | Jinan | -0.60 | -0.24 | -0.09 | 0.00 | |
| Xingtai | 0.38 | 0.18 | 0.17 | 0.82 | Qingdao | -1.90 | 1.40 | 1.06 | 0.39 | |
| Baoding | 1.24 | 0.44 | -0.52 | -0.20 | Zibo | -0.42 | 0.33 | 0.14 | -0.20 | |
| Zhangjiakou | -2.72 | -1.42 | 1.27 | 2.29 | Zaozhuang | 1.58 | 0.66 | 1.58 | 1.29 | |
| Chengde | -0.77 | 2.83 | -1.05 | -0.05 | Dongying | -1.42 | -0.87 | 1.58 | 1.75 | |
| Cangzhou | -2.22 | -2.46 | 0.30 | 1.40 | Yantai | -0.02 | 0.13 | 0.15 | -0.20 | |
| Langfang | -2.24 | -0.07 | -0.41 | 3.68 | Weifang | -0.22 | -0.87 | 0.46 | 0.32 | |
| Hengshui | -0.42 | 1.32 | -0.19 | 3.65 | Jining | 0.83 | -2.69 | 1.99 | -0.34 | |
| Shenyang | -3.27 | -0.17 | -0.17 | 0.07 | Taian | -1.84 | 1.74 | -1.13 | 0.63 | |
| Dalian | -3.21 | -0.79 | -0.30 | 0.06 | Weihai | 0.49 | -2.04 | 0.34 | 0.02 | |
| Anshan | -1.23 | -1.02 | -0.78 | -0.18 | Rizhao | 1.58 | 0.17 | 1.40 | 1.77 | |
| Fushun | 0.22 | 0.35 | 0.65 | 2.63 | Laiwu | -2.90 | -0.94 | 1.04 | 0.69 | |
| Benxi | -1.28 | 1.32 | -0.32 | 2.07 | Linyi | -0.94 | 1.74 | -0.33 | 0.23 | |
| Dandong | -1.44 | -1.23 | -1.92 | 1.81 | Dezhou | -1.10 | -1.72 | 1.86 | 0.47 | |
| Jinzhou | -1.04 | -2.00 | 2.18 | 2.07 | Liaocheng | 2.43 | -0.42 | -1.26 | 1.15 | |
| Yingkou | 1.07 | -0.25 | -0.74 | 2.63 | Binzhou | -0.94 | -2.09 | -1.01 | -0.16 | |
| Fuxin | -1.24 | 0.59 | 2.42 | 1.22 | Heze | 0.17 | -1.97 | -0.60 | 1.36 | |
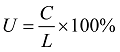
 and
and  are urbanization levels for the year tb and ta, respectively. The time interval during the measurement period was expressed by tb-ta.
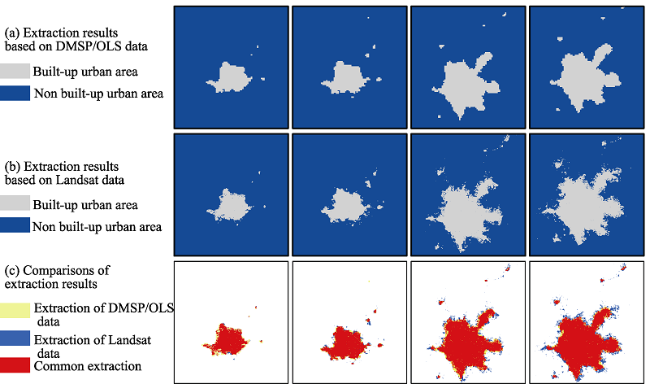
Figure 6 Accuracy assessment of selected urban areas in the Bohai Rim using Landsat TM/ETM+ data |
Table 3 Accuracy assessment of selected urban areas in the Bohai Rim using Landsat TM/ETM+ data |
| Landsat extraction results | Urban (%) | Non-urban (%) | Total (%) | |
|---|---|---|---|---|
| DMSP/OLS extraction results | ||||
| Urban (%) | 2.19 | 0.53 | 2.72 | |
| 1992 | Non-urban (%) | 0.59 | 96.69 | 97.28 |
| Total (%) | 2.78 | 97.22 | 100.00 | |
| OA = 98.88%; Kappa = 0.79 | ||||
| Urban (%) | 2.76 | 0.31 | 3.07 | |
| 1998 | Non-urban (%) | 1.26 | 95.67 | 96.93 |
| Total (%) | 4.02 | 95.98 | 100.00 | |
| OA = 98.43%; Kappa = 0.77 | ||||
| Urban (%) | 6.62 | 0.75 | 7.37 | |
| 2006 | Non-urban (%) | 2.34 | 90.29 | 92.63 |
| Total (%) | 8.96 | 91.04 | 100.00 | |
| OA = 96.91%; Kappa = 0.79 | ||||
| Urban (%) | 7.50 | 0.50 | 8.00 | |
| 2012 | Non-urban (%) | 2.93 | 89.07 | 92.00 |
| Total (%) | 10.43 | 89.57 | 100.00 | |
| OA = 96.57%; Kappa = 0.80 | ||||
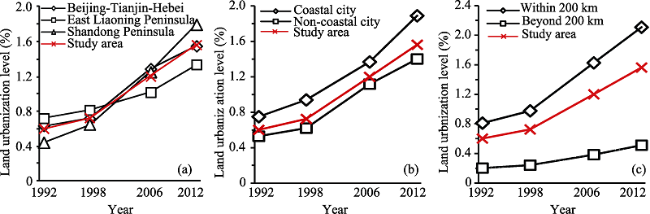
Figure 7 Urbanization levels of different cities in the Bohai Rim region from 1992 to 2012 |
Figure 8 Urbanization levels of different regional units in the Bohai Rim |
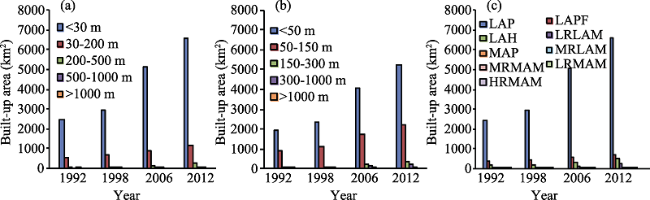
Figure 9 Built-up urban areas of different topographical units in the Bohai Rim from 1992 to 2012 |
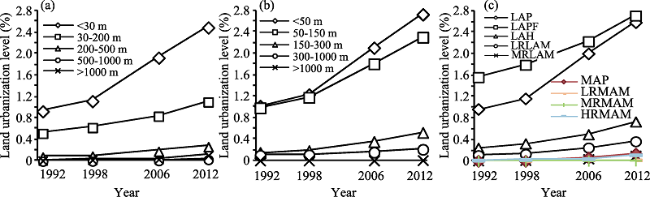
Figure 10 Urbanization levels of different topographical units in the Bohai Rim from 1992 to 2012 |
The authors have declared that no competing interests exist.
| 1 |
|
| 2 |
|
| 3 |
|
| 4 |
|
| 5 |
|
| 6 |
|
| 7 |
|
| 8 |
|
| 9 |
|
| 10 |
|
| 11 |
|
| 12 |
|
| 13 |
|
| 14 |
|
| 15 |
|
| 16 |
|
| 17 |
|
| 18 |
|
| 19 |
|
| 20 |
|
| 21 |
|
| 22 |
|
| 23 |
|
| 24 |
|
| 25 |
|
| 26 |
|
| 27 |
|
| 28 |
|
| 29 |
|
| 30 |
|
| 31 |
|
| 32 |
|
| 33 |
|
| 34 |
|
| 35 |
|
| 36 |
|
| 37 |
|
| 38 |
|
| 39 |
|
| 40 |
|
| 41 |
|
| 42 |
|
| 43 |
|
| 44 |
|
| 45 |
|
| 46 |
|
| 47 |
|
| 48 |
|
| 49 |
|
| 50 |
|
| 51 |
|
| 52 |
|
/
| 〈 |
|
〉 |