Orginal Article

New spatial dimensions of global cityscapes: From reviewing existing concepts to a conceptual spatial approach

  • GEORG Isabel , 1 ,
  • BLASCHKE Thomas 1 ,
  • TAUBENBÖCK Hannes 2
Expand
  • 1. Department of Geoinformatics, University of Salzburg, Salzburg, Austria
  • 2. Earth Observation Center (EOC), Remote Sensing Data Center (DFD), German Aerospace Center (DLR), Oberpfaffenhofen, Germany;

Author: GEORG Isabel,

Received date: 2015-05-12

  Accepted date: 2015-09-08

  Online published: 2016-07-25

Copyright

Journal of Geographical Sciences, All Rights Reserved

Abstract

Current global urbanisation processes are leading to new forms of massive urban constellations. The conceptualisations and classifications of these, however, are often ambiguous, overlap or lag behind in scientific literature. This article examines whether there is a common denominator to define and delimitate-and ultimately map-these new dimensions of cityscapes. In an extensive literature review we analysed and juxtaposed some of the most common concepts such as megacity, megaregion or megalopolis. We observed that many concepts are abstract or unspecific, and for those concepts for which physical parameters exist, the parameters are neither properly defined nor used in standardised ways. While understandably concepts originate from various disciplines, the authors identify a need for more precise definition and use of parameters. We conclude that often, spatial patterns of large urban areas resemble each other considerably but the definitions vary so widely that these differences may surpass any inconsistencies in the spatial delimitation process. In other words, today we have tools such as earth observation data and Geographic Information Systems to parameterise if clear definitions are provided. This appears not to be the case. The limiting factor when delineating large urban areas seems to be a commonly agreed ontology.

Cite this article

GEORG Isabel , BLASCHKE Thomas , TAUBENBÖCK Hannes . New spatial dimensions of global cityscapes: From reviewing existing concepts to a conceptual spatial approach[J]. Journal of Geographical Sciences, 2016 , 26(3) : 355 -380 . DOI: 10.1007/s11442-016-1273-4

1 Introduction

Megacity, Metacity, Megaregion, Megalopolis, Mega-Urban Region: these are only a few terms associated with particular concepts trying to capture the state of the current global urbanization trend. With more people now living in urban than in rural areas (UN-DESA, 2012) and cities taking the brunt of the expected population growth, urban areas will continue to physically change. Urbanization is no longer a regional phenomenon, and international borders are less of an obstacle. As a consequence, established concepts may no longer suffice to describe some of the new urban forms which are more and more massive and complex in morphology, pattern or interrelations, taking on dimensions inconceivable only a few decades ago (e.g., Soja and Kanai, 2007; UN-DESA, 2011, Taubenböck et al., 2014). Over time, new concepts-such as metacity, mega-urban region or megapolitan-have been introduced (e.g., Lang and Dhavale, 2005; UN-Habitat, 2009; Morrison Institute, 2008) to describe these new configurations of urbanization.
There is, thus, an abundance of terms describing urban areas of various types, shapes and sizes (see also Taylor and Lang, 2004), some of which are very similar and show considerable overlap: as Brenner (2013) puts it, “definitional contours have become unmanageably slippery”. It seems, however, that some terms lack a proper, universal definition, while others have changed and adapted over time: for example, a megacity is now commonly defined as having at least 10 million people (e.g., Kraas, 2010), whereas earlier definitions were using lower thresholds (e.g., Schwentker, 2006).
Since no unambiguous classification criteria and indicators for a distinction between city and surrounding areas exist, the first and foremost challenge in defining urban areas is their delimitation. Size, population, density, statistical boundaries or economic activities are often used to describe cities but all these indicators fall short of morphologically separating urban from non-urban areas. For example, China’s population register differs from that of most other countries, and statistical boundaries fail to delimit urban expansion. Different authors, countries and statistics use different approaches (Goldstein, 1994), which can even change over time (Brenner and Schmid, 2014), and data sources-such as the reference area for population information-are often not published, thus hampering global comparisons (Bronger and Trettin, 2011).
Although the problem of delimiting urban areas applies to all scales-from small towns to massive constellations-this study focuses on large and very large urban systems on a global scale. In this paper, we aim at providing an outline of the most prevalent of those concepts in order to suggest a common spatial understanding of these heterogeneous units. This is achieved through reviewing the existing literature and summarizing the main identifiers in a descriptive way. Over 500 journal papers, book chapters and conference papers were scanned for their descriptions and definition of concepts describing large urban areas. We then combine these concepts from a morphological (as opposed to functional) perspective, thus reducing the complexity of the multidimensional concepts from various scientific disciplines to one perspective showing their distinct differences and similarities. Our breaking down of various concepts of large urban areas to their spatial features attempts to reduce ambiguities and to increase data consistency and transferability. This will contribute to overcome the lack of robust comparisons of urban areas worldwide observed by OECD (2012).
Despite the fact that we predominantly follow a structural approach, we need to acknowledge that cities are functionally connected through economic, cultural, institutional or political ties. To express these interrelations, information gained from various sources can be used: population/statistical/economic/etc. data. Recent studies have also used airline, mobile phone and collective sensing data (e.g., Derudder and Witlox, 2005; Ratti et al., 2006; Blaschke et al., 2011). We are aware that these functional or relational perspectives play a significant role in shaping cities and regions. However, data are not available globally and consistently since the thresholds or delimitations used by different institutions are not homogenous, adding even more complexity to a uniform delineation of urban areas worldwide. This article therefore aims at identifying physical criteria to describe urban areas universally. A common ground between the various concepts, from a spatial perspective, has not been established in urban research. These physical properties, however, are core characteristics of urban areas and can be objectively measured using a globally consistent data source: remote sensing imagery can provide such a harmonious dataset.
Based on our literature review of the most common large urban concepts and their definition, this article focuses on the question: Can we identify physically measureable parameters for the plethora of concepts describing large urban areas which can serve to establish a spatially consistent approach? Our aims are, thus,
● to bring clarity to the plethora of concepts (functional, physical or process-based) which are often used synonymously,
● to reduce the complexity and multidimensionality of these concepts to a clearly identifiable and delimitable form from a physical perspective,
● to produce a schematic spatial juxtaposition of concepts for large urban areas, and
● to provide a result which is applicable on a global scale, not limited to case studies and which can be verified using one consistent global dataset without ancillary data.
These aims are intended to form a conceptual backbone for new urban research, which can be triggered by the recent and new availability of globally consistent geodata derived from new remote sensing products with a geometric resolution of 15 m and less (see section 4). With these products, physically consistent classifications of urban landscapes are available which allow for a consistent identification and spatial delimitation of the spatial concepts described in this paper.

2 Conceptualization of large urban areas

Urban form has long been the subject of interest in urban theory. In essence, it describes the physical built environment. A particular focus for many researchers is on sustainable urban form (e.g. Jenks et al., 2004; Breheny, 1992): Frey (1999), for example, describes different city models such as core, satellite, star, galaxy, linear or polycentric net and evaluates their performance based on sustainability characteristics (e.g., viability of public transport, compactness, population density). Tsai (2005) identifies four dimensions of urban form: size (population), population density, distribution and clustering. Other studies show how urban form affects travel behavior (e.g., Handy, 1996; Boarnet and Crane, 2001), transportation (Banister et al., 1997), liveability (Aziz and Hadi, 2007) and health (Frank and Engelke, 2001).
Some of the concepts described below are derived from descriptions of individual or a small number of examples. This is the case for Megalopolis, Metroplex, Urban Corridor, Conurbation or Megapolitan. Others have been established because of the growing number of areas that surpassed existing thresholds, as is the case for mega- and metacity.
In this paper we outline the most common concepts for (very) large urban areas without going into detail regarding the above-mentioned forms and models. In line with Liu et al.’s (2014) suggestion of a hierarchy of definitions for “urban”, we include built-up areas as well as vegetation, barren land and water bodies in our “urban areas”, but unlike Liu, we do not take into account administrative boundaries (which have their own inherent delineation issues). We describe concepts for large urban areas based on an extensive literature as a basis for narrowing them down to their physical parameters which show differences and similarities in their shape and extent.

2.1 Urban form: Monocentric vs polycentric

Early urban studies were dominated by the prevailing monocentric urban form (Figure 2a) which is generally associated with a centralized and continuous settlement (Tsai, 2005). Among the most important theories are (e.g., Pacione, 2009):
● von Thünen’s 1826 ring model in an isolated state,
● Burgess’s 1923 concentric circles of land use zones around the center,
● Christaller’s 1933 central place theory of hierarchically organized centers,
● Hoyt’s 1939 sector model which assumes an expansion of cities along transport lines,
● Alonso’s 1964 monocentric city model which he adapted from von Thünen’s rings.
Over time, theories developed on the basis of a city as “one place” increasingly failed to adequately describe urban morphologies. Few of today’s large cities (such as Dublin or Helsinki) (EC, 1999; Davoudi, 2006) have mainly monocentric characteristics; the model, on this scale, is therefore more or less outdated.
A polycentric spatial organization (Figures 2b and 2c) was first noted in the first half of the 20th century, but initially did not receive much attention (Yue et al., 2010). The main contributors to the development of polycentric forms were technological advances. Diesel trains, electric streetcars and-later-subways and automobiles replaced earlier forms of transport which were limited to walking or horse-drawn carriages. Although production had moved out of the core, monocentric forms prevailed until after World War II because of the dependency on central harbors and rail terminals (Anas et al., 1997). Over the last decades, the polycentricity concept gained more influence but still lacks a proper definition (Curtis, 2006; Green, 2007). Dieleman and Faludi (1998) use the term polynucleated metropolitan region to describe a single functional unit formed by a number of cities in close proximity. Pacione (2009) calls it a “system of cities”, while Lambooy (1998) suggests a “loosely connected set of cities” with a name of its own (e.g. Randstad, Rhine-Ruhr). In Van Houtum and Lagendijk’s (2001) view, polycentric urban regions (PURs) are “spatially closely connected and strategically planned regions, with historically and politically distinct cities, without a clear hierarchy ranking between them, and separated by open spaces”. Other definitions specify that the number of cities is at least two or three (Van Eyck, 2005 in Jagadisan and Fookes, 2009; Davoudi, 2006) and there is no dominant city in terms of population, workforce, or firms. While usually the rule of thumb of a one-hour journey (Geddes, 1915) is applied for the maximum distance between the cities, Bailey and Turok (2001) challenge this assumption since defining polycentricity is also a matter of scale.
The issue of scale has also been addressed by Davoudi (2003) who separates three different spatial levels: intra-urban, inter-urban and inter-regional. The first level on which the concept of polycentricity was applied was the intra-urban scale (meso level) (Davoudi, 2006). At this scale, polycentricity is formed by sprawl and sub-centers (Curtis, 2006). These sub-centers are either merged existing centers or new Edge Cities (Garreau, 1991): new centers away from the original Central Business Districts (CBDs) that developed when first people, then shopping malls and offices moved out to form new urban centers with a high share of office and retail space, located close to main highway intersections, usually on land which was either pasture or thinly populated in 1960. As to the transition between polycentric and sprawling cities, Ewing (1997) remarks that there is only a thin line between multiple centers and scattered development. A main difference is the relatively high degree of organized growth in polycentric regions vs. the rather unorganized dispersed sprawl.
The inter-urban scale (macro level) is characterized by a high degree of interaction between conurbations, which have generally developed through merging of expanding settlements such as Randstad, RhineRuhr or Southern California (cf. Kloosterman and Musterd, 2001; Pacione, 2009).
On Davoudi’s inter-regional scale (mega level)-the scale of interest for this study -, the concept of urban corridors is used synonymously to “megalopolis” (see below) and “extended metropolitan region” (Ginsburg et al., 1991; Firman and Dharmapatni, 2007) and includes regions such as the European Blue Banana or East Asia’s BESETO (Choe, 1998). Davoudi himself (2006) applies these terms to an area in the UK dubbed “The Northern Way” and includes eight city regions within the Liverpool-Hull and Newcastle-Sheffield axes. Figure 1 illustrates these three scales using the example of a relatively small metropolitan region, Munich (Germany).
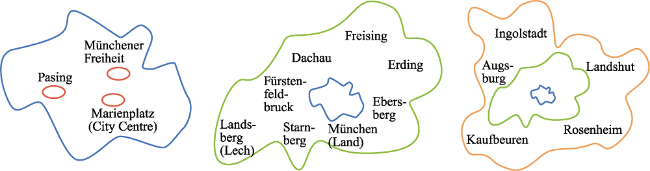
Figure 1 Different scales for Munich: City (with sub-centres), Region, Metropolitan Region
Inter-urban and inter-regional patterns have also been described as polynucleated urban fields (Dieleman and Faludi, 1998; Champion, 2001).

2.2 Concepts describing large urban areas

This section reviews and describes different concepts intended for a classification of different large urban areas. While this list is not exhaustive, we believe that it includes the most established terms. Most of these concepts are well recognized in urban geography, sociology or policy, but not all of them are clearly defined. Since there is a considerable overlap between some of the terms, a particular region usually fits into several categories.
Our aim is to find a common denominator to limit those concepts to just their morphological features, leaving aside relational and functional aspects. From this purely physical perspective-which is our point of interest -, the differences between them are minimal.
The concepts are structured as follows: starting with megacities as “one” place, we then describe different functional urban types before dealing with large regions which, over time, potentially develop towards massive mega-urban regions or urban corridors.
2.2.1 Single cities: Megacity, metacity, metropolis
Megacities are typically defined using quantitative criteria, most commonly a minimum population of ten million (Kraas, 2010; Kraas and Mertins, 2008; UN-Habitat, 2006); other dimensions-four, five or eight million (Schwentker, 2006; Gilbert, 1998; Chen and Heligman, 1994)-are less common or obsolete. A minimum population density of 2000 inhabitants per km² is also frequently assumed in order to exclude urban agglomerations such as Randstad/Holland or RhineRuhr/Germany (Kraas and Nitschke, 2008; Bronger and Trettin, 2011). Bourdeau-Lepage and Huriot (2006) use the term Large Urban Agglomerations (LUAs) for cities over five million inhabitants (the 2001 threshold in the United Nations’ megacity definition) and “Megacities proper” above ten million (the UN’s 2004 threshold). Figures like these, however, are often criticized as arbitrary (Gilbert, 1998). Furthermore, population data (e.g. due to artificial administrative borders) and their accuracy are not consistent globally and therefore inadequate for a harmonized definition of urban areas on a world level.
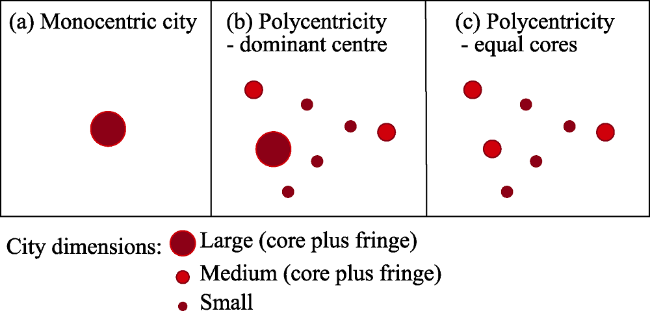
Figure 2 Mono- and polycentric urban forms
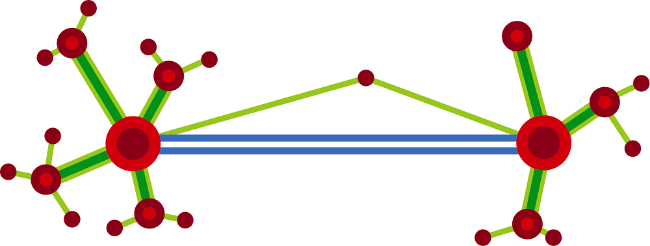
Figure 2a shows an ideal abstract model of a megacity with a single center plus the surrounding, less densely populated, fringe area. Today’s megacities, however, are generally polycentric in nature at an intra-urban or inter-urban scale due to their growth and incorporation of previously independent cities. Still, megacities are frequently perceived as one city due to the place name they carry. While the general development pattern reflects regional differences (Taubenböck et al., 2012), megacities have “more in common with each other than with their rural hinterlands whether they are located in developed or developing countries” (Laquian, 1994). This includes their effect on global change (environmental, socio- economic, political), ecological impacts and increasing informality (Kraas, 2007).
Around the year 1900, only 15 cities had more than one million inhabitants (Masini, 1994), a figure which has since increased to roughly 500 (Brinkhoff, 2013). By 1950, the only megacities (above the eight million people threshold) were London and New York (UN-DESA, 2011; Chen and Heligman, 1994). Today, there are around 30 cities with over ten million people. UN-Habitat (2006) have introduced a new term, metacities, to describe polycentric cities larger than 20 million people, generally governed by several administrative bodies. Among these are Delhi, Mexico City, New York-Newark and Shanghai (UN-DESA, 2012), with Greater Tokyo as the first city which passed the 20 million mark already half a century ago. The metacity concept has been further elaborated by McGrath and Pickett (2011) who take into account socio-ecological as well as architectural aspects.
A metropolis, too, is usually an individual city. It is significant in a region in terms of size and importance-a significance which is not quantified in measurable terms. A metropolis can also be part of a metropolitan area or polycentric (mega-)region (see below) (Hall and Pain, 2006).
A large number of cities fulfill additional roles which cannot be detected from their physical layout since they represent a city’s function. These functional roles have more recently been described, classified and ranked using qualitative measures such as political and professional activities, banking/insurance, trade, or arts/culture. The most significant functional city types are World City (Hall, 1966, 1998) and Global City (Sassen, 1991; Bourdeau-Lepage and Huriot, 2006), often used synonymously (Kunzmann, 1998). New York, London or Tokyo are generally placed at the top of rankings such as Friedmann (1986), Beaverstock, Smith and Taylor (1999) or A.T. Kearney (Hales and Mendoza Peña, 2012). Further functional types include Primate City (Jefferson, 1939), Informational City (Castells, 1989), Network City (Castells, 1989, 2002) or Creative Network City (Batten, 1995). More (not only functional) types are listed in Taylor and Lang (2014) who question the need for more terminology. On a larger scale, the term World City Region has been applied to areas such as London or Istanbul (Kunzmann, 1998) to recognize both their local and regional dimension. Similarly, Scott (2000, 2001) proposes the name Global City-Region for around 300 world city regions with strong inter- and extra-regional economic and political ties. For our further analysis, however, these functional urban types are not taken into account.
2.2.2 Fuzzy concepts: Ribbon development, urban sprawl
Although ribbon development and urban sprawl can be regarded as processes, they are commonly used to describe urban forms in a current state (Figure 4) and are thus included in this paper. Ribbon Development denotes the dispersed but continuous expansion of settlements along infrastructure lines (highway, railway). This is generally multi-functional (industry, trade, residential, theme parks), often unplanned (Kraas, 2010), and is found on all scales from small villages to big cities. On a large scale, ribbon development can lead to the formation of extended metropolitan regions (EMRs) (Ginsburg, 1991) or mega-urban regions (MURs) (McGee and Robinson, 1995; Laquian, 2005; Douglass, 2000). To meet the requirements of increased vehicle traffic, highway systems lead to the evolving of corridors (see below) which are more than 100 km away from the metropolitan centers (McGee and Robinson, 1995 in Douglass, 2000), such as mega-city-centered Bangkok or Shanghai-Nanjing-Hangzhou-Suzhou, where urban nodes form a regional network (Pacione, 2009). Travel time from the main center out can easily exceed an hour.
Similarly vague is urban sprawl, which, according to Tsai (2005) and Siedentop (2005), does not have a universally accepted definition and can describe land use patterns, expansion processes, and causes as well as consequences of land use practices (Galster et al., 2001). As a settlement pattern, it shows a low population density (one- or two-storey residential buildings, one family per unit), high car ownership rate (and limited travel routes), strip commercial areas and industrial parks, lack of a thriving center, high energy and land consumption, and scattered or leapfrog development on the fringe of a city with progressive filling of the spaces in between (Delgado et al., 2006; Ewing et al., 2002; Burchell et al., 1998). For sprawling office development, Lang (2003) suggests the term Edgeless City. Whereas ribbon development is aligned to traffic infrastructure, sprawl is not constrained to existing major road frameworks despite the significance of individual car travel. Nechyba and Walsh (2004) investigate causes and consequences of sprawl whose dynamic nature is emphasized by Hasse and Lathrop (2003). Glaeser and Kahn (2003) argue that sprawl is a ubiquitous, dominant form of urban living. Tsai (2005) recognizes that, like other urban forms, sprawl has different meanings and effects on human activity at different levels: metropolitan area, city, or neighborhood. Bhatta (2010), Taubenböck et al. (2009) and Sudhira et al. (2004, 2007) examine sprawl using remote sensing data and GIS methods; Torrens (2008) presents varying characterizations and develops a toolkit to measure and simulate sprawl.
Originally a North American phenomenon, urban sprawl is now recognized around the world. Siedentop (2005), for example, describes indicators of sprawl on a macro and micro level (land use patterns vs. land use changes) for the Eastern part of Germany. Among several EU-funded investigations (Champion, 2011) is ESPON which identifies four profiles of sprawl (Bengs and Schmidt-Thomé, 2006): sprawl as emergent polycentric region with secondary urban centers, as scattered suburb with infill of low-density housing between urban centers or transport corridors, as peripheral fringes inhabited by lower-income population (old housing peripheries or new speculative developments), and as commercial strips and business centers (generating more traffic and further unplanned development). Angel (2012) warns that lessons learned from sprawl in the USA and Europe should not necessarily be applied to developing countries.
2.2.3 Conurbation/city region, urban agglomeration, metropolitan area
Conurbations, urban agglomerations and metropolitan areas denote similar constructs; they are merely used by different institutions or countries (GBHGISP, 2004): the United Nations use the term urban agglomeration (UN-DESA, 2011); the USA refers to metropolitan areas and the UK to conurbations.
To describe regions such as Greater London, Lancashire (“Lancaston”) or the Midlands (“Midlanton”), Geddes (1915) coined the term conurbation or city region. Neighboring towns in these conurbations are linked by tramways and streets (Figure 4), while open spaces in between are disappearing. Population patterns are changing with a tendency towards social grouping, and new forms of political governance are developing. According to Geddes (1915), towns can be very different from a social, historical and structural point of view but still be part of the same conurbation if they are within an hour’s travel from each other, like Glasgow and Edinburgh (“Clyde-Forth”). Thus, conurbations are usually polycentric but interlinked (transportation, labor). Fawcett (1932), who identifies 37 conurbations, defines them-in a more general sense but spatially more delineated-as continuous built-up areas and urban parks (“dwellings, factories and other buildings, harbor and docks”) which are not separated by rural land. According to Castells (2002), a conurbation is no longer defined by physical proximity of places but has become a global concept based on on- and off-line networks. Soja and Kanai (2007) define city regions as areas with more than one million people. UN-DESA (2011b) describe urban agglomerations as cities with a suburban fringe not necessarily within the administrative city boundaries.
In the USA, metropolitan statistical areas (MSAs) are high-density urbanized areas with strong economic ties, a minimum population of 50,000 and a high level of in- and out-commuting. In 2013, new standards were released to classify metropolitan, micropolitan and combined statistical areas (MSA, µSA, CSA) and the terms standard metropolitan statistical area (SMSA) and primary metropolitan statistical area (PMSA) were dropped (OMB, 2013).
In a stricter sense, conurbations are continuous urban forms, while metropolitan areas may contain non-urban zones. According to this, Geddes’ Glasgow-Edinburgh conurbation would have to be re-labeled metropolitan area. Agglomerations, for Dijkstra (2009), “by definition include the commuter belt around a city”.
2.2.4 Functional urban region/area (FUR/FUA), urban field, city system, urban network, larger urban zone (LUZ)
A Functional Urban Region (FUR) (Hall, 2009a), while not universally defined, is a “travel-to-work area” with one or more municipalities at the core plus the surrounding fringe areas (Antikainen, 2005). The OECD (2012) describes Functional Urban Areas as one or several cities and their commuting zones. The commuter threshold varies between 10%-20% in Europe (Eurostat, 2013) and 15%-25% in the USA and Canada (OECD, 2012).
A FUR roughly matches Friedmann and Miller’s (1965) definition of an Urban Field: an interdependent area centered around one core (minimum population: 300,000) and extending out into the periphery up to two hours’ (about 100 miles) driving away (Figure 4)-Friedmann and Miller’s maximum for a daily commute. This dimension corresponds to Davoudi’s (2003, 2006) inter-regional scale (see above). The idea is similar to Gottmann’s megalopolis (see below) and was developed as a contrast to Christaller's 1933 central places theory. It was subsequently expanded into two further concepts: City Systems, which emphasize the interdependency of cities in a region, and Urban Networks (Van Houtum and Lagendijk, 2001) which are a cooperation of cities that used to be independent and even complementary. Two essential elements of urban networks are a connecting transport corridor and ICT infrastructure (Van Houtum and Lagendijk, 2001)-elements which are also essential for Castells (1989, 2002).
The OECD (Piacentini and Rosina, 2012) develop a method to define functional urban areas in 29 OECD countries by identifying urban cores, connecting non-contiguous areas and identifying hinterlands using economic, demographic and environmental data from different sources; a method the authors themselves recognize as arbitrary (OECD, 2012). The result is a list of 1179 mono- and polycentric functional urban areas as diverse as Vienna, Paris, Santiago de Chile, Vancouver, Seoul or Los Angeles. According to this OECD definition, metropolitan areas have a population between 500,000 and 1.5 million, large metropolitan areas more than 1.5 million. However, as shown above, on a global scale, the use of metropolitan area is not homogeneous.
For cities throughout Europe, the European Union’s Eurostat agency has carried out several Urban Audits since 2003 to collect harmonized, comparable statistics and indicators (EC, 2004). The Urban Audit uses administrative units, NUTS 3 regions (ESPON, 2011; Dijkstra, 2009). Based on these data, an Urban Atlas was put together showing comparable land use and land cover data for Larger Urban Zones (LUZs). The information on population figures is inconclusive depending on the source: EEA (2013) specifies areas with over 100,000 inhabitants as LUAs, while the EC (2004) and Dijkstra (2009) indicate 250,000. The LUZ is an approximation of the Functional Urban Area.
2.2.5 Metropolitan agglomeration, metropolitan region, metroplex
Bronger and Trettin (2011) identify Metropolitan Agglomeration (MA) as core plus the surrounding urbanized area, and Metropolitan Region (MR) as MA plus the less urbanized fringe. Castells (2002) provisionally uses MR for massive, functionally interrelated urban constellations (e.g., Randstad, Pearl River Delta). MRs are not necessarily continuous but rather a combination of built-up (core as well as periphery) and rural and include models such as Edge Cities and conurbations. An essential feature is their connectedness through high-speed links on both physical (especially rail; Figure 4) and virtual level (telecommunications). Metropolitan areas are important from an economic, cultural, institutional and political point of view and are challenging to govern because of they transgress administrative boundaries.
In Germany, 11 MRs have been defined by the Conference of Ministers for Spatial Planning (Ministerkonferenz für Raumordnung) as driving forces for economic, social and cultural development (IKM, 2010). Their delimitation, however, does not follow a uniform method and thus, differences in population, density, distance and share of rural areas can be observed. Selection criteria are mainly based on metropolitan functions. With RhineRuhr as an exception, the regions are relatively sparsely populated compared to national and international averages.
The term Metroplex was originally applied to the Dallas-Fort Worth area in Texas and describes a big, extended metropolitan region with two (or more) spatially distinct key anchor urban cores (Lang and Nelson, 2007). It has since been used for Germany’s Ruhr area, Randstad, Detroit-Windsor (USA/Canada), or Guangzhou-Shenzhen-Hong Kong-Macau.
Although a number of examples describe these “metropolitan” concepts, there is no delimitation in terms of their spatial dimension.
2.2.6 Mega-city region (MCR), megalopolis, megaregion, megapolitan, mega-urban region, mega-metropolitan region
According to Hall and Pain (2006), a Mega-City Region (MCR) consists of 10-50 separate but networked cities with one or more main city and thriving on an economic division of labor. Halbert et al. (2006) also describe global MCRs as “a cluster of towns and cities that is increasingly functionally interconnected across geographical space through virtual communications and travel”. Although they resemble other polycentric concepts such as megalopolis (Hall and Pain, 2006), megapolitan areas (Lang and Dhavale, 2005) or Functional Urban Regions (Hall, 2009a), the fact that a megacity has to be part of an MCR sets them apart (Figure 4). Soja and Kanai (2007) set the minimum population threshold for a MCR to ten million and observe a trend towards an “extended regional urbanization”. None of the descriptions of MCRs give a dimension that can be expressed in time or distance.
In the EU-funded project POLYNET, functional relations and information flows were analyzed for eight polycentric mega-city regions in North-West Europe (e.g., RhineRuhr, South-East England, Randstad). In their project summary, Hall and Pain (2006) describe MCRs as building on Castell’s “space of flows” and on Scott’s (2001) global city region while at the same time more interconnected and complex than Gottmann’s megalopolis.
Although megalopolis is commonly attributed to Gottmann (1957; 1961), the term has been in use since the 1820s and also appears in essays from Geddes and Mumford (Baigent, 2004). A megalopolis has at least 25 million people, is polynuclear with each city as an individual urban system but at the same time cohesive from a communication and transport perspective (Gottmann, 1976; Pacione, 2009). Gottmann’s example is the area now known as Bos-Wash (with a population of some 30 million in 1950). He describes the Great Lakes Megalopolis from Quebec to Milwaukee (via Toronto, Detroit, Chicago) in a similar way and acknowledges the existence of a further four such areas (Gottmann, 1976). He emphasizes that a megalopolis has to be separated from other large urban networks by enough less urbanized space that is substantially different from the metropolitan region. Florida (2006) prepared a draft mapping of what he calls the “New Megalopolises” and names them the most significant territorial connected units of today’s global economy. On a macro-regional level he defines North-East Asia, Western Europe and North America. 29 Sub-regions form these zones (Florida, 2006, Soja and Kanai, 2007).
Based on Gottmann’s model region, the Regional Plan Association (2006) elaborates the Megaregions concept by specifying five relationship groups: environment, infrastructure, economy, settlement patterns and land use, and culture/history. The more of these relationships apply, the more cohesive a megaregion is.
Virginia Tech’s Metropolitan Institute defines a new urban unit, Megapolitan, as “two or more metropolitan areas with anchor principal cities between 50 and 200 miles apart” (MI, 2008). Their size is larger than a metropolitan area but smaller than a megaregion (Lang and Nelson, 2007) and only regions with a projected population of at least five million by 2040 are considered. Criteria are compactness (they “can easily be traversed by car in a day, round-trip”; Lang and Nelson, 2007), connectedness (high percentage of commuters, goods and service flows, cultural entity, functional networks), complexity (megapolitans are formed of metropolitan and micropolitan areas and themselves, together with other metros, form megaregions), and corridors (often linear and polycentric) (Lang and Dhavale, 2005; MI, 2008).
In the Institute’s report (Lang and Dhavale, 2005), ten megapolitan areas are identified which, although different approaches are used (Ross, 2008), roughly equal the Regional Plan Association (RPA)’s megaregions. For the RPA, megaregions are “large, connected networks of metropolitan areas that maintain environmental, cultural, and functional linkages (Lang and Nelson, 2007). With around 200 million people, they account for over two thirds of the USA population (Lang and Dhavale, 2005). A later article (Lang and Nelson, 2007) refines the definition to (subsets of) megaregions: 20 (emerging) megapolitans form the ten megaregions in the USA. Between one and four megapolitan areas make up a megaregion; their total population is assessed at close to 300 million. The form of these megapolitans ranges from linear “corridor” to “galactic” (Lang and Dhavale, 2005). This draws upon an earlier definition of a galactic metropolis by Lewis (1983) as fragmented, multi-nodal and with urban centers, sub-centers and satellites of varying sizes and densities. The linear shape is also recognized by Neuman (2000) who describes Gottmann’s megalopolis as a “linear corridor multi-metropolitan region”. Banerjee (2009) arranges the RPA’s ten megaregions along two axes: galaxy/corridor and mosaic/network (the latter of which are not mutually exclusive). Of the more corridor-like megaregions, Northern California and the Gulf Coast are mosaicked while the Arizona Sun Corridor, Cascadia and the Texas Triangle show well-developed networks.
In a worldwide rather than North American context, the term mega-region is used in a slightly different way. We therefore adopt a hyphenated spelling to mark this difference. UN-Habitat (2008a) identify mega-regions as one of three types of new urban configurations, along with urban corridors and city-regions, and characterize them as having larger populations than any mega- or meta-city, with an “enormous” economic output. Examples are China’s Pearl River Delta (around 120 million people), Japan’s Tokyo-Nagoya-Osaka- Kyoto-Kobe mega-region (a prospected 60 million people by 2015), Brazil’s São Paulo to Rio de Janeiro stretch (43 million people). The UN report states that mega-regions are most common in North America and Europe but emphasizes that Asia and other parts of the world are growing quickly; including African regional urban systems such as the Nile valley or Ibadan-Lagos-Accra which all have several cities of over a million people (UN-Habitat, 2008b).
Florida et al. (2007), who use night-time lights for a global study of mega-regions,consequently describe them as contiguously lighted areas in those datasets, or, more pragmatically, as “very large area across which one could walk, carrying only money, without getting hungry”. From an economical point of view, mega-regions amass talent, productivity, innovation and markets and allow labor and capital to be redistributed at low cost (Florida etal., 2007). Similarly, Yusuf (2007) points out economic advantages such as scale, talented workforce, or lower resource utilization of mega-regions, while acknowledging downsides such as congestion, living expenses, environmental pollution and fiscal, juridical or governmental challenges. Castells (2002) recognizes the existence of mega-metropolitan regions which, for him, are “without a name, without a culture, and without institutions” (Castells, 2002). Taubenböck and Wiesner (2015) measure the increasing settlement continuity between cities within megaregions and compare spatial patterns across the globe.
Several authors have observed a distinct mega-urban development pattern in Asia. This is mainly due to the much faster population growth and expansion of urban areas compared to Europe and North America. Laquian (2011), for example, specifies three types:
a) Urban corridors (e.g., Tokyo-Kyoto, Beijing-Qinhuangdao, Mumbai-Pune) (see 2.2.7).
b) Mega-city dominated city regions (Metro Manila, Jabotabek, Greater Bangkok, Dhaka).
c) Sub-national city clusters (Guangzhou-Shenzhen-Hong Kong; the Surabaya-Surakarta- Semarang-Yogyakarta-Malang region in Indonesia; or Daegu-Ulsan-Busan-Guangjiu in South Korea).
McGee (1991) introduces the term desakota to describe the rural-urban transition where metropolises expand in the form of ribbon development but traditional farmland is left standing (Kraas and Nitschke, 2008). McGee (1991) divides desakota regions into three types: desakota type I regions are a mix of small farm plots, industrial and residential areas with a mainly non-agricultural economy (Japan, South Korea). Type II regions show a dynamic economic growth with improved transport facilities and infrastructure (Nanjing-Shanghai-Hangzhou, Jabotabek). Jogjakarta or Kerala belong to the desakota type III regions with slow economic growth and low productivity.
2.2.7 Urban corridor
Whebell (1969) first introduced the concept of urban corridors using Southern Ontario (Canada)-Windsor, London, Toronto to North Bay/Ottawa respectively (about 700-800 km in length)-as phenotype region. However, the concept has received very little scientific attention. In Whebell’s view, a corridor is a “linear pattern of major towns joined by highly developed ‘bundles’ of transport routes”. Development happens in continuous, cumulative stages from initial occupancy to metropolitanism through transport improvements (rail, early automobile, rapid transit). Surface characteristics, settlement behavior, time, direction and distance are important elements of the model (Whebell, 1969).
The most distinguishing element of a corridor, in Trip’s (2003) view, is its linear structure. Batten (1995) illustrates corridor cities as linearly linked main nodes with further branches and nodes of different size and connectedness (Figure 3).
Li and Cao (2005) identify some basic aspects of corridors such as a high population density, existence of large cities or city clusters, high land use heterogeneity and a well-developed transport infrastructure. A critical feature of any corridor, according to Chapman et al. (2003) is that of “connection”, i.e. the “free and easy flow or transmission of people, goods or information” (Chapman et al., 2003). Continuous settlement is not necessarily essential along corridors, rather it is a possible result of their growth (UN-Habitat, 2010). Several authors compare urban corridors to Gottmann’s Bos-Wash megalopolis (e.g., Neuman, 2000; Laquian, 2011). Other massive urban corridors include the “Blue Banana” (Hospers, 2002; Brunet, 1989 in Hall, 2009b), a highly urbanized and densely populated area that reaches right across Western Europe from Birmingham to Milan, covering around 2000 km in length, and BESETO, stretching 1500 km from Beijing to Tokyo via Pyongyang and Seoul (Choe, 1996 and 1998; Lo and Marcotullio, 2001).

3 Main results: combination of concepts

In section 1 we described concepts describing large urban areas, from single (mega-) cities to massive polycentric regions. We showed that for a number of these, there is no universal acceptance of indicators for a classification and delimitation. A consistent global classification for most concepts is therefore not possible. Table 1 summarizes these concepts and their characteristics for a better overview.
While these areas differ in many ways, especially in their functional characteristics, we maintain that from a spatial point of view, several constellations show considerable overlap. We therefore sketched the physical layouts with the parameters identified as defining features in the literature review (Figure 4).
These parameters can basically be narrowed down to two main aspects:
● spatial clustering of settlements, with a larger, spatially distinct central settlement and smaller fringe settlements, separated by varying degrees of open space
● infrastructure lines in the form of surface transport (road or rail).
The clustered settlement pattern can be derived from the following features defined in the literature review: “scattered” and “leapfrog” (see urban sprawl), “open space” (metropolitan areas), “core/fringe” (e.g., FUR, metropolitan agglomeration, Metroplex). A certain “continuity” (conurbation), however, is also important since it delimits the extent of a large urban area. The only definition which gives a range of the number of cities included in a region is Hall and Pain’s (2006) MCR with 10-50 cities.
As becomes obvious, the general patterns show great similarity with regard to the distribution of places. The infrastructure network, too, is similar. Only ribbon development and metropolitan regions show a distinct road layout, while most of the others are connected in a similar way. Conurbations, in their original definition, are connected by tramways-presumably, FURs and MCRs have similar transport methods although these are not explicitly part of the definition. Likewise, metropolitan regions are defined by a fast transport network but basically all of today’s large urban constellations have major highways and rail lines. For some of the constellations, travel time gives an indication of their extent but the definitions generally only give vague suggestions. Only for megapolitans and urban corridors, a rough distance in miles or kilometers is provided. The concepts are grouped as detailed in Table 2.
Where an extent is given in travel time, Geddes’ (1915) and Friedmann and Miller’s (1965) one- to two-hour maximum for a daily commute applies. This means that ribbon development, urban sprawl, and the concepts summarized under “conurbation” and “FUR” all have a more or less identical physical extent.
Table 1 Summary of concepts, their characteristics, examples and key literature
Concept Examples from
literature
Definition criteria identified in literature
(only where applicable)
Key literature used in
this review
Population Typical
size
Number of cities or centricity Physical parameters Functional
features
Megacity Los Angeles, Moscow, London, Istanbul, Rio de Janeiro, Paris > 10 million 1 Kraas & Mertins, 2008; Fuchs et al., 1994; Gilbert, 1998
Metacity Greater Tokyo, Delhi, New York-Newark, Shanghai > 20 million 1 UN-Habitat, 2006; McGrath & Pickett, 2011
World/Global
City
New York, Tokyo, Frankfurt, Zurich 1 Company headquarters, financial institutions, cultural and political status Sassen, 1991; Hall, 1966 & 1998; Friedmann, 1986; GaWC, 2010
Informational/
Network City
Randstad, San Francisco 1 ICT infrastructure Castells, 1989 & 2002; Batten, 1995
World City
Region
London, Istanbul, Randstad, RhineRuhr (> 1 million) Mono- or polycentric Similar to World City but with internal connections Kunzmann, 1998; Scott, 2000; Bronger & Trettin, 2011
Ribbon
development
Bangkok, Hangzhou Up to 100 km away from center 1 Settlements along infrastructure line Multifunctional settlement pattern (residential, industrial, trade) Kraas, 2010; Douglass, 2000
Urban sprawl Atlanta, Houston, Melbourne 1 Scattered and leapfrog development on urban fringe Tsai, 2005; Siedentop, 2005; Glaeser & Kahn, 2003
Conurbation/
City region
Greater London,
Lancashire,
Midlands, Greater Paris
> 1 million One hour travel time Polycentric Transport infrastructure, few open spaces between cities Commuting
patterns
Geddes, 1915; Fawcett, 1932; Soja & Kanai, 2007
Metropolitan area (MA) Calgary, Helsinki, Rome, Phoenix > 500,000 OECD, 2012
Functional Urban Region/Area (FUR/FUA) Vancouver, Vienna, Paris, Dublin, Madrid Commuting distance Mono- or polycentric Core plus smaller fringe towns Interdependency, commuting patterns Hall, 2009; OECD, 2012; Piacentini & Rosina, 2012
Urban Field Miami, San Francisco,
Denver, Chicago, Boston
Core population: > 300,000 Commuting distance Mono- or polycentric Interdependency, commuting patterns Friedmann & Miller, 1965
City systems,
urban networks
Randstad, Kansai Transport infrastructure Interdependency; ICT infrastructure Van Houtum & Lagendijk, 2001
Metropolitan/
Urban
agglomeration
Ho Chi Minh City, Mumbai, Buenos Aires, Istanbul, New York, London Core plus urbanized fringe Bronger & Trettin, 2011
Metropolitan
region
Randstad, Pearl River Delta, RhineRuhr Polycentric Core plus less urbanized fringe; transport infrastructure ICT infrastructure Bronger & Trettin, 2011; Castells, 2002
Metroplex Dallas-Fort Worth, Randstad, Detroit-Windsor 2 or more Spatially distinct urban cores Lang & Nelson, 2007
Mega-City
Region (MCR)
RhineRuhr, Randstad, South-East England Main city: > 10 million 10-50 ITC infrastructure, commuting patterns Hall & Pain, 2006; Halbert, Pain & Thierstein, 2006; Soja & Kanai, 2007
Megalopolis Bos-Wash, Great Lakes (Quebec-Milwaukee) > 25 million Polycentric Transport infrastructure Gottmann, 1957 & 1976
Megapolitan Midwest/Great Lakes, Piedmont Atlantic, Southern California Anchor cities: 50-200 miles apart 2 or more Formed of metropolitan areas ITC infrastructure, commuting patterns Lang & Dhavale, 2003; Morrison Institute, 2008
Megaregion
(USA)
Midwest/Great Lakes, Piedmont Atlantic, Southern California, Texas Triangle Polycentric Formed of megapolitans Lang & Dhavale, 2003; Morrison Institute, 2008; Ross, 2008; Banerjee, 2009
Mega-region Pearl River Delta, Tokyo-Kobe, São Paulo-Rio de Janeiro; Nile Valley Larger than mega- and metacities Polycentric UN-Habitat, 2008; Florida, Gulden & Mellander, 2007
Urban corridor Bos-Wash, Blue Banana, BESETO Several 100 km long Polycentric Linear pattern, transport routes, city clusters ICT infrastructure Whebell, 1989; Li & Cao, 2005; Chapman et al., 2003; Choe, 1996
In a next step, we overlaid the concepts from Figure 4 with their different transportation networks (Figure 5, left). We then removed all infrastructure lines (Figure 5, right) and were left with a cluster of different-sized cities which could represent any of the concepts described above (with the exception of ribbon development which only covers part of the cluster). This shows the physical similarity of most of the concepts without fully taking into account their scale. The general clustering of a number of cities is the same for all concepts described.
Table 2 Grouping of the different concepts
Type Shape Extent in
travel time
Extent in
distance
Number of
major cities
Infrastructure
Megacity Point 1 Undefined
Metacity
Metropolis
Ribbon Development Linear Up to >1 hr 1 Undefined
Urban Sprawl Galactic <1 to >2 hr 1 Undefined
Conurbation Galactic 1 hr ≥2 Road, tram
Metropolitan Area
Urban Agglomeration
Functional Urban Region (FUR) Galactic 2 hr ≥1 Undefined
Urban Field
City System
Urban Network
Larger Urban Zone (LUZ)
Mega-City Region (MCR) Galactic ≥2 and up to 50 Undefined
Megalopolis
Mega-(Urban) Region
Mega-Metropolitan Region
Megapolitan Galactic 50-200 mi ≥2 Undefined
Metropolitan Agglomeration Galactic ≥2 High-speed road/rail
Metropolitan Region
Metroplex
Urban Corridor Linear >1500 km High-speed road/rail
This overlay enables us to apply the physical parameters for any large urban area globally. A main limitation of the revised concepts is their lack of transferability: with some of them limited to case studies (e.g., megalopolis, Metroplex, conurbation), a global identification is hard to achieve. Our focus on the spatial pattern allows us to categorize large urban areas on a worldwide scale without having to consider administrative boundaries or functional criteria which are not measurable consistently.
Finally, we illustrate the spatial relationships of the reviewed concepts by comparing the dimensions provided in the definitions and using the spatial layout presented in Figure 4 (Figure 6). We did this in order to visualize physical overlap and dimensions of the different terms. For the sake of legibility, the legend only shows some terms out of each box in Figure 4. The result is a spatial impression of the concepts in relation to each other. It provides an estimate of a concept’s scale relative to other concepts. The infrastructure network is not further classified.
Based on existing definitions, urban corridors form the largest constellations by far. Their dimension exceeds that of other large urban areas-all of them are surpassed in size in comparison (this is not to say though that all of them actually occur within an urban corridor).
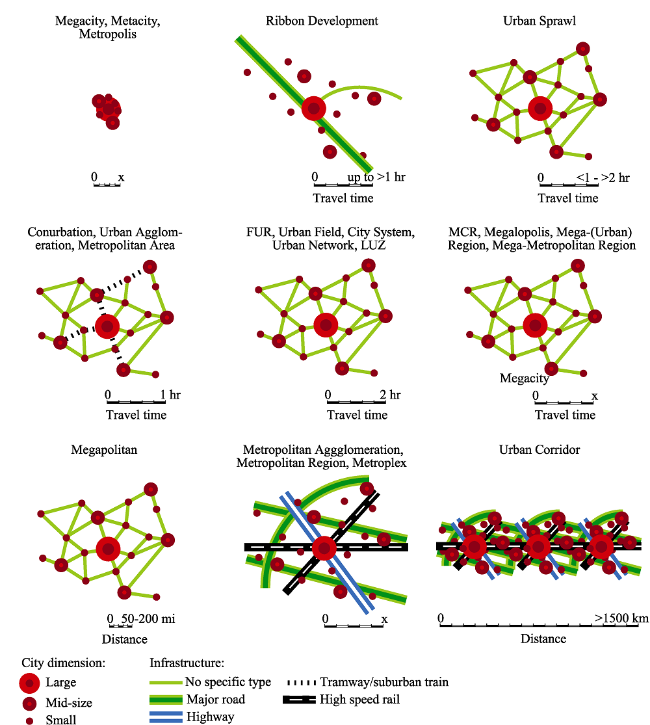
Figure 4 Comparison of spatial footprints of different concepts
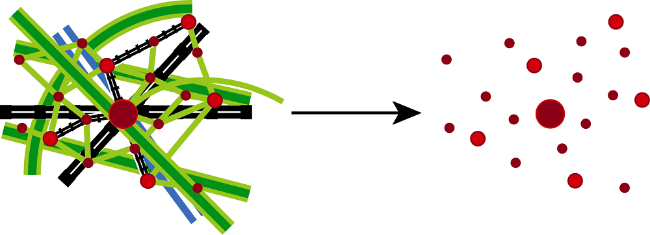
Figure 5 Concepts overlaid and with their infrastructure network removed
Figure 6 Spatial juxtaposition of different concepts for large urban areas
Figure 6 shows the approximate spatial relation of different concepts to each other while using the spatial clustering from Figures 4 and 5. The infrastructure network is not further differentiated but generally shows some form of fast connection (road or rail). Urban sprawl, ribbon development, conurbations and metropolitan areas have a similar extent in terms of travel time (roughly one hour from core to edge)-smaller than FURs and MCRs. Two or more of the previous concepts combined can form megapolitans, which are only exceeded in size by megaregions and urban corridors. Most of the concepts are rather compact in shape, only ribbon development and urban corridors show a linear layout.
We are aware that our juxtaposition can only be an approximation of the scale and extent of large urban areas but our results show the physical parallels between different concepts. The massive dimension of urban corridors reflects the current urbanization trend-growing urban population, changing physical shape of urban areas -, and if this trend continues, we expect the number of urban corridors and other large urban areas to increase.
These results are intended to serve as a guideline for delineating large urban areas using spatial parameters. This will contribute towards providing clear definitions for further analysis, and also towards a consistent understanding of what constitutes large urban areas from a spatial point of view.

4 Conclusions and outlook

In this paper, we examined the question whether we can turn the conglomeration of concepts for large urban areas into one spatially consistent approach. In order to answer this, we reviewed various urban concepts based on the existing literature. These included mega- and metacity, ribbon development, urban sprawl, conurbation, metropolitan area, megaregion, mega-urban region and urban corridor. Our aim was to consolidate them on the level of spatial features. Functional aspects, although fundamental to some concepts, have not been taken into account. While we are aware that functional issues are significant as well, we argue that the spatial dimension is the only measure which can be observed globally, consistently and temporally. It can thus provide valuable information on the shape of urban areas as well as changes in this shape at different points in time, however we acknowledge that in order to understand dynamics and trends of large urban areas, other dimensions such as economic, population, etc. data are required: spatial patterns help to describe urban areas but they cannot explain them.
The concepts and related spatial features vary in size, shape and function. Some of them do not have a universal definition and show varying degrees of overlap. Cities or regions around the world therefore usually fit into several categories-a general rule of thumb is that the larger an area, the harder it is to describe accurately because of the growing number of factors involved.
The two main physical characteristics for any concept describing large urban areas are the settlement clustering and the connecting transport infrastructure. While this may seem an obvious result-after all, expansion of and connection between settlements are only possible through transport infrastructure lines -, the actual similarity is remarkable. While the physical layout of a large urban area is the most visible aspect, this layout is generally not further defined in the reviewed concepts.
Most of the concepts above do not have an explicit scale. Some rough guidelines, such as one or two hours’ travel (Geddes, 1915; Friedmann and Miller, 1965) or “can […] be traversed in one day, round-trip” (Lang and Nelson, 2007), give an indication of an area’s size. The Morrison Institute (2008) provides one of the few absolute distance measures between cities: 50-200 miles apart. Some authors give figures on a minimum population size (e.g., Friedmann and Wolff, 1982; Bourdeau-Lepage and Huriot, 2006; UN-Habitat, 2006): thus, population seems to play a more important role in defining urban concepts than spatial extent. Our spatial juxtaposition (see Figure 6) allows us to group some of them according to their physical form in order to achieve one of the aims of our study, which is to reduce the complexity and multidimensionality of concepts and making them more clearly delimitable from a physical perspective.
We conclude that there are two major problems which hinder a widely agreed nomenclature. Firstly, since most concepts disregard a clear scale definition, meaningful upper and lower bounds of scales are typically missing. Some of the consequences of scale have been demonstrated by Liu et al. (2014): For worldwide studies, the amount of ‘urban areas’ ranges from 0.45% to 3% depending on the definition of ‘urban’-from ‘impervious surface area’ (finest granularity used) to ‘built-up area’ to administrative boundaries definitions. This leads to a second conclusion: The interoperability is hampered by a lack of a commonly agreed ontology of urban areas. Commonly agreed land cover classes, taxonomies like for species and clear standards are needed. Feranec et al. (2014) establish that correct awareness of the similarity between classes from different nomenclatures is the prerequisite for their semantic interoperability. Therefore, many of the concepts reviewed in this article that have their origins in planning or social sciences may continue to lack interoperability and transferability as long as a common ontology-vulgo: a meta-language-is not achieved.
Despite of this lack of clearly identifiable and measurable features we maintain that spatially, urban concepts show great similarities: the general clustering of populated and less populated areas, evident through built-up and non-built-up land surface, is the key indicator. In Figure 6 we showed the (scale-independent) spatial footprint of selected types of urban areas as identified through existing definitions. By overlaying these concepts, we found that the general clustering of large urban areas is more or less the same, especially if the connecting transport infrastructure is taken out.
For a systematic classification of large urban areas, a consistent dataset needs to be globally available. For functional indicators, this is not given; a spatial approach for global delimitation, on the other hand, is feasible due to the availability of consistent datasets, particularly through satellite imagery. However, mapping of urban areas on a global scale is a challenging task: the areas of interest are relatively small compared to the total land surface, the land cover is everything but homogeneous, and the term “urban” is interpreted in different ways (Schneider et al., 2010). The outcome of global urban maps is dependent on the input data: census data return the population distribution, while remote sensing-based night-time lights (used for example by Small et al., 2005, 2011; Elvidge et al., 2001) reflect population (Sutton et al., 2001), built-up density and/or economic activity (Schneider et al., 2010; Elvidge et al., 2007; Doll et al., 2006). Taking into account those limitations, Florida et al. (2007) use a global night-time dataset to estimate the population and, with additional estimates of national gross domestic product, the economic activity of mega-regions. In a series of papers, Potere and Schneider (2007, 2009) and Schneider et al. (2010) examine different maps of global urban areas for accuracy and disclosed a high degree of variance, unveiling a lack of a universal taxonomy and global assessment of urban areas (Potere and Schneider, 2007). Liu et al. (2014) propose a nested hierarchy of “impervious surface area”, “built-up area” and “urban area” to overcome some of the limitations of land use estimates.
Recent global urban mapping projects use geometric resolutions of 15m and less (compared to 300m and more for earlier studies such as Bontemps, 2009; Bartholomé and Belward, 2005; Loveland, 2000; Hansen, 2000). Examples include the global urban footprint product developed at the German Aerospace Center (DLR) from TerraSAR-X/TanDEM-X radar data (Esch et al., 2012), the Joint Research Center (JRC)’s “Global Human Settlement Layer” (GHSL) (Pesaresi et al., 2013), or maps based on ASTER satellite data combined with existing urban area maps (Miyazaki et al., 2012).
The physical conceptualization of urban concepts examined in this paper allows us to analyze global datasets consistently, for which the above-mentioned remote sensing products provide a new geometric precision. Using both a consistent dataset with a worldwide coverage as well as consistent parameters contributes towards a global comparison with simple but objective indicators. Our literature review therefore serves as a step towards reducing the complexity of describing large urban areas and advancing our knowledge of their physical characteristics in order to assist informed decision making for planning and resource management.

The authors have declared that no competing interests exist.

[1]
Anas A, Arnott R, Small K A, 1997. Urban Spatial Structure. The University of California Transportation Center, Working Paper No. 357. Berkeley.

[2]
Angel S, 2012. Planet of Cities. Cambridge MA: Lincoln Institute of Land Policy.

[3]
Antikainen J, 2005. The concept of functional urban area. Findings on the ESPON project 1.1.1.Informationen zur Raumentwicklung, 7: 447-456.

[4]
Aziz N A, Hadi A S, 2007. Linking urban form to a liveable city.Malaysian Journal of Environmental Management, 8: 87-107.This paper intends to show the contribution and relationship of urban form to a liveable city, as many researchers pose the urban form as one of the factors that can worsen or improve the sustainability of the city. The paper will begin by exploring into the theoretical characteristics of the urban form at the macro and micro scale. Urban form models that match the Malaysian cities鈥 urban form are illustrated in this paper with the idea of giving a larger context of the living ecology for Malaysian communities. There are two types of cities, one that grows in an ad-hoc manner, and the other is being shaped by planners. This paper however, focuses only on a planned city that is the core city for Shah Alam. Consequently, this paper touches briefly on the liveable city concept which is currently being debated among the researchers as a more practical way of looking into the sustainable city issues. The liveable city framework for the city of Shah Alam is discussed and some preliminary findings are offered at the end of the paper

[5]
Baigent E, 2004. Patrick Geddes, Lewis Mumford and Jean Gottmann: Divisions over ‘megalopolis’.Progress in Human Geography, 28(6): 687-700.The term‘ megalopolis’, meaning a large city, was in use in the general press by the 1820s: its occurrence in the scholarly press largely reflects use in the twentieth century by Patrick Geddes and Lewis Mumford to denote an overlarge city doomed to destruction, and by Jean Gottmann to denote a large and highly connected urban region, notably that in the northeastern USA. Gottmann’s definition dominates dictionaries of geography, but is ignored outside the discipline. The Oxford English Dictionary is urged to recognize Gottmann’s (and hence geographers’) usage: compilers of geographical dictionaries are urged to revise their definitions.

DOI

[6]
Bailey N, Turok I, 2001. Central Scotland as a polycentric urban region: Useful planning concept or chimera?Urban Studies, 38(4): 697-715.Interest in the concept of the polycentric urban region (PUR) has been growing among planners and policy-makers in north-west Europe. PURs are believed to offer a means of promoting regional economic competitiveness while safeguarding environmental objectives. This paper interrogates the concept and examines its relevance to the central Scotland region. Central Scotland has a polycentric physical form, but the evidence that it is a single functional region in economic terms is much more mixed. The dominant pattern of interactions suggests two separate city-regions, although links between adjoining areas seem to be growing. Despite considerable rivalry between public organisations across the region, there appears to be increasing support for the development of some kind of strategic spatial framework to inform key investment decisions and to promote closer collaboration. This would not necessarily be based on the PUR concept, since it is too broadly specified at present to guide the kinds of decision that need to be made. Further work is needed to elaborate and refine the concept.

DOI

[7]
Banerjee T, 2009. Megaregions or megasprawls? Issues of density, urban design, and quality growth. In: Ross C L (ed.). Megaregions: Planning for Global Competitiveness. Washington, Covelon, London: Island Press, 83-106.

[8]
Banister D, Watson S, Wood C, 1997. Sustainable cities: Transport, energy, and urban form. Environment and Planning B: Planning and Design, 24(1): 125-143.This paper extends the debate over the ideal of the sustainable city, particularly as it relates to transport, by providing empirical evidence, from five case-study cities in the United Kingdom and one in the Netherlands on the links between urban form and energy consumption in transport. It also links energy use measures to the physical, economic, and social structure of the city to determine whether there are significant relationships. Energy-use measures combine all the characteristics of travel (mode, distance, and frequency), together with occupancy, to give a new set of composite measures of travel. The conclusions reached are mixed in that significant relationships have been found, principally between energy use in transport and physical characteristics of the city, such as density, size, and amount of open space. But comparability problems make it difficult to establish definitive relationships.

DOI

[9]
Bartholomé E, Belward A S, 2005. GLC2000: A new approach to global land cover mapping from Earth observation data.International Journal of Remote Sensing, 26(9): 1959-1977.A new global land cover database for the year 2000 (GLC2000) has been produced by an international partnership of 30 research groups coordinated by the European Commission's Joint Research Centre. The database contains two levels of land cover information鈥攄etailed, regionally optimized land cover legends for each continent and a less thematically detailed global legend that harmonizes regional legends into one consistent product. The land cover maps are all based on daily data from the VEGETATION sensor on-board SPOT 4, though mapping of some regions involved use of data from other Earth observing sensors to resolve specific issues. Detailed legend definition, image classification and map quality assurance were carried out region by region. The global product was made through aggregation of these. The database is designed to serve users from science programmes, policy makers, environmental convention secretariats, non-governmental organizations and development-aid projects. The regional and global data are available free of charge for all non-commercial applications from http://www.gvm.jrc.it/glc2000.

DOI

[10]
Batten D F, 1995. Network cities: Creative urban agglomerations for the 21st century.Urban Studies, 32: 313-327.The global economy is nurturing an innovative class of polycentric urban configurations: network cities. A network city evolves when two or more previously independent cities, potentially complementary in function, strive to cooperate and achieve significant scope economies aided by fast and reliable corridors of transport and communications infrastructure. Creative network cities place a higher priority on knowledge-based activities like research, education and the creative arts. The cooperative mechanisms may resemble those of inter-firm networks in the sense that each urban player stands to benefit from the synergies of interactive growth via reciprocity, knowledge exchange and unexpected creativity. Two case studies are discussed briefly-Randstad Holland and Kansai, Japan. Since much of their future dynamism may rely upon transnational human resources, it is foreseen that more network cities will transcend national borders during the next millennium.

DOI

[11]
Beaverstock J V, Smith R G, Taylor P J, 1999. A roster of world cities.Cities, 16(6): 445-458.Although there is a general consensus on which are the leading world cities, there is no agreed-upon roster covering world cities below the highest level. This paper reports the construction of an inventory of world cities based upon their level of advanced producer services. Global service centres are identified and graded for accountancy, advertising, banking/finance and law. Aggregating these results produces a roster of 55 world cities at three levels: 10 Alpha world cities, 10 Beta world cities and 35 Gamma world cities. These are found to be largely geographically concentrated in three “globalization arenas”, northern America, western Europe and Pacific Asia.

DOI

[12]
Bengs C, Schmidt-Thomé K, 2006. Urban-rural relations in Europe. EPSON Final Report.ABSTRACT Research 2002-2005 / Coordinator Bengs C. / Financed by the ESPON 2006 Programme

[13]
Bhatta B, 2010. Analysis of Urban Growth and Sprawl from Remote Sensing Data. Heidelberg: Springer.Analysis of data in research is a process of inspecting, cleaning/correcting, transforming, classifying, and modelling the data with the goal of highlighting useful information, suggesting conclusions, and supporting decision making. It also refers to the process of evaluating data using analytical and logical reasoning to examine each component of the data. Data from various sources are gathered, reviewed, and then analyzed to form some sort of finding or conclusion. Remote sensing data analysis has multiple facets and approaches, encompassing diverse techniques under a variety of classes and domains. Further, being an emerging field, new tools and techniques are always being proposed and appreciated in the remote sensing community. It is beyond the scope of this book to document each of them. Therefore, this chapter will not attempt to describe the tools and techniques; rather it will be emphasized on the general discussion of remote sensing data analysis. This chapter is based on concepts rather than tools and techniques; constraints and freedoms will also be addressed in context.

DOI

[14]
Blaschke T, Hay G J, Weng Qet al., 2011. Collective sensing: Integrating geospatial technologies to understand urban systems: An overview.Remote Sensing, 3(8): 1743-1776.Not Available

DOI

[15]
Boarnet M G, Crane R, 2001.Travel by Design: The Influence of Urban Form on Travel. Oxford: Oxford University Press.Combining urban design and transportation planning with the idea that neighborhoods and cities can be designed to change travel behavior is a popular idea. The goal is to reduce car use and increase the quality of life in the neighborhood. This book looks into the premise of urban design and transportation planning. It seeks to answer three questions: Can it work, Will it be put into practice, and Is it a good idea? The book is divided into four parts: an introduction, a section on travel behavior, a section on the supply of place, and a section on the role of travel by design. Topics include traffic, urban form, travel, demand for travel, a study of travel behavior, neighborhood supply, mathematical models for trip generation, transit-oriented planning, and a case study of planning.

[16]
Bontemps S, Defourny P, Bogaert E Vet al., 2011. GLOBCOVER 2009: Products Description and Validation Report. Université Catholique de Louvain (UCL) & European Space Agency (ESA).JRC.H.3-Global environement monitoring

[17]
Bourdeau-Lepage L, Huriot J M, 2006. Megacities vs Global Cities. Development and Institutions. ERSA conference papers. European Regional Science Association.In a preceding paper (Louvain Economic Review), we define city globalization as the process by which a city gains the ability to coordinate complex economic activities at a global scale. The resulting 09銇04global cities09 carry out the functions of design, decision and control in the global economy. However, the logic of city globalization is not universal. It does not apply equally to different regions in the world. A large part of the less developed countries (LDCs) remains at the margin, despite the dramatic growth of its major cities, especially the 09銇04large urban agglomerations09 and the 09銇04megacities09 as defined by the United Nations. In 2003, 15 of the world09銇64s 20 megacities were located in LDCs. We stress the differentiation of the city globalization process and the possible divergence between city size and city globalization, i.e. between global cities and mega-cities. We propose some avenues for explaining this divergence. We use both statistical and theoretical arguments based on the economic theory of agglomeration (Fujita and Thisse), the theory of world cities (Friedman, Sassen, Taylor and GaWC) and the theory of institutions (North). In a large part of the literature, it is considered that a large city can more probably become a global city than a smaller one, because city size favors the diversity of activities, a high level of human capital, of communication equipments, and ability to benefit from increasing returns. However, this logic is not universal. City size is neither a necessary nor a sufficient condition of city globalization. It appears that the level of development of the country gives only a partial explanation of the divergence. The ability to coordinate complex activities at a global scale, which characterize global cities, depends closely on the nature and the quality of institutions. The bad quality of governance, the low level of social connectivity (Sassen), the high level of corruption, are important obstacles to city globalization in LDCs. The existence of an important informal sector can explain that cities in LDCs beyond the size compatible with their economic resources and with their ability to generate externalities favorable to city globalization

[18]
Breheny M J, 1992. Sustainable Development and Urban Form. London: Pion.1992, volume 2The environment is now very close to the top of the political agenda in many countries. There is a widespread consensus that progress towards 'sustainable development' is essential. However, there is considerable debate as to what this term means. One particular part of this debate concerns the role of cities as major consumers of energy and generators of pollution. The question is: can cities be planned in such a way as to be more energy-efficient? The expert contributions to this book address this question. The papers range from the general to the particular. The first papers are concerned with fundamental issues of definition and of political constraints on action in cities. A group of papers then addresses urban sustainability from a strategic planning perspective; focusing on the prospects for using changes to transport and urban form to reduce energy consumption. A critical look is taken at the apparently more advanced thinking, in the Netherlands. These papers are followed by more localised considerations of property markets, the use of GIS, combined heat and power, and city transport. Together the papers provide a rich set of different perspectives鈥攅mpirical, theoretical, and practicalThe environment is now very close to the top of the political agenda in many countries. There is a widespread consensus that progress towards 'sustainable development' is essential. However, there is considerable debate as to what this term means. One particular part of this debate concerns the role of cities as major consumers of energy and generators of pollution. The question is: can cities be planned in such a way as to be more energy-efficient? The expert contributions to this book address this question. The papers range from the general to the particular. The first papers are concerned with fundamental issues of definition and of political constraints on action in cities. A group of papers then addresses urban sustainability from a strategic planning perspective; focusing on the prospects for using changes to transport and urban form to reduce energy consumption. A critical look is taken at the apparently more advanced thinking, in the Netherlands. These papers are followed by more localised considerations of property markets, the use of GIS, combined heat and power, and city transport. Together the papers provide a rich set of different perspectives - empirical, theoretical, and practical - on an important but hitherto under-researched subject.

[19]
Brinkhoff T, (accessed 16. Apr. 2015.

[20]
Brenner N, 2013. Theses on urbanization.Public Culture, 25(1): 85-114.

DOI

[21]
Brenner N, Schmid C, 2014. The ‘Urban Age’ in question.International Journal of Urban and Regional Research, 38(3): 731-755.Foreboding declarations about contemporary urban trends pervade early twenty-first century academic, political and journalistic discourse. Among the most widely recited is the claim that we now live in an 鈥榰rban age鈥 because, for the first time in human history, more than half the world's population today purportedly lives within cities. Across otherwise diverse discursive, ideological and locational contexts, the urban age thesis has become a form of doxic common sense around which questions regarding the contemporary global urban condition are framed. This article argues that, despite its long history and its increasingly widespread influence, the urban age thesis is a flawed basis on which to conceptualize world urbanization patterns: it is empirically untenable (a statistical artifact) and theoretically incoherent (a chaotic conception). This critique is framed against the background of postwar attempts to measure the world's urban population, the main methodological and theoretical conundrums of which remain fundamentally unresolved in early twenty-first century urban age discourse. The article concludes by outlining a series of methodological perspectives for an alternative understanding of the contemporary global urban condition.

DOI

[22]
Bronger D, Trettin L, 2011. Megastädte, Global Cities HEUTE: das Zeitalter Asiens?-Asien-Wirtschaft und Entwicklung, Bd. 5. Berlin, Münster.

[23]
Castells M, 1989. The Informational City. Information, Technology, Economic Restructuring and the Urban-Regional Process. Oxford: Wiley.05e od La Question urbaine, s katero si je Manuel Castells (od leta 1979 profesor planiranja na University of California, Berkeley) pridobil sloves enega najbolj prodornih teoretikov na podro00ju dru06beno-prostorskega raziskovanja, je branje njegovih novih del (in teh ni malo

DOI

[24]
Castells M, 2002. Local and global: Cities in the network society.Tijdschrift Voor Economische en Sociale Geografie, 93(5): 548-558.By Manuel Castells; Local and Global: Cities in the Network Society

DOI

[25]
Champion A G, 2001. A changing demographic regime and evolving poly centric urban regions: Consequences for the size, composition and distribution of city populations.Urban Studies, 38(4): 657-677.The demographic regime in western Europe and many other countries of the developed world is now very different from that of 3007070540 years ago and is continuing to evolve. At the same time, settlement systems have been altering significantly in spatial structure, notably in terms of the emergence of polycentric urban configurations. This paper examines the nature of these two sets of changes and searches for linkages between them. First, it outlines the main features of the changing demographic regime. Secondly, it attempts to identify what constitutes 'polycentric urban regions' as opposed to traditional monocentric structures. Thirdly, it assesses how recent demographic developments relate to traditional urban structures and discusses whether they are more conformable with polycentric urban forms.

DOI

[26]
Champion A, 2011. The changing nature of urban and rural areas in the United Kingdom and other European countries. In: UN-DESA, 2011a. Population Distribution, Urbanization, Internal Migration and Development: An International Perspective. United Nations Publication, 144-160.As required by UN Contract No. 15365, this paper is on “The changing nature of urban and rural areas in the United Kingdom and in other European countries.” It is to “discuss the main changes in the urban and rural areas of Europe.” In a separate communication, it has been indicated that the topic should be read to include a discussion of new forms of urbanization. This is a broad field, in theory covering the 47 countries that the UN classifies as Europe in its World Urbanization Prospects reports and not being restricted in time frame. Clearly, a degree of selectivity is needed, so as to avoid superficiality of treatment in the limited space available as well as to best fit the expertise of the consultant. The main focus selected for this paper is on urban/rural patterns of population change and migration since the 1980s. Particular attention is given to the results of new research on the UK, but the main findings of selected studies of other parts of Europe are also reviewed and discussed. The paper begins by putting the European scene into global context using the UN’s data.

[27]
Chapman D, Pratt D, Larkham Pet al., 2003. Concepts and definitions of corridors: Evidence from England’s Midlands.Journal of Transport Geography, 11(3): 179-191.No abstract provided.

DOI

[28]
Chen N Y, Heligman L, 1994. Growth of the world’s megalopolises. In: Fuchs R J, Brennan E, Chamie J et al. (eds.). Mega-city Growth and the Future. Tokyo, New York, Paris: United Nations University Press, 17-31.

[29]
Choe S C, 1996. The evolving urban system in North-East Asia. In: Lo F C, Yeung Y M (eds.). Emerging World Cities in Pacific Asia. Tokyo: UNU Press, 498-519.This book chapter discusses trade communication and transport between northeastern Asian countries and the transnationalism of urban systems in China Japan and both North and South Korea. When metropolitan regions are borderless the problems become global and solutions must be collective decisions. Japan and South Korea associate high levels of urbanization with undesirable consequences of development. Japan has concerns about development in earthquake areas. South Korea has national security concerns and problems in the southwest. China has uneven growth of urban areas and must balance growth of export-oriented coastal cities with inland development. China is ambivalent about urbanization. The Chinese and Koreans are suspicious of borderless metropolises due to Japanese colonialism before World War II. Foreign investment is increasing in Asian mega-cities. Hyperurbanization of cities will create unbridgeable gaps between urban growth and urban services. Mega-cities produce inter-local conflict and increase socio-spatial inequalities within a country and reduce social spending. It is likely that the major economic powers will have property holdings in countries of other major powers. Land speculation and high land prices may create financial instability and possibly collapse. Multinational firms have succeeded in placing production in the most advantageous locations. This was accomplished by shifting the location of capital labor production markets and management. Industrial and spatial organizations are being reorganized particularly in east Asia. The dynamic process of globalization and urbanization is a fundamental consequence of economic social and technological development. East Asian countries share many interdependencies between countries for goods capital resources and labor. Urban infrastructure and spatial links in northeast Asia do not meet current needs.

[30]
Choe S C, 1998. Urban corridors in Pacific Asia. In: Lo F C, Yeung Y M (eds.). Globalization and the World of Large Cities. Tokyo: UNU Press, 155-173.

[31]
Curtis C, 2006. Network City: Retrofitting the Perth Metropolitan Region to facilitate sustainable travel.Urban Policy and Research, 24(2): 159-180.Network City', the latest 25-year planning strategy for metropolitan Perth, Western Australia, is designed to realise the integration of land use and transport networks within established and new areas. This article examines the influence of urban form on travel patterns and the case for sustainable travel outcomes in order to set in context the ‘Network City' concept. The concept is described, and then the article focuses on the operational detail needed to progress towards fuller integration between the transport network and the city it serves. This includes analysis of urban structure in the context of the factors that influence efficient use of public transport: including residential density, intensity of activity and the hierarchy of activity centres. The implications for road planning are discussed where land use–transport integration is the core objective rather than simply traffic efficiency. If sustainable travel is to be facilitated there is a need to change both the operation of public transport and the urban structure and these changes are mutually supportive.

DOI

[32]
Davoudi S, 2003. EUROPEAN BRIEFING: Polycentricity in European spatial planning: From an analytical tool to a normative agenda.European Planning Studies, 11(8): 979-999.The notion of polycentricity is gaining widespread currency in both academic and professional debates. It has opened its way in the spatial policy documents of the European Union and member states alike, and has become one of the key components of the integrated spatial development strategy promoted by the European Spatial Development Perspective (ESDP). Whilst polycentricity is increasingly shaping the spatial policy discourses both in the Commission and in member states, the precise meaning of the term has remained elusive. The first two sections of this article aim to unpack the concept of polycentricity, trace its origin and its development and clarify the confusion over its multiple interpretations at various spatial scales. The third section of the article explains how the concept of polycentricity which has traditionally been used as an analytical tool to explain an existing or emerging reality is now increasingly being used to determine that reality. This is based on the analyses of the use of polycentricity within the European spatial planning framework and in particular the ESDP. Here, the article raises a number of questions regarding the promotion of the polycentric urban regions as one of the ESDP's key policy options for a balanced territorial development across Europe.

DOI

[33]
Davoudi S, 2006. The northern way: A polycentric megalopolis. In: Shutt J, Henderson R, Johnson S (eds.). Essays on the Yorkshire and Humber Region. Researching Local and Regional Development. A Leeds Metropolitan University Research Report. Leeds, 47-53.

[34]
Delgado E, Epstein D, Joo Yet al., 2006. Methods for Planning the Great Lakes MegaRegion. Ann Arbor: Urban and Regional Planning Program, University of Michigan.http://deepblue.lib.umich.edu/bitstream/2027.42/110967/1/glmegaregion_methodsmanual_finalcorrect2006.pdf

[35]
Derudder B, Witlox F, 2005. An appraisal of the use of airline data in assessing the world city network: A research note on data.Urban Studies, 42(13): 2371-2388.Information on air passenger flows is potentially a prime data source for assessing spatial patterns in the world city network, but previous analyses of this issue have been hampered by inadequate and/or partial data. The ensuing analytical deficiencies have reduced the overall value of these analyses. Therefore, this paper examines how some of these deficiencies might be rectified. First, it reviews the rationale for using airline data to analyse the world city network. Secondly, it assesses the problems encountered by previous research. The third section elaborates on the construction of a global intercity matrix based on the so-called Marketing Information Data Transfer database and explains how this matrix can circumvent some previously identified problems.

DOI

[36]
Dieleman F M, Faludi A, 1998. Polynucleated metropolitan regions in Northwest Europe: Theme of the Special Issue.European Planning Studies, 6(4): 365-377.The pattern of urbanization in Western Europe is dominated by cities of between 200 000 and one million inhabitants. In the European Union as a whole, 170 cities lie in this range, while only 32 cities have a population of over one million, and very few of these have

DOI

[37]
Dijkstra L,2009. Metropolitan regions in the EU. Regional Focus Series 01/2009.Formato: Analítico de periódico ou monográfico]

[38]
Doll C N, Muller J P, Morley J G, 2006. Mapping regional economic activity from night-time light satellite imagery.Ecological Economics, 57(1): 75-92.The recognition that the elements of the 鈥榓nthropocene鈥 play a critical role in global change processes means that datasets describing elements of the socio-economic environment are becoming increasingly more desirable. The ability to present these data in a gridded format as opposed to the traditionally reported administrative units is advantageous for incorporation with other environmental datasets. Night-time light remote sensing data has been shown to correlate with national-level figures of Gross Domestic Product (GDP). Night-time radiance data is analysed here along with regional economic productivity data for 11 European Union countries along with the United States at a number of sub-national levels. Night-time light imagery was found to correlate with Gross Regional Product (GRP) across a range of spatial scales. Maps of economic activity at 5 km resolution were produced based on the derived relationships. To produce these maps, certain areas had to be excluded due to their anomalously high levels of economic activity for the amount of total radiance present. These areas were treated separately from other areas in the map. These results provide the first detailed examination of night-time light characteristics with respect to local economic activity and highlight issues, which should be considered when undertaking such analysis.

DOI

[39]
Douglass M, 2000. Mega-urban regions and world city formation: Globalisation, the economic crisis and urban policy issues in Pacific Asia.Urban Studies, 37(12): 2315-2335.In Pacific Asia, the globalisation of trade, production and finance underlies an accelerated urban transition focusing on a limited number of mega-urban regions. Intercity competition for world city status among these regions has intensified following the 1997 economic crisis. With governments compelled to devote greater amounts of public resources to creating a built environment to host global investment, a number of key policy issues are emerging. These include demands for inclusive governance and more livable cities; the appearance of new forms of urban poverty; low economic resilience in the face of growing global economic turbulence and the spatial unevenness of global economic growth. With the rise of civil society as a political force, addressing these issues calls for a sharper focus on cities not simply as economic agglomerations or collectivities of consumers in the world market, but also as arenas for the formation of political communities.

DOI

[40]
EC, 1999. Sixth Periodic Report on Social and Economic Situation and Development of Regions in the EU. European Commission, Brussels.CiteSeerX - Scientific documents that cite the following paper: Sixth Periodic Report on the Social and Economic Situation and

[41]
EC, 2004. Urban Audit. Methodological Handbook. Luxembourg: Office for Official Publications of the European Communities.

[42]
EEA, 2013. Urban Atlas. Available online: (accessed 16. Apr. 2015).

[43]
Elvidge C D, Imhoff M L, Baugh K Eet al., 2001. Night-time lights of the world: 1994-1995. ISPRS Journal of Photogrammetry and Remote Sensing, 56(2): 81-99.The Defense Meteorological Satellite Program (DMSP) Operational Linescan System (OLS) has a unique low-light imaging capability developed for the detection of clouds using moonlight. In addition to moonlit clouds, the OLS also detects lights from human settlements, fires, gas flares, heavily lit fishing boats, lightning and the aurora. By analysing the location, frequency, and appearance of lights observed in an image time series, it is possible to distinguish four primary types of lights present at the earth's surface: human settlements, gas flares, fires, and fishing boats. We have produced a global map of the four types of light sources as observed during a 6-month time period in 1994-1995. We review a number of environmental applications that have been developed or proposed based on the night-time light data. We examine the relationship between area of lighting, population, economic activity, electric power consumption, and energy related carbon emissions for 200 nations, representing 99% of the world's population.

DOI

[44]
Elvidge C D, Tuttle B T, Sutton P Cet al., 2007. Global distribution and density of constructed impervious surfaces.Sensors, 7(9): 1962-1979.We present the first global inventory of the spatial distribution and density ofconstructed impervious surface area (ISA). Examples of ISA include roads, parking lots,buildings, driveways, sidewalks and other manmade surfaces. While high spatialresolution is required to observe these features, the new product reports the estimateddensity of ISA on a one-km2 grid based on two coarse resolution indicators of ISA – thebrightness of satellite observed nighttime lights and population count. The model wascalibrated using 30-meter resolution ISA of the USA from the U.S. Geological Survey.Nominally the product is for the years 2000-01 since both the nighttime lights andreference data are from those two years. We found that 1.05% of the United States landarea is impervious surface (83,337 km2) and 0.43 % of the world’s land surface (579,703km2) is constructed impervious surface. China has more ISA than any other country(87,182 km2), but has only 67 m2 of ISA per person, compared to 297 m2 per person in theUSA. The distribution of ISA in the world’s primary drainage basins indicates that watersheds damaged by ISA are primarily concentrated in the USA, Europe, Japan, China and India. The authors believe the next step for improving the product is to include reference ISA data from many more areas around the world.

DOI PMID

[45]
ESPON, 2011. LUZ Specifications (Urban Audit 2004). Technical Report.

[46]
Esch T, Taubenböck H, Roth Aet al., 2012. TanDEM-X mission: New perspectives for the inventory and monitoring of global settlement patterns.Journal of Applied Remote Sensing, 6(1): 061702-1.TerraSAR-X add-on for digital elevation measurement (TanDEM-X) is a German Earth observation mission collecting a total of two global coverages of very high resolution (VHR) synthetic aperture radar (SAR) X-band data with a spatial resolution of around three meters in the years 2011 and 2012. With these, the TanDEM-X mission (TDM) will provide a unique data set which is complementary to existing global coverages based on medium (MR) or high resolution (HR) optical imagery. The capabilities of the TDM in terms of supporting the analysis and monitoring of global human settlement patterns are explored and demonstrated. The basic methodology for a fully-operational detection and delineation of built-up areas from VHR SAR data is presented along with a description of the resulting geo-information product-the urban footprint (UF) mask-and the operational processing environment for the UF production. Moreover, potential follow-on analyses based on the intermediate products generated in the context of the UF analysis are introduced and discussed. The results of the study indicate the high potential of the TDM with respect to an analysis of urbanization patterns, peri-urbanization, spatio-temporal dynamics of settlement development as well as population estimation, vulnerability assessment and modeling of global change.

DOI

[47]
Eurostat, 2013 (accessed 16. Apr. 2015.

[48]
Ewing R, 1997. Is Los Angeles-style sprawl desirable?Journal of the American Planning Association, 63(1): 107-126.Abstract This article reviews the literature on characteristics, causes, and costs of alternative development patterns. In doing so it debunks arguments by Gordon and Richardson in favor of Los Angeles-style sprawl. Sprawl is not suburbanization generally, but rather forms of suburban development that lack accessibility and open space. Sprawl is not a natural response to market forces, but a product of subsidies and other market imperfections. The costs of sprawl are borne by all of us, not just those creating it, and include inflated public spending, loss of resource lands, and a waning sense of community. The only realistic cure for sprawl is active planning of the sort practiced almost everywhere except the United States (and beginning to appear here out of necessity).

DOI

[49]
Ewing R, Pendall R, Chen D, 2002. Measuring sprawl and its impact. Smart Growth America. Washington, DC.This study discusses urban sprawl and its impacts. It defines sprawl and describes the authors' four factor index, which helps to measure sprawl. It uses the index to compare and evaluate metropolitan regions, discusses the impact of sprawl on the quality of life in these regions, and presents policy recommendations to combat the effects of sprawl.

DOI

[50]
Fawcett C B, 1932. Distribution of the Urban Population in Great Britain, 1931.The Geographical Journal, 79(2): 100-113.

DOI

[51]
Feranec J, Solin L, Kopecka Met al., 2014. Analysis and expert assessment of the semantic similarity between land cover classes. Progress in Physical Geography, online first. 0309133314532001.ABSTRACT Products of CORINE Land Cover (CLC), the National Land Cover Dataset (NLCD), the FAO/UNEP Land Cover Classification System (LCCS), etc. currently provide an important source of information used for the assessment of issues such as landscape change, landscape fragmentation and the planning of urbanization. Assuming that the data from these various databases are often used in searching for solutions to environmental problems, it is necessary to know which classes of different databases exist and to what extent they are similar, i.e. their possible compatibility and interchangeability. An expert assessment of the similarity between the CLC and NLCD 1992 nomenclatures is presented. Such a similarity assessment in comparison with the &lsquo;geometric model&rsquo; the &lsquo;feature model&rsquo; and the &lsquo;network model&rsquo; is not frequently used. The results obtained show the similarity of assessments completed by four experts who marked the degree of similarity between the compared land cover classes by 1 (almost similar classes), 0.5 (partially similar classes) and 0 (not similar classes). Four experts agreed on assigning 1 in only three cases; 0.5 was given 33 times. A single expert assigned 0.5 a total of 17 times. Results confirmed that the CLC and NLCD nomenclatures are not very similar.

DOI

[52]
Firman T, Dharmapatni I A I, 2007. The emergence of extended metropolitan regions in Indonesia: Jabotabek and Bandung Metropolitan Area.Review of Urban & Regional Development Studies, 7(2): 167-188.The Jakarta Metropolitan Region (Jabotabek) is advancing to the Bandung Metropolitan Regions (BMA) and vice versa. In fact, these two metropolitan regions are being physically integrated by giant corridors of urban regions, stretching from Serang to Cikampek, and from Bandung to Jakarta, shaping an extended metropolitan region, also called a mega-urban region. There are many factors contributing to this process, i.e. large-scale housing and new town, industrial estate, and toll road development. However, this development has created many environmental problems that should be taken into consideration in formulating development policy for the future in order to avoid environmental collapse.

DOI

[53]
Florida R, 2006. The new megalopolis. Our focus on cities is wrong. Growth and innovation come from new urban corridors. Newsweek International Edition, 3 July 2006, Special Report.The article focuses on urban growth worldwide, with particular focuses on the modern "megalopolis." According to the author, the New Megas are the real economic organizing units of the world. The author states that a megalopolis is a powerful complex of multiple cities and suburbs that form a vast expanse of trade.

[54]
Florida R, Gulden T, Mellander C, 2007. The rise of the mega-region. Cambridge Journal of Regions,Economy and Society, 1(3): 459-476.This paper uses a global dataset of nighttime light emissions to produce an objectively consistent set of mega-regions for the globe. We draw on high resolution population data to estimate the population of each of these regions. We then process the light data in combination with published estimates of national GDP to produce rough but useful estimates of the economic activity of each region. We also present estimates of technological and scientific innovation. We identify 40 mega-regions with economic output of more than $100 billion that produce 66 percent of world output and accounts for 85 percent of global innovation.

DOI

[55]
Frank L D, Engelke P O, 2001. The built environment and human activity patterns: Exploring the impacts of urban form on public health.Journal of Planning Literature, 16(2): 202-218.

[56]
Frey H, 1999. Designing the City: Towards a More Sustainable Urban Form. London: E&FN Spon.This book looks at current urban problems in cities and demonstrates how effective urban design can address social, economic and environmental issues as well as the physical planning at local level. The book is highly visual and illustrates the topic with a variety of sketches, line drawings, axonometrics, and models. The author draws upon the valuable experience gained by the City of Glasgow and compares its solutions -- successful and less successful -- with projects in a variety of European countries. Show more

[57]
Friedmann J, 1986. The world city hypothesis.Development and Change, 17(1): 69-83.Rotterdam, the West German economy centred on Frankfurt, and Zurich as a leading world money In the income distribution of semi-peripheral countries, the bottom 40 per cent of households subject to erosion by an inflationary process that is almost always double-digit and in

DOI

[58]
Friedmann J, 1995. Where we stand: a decade of world city research. In: Knox P L, Taylor P J (eds). World Cities in a World-System. Cambridge: Cambridge University Press, 21-47.As an interlocking system of production and markets, the global economy is a discovery of the 1970s (Barnet and Miiller 1974). At the time there was a good deal of controversy over the so-called'new international division of labour'(Frobel et al. 1980) and a centuries-old'

[59]
Friedmann J, Miller J, 1965. The urban field.Journal of the American Institute of Planners, 31(4): 312-320.

[60]
Friedmann J, Wolff G, 1982. World city formation: An agenda for research and action.International Journal of Urban and Regional Research, 6(3): 309-344.The development of a global system of major cities is examined and the implications of this trend for the world economic system are considered particularly in terms of the effect on international movements of capital. An attempt is made to review the relevant literature and present a bibliography on this topic. (summary in FRE GER SPA) (ANNOTATION)

DOI

[61]
Galster G, Hanson R, Ratcliffe M Ret al., 2001. Wrestling sprawl to the ground: Defining and measuring an elusive concept.Housing Policy Debate, 12(4): 681-717.Each dimension is operationally defined and tested in 13 urbanized areas. Results for six dimensions are reported for each area, and an initial comparison of the extent of sprawl in the 13 areas is provided. The test confirms the utility of the approach and suggests that a clearer conceptual and operational definition can facilitate research on the causes and consequences of sprawl.

DOI

[62]
Garreau J, 1991. Edge City: Life on the New Frontier. New York: Doubleday.

[63]
GaWC, 2010. The World According to GaWC 2010 (; accessed 16. Apr. 2015.

[64]
Geddes P, 1915. Cities in Evolution. An Introduction to the Town Planning Movement and to the Study of Civics. London: Williams & Norgate.Cities in evolution : an introduction to the town planning movement and to the study of civics Patrick Geddes (Social theories of the city / edited by Bryan S. Turner, v. 5) Routledge/Thoemmes Press, 1997

DOI

[65]
Gilbert A, 1998. World cities and the urban future: The view from Latin America. In: Lo Fu-chen, Yue-man Yeung (eds.). Globalization and the World of Large Cities. Tokyo, New York, Paris: United Nations University Press, 174-202.

[66]
Ginsburg N, 1991. Extended metropolitan regions in Asia: A new spatial paradigm. In: Ginsburg N, Koppel B, McGee T G (eds.). The Extended Metropolis: Settlement Transition in Asia. Honolulu: University of Hawaii Press, 27-46.

[67]
Glaeser E, Kahn M, 2003. Sprawl and Urban Growth. NBER Working Paper Series, Working Paper 9733. Cambridge, MA.Cities can be thought of as the absence of physical space between people and firms. As such, they exist to eliminate transportation costs for goods, people and ideas and transportation technologies dictate urban form. In the 21st century, the dominant form of city living is based on the automobile and this form is sometimes called sprawl. In this essay, we document that sprawl is ubiquitous and that it is continuing to expand. Using a variety of evidence, we argue that sprawl is not the result of explicit government policies or bad urban planning, but rather the inexorable product of car-based living. Sprawl has been associated with significant improvements in quality of living, and the environmental impacts of sprawl have been offset by technological change. Finally, we suggest that the primary social problem associated with sprawl is the fact that some people are left behind because they do not earn enough to afford the cars that this form of living requires.

DOI

[68]
Goldstein S, 1994. Demographic issues and data needs for mega-city research. In: Fuchs R J, Brennan E, Chamie J et al. (eds.). Mega-city Growth and the Future. Tokyo, New York, Paris: United Nations University Press, 32-61.

[69]
Gottmann J, 1957. Megalopolis or the urbanization of the northeastern seaboard.Economic Geography, 189-200.Key Words】:

DOI

[70]
Gottmann J, 1961. Megalopolis: The Urbanized Northeastern Seaboard of the United States. New York: The Twentieth Century Fund.

[71]
Gottmann J, 1976. Megalopolitan systems around the world.Ekistics, 243(2): 109-113.This symposion will focus on the Great Lakes Megalopolis, the vast complex of metropolitan and urbanized areas that straddles the boundary between Canada and the United States and winds around the network of waterways and water spaces of the St Lawrence and the

DOI

[72]
Great Britain Historical GIS Project (GBHGISP), 2004. ‘Great Britain Historical GIS’. University of Portsmouth (available from: , accessed 16. Apr. 2015).

[73]
Green N, 2007. Functional polycentricity: A formal definition in terms of social network analysis.Urban Studies, 44(11): 2077-2103.Polycentricity is often used descriptively with regard to a regional system of settlements, usually referred to as a polycentric urban region (PUR). Although presented in much of the literature as in essence a morphological concept, polycentricity possesses a functional element that receives less attention. Polycentricity is also seen as a normative concept. However, it has not been rigorously defined using formal techniques. This paper argues that defining polycentricity in terms of both morphology and function is possible by drawing on techniques originating in social network analysis. The paper sets out a formal definition and derivation of functional polycentricity based on these techniques, which is then extended to a derivation of an index of regional functional polycentricity. The paper sets out worked examples to show how the techniques described might be utilised. The paper closes with a discussion of issues that may arise when putting these definitions into practice.

DOI

[74]
Halbert L, Pain K, Thierstein A, 2006. European polycentricity and emerging Mega-City-Regions: ‘One size fits all’ policy?Built Environment, 32(2): 194-218.

[75]
Hales M, Mendoza Peña A, 2012. 2012 Global Cities Index and Emerging Cities Outlook. A.T. Kearney and The Chicago Council on Global Affairs.正New York,London,Paris and Tokyo are Top Global Cities in 2012 A.T.Keamey Global Cities Index. Beijing and Shanghai may rival top global cities in 10-20 years.The Global Cities Index,conducted every two years since 2008,provides a unique measure of global engagement for 66 cities across five dimensions-Business Activity,Human Capital,Information Exchange,Cultural Experience,and Political Engagement.The

[76]
Hall P, 1998. Globalization and the world cities. In: Lo Fu-chen, Yeung Yue-man (eds.). Globalization and the World of Large Cities. Tokyo, New York, ,Paris: United Nations University Press, 17-36.

[77]
Hall P, 2009a. Looking backward, looking forward: The city region of the mid-21st century.Regional Studies, 43(6): 803-817.

[78]
Hall P, 2009b. The future of cities. Computers, Environment and Urban Systems, 23(3): 173-185.

[79]
Hall P, Pain K, 2006. From metropolis to polyopolis. In: Hall P, Pain K (eds.). The Polycentric Metropolis: Learning from Mega-city Regions in Europe. London & Sterling, VA: Earthscan, 3-16.Key Words】:

[80]
Handy S, 1996. Methodologies for exploring the link between urban form and travel behavior.Transportation Research Part D: Transport and Environment, 1(2): 151-165.Communities are increasingly looking to urban design and the concept of the New Urbanism as an effective strategy for reducing automobile dependence in suburban areas. While the available empirical evidence suggests that automobile travel is lower in traditional-style neighborhoods, it provides limited insights as to how and why, largely because the research methodologies used have been insufficent for the task. Most of the studies addressing this question fall into three categories: simulation studies, aggregate analyses, and disaggregate analyses. Two other approaches offer greater promise for understanding the relationship between urban form and travel behavior: choice models and activity-based analyses. This paper reviews alternative approaches for exploring the link between urban form and travel behavior, outlines issues and complexities that this research must address, and, finally, suggests that the focus of this research should shift from the search for strategies to change behavior to a search for strategies to provide choices.

DOI

[81]
Hansen M C, DeFries R S, Townshend J Ret al., 2000. Global land cover classification at 1 km spatial resolution using a classification tree approach.International Journal of Remote Sensing, 21(6/7): 1331-1364.

[82]
Hasse J E, Lathrop R G, 2003. Land resource impact indicators of urban sprawl.Applied Geography, 23(2): 159-175.Sprawl has been loosely defined as dispersed and inefficient urban growth. We propose a series of five indicators that examine the per capita consumption of land taken in new development in relation to several critical land resource impacts associated to sprawl including: (1) density of new urbanization; (2) loss of prime farmland; (3) loss of natural wetlands; (4) loss of core forest habitat; and (5) increase of impervious surface. These Land Resource Impact (LRI) indicators were measured for each of New Jersey鈥檚 566 municipalities using a 1986 to 1995 land use/land cover digital database along with US Census population data. By integrating population growth with land resource loss a more nuanced interpretation of land use change is provided than in previous analyses of sprawl.

DOI

[83]
Hospers G-J, 2002. Beyond the blue banana? Structural change in Europe’s geo-economy. ERSA Conference Papers, European Regional Science Association.For centuries, the so-called 'Blue Banana' has shown the greatest development potential in Europe's geo-economy. This metropolitan area, extending from the north-west of London through Germany to Milan, traditionally has been a breeding place for entrepreneurship and innovation in Europe. Recently, however, commentators have identified the 'Sunbelt' from Milan to Valencia and - anticipating the coming enlargement of the European Union - the 'Yellow Banana' from Paris to Warsaw as the growth poles of the future. Ultimately, it is claimed, these emerging centres of gravity may even take over the dominant position of the Blue Banana in the European economy. In this paper we explore the question how likely it is that the contemporary structure of Europe's economic-geographical system is really changing in the next decades. After a short discussion of the 'stylized facts' of unbalanced growth in Europe we develop a framework in which insights from structural change theory and economic geography are combined. In particular, we link the literature on sectoral changes from industry to services in time with spatial concepts such as urbanization economies, institutional inertia and geographical path dependency. With the help of this framework it is argued that over time the techno-economic and institutional structure of specialized regions may become locked-in into rigid trajectories. Simultaneously, we suggest that regions with sectoral diversity provide the flexibility which is needed to absorb new techno-economic developments and to develop 'new combinations'. This framework of structural change in time and space is applied to the European context. We find that it is particularly the Blue Banana that may face a favourable future. The fact is that thanks to its diversified structure this area rather than the Sunbelt and the Yellow Banana can build on strong urbanization economies. Therefore, we expect that the Blue Banana despite its industrial tradition continues to be the major economic growth axis in the European service economy. In this line of reasoning, also European structural policy may take on a different aspect: rather than aiming for regional balance the policy objective might be striving for an optimal economic, institutional and infrastructural connection of less developed regions to the Blue Banana. In this way, spread effects from cities in the Blue Banana to connected areas are facilitated, which ultimately may contribute to a less unbalanced growth of Europe's geo-economy.

DOI

[84]
IKM (Initiativkreis Europäische Metropolregionen in Deutschland) & Bundesinstitut für Bau-, Stadt- und Raumforschung (BBSR) im Bundesamt für Bauwesen und Raumordnung (BBR) (eds.), 2010. Regionales Monitoring 2010. Daten und Karten zu den Europäischen Metropolregionen in Deutschland. BonnMannheim.

[85]
Jagadisan S, Fookes T W, 2009. Extending the scope and methodology of Ekistic theory and practice-Part 1: Introduction. - Research Memorandum 09/1. Auckland.

[86]
Jefferson M, 1939. The law of the primate city.Geographical Review, 29(2): 226-232.

DOI

[87]
Jenks M, Burton E, Williams K (eds.), 2004. The Compact City: A Sustainable Urban Form? London: Routledge.

[88]
Kloosterman R C, Musterd S, 2001. The polycentric urban region: Towards a research agenda.Urban Studies, 38(4): 623-633.Focuses on the polycentric urban region concept of city planning. Overview of the concept; Factors affecting the growth of cities and towns; Demise of the basic monocentric model at an intraurban level

DOI

[89]
Knox P L, 1995. World cities in a world-system. In: Knox P L, Taylor P J (eds). World Cities in a World-System. Cambridge: Cambridge University Press, 3-20.

[90]
Kraas F, 2007. Megacities and global change: Key priorities.The Geographical Journal, 173(1): 79-82.First page of article

DOI

[91]
Kraas F, 2010. Stadt und Land im Fluss: Lebensräume. Transformationsprozesse im “urban fringe” der Megastädte Asiens. In: Forschungsschule A R T E S. (ed.). A.R.T.E.S. Jahrbuch. Berichtzeitraum Oktober 2008 - Februar 2010. Köln, 85-93.

[92]
Kraas F, Mertins G, 2008. Megastädte in Entwicklungsländern: Vulnerabilität, Informalität, Regier- und Steuerbarkeit.Geographische Rundschau, 60(11): 4-10.

[93]
Kraas F, Nitschke U, 2008. Megaurbanisierung in Asien-Entwicklungsprozesse und Konsequenzen stadträumlicher Reorganisation. Themenheft “Raum-und Stadtentwicklung in Asien”.Informationen zur Raumentwicklung, 8: 447-456.

[94]
Kunzmann K R, 1998. World city regions in Europe: Structural change and future challenges. In: Lo F C, Yeung Y-M (eds.). Globalization and the World of Large Cities. Tokyo, New York, Paris: United Nations University Press, 37-75.

[95]
Lambooy J G, 1998. Polynucleation and economic development: The Randstad.European Planning Studies, 6(4): 457-466.In a generalized form two kinds of systems of cities exist in Europe: those with a strongly dominating city, and those with a polynucleated structure. The Netherlands show the latter type. It is common in economic geography to connect economic performance with agglomeration advantages and a concomitant spatial concentration of the strongest functions. For the Netherlands a continuing spatial dispersal of population and economic activities from the largest towards smaller cities and the Green Heart has been observed; this gives reason to support the hypothesis that agglomeration economies cannot be seen as a main condition for national economic growth. However, a further investigation might show that the highest levels of economic and cultural functions need larger agglomerations, which could lead to a loss of certain functions to global cities like London.

DOI

[96]
Lang R E, 2003. Edgeless Cities: Exploring the Elusive Metropolis. Washington: The Brookings Institution.

[97]
Lang R E, Dhavale D, 2005. Beyond Megalopolis: Exploring America’s New “Megapolitan” Geography. Alexandria, VA: Metropolitan Institute, Virginia Technical University.

[98]
Lang R E, Nelson A C, 2007. Beyond the Metroplex: Examining Commuter Patterns at the “Megapolitan” Scale. Working Paper. Lincoln Institute of Land Policy, Cambridge, MA.Key Words】:

[99]
Laquian A, 1994. Social and welfare impacts of mega-city development. In: Fuchs R J, Brennan E, Chamie J et al., (eds.). Mega-city Growth and the Future. Tokyo, New York, Paris: United Nations University Press, 192-214.

[100]
Laquian A, 2005. Beyond Metropolis: The Planning and Governance of Asia’s Mega Urban Regions. Baltimore: Johns Hopkins University Press.

[101]
Laquian A, 2011. The planning and governance of Asia’s mega-urban regions. In: UN-DESA, 2011. Population Distribution, Urbanization, Internal Migration and Development: An International Perspective. United Nations Publication, 302-322.

[102]
Lewis P F, 1983. The galactic metropolis. In: Platt R H, Macinko G. Beyond the Urban Fringe. Minneapolis: University of Minnesota Press, 23-49.

[103]
Li P, Cao X-S, 2005. Evolution and development of Guangzhou-Hong Kong Corridor.Chinese Geographical Science, 15(3): 206-211.1IN T R O D U C T IO NThe concept ofthecorridorhas a long historyintheur-ban and regionalresearch.Because of itsgreatimpor-tanceand impacts,researchon corridors has receivedgrowing attentionof geographers.Studieshave rangedfrom the theoreticaulnderpinnin

DOI

[104]
Liu Z, He C, Zhou Yet al., 2014. How much of the world’s land has been urbanized, really? A hierarchical framework for avoiding confusion.Landscape Ecology, 29(5): 763-771.Urbanization has transformed the world’s landscapes, resulting in a series of ecological and environmental problems. To assess urbanization impacts and improve sustainability, one of the first questions that we must address is: how much of the world’s land has been urbanized? Unfortunately, the estimates of the global urban land reported in the literature vary widely from less than 1–302% primarily because different definitions of urban land were used. To evade confusion, here we propose a hierarchical framework for representing and communicating the spatial extent of the world’s urbanized land at the global, regional, and more local levels. The hierarchical framework consists of three spatially nested definitions: “urban area” that is delineated by administrative boundaries, “built-up area” that is dominated by artificial surfaces, and “impervious surface area” that is devoid of life. These are really three different measures of urbanization. In 2010, the global urban land was close to 302%, the global built-up area was about 0.6502%, and the global impervious surface area was merely 0.4502%, of the word’s total land area (excluding Antarctica and Greenland). We argue that this hierarchy of urban land measures, in particular the ratios between them, can also facilitate better understanding the biophysical and socioeconomic processes and impacts of urbanization.

DOI

[105]
Lo F-C, Marcotullio P J, 2001. Globalization and urban transformations in the Asia Pacific region. In: Lo F-C, Marcotullio P J (eds.). Globalization and the Sustainability of Cities in the Asia Pacific Region. Tokyo, New York, Paris: United Nations University Press, 21-67.ABSTRACT The purpose of this study was to document the extent of adhesion of (99m)Tc-sestamibi to syringes in patient procedures, determine factors that influence the degree of adhesion, and evaluate alternatives to our current practice that would either result in a more reproducible degree of adhesion or, ideally, eliminate adhesion. The extent of adhesion was documented in 216 patient procedures and evaluated in detail in an additional 73 patient procedures. We evaluated the nature of the adhesion and its possible causes, including the location of adhesion in injection sets, the effect of syringe type, and the effect of prerinsing of syringes with various solutions of nonradiolabeled sestamibi and (99m)Tc-sestamibi. The extent of adhesion was reevaluated in 50 procedures performed using the syringe type that demonstrated the lowest adhesion rate. The degree of adhesion of (99m)Tc-sestamibi to the injection set was found to be 20.1% 卤 8.0%, with a range (10th-90th percentiles) of 9%-31%. The primary cause of adhesion appeared to be the lubricant used inside the syringe barrel. Evaluation of 6 different syringe types identified a brand with a lower adhesion rate. Reevaluation in patient procedures using this brand showed a 5.2% 卤 2.5% degree of adhesion, with a range (10th-90th percentiles) of 2.5%-7.7%. Selection of the appropriate type of syringe can significantly reduce the magnitude and variability of residual (99m)Tc-sestamibi activity. With more reproducible residual activities, we have been able to achieve an approximately 20% reduction in the dispensed dose of (99m)Tc-sestamibi used in clinical procedures and a more consistent injected dose with less interpatient variation. The frequent changes in syringe design by manufacturers require that a quality control program for monitoring of residual activity be incorporated into clinical practice. This program has allowed us to maintain image quality and achieve more consistent injected patient doses in clinical procedures that use (99m)Tc-sestamibi.

DOI

[106]
Loveland T R, 2000. Development of a global land cover characteristics database and IGBP DISCover from 1 km AVHRR data.International Journal of Remote Sensing, 21(6/7): 1303-1330.Researchers from the U.S. Geological Survey, University of Nebraska-Lincoln and the European Commission's Joint Research Centre, Ispra, Italy produced a 1 km resolution global land cover characteristics database for use in a wide range of continental-to global-scale environmental studies. This database provides a unique view of the broad patterns of the biogeographical and ecoclimatic diversity of the global land surface, and presents a detailed interpretation of the extent of human development. The project was carried out as an International Geosphere-Biosphere Programme, Data and Information Systems (IGBP-DIS) initiative. The IGBP DISCover global land cover product is an integral component of the global land cover database. DISCover includes 17 general land cover classes defined to meet the needs of IGBP core science projects. A formal accuracy assessment of the DISCover data layer will be completed in 1998. The 1 km global land cover database was developed through a continent-by-continent unsupervised classification of 1 km monthly Advanced Very High Resolution Radiometer (AVHRR) Normalized Difference Vegetation Index (NDVI) composites covering 1992-1993. Extensive post-classification stratification was necessary to resolve spectral/temporal confusion between disparate land cover types. The complete global database consists of 961 seasonal land cover regions that capture patterns of land cover, seasonality and relative primary productivity. The seasonal land cover regions were aggregated to produce seven separate land cover data sets used for global environmental modelling and assessment. The data sets include IGBP DISCover, U.S. Geological Survey Anderson System, Simple Biosphere Model, Simple Biosphere Model 2, Biosphere-Atmosphere Transfer Scheme, Olson Ecosystems and Running Global Remote Sensing Land Cover. The database also includes all digital sources that were used in the classification. The complete database can be sourced from the website: http://edcwww.cr.usgs.gov/landdaac/glcc/glcc.html.

DOI

[107]
Masini E B, 1994. Impacts of mega-city growth on families and households. In: Fuchs R J, Brennan E, Chamie J et al., (eds.). Mega-city Growth and the Future. Tokyo, New York, Paris: United Nations University Press, 215-230.

[108]
McGee T G, 1991. The emergence of Desakota regions in Asia: Expanding a hypothesis. In: Ginsburg N, Koppel B, McGee T G (eds.). The Extended Metropolis: Settlement Transition in Asia. Honolulu: University of Hawaii Press, 3-26.

[109]
McGee T G, Robinson I M (eds.), 1995. The Mega-Urban Regions of Southeast Asia. Vancouver: UBC Press.A distinguishing feature of recent urbanization in the ASEANcountries of Thailand, Malaysia, the Philippines, Singapore, andIndonesia is the outward extension of their mega-cities (Bangkok, Jakarta, Manila, Singapore, and Kuala Lumpur) beyond the

DOI

[110]
McGrath B, Pickett S T A, 2011. The metacity: A conceptual framework for integrating ecology and urban design.Challenges, 2(4): 55-72.We introduce the term metacity as a conceptual framework that can be shared by ecologists and designers and applied across the wide variety of urban habitats found around the world. While the term metacity was introduced by UN-HABITAT to designate hyper cities of over twenty million people, for us it is not limited to large urban agglomerations, but rather refers to the proliferation of new forms of urbanization, each with distinct ecological and social attributes. These various urban configurations when combined with new digital sensing, communication and social networking technologies constitute a virtual meta-infrastructure, present in all cities today. This new metacity has the potential to integrate new activist forms of ecological and urban design research and practice in making the transition from sanitary to sustainable city models globally. The city of Baltimore, Maryland will be used both as a site to illustrate these recent urban trends, and also as an example of the integration of ecology and urban design pursued by the two authors over the past seven years [1,2]. Metacity theory is drawn from both an architectural analysis of contemporary forms of urbanism, new forms of digital monitoring and communication technologies, as well as metapopulation and metacommunity theories in ecology. We seek to provide tools and lessons from our experiences for realizing an integrated metacity approach to achieving social sustainability and ecological resilience on an increasingly urbanized planet.

DOI

[111]
Miyazaki H, Shao X, Iwao Ket al., 2012. An automated method for global urban area mapping by integrating ASTER satellite images and GIS data.IEEE Journal of Selected Topics in Applied Earth Observations and Remote Sensing, 6(2): 1004-1019.We present an automated classification method for global urban area mapping by integrating satellite images taken by Visible and Near-Infrared Radiometer of Advanced Spaceborne Thermal Emission and Reflection radiometer (ASTER/VNIR) and GIS data derived from existing urban area maps. The method consists of two steps. First, we extracted urban areas from ASTER/VNIR satellite images by using an iterative machine-learning classification method known as Learning with Local and Global Consistency (LLGC). This method is capable of automatically performing classification with a noisy training dataset, in our case, low-resolution urban maps. Therefore, we were able to perform supervised classification of ASTER/VNIR images without using labor-intensive visual interpretation. Second, we integrated the LLGC confidence map with other maps by logistic regression. The logistic regression complemented misclassifications in the LLGC map and provided useful information for further improvement of the model. In an experiment including 194 scenes of ASTER/VNIR images, the integrated maps were developed at a resolution of 15 m resolution, which is much finer than existing maps with resolutions of 300 to 1000 m. The maps achieved an overall accuracy of 90.0% and a kappa coefficient of 0.565, both of which are higher than or almost equal to the values for major existing global urban area maps.

DOI

[112]
Morrison Institute (MI), 2008. Megapolitan Arizona’s Sun Corridor. Morrison Institute for Public Policy, Arizona State University.Arizona is one of the nation’s most urban states, and now it includes one of 20 “megapolitan” areas in the U.S. People have predicted for 50 years that Phoenix and Tucson would grow together into a giant desert conglomerate. That possibility has been seen as exciting, intriguing, and distressing. While a solid city along Interstate 10 is unlikely given the diverse land ownership in central and southern Arizona, the two metro economies are already merging.Megapolitan: Arizona’s Sun Corridor, one of the first reports on a single megapolitan area, recognizes a more sophisticated technique for analyzing urban growth—that shared economic and quality of life interests are more important than physically growing together.Scholars at Virginia Tech defined the megapolitans based on economic and growth patterns.The Sun Corridor, which cuts across six counties from the border with Mexico to the center of Yavapai County, is the home of eight out of 10 Arizonans. In the next several decades, two out of three Americans will live in a megapolitan accounting for 60% of the population on only 10% of U.S. land.Megapolitan offers a bold new picture of Arizona’s geography and its future opportunities and “megaton” challenges. This report presents a scenario for 2035 based on current trends. It analyzes the Sun Corridor and provides insights into the region’s global potential, water, governance, sustainability, and “trillion dollar questions.” It discusses the “tragedy of the sunshine” and asks the indispensable question: In 2035, do you want to live in the Sun Corridor?

[113]
Nechyba T J, Walsh R P, 2004. Urban Sprawl.Journal of Economic Perspectives, 18(4): 177-200.The authors begin with an overview of the causes and consequences of urban sprawl in the twentieth century, focusing in particular on lower transportation costs and self-sorting of the population. By sprawl, we will mean the tendency toward lower city densities as city footprints expand. They next focus on four issues that raise clear efficiency and equity concerns: unproductive congestion on roads, high levels of metropolitan car pollution, the loss of open space amenities, and unequal provision of public goods and services across sprawling metropolitan suburbs that give rise to residential segregation and pockets of poverty. Finally, they consider the trade-offs inherent in some policies commonly proposed to address urban sprawl. Throughout, a main theme of the discussion is that a full analysis of sprawl is made difficult by the lack of a usefully integrated economic model of urban economies. Along these lines, the authors conclude with some thoughts on possible future research agendas.

DOI

[114]
Neuman M, 2000. Regional design: Recovering a great landscape architecture and urban planning tradition.Landscape and Urban Planning, 47: 115-128.We are witnessing a rebirth of physical design, both in practice and the academy, spurred on by neo-traditional community planning and neo-urbanism. This article attributes the sources of contemporary regional design to this renaissance. It also traces its origins to classic regional planning, which has been a professional activity for over a century. Regional design shapes the physical form of regions. It takes a regional perspective in guiding the arrangement of human settlements in communities. It is a strategy to accommodate growth by providing a physical framework to determine or guide the most beneficial location, function, scale, and inter-relationships of communities within a region. This strategic function of regional design distinguishes it from urban and regional planning, apart from its focus on physical form. Communities, the links among them, and their environs are the three key physical components of regions that are the objects of regional design. Regional design strives to connect these communities by transport, communication, and other links into regional networks. Keeping the fringes or environs of the communities relatively sparsely settled is another aim. The article presents historic and contemporary examples of regional design in the US and Europe, and outlines principles for regional design.

DOI

[115]
OECD, 2012. Redefining “Urban”: A new way to measure metropolitan areas. OECD Publishing.

[116]
(accessed 16. Apr. 2015).

[117]
Pacione M, 2009. Urban Geography: A Global Perspective. 3rd ed. London:Routledge.Today, for the first time in the history of Humankind urban dwellers outnumber rural residents. Urban places, towns and cities, are of fundamental importance - for the distribution of population within countries; in the organisation of economic production, distribution and exchange; in the structuring of social reproduction and cultural life; and in the allocation and exercise of power. Furthermore, in the course of the present century the number of urban dwellers and level of global urbanisation are destined to increase. Even those living beyond the administrative or functional boundaries of a town or city will have their lifestyle influenced to some degree by a nearby, or even distant, city. The analysis of towns and cities is a central element of all social sciences including geography, which offers a particular perspective on and insight into the urban condition. The principal goal of this third edition of the book remains that of providing instructors and students of the contemporary city with a comprehensive introduction to the expanding field of urban studies. The structure of the first two editions is maintained, with minor amendments. Each of the thirty chapters has been revised to incorporate recent developments in the field. All of the popular study aids are retained; the glossary has been expanded; and chapter references and notes updated to reflect the latest research. This third edition also provides new and expanded discussion of key themes and debates including detailed consideration of metacities, boomburgs, public space, urban sprawl, balanced communities, urban economic restructuring, poverty and financial exclusion, the right to the city, urban policy, reverse migration , and traffic and transport problems. The book is divided into six main parts. Part one outlines the field of urban geography and explains the importance of a global perspective. Part two explores the growth of cities from the earliest times to the present day and examines the urban geography of the major world regions. Part three considers the dynamics of urban structure and land use change in Western cities. Part four focuses on economy, society and politics in the Western city. In part five attention turns to the urban geography of the Third World, where many of the countries experiencing highest rates or urban growth are least well equipped to respond to the economic, social, political and environmental challenge. Finally part six affords a prospective on the future of cities and cities of the future. New to this edition are: further readings based on the latest research; updated data and statistics; an expanded glossary; new key concepts; additional study questions; and a listing of useful websites. The book provides a comprehensive interpretation of the urban geography of the contemporary world. Written in a clear and readable style, lavishly illustrated with more than 80 photographs, 180 figures, 100 tables and over 200 boxed studies and with a plethora of study aids Urban Geography: A Global Perspective represents the ultimate resource for students of urban geography.

DOI

[118]
Pain K, 2007. Global cities, gateways and corridors: Hierarchies, roles and functions. In: Roundtables and International Conference of Canada’s Asia-Pacific Gateway and Corridor Initiative, Vancouver.ABSTRACT The terms 'gateway' and 'corridor' which originated in traditional geographical location and systems theory have long been regarded as valuable conceptual tools, especially in understanding the development of 'New World' urban systems and regional economies. But more recently, the terms have begun to be applied in new ways and in new situations. It seems that almost any major city anywhere can now be called a 'global gateway'. A 'transportation corridor' can be a 'gateway' and an 'urban corridor' simultaneously, or the terms may refer simply to ICT infrastructures (see for example Van der Linden, 2005). So what are the conditions leading to changing interpretations of these once taken for granted terminologies and what are the implications for policy? This paper examines how the gateway and corridor concepts are currently being reinterpreted in the context of contemporary processes of globalization and the extent to which new theorisation is informing spatial policy in North West Europe.

[119]
Pain K, 2011. ‘New Worlds’ for ‘Old’? Twenty‐first‐century gateways and corridors: Reflections on a European spatial perspective.International Journal of Urban and Regional Research, 35(6): 1154-1174.Urban 'gateways' and 'corridors', which originated as conceptual tools to aid understanding of North American 'New World' regional development patterns in location theory, have been referred to in new ways and different situations in recent geographical literature. This article considers the profound changes reshaping the roles and functions of cities and their trade routes in contemporary globalization - the rise of the informational economy and the network organization of global knowledge-intensive advanced producer services. The policy response to these developments is critically assessed with reference to evidence from the 'Polynet' study which has investigated the changes currently transforming globalizing 'mega-city regions' in the 'Old World' setting of North West Europe. The article provides new reflections on the empirical results, addressing an apparent under-theorization of emergent urban relational geographies in European strategy considered an international role model for regional planning, including in North America. A series of paradoxes posed by the fluid urban geographies revealed in the research is identified to inform an ongoing discourse on the development of European spatial policy.

DOI

[120]
Pesaresi M, Guo H, Blaes Xet al., 2013. A global human settlement layer from optical HR/VHR RS data: Concept and first results. IEEE Journal of Selected Topics in Applied Earth Observations and Remote Sensing, 6(5): 2102-2131.of the Earth surface spread in four continents, corresponding to an estimated population of 1.3 billion people in 2010. The resolution of the input image data ranges from 0.5 to 10 meters, collected by a heterogeneous set of platforms including satellite SPOT (2 and 5), CBERS 2B, RapidEye (2 and 4), WorldView (1 and 2), GeoEye 1, QuickBird 2, Ikonos 2, and airborne sensors. Several imaging modes were tested including panchromatic, multispectral and pan-sharpened images. A new fully automatic image information extraction, generalization and mosaic workflow is presented that is based on multiscale textural and morphological image features extraction. New image feature compression and optimization are introduced, together with new learning and classification techniques allowing for the processing of HR/VHR image data using low-resolution thematic layers as reference. A new systematic approach for quality control and validation allowing global spatial and thematic consistency checking is proposed and applied. The quality of the results are discussed by sensor, band, resolution, and eco-regions. Critical points, lessons learned and next steps are highlighted.

DOI

[121]
Piacentini M, Rosina K, 2012. Measuring the environmental performance of metropolitan areas with geographic information sources. OECD Regional Development Working Papers,No. 2012/05, OECD Publishing.This paper presents recent work undertaken at the OECD to produce environmental indicators at the regional level from geographic data sources. New indicators have been tested and produced in five different domains: a) land cover, b) forest ecosystems, c) urban density, d) CO2 emissions, e) air quality. The indicators measure the environmental performance of administrative regions (OECD TL2 and TL3 regions) and of OECD metropolitan areas. High-quality geographic datasets have been combined and harmonized with the objectives of producing internationally comparable results, and of achieving the largest possible coverage of OECD and non-OECD countries. The results show that geographic information data are a key and underexploited resource for monitoring the state of local environmental assets. There are still methodological and measurement challenges in the use of geographic data for the analysis of environmental changes at the local level. More coordination across national and international programs producing geographic data is needed to further increase their policy relevance.

DOI

[122]
Potere D, Schneider A, 2007. A critical look at representations of urban areas in global maps.GeoJournal, 69(1/2): 55-80.According to the UN, the number of urban dwellers is expected to increase from roughly 3.202billion today to more than 4.902billion by 2030. An accurate and regularly updated estimate of the extent and spatial distribution of urban land is an important first step in our search for realistic responses to the ecological and social consequences of what promises to be the most rapid urbanization in world history. By employing circa-2000 satellite remote sensing imagery, geographic information systems, and census data, six groups from government and academia in both the EU and the US have created global maps that can be used to describe urban land. We compare these maps from global to sub-national scales, for the first time applying Discrete Global Grids to the problem of global-scale map comparison. Although most of these maps share common data inputs, they differ by as much as an order of magnitude in their estimates of the total areal extent of the Earth’s urban land (from 0.27 to 3.5202million02km 2 ). A sub-national analysis of the spatial distribution of urban land reveals that inter-map correlations are highest in North America ( $ \ifmmode\expandafter\bar\else\expandafter\=\fi{r} $ 02=020.90), intermediate in Europe, South and Central America, and Sub-Saharan Africa ( $ \ifmmode\expandafter\bar\else\expandafter\=\fi{r} $ 02=020.78), and lowest in Asia ( $ \ifmmode\expandafter\bar\else\expandafter\=\fi{r} $ 02=020.63). Across most regions, our analysis uncovers a degree of variance that is high enough to call into question the consistency of each group’s approach to urban land, pointing to the need for both a common urban taxonomy and a global urban assessment effort.

DOI

[123]
Potere D, Schneider A, 2009. Comparison of global urban maps. In: Gamba P, Herold M (eds.). Global Mapping of Human Settlement: Experiences, Datasets, and Prospects. Boca Raton, London & New York: Taylor & Francis Group.

DOI

[124]
Ratti C, Williams S, Frenchman Det al., 2006. Mobile landscapes: Using location data from cell phones for urban analysis.Environment and Planning B: Planning and Design, 33(5): 727-748.

[125]
Regional Plan Association, 2006. America 2050: A Prospectus. New York.

[126]
Ross C L, 2008. Megaregions: Literature Review of the Implications for U.S. Infrastructure Investment and Transportation Planning. Georgia: Georgia Institute of Technology.

[127]
Sassen S, 1991.The Global City: London, New York, Tokyo . Princeton: Princeton University Press.This classic work chronicles how New York, London, and Tokyo became command centers for the global economy and in the process underwent a series of massive and parallel changes. What distinguishes Sassen's theoretical framework is the emphasis on the formation of cross-border dynamics through which these cities and the growing number of other global cities begin to form strategic transnational networks. All the core data in this new edition have been updated, while the preface and epilogue discuss the relevant trends in globalization since the book originally came out in 1991.

DOI

[128]
Sassen S, 2005. The global city: Introducing a concept.Brown Journal of World Affairs, 11(2): 27-43.Looks at the emergence of global cities and its role in economic expansion and development in the U.S. Role of globalization of economic activity in the structure of global cities; Theories of the global city market; Factors that contribute to the development of global cities.

[129]
Schneider A, Friedl M A, Potere D, 2010. Mapping global urban areas using MODIS 500-m data: New methods and datasets based on ‘urban ecoregions’.Remote Sensing of Environment, 114(8): 1733-1746.Although cities, towns and settlements cover only a tiny fraction (<021%) of the world's surface, urban areas are the nexus of human activity with more than 50% of the population and 70–90% of economic activity. As such, material and energy consumption, air pollution, and expanding impervious surface are all concentrated in urban areas, with important environmental implications at local, regional and potentially global scales. New ways to measure and monitor the built environment over large areas are thus critical to answering a wide range of environmental research questions related to the role of urbanization in climate, biogeochemistry and hydrological cycles. This paper presents a new dataset depicting global urban land at 500-m spatial resolution based on MODIS data (available at http://sage.wisc.edu/urbanenvironment.html ). The methodological approach exploits temporal and spectral information in one year of MODIS observations, classified using a global training database and an ensemble decision-tree classification algorithm. To overcome confusion between urban and built-up lands and other land cover types, a stratification based on climate, vegetation, and urban topology was developed that allowed region-specific processing. Using reference data from a sample of 140 cities stratified by region, population size, and level of economic development, results show a mean overall accuracy of 93% ( k 02=020.65) at the pixel level and a high level of agreement at the city scale ( R 2 02=020.90).

DOI

[130]
Schneider A, Woodcock C E, 2008. Compact, dispersed, fragmented, extensive? A comparison of urban growth in twenty-five global cities using remotely sensed data, pattern metrics and census information.Urban Studies, 45(3): 659-692.Despite growing recognition of the important role of cities in economic, political and environmental systems across the world, comparative, global-scale research on cities is severely limited. This paper examines the similarities and differences in urban form and growth that have occurred across 25 mid-sized cities from different geographical settings and levels of economic development. The results reveal four city types: low-growth cities with modest rates of infilling; high-growth cities with rapid, fragmented development; expansive-growth cities with extensive dispersion at low population densities; and frantic-growth cities with extraordinary land conversion rates at high population densities. Although all 25 cities are expanding, the results suggest that cities outside the US do not exhibit the dispersed spatial forms characteristic of American urban sprawl.

DOI

[131]
Schwentker W, 2006. Die Megastadt als Problem der Geschichte. In: Schwentker W (ed.). Megastädte im 20. Jahrhundert. Göttingen: Ruprecht Gmbh & Co., 7-26.

[132]
Scott A J, 2000. Global city-regions and the new world system. Unpublished Paper, Department of Policy Studies and Department of Geography, University of California, Los Angeles.ABSTRACT

[133]
Scott A J, 2001. Globalization and the rise of city-regions.European Planning Studies, 9(7): 813-826.A world-wide mosaic of large city-regions seems to be over-riding (though is not effacing entirely) an earlier core-periphery system of spatial organization. The economic dynamics of these city-regions are analysed with particular emphasis on the ways in which they tend to generate increasing-returns effects and competitive advantages for local producers. The managerial tasks that these city-regions face raise many new issues about local economic development policy and institution building in the interests of social order. These issues lead on to further questions about democracy and citizenship in the global mosaic of city-regions as well as in the new world system as a whole.

DOI

[134]
Siedentop S, 2005. Urban sprawl - verstehen, messen, steuern: Ansatzpunkte für ein empirisches Mess-und Evaluationskonzept der urbanen Siedlungsentwicklung.disP-The Planning Review, 41(160): 23-35.During the 1990s, the phenomenon of urban sprawl received growing attention in the international planning debate. However, a survey of the literature yields no agreement in terms of defining and measuring urban sprawl. The absence of a common understanding constrains the analysis of sprawl's causes, costs and consequences, as well as the formulation of planning strategies towards economically, ecologically and socially acceptable land use patterns. Politicians and planners aiming to contain sprawl must agree upon a definition and a method for measuring progress in order to track their progress. This paper is intended to improve the understanding of causes, characteristics and effects of sprawl-type land use development, based on an overview of the international literature. In the first part, it gives a synthesis of sprawl definitions and measurement concepts. The second part outlines the dispute on causes and costs of urban sprawl and reflects possible empirical influences. Finally, a methodological frame...

DOI

[135]
Small C, Elvidge C D, Balk Det al., 2011. Spatial scaling of stable night lights.Remote Sensing of Environment, 115(2): 269-280.City size distributions, defined on the basis of population, are often described by power laws. Zipf's Law states that the exponent of the power law for rank-size distributions of cities is near 鈭1. Verification of power law scaling for city size distributions at continental and global scales is complicated by small sample sizes, inappropriate estimation techniques, inconsistent definitions of urban extent and variations in the accuracy and spatial resolution of census administrative units. We attempt to circumvent some of these complications by using a continuous spatial proxy for anthropogenic development and treat it as a spatial complement to population distribution. We quantify the linearity and exponent of the rank-size distribution of spatially contiguous patches of stable night light over a range of brightnesses corresponding to different intensities of development. Temporally stable night lights, as measured by the Defense Meteorological Satellite Program-Operational Line Scanner (DMSP-OLS), provide a unique proxy for anthropogenic development. Brightness and spatial extent of emitted light are correlated to population density (Sutton et al., 2001), built area density (Elvidge et al., 2007c) and economic activity ( and ) at global scales and within specific countries. Using a variable brightness threshold to derive spatial extent of developed land area eliminates the complication of administrative definitions of urban extent and makes it possible to test Zipf's Law in the spatial dimension for a wide range of anthropogenic development. Higher brightness thresholds generally correspond to more intense development while lower thresholds extend the lighted area to include smaller settlements and less intensively developed peri-urban and agricultural areas. Using both Ordinary Least Squares (OLS) and Maximum Likelihood Estimation (MLE) to estimate power law linearity and exponent of the resulting rank-size distributions across a range of upper tail cutoffs, we consistently find statistically significant exponents in the range 鈭0.95 to 鈭1.11 with an abrupt transition to very large, extensively connected, spatial networks of development near the low light detection limit of the sensor. This range of exponents and transition are observed at both continental and global scales. The results suggest that Zipf's Law also holds for spatial extent of anthropogenic development across a range of intensities at both continental and global scales. The implication is that the dynamics of urban growth and development may be represented as spatial phase transitions when the spatial extent and intensity of development are treated as continuous variables rather than discrete entities.

DOI

[136]
Small C, Pozzi F, Elvidge C D, 2005. Spatial analysis of global urban extent from DMSP-OLS night lights.Remote Sensing of Environment, 96(3): 277-291.Previous studies of DMSP-OLS stable night lights have shown encouraging agreement between temporally stable lighted areas and various definitions of urban extent. However, these studies have also highlighted an inconsistent relationship between the actual lighted area and the boundaries of the urban areas considered. Applying detection frequency thresholds can reduce the spatial overextent of lighted area (“blooming”) but thresholding also attenuates large numbers of smaller lights and significantly reduces the information content of the night lights datasets. Spatial analysis of the widely used 1994/1995 stable lights data and the newly released 1992/1993 and 2000 stable lights datasets quantifies the tradeoff between blooming and attenuation of smaller lights. For the 1992/1993 and 2000 datasets, a 14% detection threshold significantly reduces blooming around large settlements without attenuating many individual small settlements. The corresponding threshold for the 1994/1995 dataset is 10%. The size–frequency distributions of each dataset retain consistent shapes for increasing thresholds while the size–area distributions suggest a quasi-uniform distribution of lighted area with individual settlement size between 10 and 1000 km equivalent diameter. Conurbations larger than 80 km diameter account for 0290% can often reconcile lighted area with built area in the 1994/1995 dataset but there is not one threshold that works for a majority of the 17 cities considered. Even 100% thresholds significantly overestimate built area for the 1992/1993 and 2000 datasets. Comparison of lighted area with blooming extent for 10 lighted islands suggests a linear proportionality of 1.25 of lighted to built diameter and an additive bias of 2.7 km. While more extensive analyses are needed, a linear relationship would be consistent with a physical model for atmospheric scattering combined with a random geolocation error. A Gaussian detection probability model is consistent with an observed sigmoid decrease of detection frequency for settlements <0210 km diameter. Taken together, these observations could provide the basis for a scale-dependent blooming correction procedure that simultaneously reduces geolocation error and scattering induced blooming.

DOI

[137]
Soja E, Kanai E,2007. The urbanization of the world. In: Burdett R (ed.). The Endless City. Phaidon Press Limited, 54-69.More and more people are moving into towns and cities to live and work, altering the urban/rural balance of countries worldwide搂"The Endless City" is an unparalleled study of the growth of six of the world's international cities (New York, Shanghai, London, Mexico City, Johannesburg, and Berlin), exploring key structural, social, and economic factors. This book was overseen by the London School of Economics, and features extensive research and coherent texts by world-renowned professionals in the field of urban planning and development. The information is presented in a comprehensive and visually compelling sequence, enabling quick and efficient reference as well as offering material that is exciting to study. Each city is examined individually in its own chapter as well as being analyzed comparatively in an observational chapter.

[138]
Sudhira H S, Ramachandra T V, 2007. Characterising urban sprawl from remote sensing data and using landscape metrics. In: Proceedings of the 10th International Conference on Computers in Urban Planning and Urban Management, Iguassu Falls, Brazil, July 11-13.ABSTRACT Urban sprawl refers to the outgrowth of urban areas caused by uncontrolled, uncoordinated and unplanned growth. This outgrowth seen along the periphery of cities, along highways, and along roads connecting a city, lacks basic amenities like sanitation, treated water supply, primary health centre, etc. as planners were unable to visualise such growth during planning, policy and decision-making. Sprawl generally infers to some type of uncoordinated development with impacts such as loss of agricultural land, open space and ecologically sensitive habitats in and around urban areas due to lack of integrated and holistic approaches in regional planning. In developing countries, where urbanisation rates are high, urban sprawl is a significant contributor of the land use change. However, characterising sprawl has become a contentious issue with numerous arguments both for and against the phenomenon. Meanwhile, effective metrics to characterise sprawl in India are required to characterise this. We have attempted to capture urban sprawl over the landscape and hence adopt landscape metrics for characterising sprawl. We further ascribe that prevalence of sprawl leads to erosion of landscape elements. The satellite remote sensing data for Bangalore, India, of Landsat TM and Landsat ETM+ for 1992 and 2000, were used and through a multi-stage classification process, post-classification change detection was performed. Bangalore city is popularly known as 'the garden city' of India is experiencing rapid urban growth and consequent to the software boom, the city is now referred as 'IT Capital' of India. The growth Bangalore is experiencing has significant implications on land use. The landscape metrics adopted were computed and the compared for these two time-periods to characterise sprawl. It was evident from these metrics the amount of dispersion and dispersed growth taking place in radial direction across Bangalore. The study demonstrates the utility of using landscape metrics for characterising urban sprawl.

[139]
Sudhira H S, Ramachandra T V, Jagadish K S, 2004. Urban sprawl: Metrics, dynamics and modelling using GIS.International Journal of Applied Earth Observation and Geoinformation, 5(1): 29-39.Urban sprawl refers to the extent of urbanisation, which is a global phenomenon mainly driven by population growth and large scale migration. In developing countries like India, where the population is over one billion, one-sixth of the world鈥檚 population, urban sprawl is taking its toll on the natural resources at an alarming pace. Urban planners require information related to the rate of growth, pattern and extent of sprawl to provide basic amenities such as water, sanitation, electricity, etc. In the absence of such information, most of the sprawl areas lack basic infrastructure facilities. Pattern and extent of sprawl could be modelled with the help of spatial and temporal data. GIS and remote sensing data along with collateral data help in analysing the growth, pattern and extent of sprawl. With the spatial and temporal analyses along with modelling it was possible to identify the pattern of sprawl and subsequently predict the nature of future sprawl. This paper brings out the extent of sprawl taking place over a period of nearly three decades using GIS and Remote Sensing. The study also attempts to describe some of the landscape metrics required for quantifying sprawl. For understanding and modelling this dynamic phenomenon, prominent causative factors are considered.

DOI

[140]
Sutton P, Roberts D, Elvidge Cet al., 2001. Census from Heaven: An estimate of the global human population using night-time satellite imagery.International Journal of Remote Sensing, 22(16): 3061-3076.Night-time satellite imagery provided by the Defense Meteorological Satellite Program's Operational Linescan System (DMSP OLS) is evaluated as a means of estimating the population of all the cities of the world based on their areal extent in the image. A global night-time image product was registered to a dataset of 2000 known city locations with known populations. A relationship between areal extent and city population discovered by Tobler and Nordbeck is identified on a nation by nation basis to estimate the population of the 22 920 urban clusters that exist in the night-time satellite image. The relationship between city population and city areal extent was derived from 1597 city point locations with known population that landed in a 'lit' area of the image. Due to conurbation, these 1597 cities resulted in only 1383 points of analysis for performing regression. When several cities fell into one 'lit' area their populations were summed. The results of this analysis allow for an estimate of the urban population of every nation of the world. By using the known percent of population in urban areas for every nation a total national population was also estimated. The sum of these estimates is a total estimate of the global human population, which in this case was 6.3 billion. This is fairly close to the generally accepted contemporaneous (1997) estimate of the global population which stood at approximately 5.9 billion.

DOI

[141]
Taubenböck H, Esch T, Felbier Aet al., 2012. Monitoring urbanization in mega cities from space.Remote Sensing of Environment, 117: 162-176.Mega cities, the largest category of urban agglomerations, attract considerable attention because of their population size, economic, socio-cultural, environmental and political influence and geographical complexity. Until 1975 there were just three mega cities in the world: New York, Tokyo and Mexico City — today there are 27 cities having more than the defined 1002million inhabitants. This paper presents a straight forward, application-oriented approach using multi-temporal remotely sensed data to systematically monitor the spatiotemporal dynamics of the world's urban giants. Object-oriented and pixel-based classification image analysis techniques are applied to Landsat as well as to TerraSAR-X data in order to define urbanized areas of the mega cities at different points of time. Subsequently post-classification change detection is performed on urban footprint level. With time intervals of about 1002years almost 4002years of urbanization are monitored, showing different dimensions, dynamics and patterns across the analyzed cities. The generated urban footprint products show accuracies consistently higher than 80%, allowing for further applications in fields such as urban planning, risk management, or population assessment.

DOI

[142]
Taubenböck H, Wegmann M, Roth Aet al., 2009. Urbanization in India: Spatiotemporal analysis using remote sensing data.Computers, Environment and Urban Systems, 33(3): 179-188.Urbanization is arguably the most dramatic form of irreversible land transformation. Though urbanization is a worldwide phenomenon, it is especially prevalent in India, where urban areas have experienced an unprecedented rate of growth over the last 30 years. In this uncontrolled situation, city planners lack tools to measure, monitor, and understand urban sprawl processes. Multitemporal remote sensing has become an important data-gathering tool for analysing these changes. By using time-series of Landsat data, we classify urban footprints since the 1970s. This lets us detect temporal and spatial urban sprawl, redensification and urban development in the tremendously growing 12 largest Indian urban agglomerations. A multi-scale analysis aims to identify spatiotemporal urban types. At city level, the combination of absolute parameters (e.g. areal growth or built-up density) and landscape metrics (e.g. SHAPE index) quantitatively characterise the spatial pattern of the cities. Spider charts can display the spatial urban types at three time stages, showing temporal development and helping the reader compare all cities based on normalized scales. In addition, gradient analysis provides insight into location-based spatiotemporal patterns of urbanization. Therefore, we analyse zones defining the urban core versus the urban edges. The study aims to detect similarities and differences in spatial growth in the large Indian urban agglomerations. These cities in the same cultural area range from 2.5 million inhabitants to 20 million (in the metropolitan region of Mumbai). The results paint a characteristic picture of spatial pattern, gradients and landscape metrics, and thus illustrate spatial growth and future modelling of urban development in India.

DOI

[143]
Taubenböck H, Wiesner M, Felbier Aet al., 2014. New dimensions of urban landscapes: The spatio-temporal evolution from a polynuclei area to a mega-region based on remote sensing data.Applied Geography, 47(2): 137-153.Currently our world is facing a migration process of a huge dimension – from rural to urban areas. In 1975 37.7% of the global population were urban dwellers, 1990 already 43%, today little over 50%, and in 2050 the expected number is 67.2%. This great process shapes new spatial urban landscapes, in dimension and pattern. In this study we aim at analyzing the spatial evolution of a once polynuclei urban area to a mega-region in a 35 years time frame. Using multi-temporal and multi-source satellite data we classify urban footprints of a mega-region – the Hong Kong–Shenzhen–Guangzhou mega-region in Southern China – for the years 1975, 1990, 2000 and 2011. Based on this geospatial data set we aim at turning the qualitative and fuzzy definitions of mega-regions into a physical concept. Furthermore, we suggest a set of spatial features potentially characteristic for the evolution of mega-regions. In particular we apply and develop a multiude of spatial metrics at three spatial levels, namely the entire mega-region, the hinterlands between different cities and the cities themselves. The result is a novel spatial approach to capture, measure and analyze new shapes of urban landscapes.

DOI

[144]
Taubenböck H, Wiesner M, 2015. The spatial network of megaregions: Types of connectivity between cities based on settlement patterns derived from EO-data.Computers, Environment and Urban Systems, 54: 165-180.Megaregions are important phenomena of globalization's new urban scale and form. These regions are considered the drivers of global economy, innovation, technology and the labor market. In combination with the global megatrend of urbanization, new dimensions and patterns are evolving conceptualized e.g. by this term &lsquo;megaregion&rsquo;. Using multi-source and multi-temporal satellite data we classify urban footprints and their spatial evolution since the 1970s of five selected megaregions across the globe, namely the megaregions of Southern California anchord by Los Angeles in USA and the Mexican border area, the mega-region S&atilde;o Paulo&ndash;Rio de Janeiro in Brazil, the Nile delta anchord by Cairo in Egypt, the mega-region Amsterdam&ndash;Rotterdam, Ruhr&ndash;Cologne, Brussels&ndash;Antwerp and Lille in Europe, and the megaregion Guangzhou&ndash;Shenzhen&ndash;Hong Kong in China. Based on this geospatial data set, we develop a spatial metric to measure spatial connectivity between cities based on the continuity of settlement patterns. The network of cities within the particular megaregions is based on demographic information. The result is on the one hand an evaluation of the spatial continuity of settlements between the cities within the networks. On the other hand, comparisons whether the settlement patterns in megaregions across the globe are similar or not are performed. We conclude with the finding that three types of megaregions can be spatially classified and one suggested megaregion is spatially not yet connected.

DOI

[145]
Taylor P J, Lang R E, 2004. The shock of the new: 100 concepts describing recent urban change.Environment and Planning A, 36(6): 951-958.No abstract is available for this item.

DOI

[146]
Torrens P M, 2008. A toolkit for measuring sprawl.Applied Spatial Analysis and Policy, 1(1): 5-36.Debate regarding suburban sprawl in urban studies is contentious. It is fair to say that the phenomenon is not fully understood to satisfaction in the academic, policy, or planning communities and there are a host of reasons why this may be the case. Characterization of sprawl in the literature is often narrative and subjective. Measurement is piecemeal and largely data-driven. Existing studies yield contrary results for the same cities in many cases. The partial appreciation for the intricacies of sprawl is problematic. In practice, city planning agencies and citizen advocacy groups are scrambling to suggest and develop “smart growth” strategies to curb sprawl, without a strong empirical basis for measuring the phenomenon. Yet, sprawl is extremely popular with consumers. In this paper, we develop an innovative approach to diagnosing sprawl, looking across the full range of its characteristic attributes in a comprehensive fashion that is robust to some well-known challenges. This proves to be very useful in sweeping the parameter space of the phenomenon, enabling the visualization and valuation of sprawl surfaces across attributes, allowing us to check the pulse of a developing city. We apply the work to Austin, TX, a controversial exemplar of American sprawl, with the surprising result that sprawl and “smart growth” are found to co-exist and co-evolve. This raises questions about relationships between the two, with consequences for planning and public policy.

DOI

[147]
Trip J J, 2003. The corridor as a transport network. In: Zonneveld W, Trip J J (eds.). Megacorridors in North West Europe. Investigating a New Transnational Planning Concept. Housing and Urban Policy Studies, 27. Delft: Delft University Press, 17-23.Assumptions about the role of neighbourhood effects are increasingly built into urban policies, particularly in relation to the role of spatial concentrations of disadvantage in perpetuating inequality and social exclusion. Nevertheless, hard evidence to underpin this assumption is still largely lacking. To help fill this gap, this paper focuses on the relationship between overall urban scale and the spatial scale of segregation, and on the implications of wider segregation for social outcomes at the individual level. Education is taken as a test case, because of the role of defined catchment areas in relation to school recruitment. Results show that: at given scales, larger city-regions are much more segregated; educational outcomes are only partly affected by neighbourhood effects for particular population characteristics; and greater individual inequality in more segregated areas is mainly due to positive impacts of segregation for more advantaged groups, rather than negative impacts for the most disadvantaged.

DOI

[148]
Tsai Y-H, 2005. Quantifying urban form: Compactness versus ‘Sprawl’.Urban Studies, 42(1): 141-161.CiteSeerX - Document Details (Isaac Councill, Lee Giles): Summary. This paper develops a set of quantitative variables to characterise urban forms at the metropolitan level and, in particular, to distinguish compactness from ‘sprawl’. It first reviews and analyses past research on the definitions of urban form, compactness and sprawl, and corresponding quantitative variables. Four quantitative variables are developed to measure four dimensions of urban form at the metropolitan level: metropolitan size, activity intensity, the degree that activities are evenly distributed, and the extent that high-density sub-areas are clustered. Through a series of simulation analyses, the global Moran coefficient, which characterises the fourth dimension, distinguishes compactness from sprawl. It is high, intermediate and close to zero for monocentric, polycentric and decentralised sprawling forms respectively. In addition, the more there is more local sprawl, composed of discontinuity and strip development, the lower is the Moran coefficient. 1.

DOI

[149]
UN-DESA, 2011. Population Distribution, Urbanization, Internal Migration and Development: An International Perspective. New York: United Nations Publications.

[150]
UN-DESA, 2012. World Urbanization Prospects: The 2011 Revision. New York: United Nations Publications.Page 1. World Urbanization Prospects The 2011 Revision Presentation at the Center forStrategic and International Studies (CSIS) Washington, DC; 7 June 2012 Gerhard K. HeiligUnited Nations, Department of Economic and Social Affairs (DESA)

[151]
UN-Habitat, 2006. State of the World’s Cities Report 2006/7. London & Sterling, VA: Earthscan.

[152]
UN-Habitat, 2008a. State of the World’s Cities 2010/2011: Bridging the Urban Divide. London & Sterling, VA: Earthscan.The world's urban population now exceeds the world's rural population. What does this mean for the state of our cities, given the strain this global demographic shift is placing upon current urban infrastructure? Following on from previous State of the World's Cities reports, this edition uses the framework of 'The Urban Divide' to analyse the complex social, political, economic and cultural dynamics of urban environments. The book focuses on the concept of the 'right to the city' and ways in which many urban dwellers are excluded from the advantages of city life, using the framework to explore links among poverty, inequality, slum formation and economic growth. The volume will be essential reading for all professionals and policymakers in the field, and a valuable resource for researchers and students in all aspects of urban development.

[153]
UN-Habitat, 2008b. The State of African Cities 2008. A framework for addressing urban challenges in Africa. Nairobi.

[154]
UN-Habitat, 2009. Planning Sustainable Cities. Global Report on Human Settlements 2009. London and Sterling, VA: Earthscan.Planning Sustainable Cities: Global Report on Human Settlements 2009 assesses the effectiveness of urban planning as a tool for dealing with the unprecedented challenges facing 21st-century cities and for enhancing sustainable urbanization. There is nowa realization that, in many parts of the world, urban planning systems have changed very little and are often contributors to urban problems rather than functioning as tools for human and environmental improvement. Against this background, the Global Report鈥檚 central argument is that, in most parts of the world, current approaches to planning must change and that anew role for urban planning in sustainable urban development has to be found.

[155]
van Houtum H, Lagendijk A, 2001. Contextualising regional identity and imagination in the construction of polycentric urban regions: The cases of the Ruhr area and the Basque country.Urban Studies, 38(4): 747-767.Chaos has been observed in the formation of Taylor Vortex pairs in Modified Taylor Couette flow with hourglass geometry. Control of chaos has been demonstrated in this system employing the RPF algorithm. Seeking alternative algorithms, we are implementing the OGY algorithm in a numerical model of a damped driven mechanical pendulum and a physical apparatus. We report on both and future plans for the Modified Taylor-Couette system.

[156]
von Thünen J H, 1826. Der isolirte Staat in Beziehung auf Landwirthschaft und Nationalökonomie oder Untersuchungen über den Einfluß, den die Getreidepreise, der Reichthum des Bodens und die Abgaben auf den Ackerbau ausüben. Hamburg:Perthes.

[157]
Whebell C F, 1969. Corridors: A theory of urban systems.Annals of the Association of American Geographers, 59(1): 1-26.ABSTRACT As used in this article, the term corridor applies to a linear system of urban places together with the linking surface transport media. Corridors are very persistent historically, and they form one of the major types of urban systems in the New World. In general, the development of a corridor-centered economic landscape can be described in five cumulative historical stages: initial occupance, commercial agriculture, railway transport, motor transport, and metropolitanism. In each stage, the innovations diagnostic of changes in the economic system appear first in corridors, and diffuse outwards in a sequential pattern termed a culture gradient. Southern Ontario, as a real illustration of the principles of corridor theory exemplifies all five stages of development and manifests the culture gradient mentioned in the theory.

DOI

[158]
Yue W, Liu Y, Fan P, 2010. Polycentric urban development: The case of Hangzhou.Environment and Planning A, 42(3): 563-577.Despite the advantages of polycentric structure and its rich literature drawn from cities in industialized countries, little attention has been paid to the study of polycentric urban development in developing countries based on land-use information. With Hangzhou used as a case study, the authors investigate polycentric urban development through an analysis of directions of urban expansion, urban - rural gradients, and growth types. The multidisciplinary methodology employed, based on theories and methods in remote sensing, geographic information systems, and landscape ecology, has been proved to be useful in the morphological study of polycentric urban development. It was found that Hangzhou has expanded in different directions at various speeds, shifting to a polycentric urban pattern through radial expansion. Along the main transportation corridors, the values of the mean patch sizes of urban patches displayed multiple peaks, and the landscape-shape index maintained a horizontal trend in urban fringes, reflecting the formation of polycentricity. Further, as edge growth and spontaneous growth accounted for 40-50% and 30-40% of urban growth, respectively, and infill growth was responsible for only a small proportion of urban growth, it is suggested that dispersed urban patches have been increasingly agglomerated into big ones, especially along road corridors. Hangzhou's polycentric urban development was shaped both by the planning efforts of the government and by market forces. The municipal government guided the polycentric development through drafting and revising master plans, annexing nearby districts, and establishing development zones. Nevertheless, market forces played an increasingly important role in Hangzhou's polycentric development through the implementation of an urban land market, the inflow of migrant workers, and the relocation of industries.

DOI

[159]
Yusuf S, 2007. About Urban Mega Regions: Knowns and Unknowns. World Bank Policy Research Working Paper 4252. Washington, D.C.Mega urban regions are not a passing phenomenon. They are likely to persist and to enlarge their economic footprints because they benefit from the advantages of market scale, agglomeration economies, location, and the increasing concentration of talented workers. Metropolitan regions which are polycentric, relatively well managed, and have invested heavily in transport infrastructure are able to contain some of the problems attendant upon a concentration of people and industry. Moreover, with energy and water resources becoming relatively scarce and many countries anxious to preserve arable land for farming, the economic advantages of densely populated urban areas are on the rise because they have a lower resource utilization quotient. During the next 15 years, mega urban economies could coalesce in three Southeast Asian locations: Bangkok, Jakarta, and the Singapore-Iskander Development Region (IDR, South Johor). The Bangkok and Jakarta (Jabotabek) metropolitan regions have passed the threshold at least in terms of population size but they have yet to approach the industrial diversity, dynamism, and growth rates of a Shanghai or a Shenzhen-Hong Kong region. Singapore, if coupled with IDR, has the potential butit is still far from being an integrated urban region. This paper examines the gains from closer economic integration and the issues to be settled before it could occur. The paper notes that a tightening of localized economic links between two sovereign nations through the formation of an urban region would involve a readiness to make long-term political commitments based on a widely perceived sense of substantial spillovers and equitably shared benefits. Delineating these benefits convincingly will be essential to winning political support and a precondition for a successful economic flowering.

DOI

[160]
Zhang Q, Seto K, 2011. Mapping urbanization dynamics at regional and global scales using multi-temporal DMSP/OLS nighttime light data.Remote Sensing of Environment, 115(9): 2320-2329.Urban areas concentrate people, economic activity, and the built environment. As such, urbanization is simultaneously a demographic, economic, and land-use change phenomenon. Historically, the remote sensing community has used optical remote sensing data to map urban areas and the expansion of urban land-cover for individual cities, with little research focused on regional and global scale patterns of urban change. However, recent research indicates that urbanization at regional scales is growing in importance for economics, policy, land use planning, and conservation. Therefore, there is an urgent need to understand and monitor urbanization dynamics at regional and global scales. Here, we illustrate the use of multi-temporal nighttime light (NTL) data from the U.S Air Force Defense Meteorological Satellites Program/Operational Linescan System (DMSP/OLS) to monitor urban change at regional and global scales. We use independently derived data on population, land use and land cover to test the ability of multi-temporal NTL data to measure regional and global urban growth over time. We apply an iterative unsupervised classification method on multi-temporal NTL data from 1992 to 2008 to map urbanization dynamics in India, China, Japan, and the United States. For two-year intervals between 1992 and 2000, India consistently experienced higher rates of urban growth than China, and both countries exceeded the urban growth rates of the United States and Japan. This is not surprising given that the populations of India and China were growing faster than those of the U.S. and Japan during those periods. For two-year intervals between 2000 and 2008, China experienced higher rates of urban growth than India. Results show that the multi-temporal NTL provides a regional and potentially global measure of the spatial and temporal changes in urbanization dynamics for countries at certain levels of GDP and population-driven growth.

DOI

Outlines

/