Orginal Article

Extracting urban areas in China using DMSP/OLS nighttime light data integrated with biophysical composition information

  • CHENG Yang , 1, 2, 3 ,
  • ZHAO Limin , 1, 2 ,
  • WAN Wei 4 ,
  • LI Lingling 1, 2 ,
  • YU Tao 1, 2 ,
  • GU Xingfa 1, 2
Expand

Author: Cheng Yang, PhD Candidate, specialized in land use. E-mail:

*Corresponding author: Zhao Limin, PhD, specialized in thermal infrared remote sensing. E-mail:

Received date: 2015-04-30

  Accepted date: 2015-09-07

  Online published: 2016-07-25

Supported by

National Civil Aerospace Pre-research Project (non-disclosure)

Copyright

Journal of Geographical Sciences, All Rights Reserved

Abstract

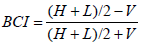
DMSP/OLS nighttime light (NTL) image is a widely used data source for urbanization studies. Although OLS NTL data are able to map nighttime luminosity, the identification accuracy of distribution of urban areas (UAD) is limited by the overestimation of the lit areas resulting from the coarse spatial resolution. In view of geographical condition, we integrate NTL with Biophysical Composition Index (BCI) and propose a new spectral index, the BCI Assisted NTL Index (BANI) to capture UAD. Comparisons between BANI approach and NDVI-assisted SVM classification are carried out using UAD extracted from Landsat TM/ETM+ data as reference. Results show that BANI is capable of improving the accuracy of UAD extraction using NTL data. The average overall accuracy (OA) and Kappa coefficient of sample cities increased from 88.53% to 95.10% and from 0.56 to 0.84, respectively. Moreover, with regard to cities with more mixed land covers, the accuracy of extraction results is high and the improvement is obvious. For other cities, the accuracy also increased to varying degrees. Hence, BANI approach could achieve better UAD extraction results compared with NDVI-assisted SVM method, suggesting that the proposed method is a reliable alternative method for a large-scale urbanization study in China’s mainland.

Cite this article

CHENG Yang , ZHAO Limin , WAN Wei , LI Lingling , YU Tao , GU Xingfa . Extracting urban areas in China using DMSP/OLS nighttime light data integrated with biophysical composition information[J]. Journal of Geographical Sciences, 2016 , 26(3) : 325 -338 . DOI: 10.1007/s11442-016-1271-6

1 Introduction

Human activities are predominantly concentrated in the urban areas. Accurate understanding of the spatiotemporal distribution of urban areas (UAD) is an effective way to unveil the mechanisms of interaction between land-use systems and terrestrial ecosystems. It also serves the basic needs for urban-rural planning, urban resource management, environmental assessment, and global change research (Weng, 2012). Remote sensing technique can capture land use and land cover conveniently, objectively, and continuously. It is an effective approach for current UAD extraction when combined with urban administrative unit statistical data (Schneider, 2012; Schneider et al., 2010; Weng, 2012). Nighttime light (NTL) remote sensing data has become a new approach for large-scale urbanization study and has attracted widespread attention because of its macroscopic perspective (Doll, 2008; Elvidge et al., 2007; Lu et al., 2014; Ma et al., 2012; Potere et al., 2009).
NTL signal is captured by Operational Linescan System (OLS) sensor on Defense Meteorological Satellite Program (DMSP). It is found that the night lighted areas on Earth are coincident with the distribution of population and energy consumption. Thus, NTL information provides an accurate, economic, and direct way to describe the global distribution and development of urban areas, making it a powerful tool for human activity study (Forbes, 2013; He et al., 2013; Small and Elvidge, 2013; Wu et al., 2013). The method for large-scale UAD extraction using DMSP/OLS data can be categorized as: 1) NTL data thresholding, and 2) combining multi-sensor remote sensing data and auxiliary products. The threshold method mainly includes empirical threshold (Elvidge et al., 1997a; Elvidge et al., 1997b), abruptly changing detection (Imhoff et al., 1997), high resolution data comparison (Henderson et al., 2003), and statistical data comparison (He et al., 2006) methods. DMSP/OLS data are recorded as 6-bit digital numbers (DNs) that are often saturated in the core of the cities. This is why DNs detected from sensors are consistently less than the exact values (Zhang et al., 2013). Meanwhile, distribution of light areas in urban fringe areas, small towns as well as connected regions between cities detected by the OLS is consistently larger compared to the spatial distribution of the associated settlements. This is due to the coarse spatial resolution of the OLS sensor and the disturbance in the signal. Since urban expansions of different economic levels and different periods in China are significantly dissimilar, the determination of threshold tends to be empirical, regional, and temporal. It remains difficulty to extract the UAD accurately for large-scale researches (Small et al., 2011; Small et al., 2005). A cluster-based threshold method was developed to delineate the urban extent, which the optimal threshold for each potential urban cluster is evaluated relying on urban cluster size and overall NTL magnitude (Zhou et al., 2014).
The core of multi-sensor remote sensing assisted method is to provide the underlying surface properties of urban landscape, which could subsequently correct or eliminate the saturation of NTL data. Previous research shows that vegetation and impervious surfaces have a strong negative linear relationship (Weng, 2012). Thus, some researchers tried to use NTL data combined with Normalized Difference Vegetation Index (NDVI) data to carry out urbanization studies, including urban land cover pattern intensification (Zhang et al., 2013), urban energy consumption evaluation (He et al., 2013), urban population estimation (Zhuo et al., 2009) and urban spatial distribution extraction (Cao et al., 2009; Lu et al., 2008; Pandey et al., 2013). He et al. (2014) estimated natural habitat loss caused by urban sprawl in China over the period 1992-2012, integrating NTL data, NDVI and land surface temperature (LST). Although the NDVI data is a favorable choice to provide supporting information for extracting the UAD, there are still a few drawbacks: 1) NDVI cannot differentiate impervious surface and bare soil effectively. It is difficult to describe the underlying surface of low vegetated areas; 2) it is not suitable for the identification of fast-growing cities. In most developed countries, the cities have been well planned and some of them even have a history of hundreds of years. The distributions of green land, residential areas and commercial zones would not change frequently. However, in developing countries, due to the rapid expansion and its resulting demolition and retrofitting, the distribution of vegetation tend to be irregular, (e.g., the bare soil and impervious surface are often mixed with vegetation). As a developing country with a vast territory, large population, and rapid economic growth (Wang et al., 2012), China has been experiencing a swift process of urbanization. The rapid urbanization of China has led to many complex problems, such as environmental problems and resource shortages. Most existing methods of urbanization study are applicable to developed countries, which would not suit the conditions of developing countries. Consequently, it is necessary to search a more suitable UAD extraction method to carry out a large-scale NTL study of developing countries like China.
Biophysical Composition Index (BCI), firstly proposed by Deng and Wu (2012), is a simple and convenient spectral enhancement technique, which is designed to successfully discriminate three urban land cover compositions, vegetation, impervious surfaces, and soil (Scott et al., 2014).It follows Ridd’s V-I-S conceptual model (Zhang et al., 2014) and was employed to quantitatively represent urban land cover principal materials for urban environment and landscape (Wu et al., 2014). Without extra shortwave infrared or thermal infrared information, BCI can be applied to images of multiple spectral resolution and spatial resolution. BCI shows a strong positive correlation with urban impervious surface and a high negative correlation with vegetation. Moreover, BCI is capable of differentiating between bare soil and impervious surface to compensate for the insufficiency of NDVI data. NTL data combined with BCI will improve the reliability of UAD extraction results, because of the ability of V-I-S enhancement and the detection of human activities. Hence, we propose the BCI Assisted NTL Index (BANI) combining BCI with NTL. This study maps China’s UAD by combining nighttime light and BCI through BANI index. We also perform accuracy assessments to quantify the efficiency of this method using the results of NDVI-assisted SVM classifier and Landsat TM/ETM+ data.

2 Study area and data

In this study, we mainly focus on the UAD extraction over China’s mainland. According to China Urban Statistical Yearbook 2013 complied by the National Bureau of Statistics of China at the end of 2012, the sum of provincial level administrative units of China’s mainland was 31, including 23 provinces, 4 municipalities, and 5 autonomous regions. The total number of cities was 657, including 15 sub-province cities, 270 prefecture-level cities, and 368 county-level cities. Land area under prefecture-level cities was 4.76 million square kilometers and the total population was 1.26 billion.

2.1 DMSP/OLS stable nighttime light data

Version 4 DMSP/OLS NTL Time Series datasets were taken from the website of the National Geophysical Data Center at National Oceanic and Atmospheric Administration (http://ngdc.noaa.gov/eog/download.html), which have a swath width of 3000 km and are aggregated and composited to 30 arc second grids. This data was the average of digital number values from annual VNIR channel stable nighttime light data, ranging from 0 to 63, which filters light pixels generated by accidental factors, such as gas flares and fires. Liu (2012) analyzed DMSP/OLS NTL statistical data from 1992 to 2010 in China and pointed out that DMSP/OLS NTL data in 2007 from satellite F16 could be used as the reference dataset, because it had the highest accumulated DN value. Therefore, the data employed in the research were DMSP/OLS stable NTL data from 2007, which were resampled with a 1 km spatial resolution and projected to Lambert Azimuthal Equal Area, and then clipped in accordance with the scale of China Vector Data.

2.2 MODIS data

The MODIS/Terra Surface Reflectance 8-Day L3 Global 500-m SIN Grid version 4 (MOD09A1) products were the primary source for the composition of BCI. The data were acquired from the Goddard Space Flight Center of National Aeronautics and Space Administration (NASA) LAADS Web (http://ladsweb.nascom.nasa.gov/data/search.html), which had been processed by radiometric calibration, atmospheric and aerosol correction, and edge distortion correction. To be consistent with DMSP/OLS NTL data, we selected 18 MOD09A1 datasets of good quality in September (the growing season) 2007 as the data source. MOD09A1 products contained quality assessment (QA) band. This band marked cloud state and water state, with which labeled data could be extracted through QA decoding for cloud mask and water mask. Besides that, re-projection and resampling were also conducted to correspond with DMSP/OLS NTL data.

2.3 Landsat TM/ETM+ data

Landsat TM/ETM+ images with a spatial resolution of 30 m were used for accuracy assessment. The data set was provided by the International Scientific & Technical Data Mirror Site, Computer Network Information Center, Chinese Academy of Sciences (http://www.gscloud. cn), on which radiometric and geometric corrections were processed. ETM+ data gap-fill process was accomplished by multi-images local adaptive regression analysis model (Liu et al., 2010).

2.4 Auxiliary data

Data collection included a map of 1:4,000,000 scale offered by the National Geomatics Center of China and the China Urban Statistical Yearbook 2007 complied by the National Bureau of Statistics of China.

3 Methodology

3.1 Division of study area

In the study of large-scale remote sensing classification and information extraction, if there were great differences of entropy between land information, classifying the study area on the basis of some strategies will contribute to the improvement of accuracy (Schneider et al., 2010). China’s mainland is so extensive that there were appreciable differences in population size and economic development level at different regions. It is necessary to divide the study area into sub-regions according to provincial characteristics. Yang et al. (2013) carried out a study of China’s mainland UAD extraction based on division using NTL data, with an average Kappa coefficient of 0.69. The definition of “city” in this paper is by virtue of population and economy. Thus, according to the differences of population and economy, China can be divided into eight economic zones according to the Strategy and Policy of Regional Coordinated Development Report by the Development Research Center (Liu et al., 2002). The economic zones are Northeast China (NEC), Northern Coastal China (NCC), Eastern Coastal China (ECC), Southern Coastal China (SCC), Middle Reaches of the Yellow River (MRYLR), Middle Reaches of the Yangtze River (MRYTR), Southwest China (SWC), and Northwest China (NWC). Moreover, one sample city from each urban development level was chosen from each economic zone for accuracy assessment. The eight selected cities are Beijing, Chengdu, Harbin, Huainan, Quanzhou, Urumqi, Wuxi, and Xi’an, as illustrated in Figure 1. Table 1 reports the total population and GDP of each economic zone and sample city.
Figure 1 Division of economic zones and location of sample cities
Table 1 Socio-economic statistics of each economic zone in 2007
Economic zones/
Sample cities
Average GDP
(billion RMB)
GDP per capita
(RMB)
Population
(million)
NEC / Harbin 779.11 / 175.67 21,197 / 37,052 108.52 / 4.75
NCC / Beijing 1351.98 / 920.76 38,003 / 60,045 190.58 / 11.42
ECC / Wuxi 1890.35 / 216.29 45,902 / 92,385 145.43 / 2.36
SCC / Quanzhou 1385.23 / 48.80 24,538 / 37,556 138.75 / 1.02
MRYLR / Xi’an 807.57 / 132.95 18,239 / 20,818 189.06 / 5.49
MRYTR / Huainan 782.38 / 24.77 13,844 / 15,851 225.40 / 1.66
SWC / Chengdu 5613.33 / 209.19 11,513 / 32,722 239.87 / 5.03
NWC / Urumqi 1648.11 / 80.97 13,672 / 31,806 61.58 / 2.22

3.2 Biophysical Composition Index (BCI) and NDVI calculations

(1) Processing of BCI
Two steps were performed in the pre-processing stage of the BCI calculation using MODIS surface reflectance data. Firstly, water pixels were masked out using QA of MOD09A1 products. Secondly, Tasseled Cap (TC) transformation was conducted. Transformation parameters proposed by Zhang et al. (2002) were adopted in the TC transformation of MOD09A1 data.
TCi=Cij*Bandj
where TCi (i=1, 2, 3) are the first three TC components, namely brightness (TC1), greenness (TC2), and wetness (TC3); Cij are the specific parameters of TC transformation listed in Table 2; Bandj are the band numbers of MOD09A1 data.
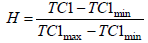
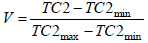
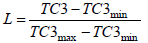
Table 2 Tasseled Cap coefficients for MODIS
Band 1
(Red)
Band 2
(Near-IR)
Band 3
(Blue)
Band 4
(Green)
Band 5
(M-IR)
Band 6
(M-IR)
Band 7
(M-IR)
TC1 0.3956 0.4718 0.3354 0.3834 0.3946 0.3434 0.2964
TC2 -0.3399 0.5952 -0.2129 -0.2222 0.4617 -0.1037 -0.4600
TC3 0.1084 0.0912 0.5065 0.4040 -0.2410 -0.4658 -0.5306
After the TC transformation, each derived TC component was linearly normalized within the range 0 to 1. Following the algorithm developed by Deng (2012), BCI was derived using Eq. (2) after pre-processing.
where H is “high albedo”, the normalized TC1; V is “vegetation”, the normalized TC2; and L is “low albedo”, the normalized TC3. These three components can be given by the following formula:
where TCmax and TCmin are the maximum and minimum values of the ith TC component, respectively.
Figure 2 compares the distribution of NTL and BCI at each economic zone in 2007. Urban areas, indicated by a white tone, have the highest BCI values (positive). Soil and mixed land cover have a BCI value close to zero, and are displayed with a tone of medium gray. Vegetation has the lowest BCI value (negative). Note that the west of MRYLR and the northwest of NWC are desert areas, which also have high BCI values and displayed with a tone of white.
For further analysis, the statistical characteristics of BCI in each economic zone are necessary. Arithmetic mean 
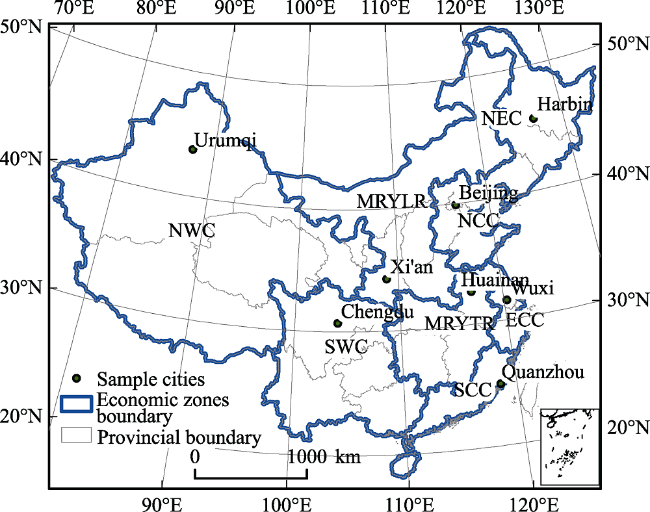
and standard deviation SBCI of MODIS BCI data in each economic zone were calculated for the preparation of training samples selection for the next step. Statistical results of MODIS BCI data in 2007 are shown in Table 3.
Figure 2 Contrast between NTL and BCI of the eight economic zones in 2007
Table 3 Discrepancies of MODIS BCI among eight economic zones in 2007
Economic zones SBCI + SBCI
NEC -0.1264 0.1002 -0.0262
NCC -0.0572 0.1273 0.0701
ECC -0.2808 0.1233 -0.1575
SCC -0.2342 0.1521 -0.0821
MRYLR 0.0681 0.1968 0.2649
MRYTR -0.3279 0.1041 -0.2238
SWC -0.5054 0.0400 -0.4654
NWC -0.4083 0.0979 -0.3104
(2) Processing of NDVI
To evaluate the performance of BCI-assisted classification for delineating UAD from NTL data, we employed NDVI-assisted classification for comparisons. NDVI data were calculated according to Eq. (6) using MOD09A1 datasets. Figure 3 shows the calculated NDVI data in China.
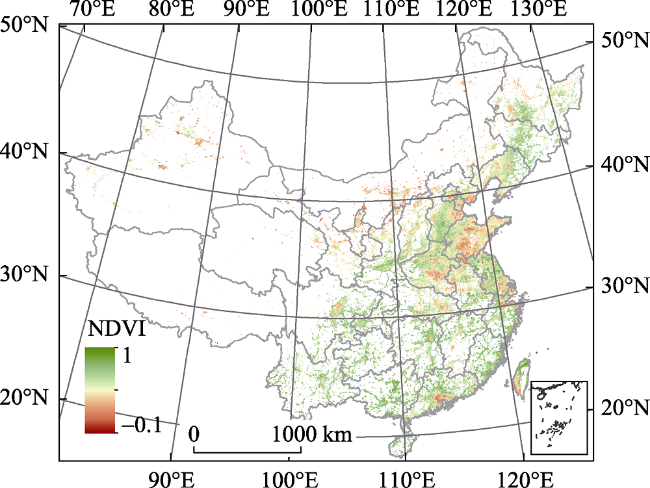
Figure 3 NDVI data calculated through MOD09A1 datasets of China in September 2007 and NDVI values show only light areas identified in DMSP/OLS NTL data

3.3 BANI: The BCI-Assisted NTL Index

We propose the BCI Assisted NTL Urban Index (BANI), which is based on the correlations between BCI, NTL, and urban surfaces. As illustrated in DMSP/OLS NTL data, urban areas are presented as light patches. Furthermore, closer towards the urban patch center, the pixels get brighter, as those areas are more developed. These areas are often the location with the higher density of impervious surfaces and the BCI values are between 0 and 1. BCI values of the rural surroundings with low presence of impervious surfaces are between -1 and 0. The BANI is to develop a robust index, which uses an urban impervious surface signal to increase inter-urban variability with NTL. The relationship between BCI and NTL is positive. While NTL values gradually increase towards the urban core, BCI values also get higher.We define BANI as:
BANI=NTL*(1+BCI)2
where BCI is derived from MODIS, with the range between -1 and 1. The BANI calculation results in highlight values of urban core areas. To make BANI values in different economic zones consistent, we normalize NTL values to the range of 0 to 1. Figure 4 shows the calculated BANI data through NTL data and BCI data of China. A BANI value of 0 means the pixel cover with a corresponding NTL value of 0 (dark area). A higher BANI value indicates this area is closer to urban core.
After BANI calculation, in terms of BANI value and BCI value, we set thresholds according to Tables 3 and 4. Then label pixels with values less than the threshold as non-urban pixels.
Table 4 Discrepancies of BANI among eight economic zones in 2007
Economic zones SBANI SBANI
NEC 0.0336 0.1094 0.1430
NCC 0.1430 0.2500 0.3930
ECC 0.1194 0.1886 0.3080
SCC 0.0712 0.1877 0.2589
MRYLR 0.0271 0.0995 0.1266
MRYTR 0.0230 0.0680 0.0910
SWC 0.0061 0.0220 0.0281
NWC 0.0013 0.0143 0.0156
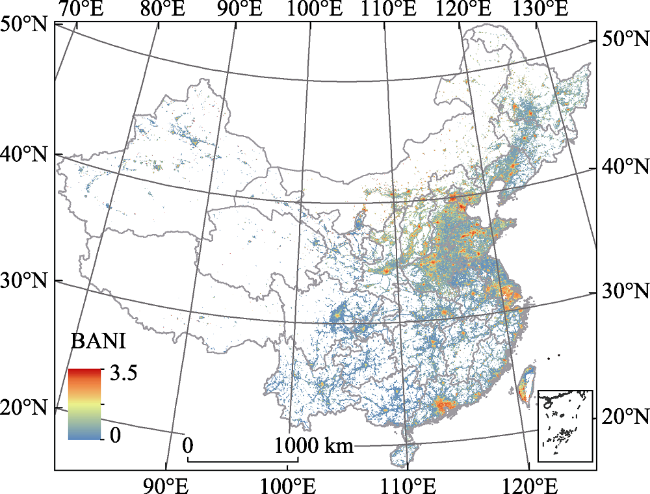
Figure 4 BANI data calculated through NTL data and BCI data of China in September 2007 and BANI values show only light areas identified in DMSP/OLS NTL data

3.4 NDVI-assisted SVM classification

The NDVI and DMSP/OLS NTL data were taken as the inputs of an iterative classification to classify urban and non-urban pixels, after initial training sets were built. Pixels with an OLS value of more than 30 were selected as potential pixels indicating an urbanized locality. Pixels with OLS values less than 30 and NDVI greater than 0.4 were set as non-urban samples. Then we perform SVM classification based on region-growing iterative method here. Post-classification procedure eliminated pseudo-urban pixels with NDVI values greater than 0.4 (Cao et al., 2009).

4 Results and Accuracy Assessment

Landsat TM/ETM+ images were most commonly available for detecting urban areas and mapping their changes (Forsythe, 2004; Mundia and Aniya, 2005; Zhou et al., 2008). The classification results using Landsat TM/ETM+ data were accurate enough to be used as reference maps for accuracy assessment since the fine spatial resolution (30 m) and spectrum information (Henderson et al., 2003; Small et al., 2005). In this study, the UAD results extracted from TM/ETM+ multi-spectral data were captured based on SVM classification and the selection of training samples were through visual interpretation. Selection of training samples is a decisive factor for classification results, thus it would affect the accuracy of comparisons. The selection of these cities took a full consideration of the scale of the city and the level of development, so that they could reflect the applicability of this method comprehensively. We used Landsat TM/ETM+ data of eight sample cities for qualitative and quantitative UAD extraction results after comparing BANI approach and NDVI-assisted classification. In addition, these results were resampled to 1 km spatial resolution.
First, qualitative analysis of UAD extraction results was carried out (Figures 5c, 5d, and 5e). Compared to the urban land information extracted from Landsat TM/ETM+ data, both NDVI-assisted and BANI method were capable of acquiring urban information effectively. However, for Chengdu, Huainan, Wuxi, Urumqi, and Xi'an, the latter worked better than NDVI-assisted SVM algorithm in subtle features. The results were closer to that of reference data and the outline was more detailed.
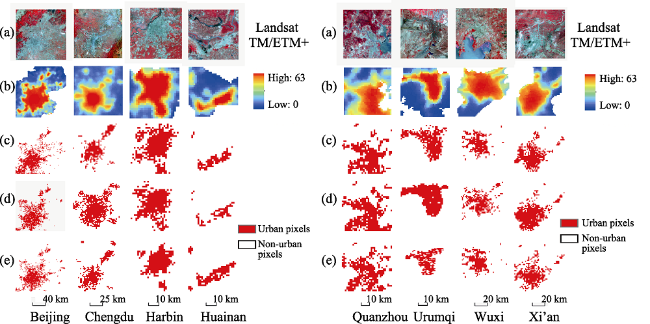
Figure 5 Landsat TM/ETM+ images (a); DMSP/OLS NTL images (b); Urban extent from Landsat TM/ETM+ classification (1 km) (c); Results of NDVI-assisted SVM method (d); Results of BANI approach (e)
We further analyzed UAD extraction results quantitatively. Accuracy assessments of UAD extraction results were performed (Table 5). The standards of these assessments include the number of urban pixels and two accuracy assessment indices of overall accuracy (OA) and Kappa coefficient. The OA and Kappa coefficients were calculated based on the error matrix from DMSP/OLS and Landsat TM/ETM+ results of each city. The OA of BANI algorithm ranged from 93.77% to 96.51%, and Kappa coefficient of that ranged from 0.79 to 0.88; while the OA and Kappa coefficient of NDVI-assisted SVM algorithm ranged from 86.11% to 92.18% and 0.47 to 0.63, respectively. The average OA and Kappa coefficient of BANI approach improved from 88.53% to 95.10% and from 0.56 to 0.84, respectively. It is possible to conclude that the accuracy of the former was better and that it had better coherency with TM/ETM+.
Table 5 Accuracy assessment of urban areas characteristic
Sample cities BANI algorithm NDVI-assisted SVM Comparisons
OA (%) Kappa OA (%) Kappa OA (%) Kappa
Beijing 94.18 0.88 90.27 0.57 3.91 0.31
Chengdu 96.51 0.87 86.74 0.47 9.77 0.40
Harbin 93.77 0.79 87.10 0.60 6.67 0.19
Huainan 96.33 0.87 92.18 0.48 4.15 0.39
Quanzhou 94.16 0.81 86.76 0.57 7.40 0.24
Wuxi 95.81 0.85 88.83 0.55 6.98 0.30
Urumqi 94.42 0.82 85.11 0.59 9.31 0.23
Xi’an 95.61 0.83 91.25 0.63 4.36 0.20
Average 95.10 0.84 88.53 0.56 6.57 0.28
Different cities present various land covers. Vegetation fraction is key to score the vegetation coverage of the land surface. Based on NDVI index, we adopted dimidiate pixel model to estimate the vegetation fraction of eight selected cities using Landsat TM/ETM data. Dimidiate pixel model assumed that spectral information observed by sensors consists of two parts, information contributed by the vegetation and the soil. Vegetation fraction is proposed by Eq. (8), in which NDVI is set as the input (Li et al., 2004).
where NDVIsoil is NDVI value of no vegetation pixel, NDVIveg is NDVI value of pure vegetation pixel. We did statistical analysis of NDVI values including accumulative percent of each economic zone. Accumulative percent means the percentage of the total NDVI value which is less than or equal to a certain value. Based on the NDVI accumulative percent of each zone (Li et al., 2004), the corresponding values of 5% confidence intervals were chosen as NDVIsoil . According to the results, we divided them into five levels, 0-0.2, 0.2-0.4, 0.4-0.6, 0.6-0.8 and 0.8-1.0 (Table 6). The degree of mixing of the impervious surface, bare soil and vegetation was great when the cumulative values were between 0.2 and 0.8. During this interval, land cover is made from a mix of impervious surfaces, vegetation, and soil, which is called hybrid interval. The accuracy of results for cities, particularly, with hybrid interval values above 56%, such as Chengdu, Wuxi and Huainan had a high accuracy and improved considerably. OA improved from 86.74%, 88.83% and 92.18% to 96.51%, 95.81% and 96.33%, respectively. And Kappa coefficient improved from 0.48, 0.55 and 0.48 to 0.87, 0.85 and 0.87, respectively. The accuracies of results for cities with hybrid interval values between 50% and 56% (Urumqi in NWC, Beijing in NCC and Xi’an in SWC) also reached a high accuracy and showed significant improvements. OA improved from 85.11%, 90.27% and 91.25% to 94.42%, 94.18% and 95.61%, respectively. Kappa coefficient improved from 0.59, 0.57 and 0.63 to 0.82, 0.88 and 0.83, respectively.
Overall, UAD as well as area statistics of the extraction results of the BANI approach were consistent with that of finer spatial resolution. The accuracy was better than that of NDVI-assisted SVM classification. Thus, the results of BANI method are capable of reflecting the exact urban land-use information in China’s mainland and are highly reliable.
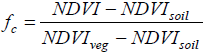
Table 6 The vegetation fraction percentage of each division in eight selected cities in 2007 (%)
Vegetation fraction 0-0.2 0.2-0.4 0.4-0.6 0.6-0.8 0.8-1.0
Beijing 29.72 19.78 15.78 16.80 17.92
Chengdu 18.16 17.69 22.52 22.78 18.86
Harbin 20.33 13.15 14.17 18.52 33.84
Huainan 17.31 12.52 20.63 23.15 26.39
Quanzhou 25.93 12.71 13.31 19.95 28.09
Wuxi 24.02 20.61 20.10 18.03 17.25
Urumqi 38.45 29.14 15.13 7.98 9.30
Xi’an 16.81 13.42 15.90 22.81 31.06
Figure 6 presents the urban land map of China in 2007 using BANI procedures. In 2007, there were 51,617 km2 of total urban land in China’s mainland. Among them, the area of urban land situated in the coastal areas of China, such as NCC (11,427 km2), ECC (7015 km2), and SCC (7391 km2) were much larger than those in land- locked regions of China, such as NWC (3331 km2) and SWC (4973 km2). The areas of urban land in central regions such as MRYLR, MRYTR and NEC were 6285 km2, 5179 km2 and 5998 km2.
Figure 6 China’s mainland urban land classified by BANI approach in 2007

5 Discussion and conclusion

This study proposed an index BANI, which combined with DMSP/OLS NTL data and BCI to map the urban areas of China’s mainland. This method effectively captured UAD and the average values of OA and Kappa coefficient reached 95.10% and 0.84, respectively.
We made a comparison of BANI approach and NDVI-assisted SVM algorithm through Landsat TM/ETM+ classification results of eight selected cities with different development level. From a qualitative point of view, the results of BANI approach showed a better result and a more detailed outline, similar to that of the reference data. Area statistical data of extraction results using BANI method were closer to the reference data. The accuracy of cities with hybrid interval values above 56% improved drastically. Hence, BANI algorithm is a reliable alternative method for extracting urban land data.
BCI has an advantage of enhancing vegetation, impervious surface, and soil to reflect the cover attributes of urban underlying surface. Combined with DMSP/OLS NTL data, BCI can improve UAD extraction accuracy of middle and small cities or developing cities. However, in terms of quantitative analysis and application, further investigations are required in the following aspects:
(1) Spatial visualization of the development level. Urbanization level index acquired based on NTL data, socio-economic statistic data, land use data and population grid data are combined to establish the relevant model to achieve spatialization of macro-scale economic development index (such as GDP, population, energy consumption, carbon emissions and primary productivity). Thus, spatialized socio-economic information is available for macro-economic and overall regional policy development.
(2) Application of new NTL data. The new NTL remote sensing data can detect nighttime light with finer spatial resolution and has a radiation-detecting performance, such as NPP/VIIRS data, EROS-B data, etc. Combining BCI information obtained from high spatial resolution data with these data, it is capable of improving NTL data details and deepening application fields.

The authors have declared that no competing interests exist.

[1]
Cao X, Chen J, Imura Het al., 2009. A SVM-based method to extract urban areas from DMSP-OLS and SPOT VGT data.Remote Sensing of Environment, 113(10): 2205-2209.Mapping urban areas at regional and global scales has become an urgent task because of the increasing pressures from rapid urbanization and associated environmental problems. Satellite imaging of stable anthropogenic lights from DMSP-OLS provides an accurate, economical, and straightforward way to map the global distribution of urban areas. To address problems in the thresholding methods that use empirical strategies or manual trial-and-error procedures, we proposed a support vector machine (SVM)-based region-growing algorithm to semi-automatically extract urban areas from DMSP-OLS and SPOT NDVI data. Several simple criteria were used to select SVM training sets of urban and non-urban pixels, and an iterative classification and training procedure was adopted to identify the urban pixels through region growing. The new method was validated using the extents of 25 Chinese cities, as classified by Landsat ETM+ images, and then compared with two common thresholding methods. The results showed that the SVM-based algorithm could not only achieve comparable results to the local-optimized threshold method, but also avoid its tedious trial-and-error procedure, suggesting that the new method is an easy and simple alternative for extracting urban extent from DMSP-OLS and SPOT NDVI data.

DOI

[2]
Deng C B, Wu C S, 2012. BCI: A biophysical composition index for remote sensing of urban environments.Remote Sensing of Environment, 127: 247-259.Understanding urban environments and their spatio-temporal changes is essential for regional and local planning and environmental management To facilitate monitoring and analyzing urban environments, remotely sensed data have been applied extensively because of its synoptic view and repeat coverage over large geographic areas. Compared with traditional per-pixel and sub-pixel image analyses, spectral indices have apparent advantages due to their easy implementation. However, most spectral indices are designed to highlight only one land cover, and confusion between other land cover types, in particular impervious surfaces and bare soil, has not been successfully addressed. This study proposes a biophysical composition index (BCI) for simple and convenient derivation of urban biophysical compositions for practical applications following Ridd's conceptual vegetation - impervious surface - soil triangle model by a reexamination of the Tasseled Cap (TC) transformation. Further, this research explores the applicability of BCI in various remotely sensed images at different spatial resolutions. Results indicate that, BCI has a closer relationship with impervious surface abundance than those of normalized difference vegetation index (NDVI), normalized difference built-up index (NDBI) and normalized difference impervious surface index (NDISI), with correlation coefficients of approximately 0.8 at various resolutions. Also, the performances of BCI in quantifying vegetation abundance are comparable with NDVI at all three spatial scales. Additionally, with much higher values of separability metrics than any other index, the study confirms that BCI was shown to be the most effective index of the four evaluated for separating impervious surfaces and bare soil.

DOI

[3]
Doll C N, 2008. CIESIN thematic guide to night-time light remote sensing and its applications. Center for International Earth Science Information Network of Columbia University, Palisades, NY.Night-time light imagery stands unique amongst remote sensing data sources as it offers a uniquely 'human' view of the Earth's surface. The presence of lighting across the globe is almost entirely due to some form of human activity be it settlements, shipping fleets, gas flaring or fires associated with swidden agriculture. This extensively illustrated guide introduces users to the types of night-time light data available, its characteristics and limitations. It details the distinguishing features of the stable lights, radiance calibrated and time series Average DN datasets. The latter currently spans the period 1992-2003. The spatial and temporal characteristics of the datasets are presented using a range of techniques including temporal color composites. Preliminary analysis of this time series reveals considerable differences in brightness between data collected from different platforms. The second part of the guide examines how this interesting data source has been used and may be used to derive useful information about human presence and practice on Earth. Topics range from population and light pollution to economic activity, greenhouse gas emissions and using night-time lights to help with disaster management. Consideration is also given to the ecological ramifications of night-time lighting. With these elements set out, the final section explores other potential sources of night-time light data and how future systems may enhance our existing capabilities to understand the human environment through this the observation of lights at night.

[4]
Elvidge C, Baugh K, Hobson Vet al., 1997a. Satellite inventory of human settlements using nocturnal radiation emissions: A contribution for the global toolchest.Global Change Biology, 3(5): 387-395.Time series data from the Defense Meteorological Satellite Program (DMSP) Operational Linescan System (OLS) have been used to derive georeferenced inventories of human settlements for Europe, North and South America, and Asia. The visible band of the OLS is intensified at night, permitting detection of nocturnal visible-near infrared emissions from cities, towns, and villages. The time series analysis makes it possible to eliminate ephemeral VNIR emission sources such as fire and to normalize for differences in the number of cloud-free observations. An examination of the area lit (km 2 ) for 52 countries indicates the OLS derived products may be used to perform the spatial apportionment of population and energy related greenhouse gas emissions.

DOI

[5]
Elvidge C D, Baugh K E, Kihn E Aet al., 1997b. Mapping city lights with nighttime data from the DMSP Operational Linescan System.Photogrammetric Engineering and Remote Sensing, 63(6): 727-734.The Defense Meteorological Satellite Program (DMSP) Operational Linescan System (OLS) has a unique capability to detect low levels of visible and near-infrared (VNIR) radiance at night. With the OLS "VIS" band data, it is possible to detect clouds illuminated by moonlight, plus lights from cities, towns, industrial sites, gas flares, and ephemeral events such as fires and lightning illuminated clouds. This paper presents methods which have been developed for detecting and geolocating VNIR emission sources with nighttime DMSP-OLS data and the analysis of image time series to identify spatially stable emissions from cities, towns, and industrial sites. Results are presented for the United States.

DOI

[6]
Elvidge C D, Cinzano P, Pettit D Ret al., 2007. The Nightsat mission concept.International Journal of Remote Sensing, 28(12): 2645-2670.Not Available

DOI

[7]
Forbes D J, 2013. Multi-scale analysis of the relationship between economic statistics and DMSP-OLS night light images.Giscience & Remote Sensing, 50(5): 483-499.Numerous studies have examined the correlation between socioeconomic statistics and night light (NL) imagery. Previous studies have shown that the NL data correlates well with gross domestic product (GDP) statistics. This study calls for a focus on process over correlation between the variables so as to better inform scaled models of the relationship. A focus on process is addressed in this study by examining the relationship between the variables at two scales and two time periods. The two scales examined are: States and Metropolitan Statistical Areas (MSA). The MSA scale exhibits a stronger relationship with the NLs over the State scale, and the results at either scale are consistent through time. However, the models examined here are miss-specified at all scales. Examination of outliers and residuals informs for future well-described models of the relationship.

DOI

[8]
Forsythe K W, 2004. Pansharpened Landsat 7 imagery for improved urban area classification.Geomatica, 58(1): 23-31.ABSTRACT Recent advances in the area of remotely sensed image sharpening or fusion have resulted in the complete retention of original multispectral data characteristics together with improved spatial resolution. Same- sensor sharpening of Landsat data has been possible since the launch of Landsat 7 in 1999 due to the addition of a 15-metre panchromatic band. Three image fusion methods (PCA, RGB-IHS, and PANSHARP) are compared, with the PANSHARP results being further evaluated in an urban change detection analysis. Regular monitoring is necessary to assess the impacts that a continuing urban population shift and its associated development have on cities and their surrounding regions. The extent of expansion and redevelopment in the Toronto (Canada) area is evaluated during a 3-year period from 1999 to 2002. The region continues to grow rapidly, despite sometimes challenging economic conditions in recent years. A yearly average of 10.6 km2 of new development was observed. Pansharpened data allowed for finer details to be distinguished than was previously possible with other Landsat imagery and the overall classification accuracy figure of almost 96% is approximately 5-10% higher than previous urban change detection results.

[9]
He C, Ma Q, Liu Zet al., 2013. Modeling the spatiotemporal dynamics of electric power consumption in Mainland China using saturation-corrected DMSP/OLS nighttime stable light data.International Journal of Digital Earth, 7(12): 1-22.Not Available

DOI

[10]
He C Y, Liu Z F, Tian Jet al., 2014. Urban expansion dynamics and natural habitat loss in China: A multiscale landscape perspective.Global Change Biology, 20: 2886-2902.China's extensive urbanization has resulted in a massive loss of natural habitat, which is threatening the nation's biodiversity and socioeconomic sustainability. A timely and accurate understanding of natural habitat loss caused by urban expansion will allow more informed and effective measures to be taken for the conservation of biodiversity. However, the impact of urban expansion on natural habitats is not well-understood, primarily due to the lack of accurate spatial information regarding urban expansion across China. In this study, we proposed an approach that can be used to accurately summarize the dynamics of urban expansion in China over two recent decades (1992-2012), by integrating data on nighttime light levels, a vegetation index, and land surface temperature. The natural habitat loss during the time period was evaluated at the national, ecoregional, and local scales. The results revealed that China had experienced extremely rapid urban growth from 1992 to 2012 with an average annual growth rate of 8.74%, in contrast with the global average of 3.20%. The massive urban expansion has resulted in significant natural habitat loss in some areas in China. Special attention needs to be paid to the Pearl River Delta, where 25.79% or 1518 km(2) of the natural habitat and 41.99% or 760 km(2) of the local wetlands were lost during 1992-2012. This raises serious concerns about species viability and biodiversity. Effective policies and regulations must be implemented and enforced to sustain regional and national in the context of rapid urbanization.

DOI PMID

[11]
He C Y, Shi P J, Li J Get al., 2006. Restoring urbanization process in China in the 1990s by using non-radiance calibrated DMSP/OLS nighttime light imagery and statistical data.Chinese Science Bulletin, 51(13): 1614-1620.

[12]
Henderson M, Yeh E T, Gong Pet al., 2003. Validation of urban boundaries derived from global night-time satellite imagery.International Journal of Remote Sensing, 24(3): 595-609.Not Available

DOI

[13]
Imhoff M L, Lawrence W T, Stutzer D Cet al., 1997. A technique for using composite DMSP/OLS ''city lights'' satellite data to map urban area.Remote Sensing of Environment, 61(3): 361-370.A Tresholding technique was used to convert a prototype “city lights” data set from the National Oceanic and Atmospheric Administration's National Geophysical Data Center (NOAAINGDC) into a map of “urban areas” for the continental United States. Thresholding was required to adapt the Defense Meteorological Satellite Program's Operational Linescan System (DMSPIOLS)-based NGDC data set into an urban map because the values reported in the prototype represent a cumulative percentage lighted for each pixel extracted from hundreds of nighttime cloud screened orbits, rather than any suitable land-cover classification. The cumulative percentage lighted data could not be used alone because the very high gain of the OLS nighttime photomultiplier configuration can. lead to a pixel (2.7X2.7 km) appearing “lighted” even with very low intensity, nonurban light sources. We found that a threshold of %89% yielded the best results, removing ephemeral light sources and “blooming” of light onto water when adjacent to cities while still leaving the dense urban core intact. This approach gave very good results when compared with the urban areas as defined by the 1990 U. S. Census; the “urban” area from our analysis being only 5% less than that of the Census. The Census was also used to derive population.- and housing-density statistics for the continent-wide “city lights” analysis; these averaged 1033 persons/km 2 and 426 housing units/ king, respectively. The use of a nighttime sensor to determine the location and estimate the density of population based on light sources has proved feasible in this exploratory effort. However, issues concerning the use of census data as a benchmark for evaluating the accuracy of remotely sensed imagery are discussed, and potential improvements in the sensor regarding spatial resolution, instrument gain, and pointing accuracy are addressed.

DOI

[14]
Li M, Wu B, Yan Cet al., 2004. Estimation of vegetation fraction in the upper basin of Miyun Reservoir by remote sensing.Resources Science, 26(4): 153-159. (in Chinese)Vegetation fraction is a most important index to score the vegetation coverage on the land surface. As one of the input parameters of soil loss equation for soil erosion assessment, it needs to be estimated quantificationally in regional scale. Based on the analysis of the current methods of measuring vegetation fraction (fc), this paper has developed the dimidiate pixel model for quantifying vegetation fraction from normalized difference vegetation index (NDVI=[NIR-R]/[NIR + R]), which is derive from the near red band and red band of the remotely sensed data. In the improved model, fc is calculated by the formula:fc = (NDVI-NDVIsoil)/(NDVIveg-NDVIsoil)where NDVIsoil and NDVIveg are two input parameters of the improved model, and they represent the NDVI value of pure pixel of barren soil and vegetation, respectively. According to two cases of practical requirement, the improved model gives the deducing process of such two parameters with the ancillary data of vegetation map and soil map. Then based on the division units extracted by overlaying the land cover database and soil type database, two vegetation fraction data sets in the Upper Basin of Miyun Reservoir have been estimated for each division unit from NDVI derived from Landsat TM data in spring and summer. Through validating with field-investigated data, which is obtained by calculating the vegetative proportion on the digital photography of each land cover, the average estimated accuracy of vegetation fraction of all land cover types is more than 85% in the study region. So the fc datasets are valid, and can be taken as one of the parameters to derive the soil loss volume. The result also suggests that it is feasible to use this improved model to estimate vegetation fraction from remotely sensing data.

DOI

[15]
Liu J Y, Deng X Z, Liu M Let al., 2002. Study on the spatial patterns of land-use change and analyses of driving forces in northeastern China during 1990-2000.Chinese Geographical Science, 12(4): 299-308.Land-use change is an important aspect of global environment change. It is, in a sense, the direct resultof human activities influencing our physical environment. Supported by the dynamic serving system of national resources,including both the environment database and GIS technology, this paper analyzed the land-use change in northeastern Chi-na in the past ten years (1990 -2000). It divides northeastern China into five land-use zones based on the dynamic de-gree (DD) of land-use: woodland/grassland - arable land conversion zone, dry land - paddy field conversion zone, ur-ban expansion zone, interlocked zone of farming and pasturing, and reclamation and abandoned zone. In the past tenyears, land-use change of northeastern China can be generalized as follows: increase of cropland area was obvious, pad-dy field and dry land increased by 74. 9 and 276. 0 thousand ha respectively; urban area expanded rapidly, area of townand rural residence increased by 76. 8 thousand ha; area of forest and grassland decreased sharply with the amount of1399. 0 and 1521.3 thousand ha respectively; area of water body and unused land increased by 148.4 and 513.9 thou-sand ha respectively. Besides a comprehensive analysis of the spatial patterns of land use, this paper also discusses thedriving forces in each land-use dynamic zones. The study shows that some key biophysical factors affect conspicuously theconversion of different land-use types. In this paper, the relationships between land-use conversion and DEM, accumulat-ed temperature(鈮10鈩) and precipitation were analysed and represented. We conclude that the land-use changes in north-east China resulted from the change of macro social and economic factors and local physical elements. Rapid populationgrowth and management changes, in some sense, can explain the shaping of woodland/grassland-cropland conversionzone. The conversion from dry land to paddy field in the dry land - paddy field conversion zone, apart from the physicalelements change promoting the expansion of paddy field, results from two reasons: one is that the implementation of mar-ket-economy in China has given farmers the right to decide what they plant and how they plant their crops, the other fac-tor is originated partially from the change of dietary habit with the social and economic development The conversion frompaddy field to dry land is caused primarily by the shortfall of irrigation water, which in turnis caused by poor water alloca-tion managed by local governments. The shaping of the reclamation and abandoned zone is partially due to the lack of environ-ment protection consciousness among pioneer settlers. The reason for the conversion from grassland to cropland is the relative-ly higher profits of farming than that of pasturing in the interlocked zone of farming and pasturing. In northeastern China,the rapid expansion of built-up areas results from two factors: the first is its small number of towns; the second comesfrom the huge potential for expansion of existing towns and cities. It is noticeable that urban expansion in the northeasternChina is characterized by gentle topographic relief and low population density. Physiognomy, transportation and economyexert great influences on the urban expansion.

DOI

[16]
Liu J Y, Zhang Z X, Xu X Let al., 2010. Spatial patterns and driving forces of land use change in China during the early 21st century.Journal of Geographical Sciences, 20(4): 483-494.Land use and land cover change as the core of coupled human-environment systems has become a potential field of land change science (LCS) in the study of global environmental change. Based on remotely sensed data of land use change with a spatial resolution of 1 km 脳 1 km on national scale among every 5 years, this paper designed a new dynamic regionalization according to the comprehensive characteristics of land use change including regional differentiation, physical, economic, and macro-policy factors as well. Spatial pattern of land use change and its driving forces were investigated in China in the early 21st century. To sum up, land use change pattern of this period was characterized by rapid changes in the whole country. Over the agricultural zones, e.g., Huang-Huai-Hai Plain, the southeast coastal areas and Sichuan Basin, a great proportion of fine arable land were engrossed owing to considerable expansion of the built-up and residential areas, resulting in decrease of paddy land area in southern China. The development of oasis agriculture in Northwest China and the reclamation in Northeast China led to a slight increase in arable land area in northern China. Due to the "Grain for Green" policy, forest area was significantly increased in the middle and western developing regions, where the vegetation coverage was substantially enlarged, likewise. This paper argued the main driving forces as the implementation of the strategy on land use and regional development, such as policies of "Western Development", "Revitalization of Northeast", coupled with rapidly economic development during this period.

DOI

[17]
Liu Z F, He C Y, Zhang Q Fet al., 2012. Extracting the dynamics of urban expansion in China using DMSP-OLS nighttime light data from 1992 to 2008.Landscape and Urban Planning, 106(1): 62-72.Timely and accurate information about the dynamics of urban expansion is vital to reveal the relationships between urban expansion and the ecosystem, to optimize land use patterns, and to promote the effective development of cities in China. Nighttime stable light data from the Defense Meteorological Satellite Program's Operational Line-scan System (DMSP-OLS) Nighttime Lights Time Series dataset provide a new source of information that can quickly reveal the dynamics of urban expansion. However, the DMSP-OLS sensor has no on-board calibration, which makes it difficult to directly compare time series data from multiple satellites. This study developed a new method for systematically correcting multi-year multi-satellite nighttime stable lights data and rapidly extracting the dynamics of urban expansion based on this corrected data for China from 1992 to 2008. The results revealed that the proposed method effectively reduced abnormal discrepancy within the nighttime stable light data and improved continuity and comparability. The dynamics of urban expansion in China from 1992 to 2008 were extracted with an average overall accuracy of 82.74% and an average Kappa of 0.40.

DOI

[18]
Lu D S, Li G Y, Kuang W Het al., 2014. Methods to extract impervious surface areas from satellite images.International Journal of Digital Earth, 7(2): 93-112.中国科学院机构知识库(中国科学院机构知识库网格(CAS IR GRID))以发展机构知识能力和知识管理能力为目标,快速实现对本机构知识资产的收集、长期保存、合理传播利用,积极建设对知识内容进行捕获、转化、传播、利用和审计的能力,逐步建设包括知识内容分析、关系分析和能力审计在内的知识服务能力,开展综合知识管理。

DOI

[19]
Lu D S, Tian H Q, Zhou G Met al., 2008. Regional mapping of human settlements in southeastern China with multisensor remotely sensed data.Remote Sensing of Environment, 112(9): 3668-3679.Mapping human settlements from remotely sensed data at regional and global scales has attracted increasingly attention but remains a challenge. The thresholding technique is a common approach for settlement mapping based on the DMSP-OLS data. However, this approach often omits the areas with small proportional settlements such as towns and villages and overestimates urban extents, resulting in information loss of spatial patterns. This paper explored an integrated approach based on a combined use of multiple remotely sensed data to map settlements in southeastern China. Human settlements for selected sites were mapped from Landsat ETM+ images with a hybrid approach and they were used as reference data. The DMSP-OLS and Terra MODIS NDVI data were combined to develop a settlement index image. This index image was used to map a pixel-based settlement image with expert rules. A regression model was established to estimate fractional settlements at the regional scale, which the DMSP-OLS and MODIS NDVI data were used as independent variables and the settlement data derived from ETM+ images were used as a dependent variable. This research indicated that a combination of DMSP-OLS and NDVI variables provided a better estimation performance than single DMSP-OLS or NDVI variable, and the integrated approach for settlement mapping at the regional scale was promising. Compared to the results from the traditional thresholding technique, the estimated fractional settlement image in this paper greatly improved the spatial patterns of settlement distribution and accuracy of settlement areas. This paper provided a rapid and accurate approach to estimate fractional settlements from coarse spatial resolution images at the regional scale by combining a limited number of medium spatial resolution images. This research is especially valuable for timely updating settlement databases at regional and global scales with limited time, labor, and cost.

DOI

[20]
Ma T, Zhou C H, Pei Tet al., 2012. Quantitative estimation of urbanization dynamics using time series of DMSP/OLS nighttime light data: A comparative case study from China's cities.Remote Sensing of Environment, 124: 99-107.Urbanization process involving increased population size, spatially extended land cover and intensified economic activity plays a substantial role in anthropogenic environment changes. Remotely sensed nighttime lights datasets derived from the Defense Meteorological Satellite Program's Operational Linescan System (DMSP/OLS) provide a consistent measure for characterizing trends in urban sprawl over time (Sutton, 2003). The utility of DMSP/OLS imagery for monitoring dynamics in human settlement and economic activity at regional to global scales has been widely verified in previous studies through statistical correlations between nighttime light brightness and demographic and economic variables ( 聽and聽 ). The quantitative relationship between long-term nighttime light signals and urbanization variables, required for extensive application of DMSP/OLS data for estimating and projecting the trajectory of urban development, however, are not well addressed for individual cities at a local scale. We here present analysis results concerning quantitative responses of stable nighttime lights derived from time series of DMSP/OLS imagery to changes in urbanization variables during 1994鈥2009 for more than 200 prefectural-level cities and municipalities in China. To identify the best-fitting model for nighttime lights-based measurement of urbanization processes with different development patterns, we comparatively use three regression models: linear, power-law and exponential functions to quantify the long-term relationships between nighttime weighted light area and four urbanization variables: population, gross domestic product (GDP), built-up area and electric power consumption. Our results suggest that nighttime light brightness could be an explanatory indicator for estimating urbanization dynamics at the city level. Various quantitative relationships between urban nighttime lights and urbanization variables may indicate diverse responses of DMSP/OLS nighttime light signals to anthropogenic dynamics in urbanization process in terms of demographic and economic variables. At the city level, growth in weighted lit area may take either a linear, concave (exponential) or convex (power law) form responsive to expanding human population and economic activities during urbanization. Therefore, in practice, quantitative models for using DMSP/OLS data to estimate urbanization dynamics should vary with different patterns of urban development, particularly for cities experiencing rapid urban growth at a local scale.

DOI

[21]
Mundia C, Aniya M, 2005. Analysis of land use/cover changes and urban expansion of Nairobi city using remote sensing and GIS.International Journal of Remote Sensing, 26(13): 2831-2849.Not Available

DOI

[22]
Pandey B, Joshi P K, Seto K C, 2013. Monitoring urbanization dynamics in India using DMSP/OLS night time lights and SPOT-VGT data.International Journal of Applied Earth Observation and Geoinformation, 23: 49-61.India is a rapidly urbanizing country and has experienced profound changes in the spatial structure of urban areas. This study endeavours to illuminate the process of urbanization in India using Defence Meteorological Satellites Program - Operational Linescan System (DMSP-OLS) night time lights (NTLs) and SPOT vegetation (VGT) dataset for the period 1998-2008. Satellite imagery of NTLs provides an efficient way to map urban areas at global and national scales. DMSP/OLS dataset however lacks continuity and comparability; hence the dataset was first intercalibrated using second order polynomial regression equation. The intercalibrated dataset along with SPOT-VGT dataset for the year 1998 and 2008 were subjected to a support vector machine (SVM) method to extract urban areas. SVM is semi-automated technique that overcomes the problems associated with the thresholding methods for NTLs data and hence enables for regional and national scale assessment of urbanization. The extracted urban areas were validated with Google Earth images and global urban extent maps. Spatial metrics were calculated and analyzed state-wise to understand the dynamism of urban areas in India. Significant changes in urban proportion were observed in Tamil Nadu, Punjab and Kerala while other states also showed a high degree of changes in area wise urban proportion.

DOI

[23]
Potere D, Schneider A, Angel Set al., 2009. Mapping urban areas on a global scale: which of the eight maps now available is more accurate?International Journal of Remote Sensing, 30(24): 6531-6558.Eight groups from government and academia have created 10 global maps that offer a ca 2000 portrait of land in urban use. Our initial investigation found that their estimates of the total amount of urban land differ by as much as an order of magnitude (0.27-3.52 脳106 km2). Since it is not possible for these heterogeneous maps to all represent urban areas accurately, we undertake the first global accuracy assessment of these maps using a two-tiered approach that draws on a stratified random sample of 10 000 high-resolution Google Earth validation sites and 140 medium-resolution Landsat-based city maps. Employing a wide range of accuracy measures at different spatial scales, we conclude that the new MODIS 500 m resolution global urban map has the highest accuracy, followed by a thresholded version of the Global Impervious Surface Area map based on the Night-time Lights and LandScan datasets.

DOI

[24]
Schneider A, 2012. Monitoring land cover change in urban and peri-urban areas using dense time stacks of Landsat satellite data and a data mining approach.Remote Sensing of Environment, 124: 689-704.

[25]
Schneider A, Friedl M A, Potere D, 2010. Mapping global urban areas using MODIS 500-m data: New methods and datasets based on 'urban ecoregions'.Remote Sensing of Environment, 114(8): 1733-1746.Although cities, towns and settlements cover only a tiny fraction (<021%) of the world's surface, urban areas are the nexus of human activity with more than 50% of the population and 70–90% of economic activity. As such, material and energy consumption, air pollution, and expanding impervious surface are all concentrated in urban areas, with important environmental implications at local, regional and potentially global scales. New ways to measure and monitor the built environment over large areas are thus critical to answering a wide range of environmental research questions related to the role of urbanization in climate, biogeochemistry and hydrological cycles. This paper presents a new dataset depicting global urban land at 500-m spatial resolution based on MODIS data (available at http://sage.wisc.edu/urbanenvironment.html ). The methodological approach exploits temporal and spectral information in one year of MODIS observations, classified using a global training database and an ensemble decision-tree classification algorithm. To overcome confusion between urban and built-up lands and other land cover types, a stratification based on climate, vegetation, and urban topology was developed that allowed region-specific processing. Using reference data from a sample of 140 cities stratified by region, population size, and level of economic development, results show a mean overall accuracy of 93% ( k 02=020.65) at the pixel level and a high level of agreement at the city scale ( R 2 02=020.90).

DOI

[26]
Scott D, Petropoulos G, Moxley Jet al., 2014. Quantifying the physical composition of urban morphology throughout wales based on the time series (1989-2011) analysis of Landsat TM/ETM+ images and supporting GIS data.Remote Sensing, 6(12): 11731-11752.Not Available

DOI

[27]
Small C, Elvidge C D, 2013. Night on Earth: Mapping decadal changes of anthropogenic night light in Asia.International Journal of Applied Earth Observation and Geoinformation, 22: 40-52.The defense meteorological satellite program (DMSP) operational linescan system (OLS) sensors have imaged emitted light from Earth's surface since the 1970s. Temporal overlap in the missions of 5 OLS sensors allows for intercalibration of the annual composites over the past 19 years ( Elvidge et al., 2009 ). The resulting image time series captures a spatiotemporal signature of the growth and evolution of lighted human settlements and development. We use empirical orthogonal function (EOF) analysis and the temporal feature space to characterize and quantify patterns of temporal change in stable night light brightness and spatial extent since 1992. Temporal EOF analysis provides a statistical basis for representing spatially abundant temporal patterns in the image time series as uncorrelated vectors of brightness as a function of time from 1992 to 2009. The variance partition of the eigenvalue spectrum combined with temporal structure of the EOFs and spatial structure of the PCs provides a basis for distinguishing between deterministic multi-year trends and stochastic year-to-year variance. The low order EOFs and principal components (PC) space together discriminate both earlier (1990s) and later (2000s) increases and decreases in brightness. Inverse transformation of these low order dimensions reduces stochastic variance sufficiently so that tri-temporal composites depict potentially deterministic decadal trends. The most pronounced changes occur in Asia. At critical brightness threshold we find an 18% increase in the number of spatially distinct lights and an 80% increase in lighted area in southern and eastern Asia between 1992 and 2009. During this time both China and India experienced a 6520% increase in number of lights and a 65270% increase in lighted area – although the timing of the increase is later in China than in India. Throughout Asia a variety of different patterns of brightness increase are apparent in tri-temporal brightness composites – as well as some conspicuous areas of apparently decreasing background luminance and, in many places, intermittent light suggesting development of infrastructure rather than persistently lighted development. Vicarious validation using higher resolution Landsat imagery verifies multiple phases of urban growth in several cities as well as the consistent presence of low DN (<6515) background luminance for many agricultural areas. Lights also allow us to quantify changes in the size distribution and connectedness of different intensities of development. Over a wide range of brightnesses, the size distributions of spatially contiguous lighted area are consistent with power laws with exponents near 611 as predicted by Zipf's Law for cities. However, the larger lighted segments are much larger than individual cities; they correspond to vast spatial networks of contiguous development ( Small et al., 2011 ).

DOI

[28]
Small C, Elvidge C D, Balk D.et al., 2011. Spatial scaling of stable night lights.Remote Sensing of Environment, 115(2): 269-280.City size distributions, defined on the basis of population, are often described by power laws. Zipf's Law states that the exponent of the power law for rank-size distributions of cities is near 鈭1. Verification of power law scaling for city size distributions at continental and global scales is complicated by small sample sizes, inappropriate estimation techniques, inconsistent definitions of urban extent and variations in the accuracy and spatial resolution of census administrative units. We attempt to circumvent some of these complications by using a continuous spatial proxy for anthropogenic development and treat it as a spatial complement to population distribution. We quantify the linearity and exponent of the rank-size distribution of spatially contiguous patches of stable night light over a range of brightnesses corresponding to different intensities of development. Temporally stable night lights, as measured by the Defense Meteorological Satellite Program-Operational Line Scanner (DMSP-OLS), provide a unique proxy for anthropogenic development. Brightness and spatial extent of emitted light are correlated to population density (Sutton et al., 2001), built area density (Elvidge et al., 2007c) and economic activity ( and ) at global scales and within specific countries. Using a variable brightness threshold to derive spatial extent of developed land area eliminates the complication of administrative definitions of urban extent and makes it possible to test Zipf's Law in the spatial dimension for a wide range of anthropogenic development. Higher brightness thresholds generally correspond to more intense development while lower thresholds extend the lighted area to include smaller settlements and less intensively developed peri-urban and agricultural areas. Using both Ordinary Least Squares (OLS) and Maximum Likelihood Estimation (MLE) to estimate power law linearity and exponent of the resulting rank-size distributions across a range of upper tail cutoffs, we consistently find statistically significant exponents in the range 鈭0.95 to 鈭1.11 with an abrupt transition to very large, extensively connected, spatial networks of development near the low light detection limit of the sensor. This range of exponents and transition are observed at both continental and global scales. The results suggest that Zipf's Law also holds for spatial extent of anthropogenic development across a range of intensities at both continental and global scales. The implication is that the dynamics of urban growth and development may be represented as spatial phase transitions when the spatial extent and intensity of development are treated as continuous variables rather than discrete entities.

DOI

[29]
Small C, Pozzi F, Elvidge C D, 2005. Spatial analysis of global urban extent from DMSP-OLS night lights.Remote Sensing of Environment, 96(3/4): 277-291.Previous studies of DMSP-OLS stable night lights have shown encouraging agreement between temporally stable lighted areas and various definitions of urban extent. However, these studies have also highlighted an inconsistent relationship between the actual lighted area and the boundaries of the urban areas considered. Applying detection frequency thresholds can reduce the spatial overextent of lighted area (“blooming”) but thresholding also attenuates large numbers of smaller lights and significantly reduces the information content of the night lights datasets. Spatial analysis of the widely used 1994/1995 stable lights data and the newly released 1992/1993 and 2000 stable lights datasets quantifies the tradeoff between blooming and attenuation of smaller lights. For the 1992/1993 and 2000 datasets, a 14% detection threshold significantly reduces blooming around large settlements without attenuating many individual small settlements. The corresponding threshold for the 1994/1995 dataset is 10%. The size–frequency distributions of each dataset retain consistent shapes for increasing thresholds while the size–area distributions suggest a quasi-uniform distribution of lighted area with individual settlement size between 10 and 1000 km equivalent diameter. Conurbations larger than 80 km diameter account for 0290% can often reconcile lighted area with built area in the 1994/1995 dataset but there is not one threshold that works for a majority of the 17 cities considered. Even 100% thresholds significantly overestimate built area for the 1992/1993 and 2000 datasets. Comparison of lighted area with blooming extent for 10 lighted islands suggests a linear proportionality of 1.25 of lighted to built diameter and an additive bias of 2.7 km. While more extensive analyses are needed, a linear relationship would be consistent with a physical model for atmospheric scattering combined with a random geolocation error. A Gaussian detection probability model is consistent with an observed sigmoid decrease of detection frequency for settlements <0210 km diameter. Taken together, these observations could provide the basis for a scale-dependent blooming correction procedure that simultaneously reduces geolocation error and scattering induced blooming.

DOI

[30]
Wang W, Cheng H, Zhang L, 2012. Poverty assessment using DMSP/OLS night-time light satellite imagery at a provincial scale in China.Advances in Space Research, 49(8): 1253-1264.All countries around the world and many international bodies, including the United Nations Development Program (UNDP), United Nations Food and Agricultural Organization (FAO), the International Fund for Agricultural Development (IFAD) and the International Labor Organization (ILO), have to eliminate rural poverty. Estimation of regional poverty level is a key issue for making strategies to eradicate poverty. Most of previous studies on regional poverty evaluations are based on statistics collected typically in administrative units. This paper has discussed the deficiencies of traditional studies, and attempted to research regional poverty evaluation issues using 3-year DMSP/OLS night-time light satellite imagery. In this study, we adopted 17 socio-economic indexes to establish an integrated poverty index (IPI) using principal component analysis (PCA), which was proven to provide a good descriptor of poverty levels in 31 regions at a provincial scale in China. We also explored the relationship between DMSP/OLS night-time average light index and the poverty index using regression analysis in SPSS and a good positive linear correlation was modelled, with Requal to 0.854. We then looked at provincial poverty problems in China based on this correlation. The research results indicated that the DMSP/OLS night-time light data can assist analysing provincial poverty evaluation issues.

DOI

[31]
Weng Q H, 2012. Remote sensing of impervious surfaces in the urban areas: Requirements, methods, and trends.Remote Sensing of Environment, 117: 34-49.The knowledge of impervious surfaces, especially the magnitude, location, geometry, spatial pattern of impervious surfaces and the perviousness-imperviousness ratio, is significant to a range of issues and themes in environmental science central to global environmental change and human-environment interactions. Impervious surface data is important for urban planning and environmental and resources management. Therefore, remote sensing of impervious surfaces in the urban areas has recently attracted unprecedented attention. In this paper, various digital remote sensing approaches to extract and estimate impervious surfaces will be examined. Discussions will focus on the mapping requirements of urban impervious surfaces. In particular, the impacts of spatial, geometric, spectral, and temporal resolutions on the estimation and mapping will be addressed, so will be the selection of an appropriate estimation method based on remotely sensed data characteristics. This literature review suggests that major approaches over the past decade include pixel-based (image classification, regression, etc.), sub-pixel based (linear spectral unmixing, imperviousness as the complement of vegetation fraction etc.), object-oriented algorithms, and artificial neural networks. Techniques, such as data/image fusion, expert systems, and contextual classification methods, have also been explored. The majority of research efforts have been made for mapping urban landscapes at various scales and on the spatial resolution requirements of such mapping. In contrast, there is less interest in spectral and geometric properties of impervious surfaces. More researches are also needed to better understand temporal resolution, change and evolution of impervious surfaces over time, and temporal requirements for urban mapping. It is suggested that the models, methods, and image analysis algorithms in urban remote sensing have been largely developed for the imagery of medium resolution (10-100 m). The advent of high spatial resolution satellite images, spaceborne hyperspectral images, and LiDAR data is stimulating new research idea, and is driving the future research trends with new models and algorithms.

DOI

[32]
Wu C, Deng C, Jia X, 2014. Spatially constrained multiple endmember spectral mixture analysis for quantifying subpixel urban impervious surfaces.IEEE Journal of Selected Topics in Applied Earth Observations & Remote Sensing, 7(6): 1976-1984.Multiple endmember spectral mixture analysis (MESMA) has been extensively employed to accommodate endmember variability associated with the mixed pixel problem in remote sensing imagery. However, endmember extraction is a critical step in the application of MESMA. Considering that spatial information can be helpful for selecting local representative endmembers, this paper develops a spatially constrained MESMA method, with which multiple endmembers for each class are automatically derived within a predefined neighborhood. Two specific novelties are: 1) to identify all the endmembers over the whole image scene for each class through a classification tree approach; and 2) to generate spatially constrained endmembers for the neighborhood of each target pixel of the image through a k-means clustering method. MESMA is then performed using the derived spatially constrained endmembers. This proposed method was applied to a Landsat Enhanced Thematic Mapper (ETM+) image for examining subpixel urban impervious surfaces, and its performance was compared with that of a global MESMA method. The results suggest that spatially constrained MESMA is able to yield adequate estimates, supported by a relatively decent precision and low bias (10.68% for mean absolute error and -3.58% for systematic error).

DOI

[33]
Wu J S, Wang Z, Li W Fet al., 2013. Exploring factors affecting the relationship between light consumption and GDP based on DMSP/OLS nighttime satellite imagery.Remote Sensing of Environment, 134: 111-119.We consider night light as a type of consumer goods and propose a model for factors affecting the relationship between night lights and GDP. It is then decomposed into agricultural and non-agricultural productions. Further, the model is modified to determine how the factors affect residents' propensity to consume lights. Models are tested with time-fixed regression on a set of 15-year panel data of 169 countries globally and regionally. We find that light consumption propensity is affected by GDP per capita, latitude, spatial distribution of human activities and gross saving rate, and that light consumption per capita has an inverted-U relationship with GDP per capita.

DOI

[34]
Yang Y, He C Y, Zhang Q Fet al., 2013. Timely and accurate national-scale mapping of urban land in China using Defense Meteorological Satellite Program's Operational Linescan System nighttime stable light data. Journal of Applied Remote Sensing, 7(1) 073535: 1-18.Urban land accounts for a small fraction of the Earth's surface area but rapid increases in urban land have a disproportionate influence on the environment. China is a living laboratory in urbanization and has witnessed fast urban growth in recent decades. The timely and accurate mapping of urban land in China is an urgent and basic issue toward clarifying the urbanization process and revealing its environmental impacts. Nighttime stable light (NSL) data obtained by the Defense Meteorological Satellite Program's Operational Linescan System (DMSP/OLS) can provide an economical way to map urban land nationwide. However, it is difficult to apply existing methods to accurately extract urban land from DMSP/OLS NSL data covering the entirety of China due to China's large area and substantial regional variation. A stratified support vector machine (SSVM)-based method used to map the urban land in China in 2008 at a national scale using DMSP/OLS NSL and SPOT normalized difference vegetation index data is presented. The results show that measurement of urban land in China in 2008 using SSVM achieves an average overall accuracy of 90% and an average Kappa of 0.69. The success of this research demonstrates the great potential of SSVM for clarifying the urbanization process in continental and global research.

DOI

[35]
Zhang Q L, Schaaf C, Seto K C, 2013. The vegetation adjusted NTL urban index: A new approach to reduce saturation and increase variation in nighttime luminosity.Remote Sensing of Environment, 129: 32-41.The science and policy communities increasingly require information about inter-urban variability in form, infrastructure, and energy use for cities globally and in a timely manner. Nighttime light (NTL) data from the Defense Meteorological Satellite Program/Operational Linescan System (DMSP/OLS) are able to provide information on nighttime luminosity, a correlate of the built environment and energy consumption. Although NTL data are used to map aggregate measures of urban areas such as total area extent, their ability to characterize inter-urban variation is limited due to saturation of the data values, especially in urban cores. Here we propose a new spectral index, the Vegetation Adjusted NTL Urban Index (VANUI), which combines MODIS NDVI with NTL, to achieve three key goals. First, the index reduces the effects of NTL saturation. Second, the index increases variation of the NTL signal, especially within urban areas. Third, the index corresponds to biophysical and urban characteristics. Additionally, the index is intuitive, simple to implement, and enables rapid characterization of inter-urban variability in nighttime luminosity. Assessments of VANUI show that it significantly reduces NTL saturation and increases variation of data values in core urban areas. As such, VANUI can be useful for studies of urban structure, energy use, and carbon emissions.

DOI

[36]
Zhang X Y, Schaaf C B, Friedl M Aet al., 2002. MODIS tasseled cap transformation and its utility. IGARSS 2002: IEEE International Geoscience and Remote Sensing Symposium and 24th Canadian Symposium on Remote Sensing,Vols I-VI, Proceedings, 1063-1065.A time series of globally distributed spectral MODIS NBARs (Nadir Bidirectional-reflectance-distribution-function Adjusted surface Reflectance) was used to determine initial tasseled cap coefficients. An assessment of an annual time series of tasseled cap features indicated their utility for detecting vegetation phenological cycles. The comparison analysis showed that the temporal pattern of NBAR greenness was closely correlated with the Enhanced Vegetation Index (EVI), while NBAR brightness matched MODIS global broadband albedos. Thresholded global NBAR wetnesses appear to relate to MODIS snow and ice presence as determined by the Normalized Difference Snow Index (NDSI).

DOI

[37]
Zhang Y, Zhang H, Lin H, 2014. Improving the impervious surface estimation with combined use of optical and SAR remote sensing images.Remote Sensing of Environment, 141(2): 155-167.Accurate mapping of urban impervious surfaces is important but challenging due to the diversity of urban land covers. This study presents an effort to synergistically combine optical and SAR data to improve the mapping of impervious surfaces. Three pairs of optical and SAR images, Landsat ETM聽+ and ENVISAT ASAR, SPOT-5 and ENVISAR ASAR, and SPOT-5 and TerraSAR-X, were selected in three study areas to validate the effectiveness of the methods in this study. The potential of Random Forest (RF) was evaluated with parameter optimization for combining the optical and SAR images. Experiment results demonstrate some interesting findings. Firstly, the built-in out-of-bag (OOB) error is insufficient for accuracy assessment, and an assessment with additional reference data is required for combining optical and SAR images using RF. Secondly, the optimal number of variables ( m ) for splitting the decision tree nodes in RF should be some different from the principles reported previously, and an empirical relationship was given for determining the parameter m . Thirdly, the optimal number of decision trees ( T ) in RF is not sensitive to the resolutions and sensor types of optical and SAR images, and the optimal T in this study is 20. Fourthly, the combined use of optical and SAR images by using RF is effective to improve the land cover classification and impervious surface estimation, by reducing the confusions between bright impervious surface and bare soil and dark impervious surface and bare soil, as well as shaded area and water surface. Even though the easily-confused land classes tend to be different in different resolutions of images, the effectiveness of combining optical and SAR images is consistent. This improvement is more significant when combing lower resolution optical and SAR images. The conclusions of this study could serve as an important reference for further applications of optical and SAR images, and as a potential reference for the applications of RF to the fusion of other multi-source remote sensing data.

DOI

[38]
Zhou Q, Li B, Kurban A, 2008. Trajectory analysis of land cover change in arid environment of China.International Journal of Remote Sensing, 29(4): 1093-1107.Not Available

DOI

[39]
Zhou Y, Smith S J, Elvidge C Det al., 2014. A cluster-based method to map urban area from DMSP/OLS nightlights.Remote Sensing of Environment, 147(18): 173-185.Accurate information on urban areas at regional and global scales is important for both the science and policy-making communities. The Defense Meteorological Satellite Program/Operational Linescan System (DMSP/OLS) nighttime stable light data (NTL) provide a potential way to map the extent and dynamics of urban areas in an economic and timely manner. In this study, we developed a cluster-based method to estimate optimal thresholds and map urban extent from the DMSP/OLS NTL data in five major steps, including data preprocessing, urban cluster segmentation, logistic model development, threshold estimation, and urban extent delineation. In our method the optimal thresholds vary by clusters and are estimated based on cluster size and overall nightlight magnitude. The United States and China, two large countries with different urbanization patterns, were selected to test the proposed method. Our results indicate that the urbanized area occupies about 2% of total land area in the US, ranging from lower than 0.5% to higher than 10% at the state level, and less than 1% in China, ranging from lower than 0.1% to about 5% at the province level with some municipalities as high as 10%. The derived thresholds and urban extent were evaluated using a validation sub-sample of high-resolution land cover data at the cluster and regional levels. It was found that our method can map urban areas in both countries efficiently and accurately. The sensitivity analysis indicates that the derived optimal thresholds are not highly sensitive to the parameter choices in the logistic model. Our method reduces the over- and under-estimation issues often associated with previous fixed-threshold techniques when mapping urban extent over a large area. More importantly, our method shows potential to map global urban extent and temporal dynamics using the DMSP/OLS NTL data in a timely, cost-effective way.

DOI

[40]
Zhuo L, Ichinose T, Zheng Jet al., 2009. Modelling the population density of China at the pixel level based on DMSP/OLS non-radiance-calibrated night-time light images.International Journal of Remote Sensing, 30(4): 1003-1018.The spatial distribution of population density is crucial for analysing the relationships among economic growth, environmental protection and resource use. In this study we simulated China's population density in 1998 at 1 km脳1 km resolution by integrating DMSP/OLS non-radiance-calibrated night-time images, SPOT/VGT 10-day maximum NDVI composite, population census data and vector county boundaries. Population density, both inside and outside of light patches, was estimated for four types of counties, which were classified according to their light characteristics. The model for estimating population density inside the light patches was developed based on a significant correlation between light intensity and population, while the model for estimating population density outside of light patches was constructed by combining Coulomb's law with electric field superposition principle. Our method was simpler and less expensive than existing methods for spatializing population density. The results were consistent with other estimates but exhibited more spatial heterogeneity and richer information.

DOI

Outlines

/