Orginal Article

Effects of rural-urban migration on vegetation greenness in fragile areas: A case study of Inner Mongolia in China

  • LI Shiji , 1, 2 ,
  • SUN Zhigang 1 ,
  • Tan Minghong , 3 ,
  • LI Xiubin 3
Expand

Author: Li Shiji, PhD Candidate, specialized in land use and land cover change. E-mail:

*Corresponding author: Tan Minghong, PhD and Associate Professor, E-mail:

Received date: 2015-09-28

  Accepted date: 2015-11-13

  Online published: 2016-07-25

Supported by

Projects of International Cooperation and Exchanges NSFC, No.41161140352

The Major Research Plan of the National Natural Science Foundation of China, No.91325302

National Natural Science Foundation of China, No.41271119

Copyright

Journal of Geographical Sciences, All Rights Reserved

Abstract

Different government departments and researchers have paid considerable attention at various levels to improving the eco-environment in ecologically fragile areas. Over the past decade, large numbers of people have emigrated from rural areas as a result of the rapid urbanization in Chinese society. The question then remains: to what extent does this migration affect the regional vegetation greenness in the areas that people have moved from? Based on normalized difference vegetation index (NDVI) data with a resolution of 1 km, as well as meteorological data and socio-economic data from 2000 to 2010 in Inner Mongolia, the spatio-temporal variation of vegetation greenness in the study area was analyzed via trend analysis and significance test methods. The contributions of human activities and natural factors to the variation of vegetation conditions during this period were also quantitatively tested and verified, using a multi-regression analysis method. We found that: (1) the vegetation greenness of the study area increased by 10.1% during 2000-2010. More than 28% of the vegetation greenness increased significantly, and only about 2% decreased evidently during the study period. (2) The area with significant degradation showed a banded distribution at the northern edge of the agro-pastoral ecotone in central Inner Mongolia. This indicates that the eco-environment is still fragile in this area, which should be paid close attention. The area where vegetation greenness significantly improved showed a concentrated distribution in the southeast and west of Inner Mongolia. (3) The effect of agricultural labor on vegetation greenness exceeded those due to natural factors (i.e. precipitation and temperature). The emigration of agricultural labor improved the regional vegetation greenness significantly.

Cite this article

LI Shiji , SUN Zhigang , Tan Minghong , LI Xiubin . Effects of rural-urban migration on vegetation greenness in fragile areas: A case study of Inner Mongolia in China[J]. Journal of Geographical Sciences, 2016 , 26(3) : 313 -324 . DOI: 10.1007/s11442-016-1270-7

1 Introduction

Human activities are influencing the global environment in many ways, with numerous direct and indirect effects on a variety of ecosystems. Currently, rural-urban migration is the most significant human activity, especially for developing countries like China. The rural population of China reduced by 17.0% between 2000 and 2010, based on the demographic census. This migration could well continue for a long time to come, accompanied by further rapid industrialization and urbanization. It is interesting to speculate that this process may have promoted the greenness of terrestrial vegetation in ecologically fragile areas. Studies have indicated that changes in population and environmental impact maintained proportionately similar trends (Xu and Cheng, 2005).
Vegetation index has a positive linear relationship with vegetation cover in areas with low vegetation coverage rates (Liu and Gong, 2012; Watinee and Netnapid, 2013; Fu and Burgher, 2015; Li et al., 2015; Liu et al., 2015; Rao et al., 2015; Xu et al., 2015). Thus it can be used to investigate the changes in regional vegetation cover. The normalized difference vegetation index (NDVI), one of several vegetation indexes, has been widely used to study vegetation changes at different scales (Fan et al., 2012; Chuai et al., 2013; Rodrigues et al., 2013; Zhang et al., 2013; Yi et al., 2014; Zhang et al., 2014; Tan and Li, 2015). For convenient comparison with existing research results, in this study we used NDVI to measure vegetation changes.
The Inner Mongolia Autonomous Region is located on the northern frontier of China (Liu et al., 2015), which belongs to the transition zone from arid and semi-arid climate of the northwestern inland areas to the humid and semi-humid monsoon climate of the southeastern coast. This region is the most important agricultural and animal husbandry production base in China, where the intensity of human activity is high and the eco-environment is fragile (Mu et al., 2012). Recently, with the increasing prominence of environmental and climate issues, Inner Mongolia, which controls the areas of wind and sand sources in Beijing and Tianjin, has been greatly concerned about changes in the eco-environment and the factors that might affect it. The effects of natural factors on the distribution and growth of vegetation cover have been analyzed in previous studies. The timescales of these studies varied from monthly to inter-annual scales, and the spatial scales varied from pixel to regional scales (Sun et al., 2010; Wang et al., 2012; Chuai et al., 2013; Zhang et al., 2013; Hilker et al., 2014; Li et al., 2015). Mu et al. (2012), amongst others, analyzed the response of the vegetation dynamic changes to climate change on different timescales, including monthly and annual scales, analyzed at both regional and overall spatial scales, dividing the land area into ecological forest areas, grassland ecological areas and desert ecological areas. Additionally, Wang investigated the inter-annual variation in vegetation and its relationship to temperature and precipitation, and thereby estimated the contribution rates for these factors in central Inner Mongolia within a radius of 1 km of meteorological stations (Wang et al., 2012).
Recently, human-environment interactions have experienced dramatic changes due to population migration. Census data show that the number of permanent residents has increased by 950,000, an increase of 4%, while the number of rural residents has decreased by 2.37 million, a decline of 17.8%, above the national average, and which was 17% in the autonomous region between 2000 and 2010. The changes in human-environment interaction ought to have a great impact on the eco-environment. Therefore, the impact of human activities on the regional vegetation has increasingly attracted greater attention (Sun et al., 2010; Wang et al., 2012; Wu et al., 2013; Zhou et al., 2014; Li et al., 2015; Liu et al., 2015). In particular, the correlations between vegetation greenness and temperature, and with precipitation in the study area were analyzed by means of NDVI and meteorological data. Then, on this basis, the impact of human activities on vegetation was studied via a residual analysis method (Sun et al., 2010; Li et al., 2011; Wang et al., 2012; Li et al., 2015).
Some scholars have divided human activities into different parts and analyzed their relationship with vegetation change individually. Xin studied the effects of human factors from the aspects of land use, agricultural production and vegetation construction (Xin et al., 2008). Previous studies have mostly focused on the semi-quantitative analysis of human activities, taken as a whole, or a separate analysis of the pairwise correlation between certain factors and vegetation changes.
A large number of people have migrated out of these rural areas, especially the working-age population. Undoubtedly, the outward migration of rural labor will have an effect on the vegetation greenness of these areas. The question then arises: how will the migration of rural labor affect the vegetation greenness in the context of changes in natural environmental factors, especially precipitation and temperature? How to estimate the contributions of human activities to the vegetation conditions? These questions, and others, are addressed and discussed in this paper, which may not only help in understanding the mechanism of vegetation changes, but also have some reference value for the development of national and regional land use policies, environment restoration and management in fragile areas, and the reasonable guidance of rural-urban migration.

2 Data and methods

2.1 Dataset and preprocessing

This study used remote-sensing data, ground meteorological data and economic data. Ground meteorological data and economic data were used to investigate the driving forces causing changes in vegetation greenness.
Remotely sensed NDVI data: NDVI data with a 1 km×1 km spatial resolution, covering the period from May 2000 to October 2010, were downloaded from the GSCLOUD, Computer Network Information Center, Chinese Academy of Sciences (http://www.gscloud.cn/). In northern China, the vegetation growing season lasts from May to October, so these months are chosen to calculate annual mean NDVI values (Xu et al., 2006). Then the average growing season NDVI (AGSNDVI) dataset from 2000 to 2010 at 1 km resolution was obtained for Inner Mongolia.
Climatic data from ground meteorological stations: Meteorological data for the years 2000 to 2010, including monthly mean temperature (MMT) and monthly total precipitation (MTP), were downloaded from the China Meteorological Data Sharing Service System (http://cdc.nmic.cn). The datasets, with 0.5°×0.5° grid-cell size, were acquired by the Thin Plate Spline (TPS) interpolation method from about 2400 meteorological stations in China. To produce raster images with the same temporal and spatial resolution as the NDVI remote-sensing images, an interpolation method was adopted for temperature and precipitation data. In this study, we used the same interpolation method with the original data, taking a 1 km digital elevation model (DEM) as additional covariates during the interpolation. Then the annual mean temperature (AMT) and annual total precipitation (ATP) datasets for the years 2000 to 2010 at 1 km resolution were acquired for Inner Mongolia. The climatic and remote-sensing images were all projected to the Krasovsky_1940_Albers geographic projection.
Socio-economic data: The statistical data at county level, including the rural agricultural labor force, total sown area, cultivated area and the number of livestock at the end of each year by species, were acquired from the National Bureau of Statistics for the years 2000 to 2010, amongst which the population and labor force data were gathered from the fifth and sixth national censuses. Out of concern for the integrity and consistency between population and agricultural statistics, the county-level administrative regions in 2000 were taken as standards, omitting city areas, planning solo cities and counties missing data in Inner Mongolia. Thus, 60 counties were regarded as study samples. To measure the pressure of human activities on land resources, the variable of livestock was selected, which was converted by species into sheep units (Wang and Gao, 2012).

2.2 Trend analysis of variables

Due to the contingency and volatility of changes in vegetation greenness and climatic factors during the study period, and the inevitable randomness of time division (Lu et al., 2011), we employed a trend analysis method to investigate the trend in NDVI and climatic factors between 2000 and 2010. Simple linear regression analysis simulated the tendency of each grid as follows:
where n is the number of years studied; Xi is the variable of year i, which could be AGSNDVI, AMT or ATP; and SLOPE is the slope of the trend line. SLOPE >0 means that the changing tendency of the variable amongst n years is increasing, while SLOPE< 0 means that it is decreasing. With the help of ArcGIS software, the trends in variable data were collected at the county level for Inner Mongolia.
To check the validity of the regression model, a significance test was applied (Wang et al., 2010). Using the correlation coefficient R between the NDVI sequence and the time series, the magnitude and nature of changes in vegetation greenness can be evaluated. The critical values are 0.553 and 0.684 under the significant levels of 0.05 and 0.01, respectively, checked from the corresponding tables. According to the critical values, the variation trend was classified into five categories: extremely significant decrease (ESD, SLOPE < 0, P < 0.01); significant decrease (SD, SLOPE<0, 0.01<P<0.05); no significant change (NSC, P > 0.05); significant increase (SI, SLOPE>0, 0.01<P<0.05); extremely significant increase (ESI, SLOPE >0, P<0.01) (Mu et al., 2013).

2.3 Factor analysis and theoretical hypothesis

The factors were selected from the point of view of both natural factors and human activities (Table 1). For natural factors, considering the response of vegetation to climate change that may have delayed effects (Wu et al., 2009), we chose the changing trends of AMT and ATP during the study period as research indicators. As to human activities, gross population and its structure and land resource occupation per capita were considered in this study. The quantity of agricultural labor (QAL) was chosen to represent the pressure of population and the average age of agricultural labor (AAL) was chosen to represent the demographic structure. In considering the vegetation type, mainly dominated by meadow and arable land in Inner Mongolia, the stocking capacity per capita by the agricultural labor force (SCPAL) and the cultivated area per capita by the agricultural labor force (CAPAL) were used to measure the effects of production capacity per labor force on the regional ecosystem.
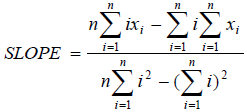
Table 1 Main factors impacting the changes in vegetation in Inner Mongolia
Category Indicator Variable Description
Natural factors ATPa
AMTb
Slope ATP
Slope AMP
Variation in trend of ATP for 2000-2010
Variation in trend of AMT for 2000-2010
Human activities QALc
AALd
CAPALe
CRQAL
CRAAL
CRCAPAL
Rate of change of QAL for 2000-2010
Rate of change of AAL for 2000-2010
Rate of change of CAPAL for 2000-2010
SCPALf CRSCPAL Rate of change of SCPAL for 2000-2010

a ATP = total precipitation. b AMT = annual mean temperature.

c QAL = quantity of agricultural labor force. d AAL = average age of agricultural labor force.

e CAPAL = cultivated area per capita by agricultural labor force.f SCPAL = stocking capacity per capita by agricultural labor force.

Theoretically, rural-urban migration should relieve the ecological pressure on these rural areas, when changes in natural environmental factors under certain conditions, especially those of precipitation and temperature, promote an improvement in vegetation greenness. On the other hand, the activity intensity of the labor force and the change in regional vegetation greenness are in the opposite direction. This means, with either the scale of arable land management per capita or the number of feeding livestock per capita increasing, that pressure on the local ecosystem will increase and the vegetation greenness should degrade, in theory at least. In addition, the AAL should affect the activity of the labor force, thus having an impact on the vegetation greenness. This paper will set out to verify this hypothesis.
Inner Mongolia covers a vast geographic area, with a large span from east to west. There are great differences in size, natural environmental conditions and levels of socio-economic development amongst these counties. For example, in desert area of Alashan and Hexi Corridor, which are limited by natural conditions, the vegetation greenness is much lower than in other counties. To eliminate the background effects, we took the rate of change of human activities as variables in this study. A multiple linear regression method was used to investigate the relationship between changes in greenness and human activities and natural factors.

3 Results and discussion

3.1 Spatial distribution of the NDVI in the base year

Figure 1 displays the gradually decreasing trend in the AGSNDVI from east to west in Inner Mongolia, indicating that the vegetation cover gradually deteriorates in this direction. The regions of high AGSNDVI, namely the areas with good vegetation, are mainly distributed in the deciduous/coniferous forest area on the north Da Hinggan Mountains, which have humid and semi-humid climates, the forest-steppe zone on the middle section of the Da Hinggan Mountains, the coniferous and broad-leaved mixed forest area on the east of the pediment tableland in the Songliao Plain and the forest-steppe zone on the northern and western sides of the Da Hinggan Mountains. From northeast to southwest, the AGSNDVI gradually decreases, showing an evident transition phenomenon between dry and wet areas. The AGSNDVI has been reduced to 0.2-0.4 in the semi-arid steppe area in central Inner Mongolia, which indicates that the vegetation in this area is gradually becoming sparser. In the arid desert area of western Inner Mongolia, the AGSNDVI is less than 0.1, with the surface mainly covered by desert, gobi, bare soil and bare rock.
Figure 1 Spatial distribution of AGSNDVI in Inner Mongolia in 2000

3.2 Annual variation of the vegetation index and its spatial pattern

The AGSNDVI increased from 0.368 to 0.405, an increase of 10.1%, in Inner Mongolia between 2000 and 2010. Considering the AGSNDVI as a whole, the wide variation in Inner Mongolia was conspicuous. The vegetation greenness showed an increasing trend as a whole.
There was a significant variation in the spatial distribution of the AGSNDVI, the changes in which were divided into five categories of ESD, SD, NSC, SI and ESI in accordance with confidence levels of 95% and 99%, as shown in Figure 2. As stated in the statistical results, 28.88% of the study area had experienced a significant increase (SI) between 2000 and 2010, of which ESI made up 17.81% (P<0.01) of the study area, SD (P<0.05) 2.19% and NSC (P>0.05) 68.93%.
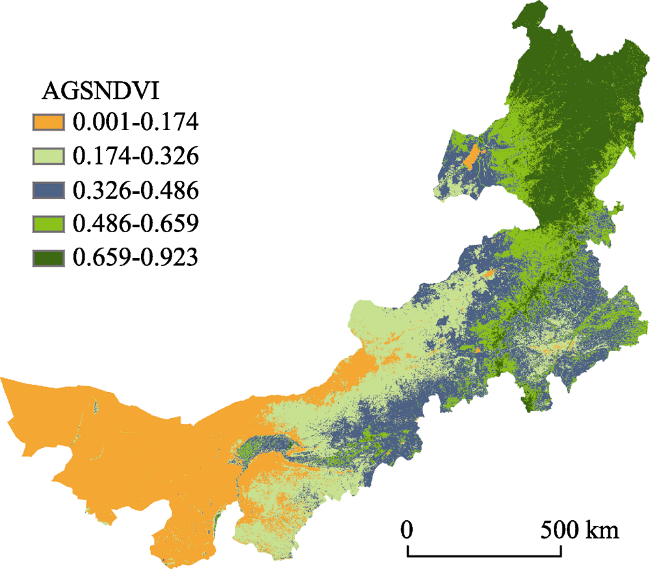
Figure 2 Spatial changes in vegetation greenness based on inter-annual trends and significance of AGSNDVI in Inner Mongolia between 2000 and 2010
ESD: extremely significant decrease; SD: significant decrease; NSC: no significant change; SI: significant increase; ESI: extremely significant increase
Areas where the AGSNDVI reduced significantly showed a mainly banded distribution in central Inner Mongolia, along the line of Wuchuan County-Chahar (Qahar) Right Wing Middle Banner-Shangdu County-Huade County-Zhengxiangbai Banner- Zhenglan Banner-Keshikten (Hexigten) Banner, Balin (Bairin) Right Banner-Ar Horqin Banner-Jarud Banner, Horqin Right Front Banner, where the vegetation greenness appeared obviously degrading trend. The distribution of this belt is consistent with the findings of Wang, which is just located at the northern edge of the agro-pastoral ecotone in Inner Mongolia, sensitive to climate change and human activities (Niu, 1989; Wang et al., 2010).
The area where the AGSNDVI had significantly increased was mostly concentrated in the southeast and west of Inner Mongolia, mainly distributed in three areas: (1) the forest steppe zone in the middle part of the Songliao Plain and the montane deciduous broad-leaved forest region of northern China, which is mainly covered with typical grassland and farmland, such as Naiman Banner, Hure Banner, Harqin Banner, Ningcheng County, etc.; (2) the transition between the steppe region in eastern Inner Mongolia and the desert steppe zone in western Inner Mongolia and the Erdos Plateau, covered by typical steppe, desert steppe and farmland, such as Jungar Banner, Dalad Banner and Ejin Horo Banner and Uxin Banner; (3) the desert area in the Alax-Hexi Corridor, mainly covered by desert and desert steppe, such as Alxa Right Banner and Ejin Banner. The vegetation index increased notably during the study period in those areas, of which the first two were located in a farming-pastoral ecotone, mainly covered with cultivated land and grassland. The last one was the desert area in Inner Mongolia, where the AGSNDVI was extremely low and where the vegetation greenness had obviously improved between 2000 and 2010. In addition, as shown in Figures 2 and 4, the vegetation greenness improved significantly in the areas with a concentrated distribution of farmland, which may be related to the increase in irrigation and improvement in production facilities.

3.3 Effects of population migration on vegetation greenness

Taking the annual variation trend of the AGSNDVI in the study area as the dependent variable, the influencing factors (six indexes) selected in Table 1 were used as independent variables, and a multiple linear regression model was used to investigate the effects of various factors on the changes in vegetation greenness. Table 2 shows that the F value of this model is 4.517, indicating it is notable at the 0.001 level. The main factors affecting the inter-annual variation trend of AGSNDVI during this period, arranged in order of contribution rate, in accordance with the standard partial regression coefficients at the 0.05 level, included rate of change of QAL, variation trend in ATP, variation trend in AMT and rate of change of CAPAL. Moreover, from the orientation of the fitting coefficients, the other factors showed negative relationships with the trend in AGSNDVI, except for the trend in ATP.
Table 2 Explanatory model for changes in vegetation greenness in Inner Mongolia
Model Unstandardized coefficients Standardized coefficients t Sig. Collinearity statistics
B Std. error Tolerance VIF
Adjusted R2: 0.263
(Constant) 0.006 0.002 2.735 0.008
Slope ATP 0.002 0.001 0.359 2.545 0.014** 0.629 1.590
Slope AMT -0.343 0.169 -0.273 -2.028 0.048** 0.687 1.455
CRQAL -0.010 0.003 -0.447 -3.134 0.003*** 0.613 1.631
CRAAL -0.031 0.019 -0.192 -1.660 0.103 0.930 1.075
CRCAPAL -0.002 0.001 -0.265 -2.151 0.036** 0.824 1.214
CRSCPA 0.000 0.001 0.112 0.904 0.370 0.813 1.230

Note: * stands for P<0.1; ** stands for P<0.05; *** stands for P<0.01.

Due to correlation between the independent variables, the independent variable is not independent of the dependent variable for the multiple linear regression method. Besides the direct effect of an independent variable on the dependent variable, there are also indirect effects of the variable on the dependent variable (Chen, 2000). Therefore, the standard partial regression coefficient reflects the direct effect of the independent variable on the dependent variable in the control of other variables. As shown in Table 2, the absolute value of the standard partial regression coefficient of the rate of change of QAL is greater than that of ATP. It turns out that the contribution of the outward migration of agricultural labor on changes in vegetation exceeded that of natural factors such as precipitation.
Figure 3a shows that the rate of change of QAL had the most significant effect on changes in vegetation greenness, and displayed a negative correlation. This result proves that increasing outward migration of agricultural labor reduced the population pressure, to some extent, and played a driving role in improving the local vegetation greenness.
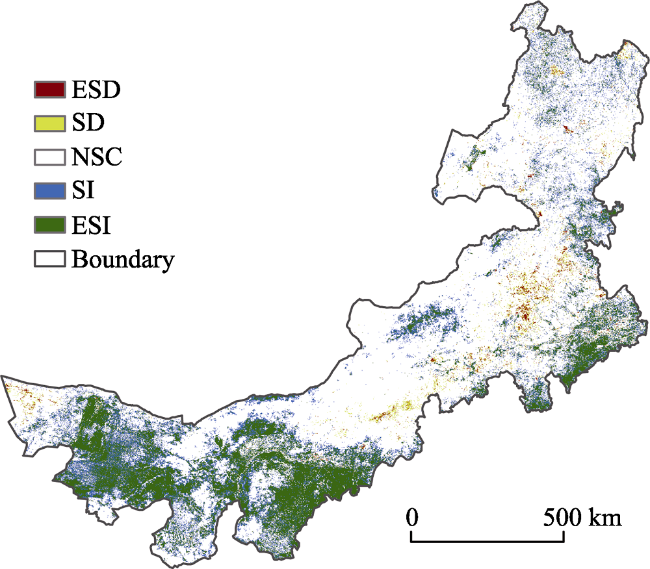
Figure 3 Spatial distribution of the variation trend of AGSNDVI and its main influencing factors in Inner Mongolia
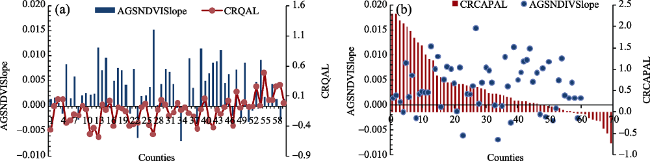
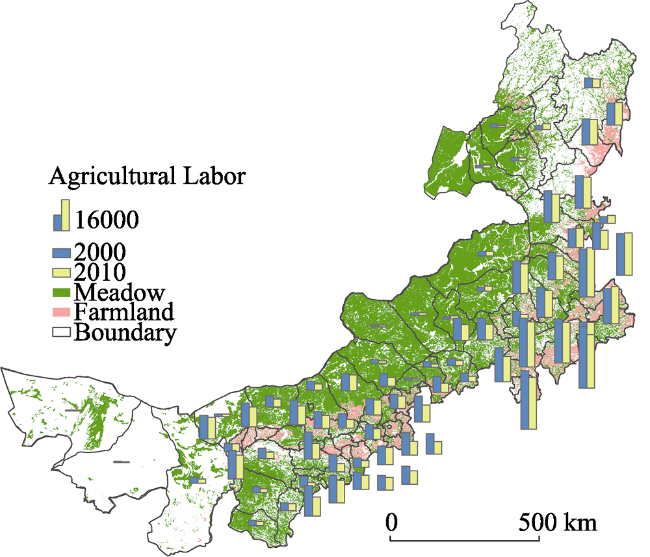
Figure 4 Spatio-temporal distribution of the agricultural labor force and its changes in Inner Mongolia during the period 2000-2010
Between 2000 and 2010, the rural labor force in Inner Mongolia changed markedly. The QAL was reduced by 16.16% in the study area, according to the census data. While the changes in QAL were obvious at the spatial scale, the reduced rate of QAL increased gradually from the northeast to the southwest (Figure 4). The areas with the most rapid decrease in QAL were in the southwestern and central districts located at the junction of two provinces. Counties such as Alxa Right Banner, Otog Banner, Xinghe County and Shangdu County, lying in the southwestern and central regions of Inner Mongolia, showed a reduction in QAL of more than 30% in ten years. Conversely, counties where the QAL changed only slightly were mainly located in the northern border area. The reduction in QAL was around 5% in these counties, such as Urad Rear Banner, Siziwang Banner and Sonid Left Banner. The increase in QAL was less than 5% in counties such as Ejin Banner, Abag Banner and Dong Ujimqin Banner. As shown in Figure 3a, the area with a rapid reduction in QAL was precisely the one where the vegetation improved significantly. With further growth and rapid urbanization, there will be a large number of the labor force migrating out of rural areas in the future, which should further promote improvement in the vegetation greenness under certain conditions.
Previous studies have mainly focused on the total regional population, which is still increasing in the context of the now slower growing population of China as a whole, contributing to the increasing pressure of population growth on the regional environment (Fang et al., 2006; Han et al., 2008). This paper selected QAL as the study variable and quantitatively verified the facts that the human disturbance had been alleviated through migration, and thus promoted the improvement of eco-environment in the fragile area.
Figure 3b shows that there was a negative correlation between the rate of change of CAPAL and the variation in AGSNDVI. The results were consistent with the study hypothesis, that is, with the increase in occupancy of arable land resources labor force per capita, the pressure on the regional ecosystem was enhanced from agricultural activities per capita, and the impact on the vegetation greenness was evident. This may be explained by human activities, such as the influence of farmland irrigation on the overuse of groundwater or over-farming of the regional eco-environment. During 2000-2010, the CAPAL increased from 9.96 ha to 14.53 ha in the study area, an increase of 45.86%, indicating that the activity of per unit labor force increased significantly.
The change in trend of ATP was significantly and positively related to the trend in AGSNDVI at the county scale. Moisture was an important controlling factor for vegetation growth and ecological construction in both arid and semi-arid areas. The faster the increase in ATP, the higher the AGSNDIV was during the study period, and vice versa. Previous studies have obtained similar results on the grid-cell scale, namely, there was a good positive correlation between AGSNDVI and ATP in Inner Mongolia at the inter-annual scale (Sun et al., 2010; Mu et al., 2012; Zhang et al., 2013).
The adjusted R2 of this interpretation model was 0.263 (Table 2), indicating that the total contribution rate of the six variables was 26.3% to explain the variation trend of AGSNDVI on a decadal timescale. For cross-section data, owing to differences in sample characteristics, the R2 of the regression analysis does not need to be too high, generally higher than 0.2 can be accepted (Zhang, 2004), which also means that there may be other explanatory variables not included in this model. A variety of ecological engineering programs (i.e., Grain for Green Project, Beijing-Tianjin Sandstorm Source Control and Three-Norths Shelterbelt Program) have promoted the recovery of vegetation greenness in Inner Mongolia (Hu et al., 2010) and offset the destructive effect of mineral mining on the local grassland vegetation. These factors were not considered in this study, by reason of the difficulty in data acquisition as these variables are needed to be quantitatively expressed. Thus, we have focused only on the effects of the agricultural labor force and its agriculture and animal husbandry production activities.

4 Conclusions

Over the past ten years, Inner Mongolia has experienced a rapid increase in urbanization, with a large number of the labor force migrating out of rural areas. Against this background, the trend line analysis method and the testing of significance were used to investigate the variation trend of vegetation greenness in Inner Mongolia between 2000 and 2010, with NDVI as the index to quantify vegetation greenness. The influence of population migration on vegetation greenness was analyzed quantitatively by means of multiple regression analysis. The results showed that:
(1) Between 2000 and 2010, the AGSNDVI showed an overall rising trend, with an increase of 10.1% during this period. The variation in spatial pattern was obvious - more than 28% of the area improved significantly - and only a few parts (about 2%) degenerated considerably.
(2) The regions where the vegetation was significantly degraded were mainly distributed in central Inner Mongolia, located at the northern edge of the agro-pastoral ecotone. The eco-environment in this area was still relatively fragile, more attention should be paid. The areas where the vegetation greenness increased significantly were largely concentrated in southeastern and western Inner Mongolia.
(3) The migration of large numbers of the rural labor force eased the pressure of population on the ecosystem at the county scale, to some extent, promoting improvement in the local vegetation greenness. Furthermore, the contribution of rural labor migration to vegetation greenness exceeded that of natural factors. From the perspective of ecological restoration, rural labor migration achieved a win-win ecological-economic significance. Therefore, government departments should formulate a reasonable urban development plan and create more off-farm jobs to attract transfer of the agricultural labor force, promoting an improvement in vegetation in ecologically fragile areas.
However, although population pressure has reduced, the intensity of agricultural production activities of the unit labor force has increased, and it had a significant effect on regional vegetation greenness. Consequently, more attention should be paid to the destruction by agricultural production activities of the eco-environment in those areas.
The impacts of population changes on the production environment in fragile areas are divided into two aspects, namely, the role of population increase and that of population decrease. Against the background of a steady increase in total population in China, the role of population on the regional environment is still increasing in pressure. In this paper, the rural area, with a very large amount of the labor force migration, was chosen as the object of study, quantitatively illustrated the process that the migration reduced the population pressure and then improved the environment in ecologically fragile areas.

The authors have declared that no competing interests exist.

[1]
Chen Feng, 2000. Medical Multivariate Statistical Analysis Method. Beijing: China Statistics Press, 22-50. (in Chinese)

[2]
Chuai X W, Huang X J, Wang W Jet al., 2013. NDVI, temperature and precipitation changes and their relationships with different vegetation types during 1998-2007 in Inner Mongolia, China.International Journal of Climatology, 33(7): 1696-1706.Based on vegetation maps of Inner Mongolia, SPOT-VEGETATION normalized difference vegetation index (NDVI) data, and temperature and precipitation data from 118 meteorological stations, this study analysed changes in NDVI, temperature and precipitation, and performed correlation analyses of NDVI, temperature and precipitation for eight different vegetation types during the growing seasons (April-October) of the period 1998-2007 in Inner Mongolia, China. We also investigated seasonal correlations and lag-time effects, and our results indicated that for different vegetation types, NDVI changes during 1998-2007 showed great variation. NDVI correlated quite differently with temperature and precipitation, with obvious seasonal differences. Lag-time effects also varied among vegetation types and seasons. On the whole, Inner Mongolia is becoming warmer, and drier for most regions, and ecological pressure in Inner Mongolia is increasing, and our focus on such issues is therefore important. Copyright (c) 2012 Royal Meteorological Society

DOI

[3]
Fan Na, Xie Gaodi, Zhang Changshunet al., 2012. Spatial-temporal dynamic changes of vegetation cover in Lancang River Basin during 2001-2010.Resources Sciences, 34(7): 1222-1231. (in Chinese)Remote sensing data has been widely used to monitor the change of eco-environment and vegetation cover. Normalized Differential Vegetation Index (NDVI) is an effective way to analysis spatial-temporal dynamic change of vegetation cover .Based on RS and GIS technology, MODIS09Q1 data with spatial resolution of 250m脳250m from 2001 to 2010 were used to construct NDVI time series dataset in the Lancang River basin. To furtherly remove the cloud contaminated images,the HANTS algorithm and MVC(Maximum Value Composites)method were used. Then, this paper analyzed the temporal and spatial variation of vegetation index by using the liner regression, HURST index and other methods. The results showed that: 1) The annual NDVI had an obvious spatial difference: it was found that vegetation index decreased when latitude increased from south to north ,and at the same time there was an abrupt decline at 27.6掳锝29.2掳N where the NDVI decline rate was higher than other regions; it was also foud that NDVI showed negative correlation with DEM and slope, the trend that NDVI reduced with the rising of the elevation was more apparent, the average NDVI of the area (DEM 5000 m) was only 0.18; 2) The value of NDVI had a fluctuation change trend during the past 10 years ,but on the whole there still was a significant increased trend of vegetation cover in the Lancang river basin(R 2 =0.52,P=0.02), reaching a maximum value 0.7 of the whole area in 2010. NDVI increased with 0.02/year average rate and the NDVI of 2010 was 28.57% more than NDVI of 2001.The trends of the upper basin, middle basin and lower basin were similar with the entire basin, but the rate the degree of change were not the same. In general, the rate of change in the upper basin was higher than other basins, and the degree of changes in the upper basin were most obvious; 3) During the period of 2001-2010, the vegetation cover improved area was much larger than the degraded area, which occupied 80% or more of the total basin; Based on the Hurst index analysis showed, the whole basin was almost nonexistent anti-sustainability phenomenon , it would maintain the current trend , which the area of middle and strong persistent made up about 60% of the total basin; Comprehensive analysis of variation tendency and persistence ,showed that the area of vegetation cover change to healthy development, but the NDVI decreased areas with strong persistence and the NDVI increased areas with weak persistence might be indicative.

[4]
Fang Shifeng, Liu Zhihui, Pei Huanet al., 2006. The response to changes in climate and population of vegetation cover in Turpan Depression.Technology of Soil and Water Conservation, (5): 23-25. (in Chinese)

[5]
Fu Baihua, Burgher Isabela, 2015. Riparian vegetation NDVI dynamics and its relationship with climate, surface water and ground water.Journal of Arid Environments, 113(2): 59-68.Maintaining the integrity of riparian ecosystems whilst continuing to reserve and extract water for other purposes necessitates a greater understanding of relationships between riparian vegetation and water availability. The Normalised Difference Vegetation Index (NDVI) is a good indicator for identifying long-term changes in vegetated areas and their condition. In this study, we use regression tree analysis to investigate long term NDVI data (23 years) at semi-arid riparian areas in the Namoi catchment, Australia. Climatic factors (temperature and rainfall), surface water (flow and flooding) and groundwater levels are analysed collectively. We find that in general maximum temperature is the variable that primarily splits NDVI values, followed by antecedent 28-day rainfall and then inter-flood dry period and groundwater levels. More rain is required in the warmer months compared to cooler months to achieve similar mean NDVI values in tree patches or areas of high NDVI in riparian zones, presumably because of higher evaporation. Inter-flood dry period is shown to be important for maintenance of NDVI levels, particularly when rainfall is limited. Shallower groundwater levels sustain the NDVI and hence vegetation greenness when conditions are cooler and wetter.

DOI

[6]
Han Guifeng, Xu Jianhua, 2008. Influence of population and economic development on vegetation: A case study in Chongqing City.Resources and Environment in the Yangtze Basin, 17(5):785-792.<p>Vegetation is an important variable in earth system.Influence of human activities on vegetation is obvious on certain scales.This paper,taking Chongqing City as an example,analyzed the correlation between artificial factors and vegetation spatiotemporal distribution based on time series NDVI data.It is shown that vegetation distribution and growth does not increase steadily nor rapidly like GDP and population with sustainable increasing trends from 1998 to 2005.There is always negative correlation between vegetation and GDP and population in terms of time series.However,the correlation appears significantly heterogeneous in space.The obvious negative correlation is observed in relatively developed areas nearby the center of the city where rapid economic development and urbanization make vegetation decrease both in distribution and productivity;whereas positive correlation is observed in those areas away from the city especially in underdeveloped areas.</p>

[7]
Hilker T, Lyapustin A I, Tucker C Jet al., 2014. Vegetation dynamics and rainfall sensitivity of the Amazon.Proceedings of the National Academy of Sciences, 111(45): 16041-16046.We show that the vegetation canopy of the Amazon rainforest is highly sensitive to changes in precipitation patterns and that reduction in rainfall since 2000 has diminished vegetation greenness across large parts of Amazonia. Large-scale directional declines in vegetation greenness may indicate decreases in carbon uptake and substantial changes in the energy balance of the Amazon. We use improved estimates of surface reflectance from satellite data to show a close link between reductions in annual precipitation, El Ni帽o southern oscillation events, and photosynthetic activity across tropical and subtropical Amazonia. We report that, since the year 2000, precipitation has declined across 69% of the tropical evergreen forest (5.4 million km) and across 80% of the subtropical grasslands (3.3 million km). These reductions, which coincided with a decline in terrestrial water storage, account for about 55% of a satellite-observed widespread decline in the normalized difference vegetation index (NDVI). During El Ni帽o events, NDVI was reduced about 16.6% across an area of up to 1.6 million kmcompared with average conditions. Several global circulation models suggest that a rise in equatorial sea surface temperature and related displacement of the intertropical convergence zone could lead to considerable drying of tropical forests in the 21st century. Our results provide evidence that persistent drying could degrade Amazonian forest canopies, which would have cascading effects on global carbon and climate dynamics.

DOI PMID

[8]
Hu Yunfeng, Liu Jiyuan, Qi Yongqinget al., 2010. Positivist analysis on the effects of ecological projects in the farming-pastoral transition belt of Inner Mongolia Autonomous Region.Geographical Research, 29(8): 1452-1460. (in Chinese)As the participants and affected persons of ecological projects in the Inner Mongolia Autonomous Region during the past decade,local farmers should be involved when we assess the effects and efficiency of those ecological projects,and their comments and favorites should also be paid more attention when the government makes decisions on the future ecological project planning.Using questionnaire-based investigation and positivist analysis methods,this paper aimed to explore the ecological project effects in the typical farming-pastoral transitional zone of northern China.The survey covered 144 families in 3 counties of Inner Mongolia(Taipusi Qi,Wuchuan County,and Siziwang Qi).Results showed:(1) Returning cropland to forest/grassland,enclosing grassland to prevent grazing,and seasonal delaying grazing were the 3 main types of ecological project.A high participation rate was closely related to the family's core business.(2) Based on an integrated assessment taking into account water,soil,atmospheric and biological factors,local farmers' responses referred that they did not think the past ecological projects brought obvious and favorable post-effects for the local environments,although our detailed study indicated that ecological projects had prevented local environmental degradation,reduced sandstorm frequency,and increased the number of wild animal species.(3) Family income and the productivities of tillage and husbandry were promoted after the implementation of ecological projects,though the gross yields of grain and livestock were decreased.The critical factors affecting family income included farming/herding production technology and geographical location.(4) Limiting livestock's amounts,returning farmland,and protecting degraded grassland were the 3 most favorite measures to protect/restore local ecosystems for local framers.Further measures for returning farmland and eco-migration would be supported if compensation was enough.The rate of support was related to family income,available labor transfer approaches,and subsequent guarantees.

DOI

[9]
Li Huixia, Liu Guohua, Fu Bojie, 2011. Response of vegetation to climate change and human activity based on NDVI in the Three-River Headwaters region.Acta Ecologica Sinica, 31(19): 5495-5504. (in Chinese)Vegetation change trends and the response of different types of vegetation to climate change were analyzed using spot vegetation Normalized Difference Vegetation Index(NDVI) data from 1998 to 2010,vegetation maps at a scale of 1鈭1000000 and climate data obtained from 16 weather stations in or near to the Three-River Headwaters region.The effectiveness of ecological conservation and construction was also assessed by separating the contribution of human activity from climate factors to vegetation growth.Results show that vegetation in the study area increased in density between 2001 to 2010 at a regional scale and vegetation growth decreased from the southeast to the northwest of the study area.The contribution of climate change and human activity to vegetation growth was calculated at 79.32% and 20.68%,respectively,indicating that change in vegetation is mostly influenced by climate change and enhanced by human activity.Precipitation as well as temperature has a great impact on vegetation change at the study site.Precipitation and temperature during spring and autumn,especially in April and October,are the most important to vegetation growth in the alpine area.The impact of climate change on NDVI differs between vegetation types,with the greatest impact observed in alpine grassland areas over forest and shrub areas.The NDVI of alpine meadow areas correlates strongly with both precipitation and temperature.In alpine steppe areas temperature has more influence on NDVI,while precipitation has a stronger relationship with NDVI in areas of mountain vegetation.Under a changing climate between 2001 to 2010,which promoted vegetation growth because of the increase in precipitation and temperature,human activity was found to have a positive effect on vegetation growth as shown from the calculation of a residual value of 0.0863 between real NDVI and simulated NDVI.This provides evidence that ecological conservation and construction programs have achieved initial success.The most obvious effects occur in the east of the Yellow River source region and the two sides of Tongtian River of Yangtze River source region.In mountain areas such as Tanggula Mountain,Kunlun Mountain and Buqing Mountain,human activity is still found to have negative effects on vegetation growth.The positive effects of human activity on vegetation decreased between 2001 to 2010,as shown from the negative slope of-0.0039.This indicates that most ecological projects are implemented with a short-term design and a lack of long-term planning.

DOI

[10]
Li Shuangshuang, Yang Saini, Liu Xianfenget al., 2015. NDVI-based analysis on the influence of climate change and human activities on vegetation restoration in the Shaanxi-Gansu-Ningxia Region, Central China.Remote Sensing, 7(9): 11163-11182.In recent decades, climate change has affected vegetation growth in terrestrial ecosystems. We investigated spatial and temporal patterns of vegetation cover on the Loess Plateau’s Shaanxi-Gansu-Ningxia region in central China using MODIS-NDVI data for 2000–2014. We examined the roles of regional climate change and human activities in vegetation restoration, particularly from 1999 when conversion of sloping farmland to forestland or grassland began under the national Grain-for-Green program. Our results indicated a general upward trend in average NDVI values in the study area. The region’s annual growth rate greatly exceeded those of the Three-North Shelter Forest, the upper reaches of the Yellow River, the Qinling–Daba Mountains, and the Three-River Headwater region. The green vegetation zone has been annually extending from the southeast toward the northwest, with about 97.4% of the region evidencing an upward trend in vegetation cover. The NDVI trend and fluctuation characteristics indicate the occurrence of vegetation restoration in the study region, with gradual vegetation stabilization associated with 15 years of ecological engineering projects. Under favorable climatic conditions, increasing local vegetation cover is primarily attributable to ecosystem reconstruction projects. However, our findings indicate a growing risk of vegetation degradation in the northern part of Shaanxi Province as a result of energy production facilities and chemical industry infrastructure, and increasing exploitation of mineral resources.

DOI

[11]
Liu Shuang, Gong Peng, 2012. Change of surface cover greenness in China between 2000 and 2010.Chinese Science Bulletin, 57(22): 2835-2845.Surface greenness reflects the situation of vegetation cover.Vegetation index calculated from the Red and Near Infrared bands of remote sensing images,whose values indicate the level of photosynthetic activity,is monotonically related to surface greenness when vegetation canopy does not fully cover the background soil.Especially for desert regions,vegetation index is positively correlated with vegetation coverage.Therefore,vegetation index can be used to study the change in greenness of desert areas.This study collected MODIS Normalized Difference Vegetation Index (NDVI) data from 2000 to 2010 and analyzed their change over China in this period.The results showed that an increasing trend of NDVI occurred over 66.84% (OLS fitting) or 64.27% (LAD fitting) of China,indicating that China's greenness is increasing overall.Meanwhile,desertification of China decreased.Areas showing large increase in greenness are found in Shaanxi,Shanxi,Ningxia,Henan,Shandong,Qinghai,and Gansu while regions with large decrease in greenness are found in Northeast Inner Mongolia,South Tibet,Jiangsu,and Shanghai.Changes of Qinghai,Gansu,Xinjiang and South Tibet could probably be driven by climate factors.Decrease of greenness in Northeast Inner Mongolia was related to agricultural reclamation.Decrease of greenness in Jiangsu and Shanghai was related to rapid urbanization.Climate factors did not exhibit obvious correspondence to the large increase in greenness in Shaanxi,Shanxi,Ningxia and Gansu,indicating that the changes might have been caused by human factors.The reduction of desert areas in China could probably have been caused by human management and protection at the national scale.

DOI

[12]
Liu Xianfeng, Zhu Xiufang, Pan Yaozhonget al., 2015. Spatiotemporal changes of cold surges in Inner Mongolia between 1960 and 2012. Journal of Geographical Sciences, 25(3): 259-273.lt;p>In this study, we analyzed the spatiotemporal variation of cold surges in Inner Mongolia between 1960 and 2012 and their possible driving factors using daily minimum temperature data from 121 meteorological stations in Inner Mongolia and the surrounding areas. These data were analyzed utilizing a piecewise regression model, a Sen+Mann- Kendall model, and a correlation analysis. Results demonstrated that (1) the frequency of single-station cold surges decreased in Inner Mongolia during the study period, with a linear tendency of -0.5 times/10a (-2.4 to 1.2 times/10a). Prior to 1991, a significant decreasing trend of -1.1 times/10a (-3.3 to 2.5 times/10a) was detected, while an increasing trend of 0.45 times/10a (-4.4 to 4.2 times/10a) was found after 1991. On a seasonal scale, the trend in spring cold surges was consistent with annual values, and the most obvious change in cold surges occurred during spring. Monthly cold surge frequency displayed a bimodal structure, and November witnessed the highest incidence of cold surge. (2) Spatially, the high incidence of cold surge is mainly observed in the northern and central parts of Inner Mongolia, with a higher occurrence observed in the northern than in the central part. Inter-decadal characteristic also revealed that high frequency and low frequency regions presented decreasing and increasing trends, respectively, between 1960 and 1990. High frequency regions expanded after the 1990s, and regions exhibiting high cold surge frequency were mainly distributed in Tulihe, Xiao'ergou, and Xi Ujimqin Banner. (3) On an annual scale, the cold surge was dominated by AO, NAO, CA, APVII, and CQ. However, seasonal differences in the driving forces of cold surges were detected. Winter cold surges were significantly correlated with AO, NAO, SHI, CA, TPI, APVII, CW, and IZ, indicating they were caused by multiple factors. Autumn cold surges were mainly affected by CA and IM, while spring cold surges were significantly correlated with CA and APVII.</p>

DOI

[13]
Liu Ya, Li Yan, Li Shuangchenget al., 2015. Spatial and temporal patterns of global NDVI trends: Correlations with climate and human factors.Remote Sensing, 7(10): 13233-13250.Changes in vegetation activity are driven by multiple natural and anthropogenic factors, which can be reflected by Normalized Difference Vegetation Index (NDVI) derived from satellites. In this paper, NDVI trends from 1982 to 2012 are first estimated by the Theil–Sen median slope method to explore their spatial and temporal patterns. Then, the impact of climate variables and human activity on the observed NDVI trends is analyzed. Our results show that on average, NDVI increased by 0.46 × 10613 per year from 1982 to 2012 globally with decadal variations. For most regions of the world, a greening (increasing)–browning (decreasing)–greening (G-B-G) trend is observed over the periods 1982–2004, 1995–2004, and 2005–2012, respectively. A positive partial correlation of NDVI and temperature is observed in the first period but it decreases and occasionally becomes negative in the following periods, especially in the Humid Temperate and Dry Domain Regions. This suggests a weakened effect of temperature on vegetation growth. Precipitation, on the other hand, is found to have a positive impact on the NDVI trend. This effect becomes stronger in the third period of 1995–2004, especially in the Dry Domain Region. Anthropogenic effects and human activities, derived here from the Human Footprint Dataset and the associated Human Influence Index (HII), have varied impacts on the magnitude (absolute value) of the NDVI trends across continents. Significant positive effects are found in Asia, Africa, and Europe, suggesting that intensive human activity could accelerate the change in NDVI and vegetation. A more accurate attribution of vegetation change to specific climatic and anthropogenic factors is instrumental to understand vegetation dynamics and requires further research.

DOI

[14]
Lu Changhe, Yu Bohua, 2011. Remediation Technology and Model of Land Degradation in Qinghai-Tibet Plateau. Beijing: Science Press, 24-26. (in Chinese)

[15]
Mu Shaojie, Li Jianlong, Chen Yizhaoet al., 2012. Spatial differences of variations of vegetation coverage in Inner Mongolia during 2001-2010.Acta Geographica Sinica, 67(9): 1255-1268. (in Chinese)Global climate change has led to significant vegetation changes in the past half century. Inner Mongolia, most of which was located in arid and semi-arid areas, is undergoing a process of prominent warming and drying. It is necessary to investigate the response of vegetation to the climatic variations (temperature and precipitation) for a better understanding of the accumulated consequence of climate change. Vegetation coverage, which is an important indicator for evaluating terrestrial environment, is used to monitor vegetation change. MODIS-NDVI data and climate data were used to analyze the vegetation dynamics and its relationship with climate change on different spatial (forest, grassland and desert biome) and temporal (yearly and monthly) scales in Inner Mongolia during 2001-2010. It was found that vegetation coverage increased from west to east across Inner Mongolia with a change rate of 0.2/10&deg;N. During 2001-2010, the mean vegetation coverage was 0.57, 0.4 and 0.16 in forest, grassland and desert biome, respectively, exhibiting evident spatial heterogeneities. There is a slight increase of vegetation coverage over the study period. Across Inner Mongolia, the vegetation coverages with extremely significant and significant increase accounted for 11.25% and 29.13% of the total study area, respectively, while those with extremely significant and significant decrease were 7.65% and 26.61%, respectively. The correlation analysis between vegetation coverage and climate shows that annual vegetation coverage was better correlated with precipitation, while the change of monthly vegetation coverage is consistent with both the changes of temperature and precipitation, indicating that the vegetation growth within a year is more sensitive to the joint function of hydrothermal combination rather than either climate factor. The vegetation coverage of forest biome was mainly affected by temperature on both yearly and monthly scales, while that of desert biome was mainly influenced by precipitation on the two temporal scales.

DOI

[16]
Niu Wenyuan, 1989. The discriminatory index with regard to the weakness, overlap, and breadth of the ecotone.Acta Ecologica Sinica, 9(2): 97-105. (in Chinese)ECOTONE, a new definition of ecological field, was approved by the plenary session of 鈪 SCOPE in 1988 (Budapest). In order to have a better understanding attributions, connotations, and significations of the term, we have already provided a systematic description and logical induction. In this article, the author would use the ecological boundary theory and the technique of information measure to develop the Index Series which can be applied to determine the basic properties of ECOTONE. Generally, these indeces Would include the breadth, the overlapness, the weakness, and the synthetical index expressing dynamic characteristics of ECOTONE.In biosphere, spatial generalization of ECOTONE could be summarized as follows:(1)Connecting zone between urban and country;(2)Mixture zone between arid and humid climate regions;(3)Intersection zone between agricultural and animal husbandry regions;(4) Join zone between land and water body;(5)The periphery of a forest; (6)The fringe of a desert;(7) Sudden change of the gradients (such as altitude, concentration, hardness, and so forth).

[17]
Rao Yuhan, Zhu Xiaolin, Chen Jinet al., 2015. An improved method for producing high spatial-resolution NDVI time series datasets with multi-temporal MODIS NDVI data and Landsat TM/ETM+ images.Remote Sensing, 7(6): 7865-7891.Due to technical limitations, it is impossible to have high resolution in both spatial and temporal dimensions for current NDVI datasets. Therefore, several methods are developed to produce high resolution (spatial and temporal) NDVI time-series datasets, which face some limitations including high computation loads and unreasonable assumptions. In this study, an unmixing-based method, NDVI Linear Mixing Growth Model (NDVI-LMGM), is proposed to achieve the goal of accurately and efficiently blending MODIS NDVI time-series data and multi-temporal Landsat TM/ETM+ images. This method firstly unmixes the NDVI temporal changes in MODIS time-series to different land cover types and then uses unmixed NDVI temporal changes to predict Landsat-like NDVI dataset. The test over a forest site shows high accuracy (average difference: 鈭0.0070; average absolute difference: 0.0228; and average absolute relative difference: 4.02%) and computation efficiency of NDVI-LMGM (31 seconds using a personal computer). Experiments over more complex landscape and long-term time-series demonstrated that NDVI-LMGM performs well in each stage of vegetation growing season and is robust in regions with contrasting spatial and spatial variations. Comparisons between NDVI-LMGM and current methods (i.e., Spatial and Temporal Adaptive Reflectance Fusion Model (STARFM), Enhanced STARFM (ESTARFM) and Weighted Linear Model (WLM)) show that NDVI-LMGM is more accurate and efficient than current methods. The proposed method will benefit land surface process research, which requires a dense NDVI time-series dataset with high spatial resolution.

DOI

[18]
Rodrigues Arlete, Marçal A R, Cunha Mário, 2013. Identification of potential land cover changes on a continental scale using NDVI time series from SPOT VEGETATION.International Journal of Remote Sensing, 34(22): 8028-8050.The identification of land cover changes on a continental scale is a laborious and time-consuming process. A new methodology is proposed based exclusively on SPOT VGT data, illustrated for the African Continent using GLC2000 as reference to select 26 distinct land cover types (classes). For each class, the normalized difference vegetation index (NDVI) time-series are extracted from SPOT VGT images and a hierarchical aggregation is done using two different methods: one that preserves the initial signatures throughout the hierarchical process, and another that recalculates the signatures for each aggregation level. The average classification agreement was above 89% using 26 classes. Reducing the number of classes improves classification agreement. In order to study the influence of temporal variability in the classification results, the methodology was applied on data from 1999, 2001, 2008, and 2010. With 26 classes, the best average classification agreement obtained was 94.5% with annual data, against 74.1% with interannual data.

DOI

[19]
Sun Yanling, Guo Peng, Yan Xiaodonget al., 2010. Dynamics of vegetation cover and its relationship to climate change and human activities in Inner Mongolia.Journal of Natural Resources, 25(3): 407-414. (in Chinese)

DOI

[20]
Tan Minghong, Li Xiubin, 2015. Does the Green Great Wall effectively decrease dust storm intensity in China? A study based on NOAA NDVI and weather station data.Land Use Policy, 43(2): 42-47.China launched its “Green Great Wall” (GGW) program in 1978. However, the effects of this program are subject to intense debate. This study compares changes in the vegetation index in regions where the GGW program has been implemented with those where it has not. Subsequently, a definition to measure dust storm intensity (DSI) was proposed that better calculates the intensity of dust events; it considers the frequency, visibility, and duration of dust events. The results show that in the GGW region, vegetation has greatly improved, while it varied dramatically outside the GGW region. In the mid-1980s, DSI decreased significantly, different from the changes in dust storm frequency in the study region. By discounting the effects of climatic change and human pressures, the results show that the GGW program greatly improved the vegetation index and effectively reduced DSI in northern China.

DOI

[21]
Watinee Thavorntam, Netnapid Tantemsapya, 2013. Vegetation greenness modeling in response to climate change for Northeast Thailand.Journal of Geographical Sciences, 23(6): 1052-1068.In Northeast Thailand,the climate change has resulted in erratic rainfall and temperature patterns. The region has experienced both periods of drought and seasonal floods with the increasing severity. This study investigated the seasonal variation of vegetation greenness based on the Normalized Difference Vegetation Index(NDVI) in major land cover types in the region. An assessment of the relationship between climate patterns and vegetation conditions observed from NDVI was made. NDVI data were collected from year 2001 to2009 using multi-temporal Terra MODIS Vegetation Indices Product(MOD13Q1). NDVI profiles were developed to measure vegetation dynamics and variation according to land cover types. Meteorological information,i.e. rainfall and temperature,for a 30 year time span from1980 to 2009 was analyzed for their patterns. Furthermore,the data taken from the period of2001鈥2009,were digitally encoded into GIS database and the spatial patterns of monthly rainfall and temperature maps were generated based on kriging technique. The results showed a decreasing trend in NDVI values for both deciduous and evergreen forests. The highest productivity and biomass were observed in dry evergreen forests and the lowest in paddy fields. Temperature was found to be increasing slightly from 1980 to 2009 while no significant trends in rainfall amounts were observed. In dry evergreen forest,NDVI was not correlated with rainfall but was significant negatively correlated with temperature. These results indicated that the overall productivity in dry evergreen forest was affected by increasing temperatures. A vegetation greenness model was developed from correlations between NDVI and meteorological data using linear regression. The model could be used to observe the change in vegetation greenness and dynamics affected by temperature and rainfall.

DOI

[22]
Wang Lucang, Gao Jing, 2012. The ecological footprint of alpine pastures at the village level: A case study of Hezuo in Gannan Autonomous Prefecture, China.Acta Ecologica Sinica, 32(12):3795-3805 (in Chinese)Alpine pasture is a unique plant community with an ecological set of conditions and environmental pressures which are significantly different from other areas.This simple ecosystem has a naturally slow rhythm.Its functional instability is caused by the cold,alpine pasture environment which makes it vulnerable to disturbance and difficult to repair once damages occurred.To a certain extent,external forces and influences are limited in this cold climate because of its isolation from human activities.This leads to alpine pasture having a highly localized and sparse human population,so that human conflicts only tend to arise over grass-livestock conflicts.Based on characteristics of alpine pastures,the authors have revised the ecological footprint model and ecological carrying capacity model of this unique habitat placing strong emphasis on the key factors controlling ecological carrying capacity.These factors include the numbers and types of livestock,human population,local habitat conditions and regional characteristics.Following the methods of Hezuo,the authors then measured and analyzed the ecological footprint and ecological carrying capacity of 41 administrative units.The results show: 1) The distribution patterns and ecological footprints of the human population and their livestock are very different and roughly the opposite of each other,which indicates there are significant spatial differences between the environmental pressure on alpine pastures coming from the human population and pressures from livestock.2) The combined ecological footprint of humans and livestock is mainly determined by the location of the livestock ecological footprint,so we can conclude the impact of livestock is the main factor in the formation of the combined ecological footprint.3) Looking at the distribution of the ecological carrying capacity per unit area,the areas with a low carrying capacity are mainly located in the northern expansive pastoral areas at higher altitudes where the structure of the ecosystem is fairly simple,and main ecological types are alpine meadows and hydric grassland.Also,in these high altitude areas,frost weathering is quite strong,and the effective growing season is very short.Unlike these low carrying capacity and high altitude areas,the areas with high carrying capacity are mainly located around urban areas and along the Taohe River,with both grassland ecosystems and forested ecosystems present.In summary,we can conclude the main factor determining the ecological carrying capacity is our ability to improve anthropogenic factors,while dealing with the complex structure of natural ecological systems and harsh natural environment.4) When we consider the nature of the spatial distribution of ecological surpluses and deficits,ecological deficit areas are mainly concentrated in pure pastoral areas,and overgrazing is the key cause for the ecological damage.So,the key to increasing the ecological carrying capacity and reducing ecological impact is focusing our attention on the relationships between grasses and livestock.We should take several measures to improve the situation.First,maintaining the balance between forage and livestock and avoiding overgrazing is required.Stocking levels need to be based on the carrying capacity of native pasture.Second,we can improve productivity and carrying capacity of pastoral areas using scientific and reasonable methods,and in this way strengthen protection for grassland ecosystems.Finally,we need to adjust the economic structure,by decreasing human dependence on grassland farming and by promoting the transition from traditional grassland husbandry into modern animal husbandry.

DOI

[23]
Wang Junbang, Tao Jian, Li Guicaiet al., 2010. Monitoring inter-annual vegetation variation in middle Inner Mongolia through MODIS NDVI. Journal of Geo-Information Science, 12(6): 835-842. (in Chinese)In this paper,we investigated the response of inter-annual vegetation variation to climate change in middle Inner Mongolia based on 250m MODIS NDVI data in 2000-2008 and climate data from meteorological stations during 1960-2008.After applying S-G filer process to deduct the noisy and abnormal points,the mean of 8-day NDVI in a year was calculated to indicate the vegetation status in that year.Then the trend of inter-annual vegetation variation in 2000-2008 was calculated with the linear regression coefficiency,that is the slope of a line,and analyzed through the regression significant level.The average NDVI by vegetation type was calculated according to vegetation map with a scale of 1:100 000.During the study period,79.60% of the vegetation area keeps a relatively steady state,and 17.33% changes to better.But 3.06% of the grassland is in degradation or desertification where is in the Farming-Pastoral Transitional Zone.The climate factors that caused inter-annual vegetation variance were quantified.The warmer and dryer climate change happened in this region was regarded as main reason.Between two climate factors of temperature and precipitation,the variance of precipitation has more effect on the change of NDVI than temperature.The ratio of standardized regression coefficients of precipitation and temperature is in range of 0.89(Suolun) to 11.50(Siziwang Qi).At Xilinhot,the ratio is negative which may be explained as combined influence of unmatched temperature and precipitation.However,the inter-annual variance of grassland was affected not only by climate,but also by human activity.In this paper,however,the latter factor was not analyzed though it is very important for assessing the technique on ecosystem protection and recreation.Quantificationally assessing the effect of human activity under global climate change is an interesting and challenge research field for us in future.

DOI

[24]
Wang Juan, Li Baolin, Yu Wanli, 2012. Analysis of vegetation trends and their causes during the recent 30 years in Inner Mongolia Autonomous Region. Journal of Arid Land Resources and Environment, 26(2): 132-138. (in Chinese)This paper presented regional trends in vegetation greenness in Inner Mongolia Autonomous Region during the period of 1983锝1999 and 2000-2009 based on NOAA and MODIS data.The relationship between vegetation greenness change and climatic and anthropogenic factors were also explored based on the analyses of meteorological data and local economic statistical data.The results were as follows: 1) 72.1% of the study area experienced no significant change over two study period at the 0.05 level while 5.5%(including south of Horqin sandy land and northeast of Muus sandy land)increased during both periods.In 13.9%(including Xilingol League,South of Horqin,Tumo Plain etc) of the area vegetation showed increase tendency during 1983-1999 and remained constant during 2000-2009.In 0.6%(including north of Horqin sandy land) of the whole area vegetation decreased during 1983-1999 and showed no significant trend later.In 1.8% of the study area(including part of Wumeng mountain and the Great Xing'an Mountain) vegetation had no significant trend during 1983锝1999 but deceased clearly during 2000-2009.2) The increasing greenness showed no positive link with precipitation in the study area excluding part of Xilingol League while the increasing trend of vegetation was mainly affected by human activities.The increase of the crop yield was responsible for the significant increase of vegetation greenness in the Xiliaohe Plain,Tumote Plain etc where the main land use type was crop land while in northwest of Muus sandy land where vegetation increased clearly,the causes were the human activities such as planting trees,dune management.In part of the Great Xing'an Mountain where NDVI decrease was related to forest fires.

[25]
Wang Qiang, Zhang Bo, Dai Shengpeiet al., 2012. Analysis of the vegetation cover change and its relationship with factors in the Three-North Shelter Forest Program. China Environmental Science, 32(7): 1302-1308. (in Chinese)The Shelter Forest System Program(TNSEP) in Three-North Region of China is the largest ecological reforestation program in the world.The TNSFP vegetation research not only has important ecological environment meaning,but also attaches profound social and economic significance.Spatio-temporal variation of the vegetation coverage and its relationship with major climatic factors(temperature and precipitation) in TNSFP was explored by using GIMMS/NDVI dataset at 8km spatial resolution and climatic data during the period from 1982 to 2006.The results show that: 1) vegetation cover had an entirely rising trend during the past 25 years,the increasing rate of vegetation variation was slightly higher than reducing rate,鈪燼nd 鈪 NDVI increased most significantly P0.001),while 鈪 showed a slight downward trend.Moreover,the vegetation coverage of four construction regions has been improved in different degree.2) Vegetation cover,temperature and precipitation overall were positively correlated on the study area.The temperature and vegetation cover was negatively correlated in 17.74% of the region,but 6.84% of the region was a positive correlation.The precipitation was negatively correlated with vegetation cover in 10.60% of the region while 19.53% of the region was a positive correlation.Vegetation associated with the precipitation was significantly larger than the area related to temperature,precipitation was the key to factor vegetation growth on the study area.3)Inter-annual residuals of vegetation variation showed a significant positive correlation area which was greater than the area of a significant negative correlation area,and the role of human construction on vegetation was stronger than the destructive role.Therefore,the positive impact of TNSFP ecological construction was showing.

[26]
Wu Yongli, Duo Leishi, Wang Yunfenget al., 2009. Responses of vegetation index(NDVI) in typical ecological areas of Shanxi Province to climate change.Chinese Journal of Ecology, (5): 925-932. (in Chinese)By using the 1982-2006 NASA/GIMMS half-monthly composite NDVI data of 8 km resolution and related climate data, and based on the investigations of terrain, land use, and vegetation, this paper classified Shanxi Province into 9 typical ecological areas, and analyzed the dynamic changes of annual, decadal, and monthly NDVI as well as the responses of the NDVI to precipitation, air temperature, and PSDI in the areas. The results indicated that in recent 25 years, the NDVI in the Province had an increasing trend, and exhibited an obvious annual variation. The NDVI was higher in southern part than in northern part, and in eastern part than in western part. For different ecological areas, forested area had the highest NDVI, followed by agricultural area, and pasturing area. The vegetation index in forested area increased obviously in spring, and that in most ecological areas except southern agricultural area represented single apex type. The NDVI in forested area related well with air temperature, and the correlation of NDVI with PDSI was more closely than with precipitation or air temperature. The responses of vegetation index to climate change had an obvious lag effect, and the annual variation of precipitation, especially the accumulative effect of precipitation, affected vegetation index significantly.

DOI

[27]
Wu Zhitao, Wu Jianjun, Liu Jinghuiet al., 2013. Increasing terrestrial vegetation activity of ecological restoration program in the Beijing-Tianjin Sand Source Region of China.Ecological Engineering, 52(3): 37-50.China's capital city, Beijing, has been suffering from sandstorms due to grassland degradation and the large distribution of deserts in western and Northern China, named as the Beijing–Tianjin Sand Source Region (BTSSR). To improve the ecological condition in the BTSSR and to reduce its impacts, the Chinese government has adopted the Beijing–Tianjin Sand Source Control Program since 2001. It is necessary to rigorously evaluate the effectiveness of this 10 years’ program, not only as an essential topic of environmental change in an ecologically vulnerable area, but also as an important aspect of policy efficiency assessments. Toward this aim, this study assessed vegetation changes both temporally and spatially in the areas under the program from 2000 to 2010 with the Moderate-resolution Imaging Spectroradiometer (MODIS) monthly Normalized Difference Vegetation Index (NDVI) data and trend analysis method. The results showed an overall improvement and its spatial variation in vegetation activity. The annual NDVI increased by 0.012102year 611 over 64.33% of the total area, with the greatest increasing trend of NDVI occurring in the spring. However, the change in NDVI varied remarkably in space. This study identified a southwest-to-northeast band in the study area where NDVI decreased notably, while most of the BTSSR experienced a positive trend of NDVI. Although the cause of the increased NDVI in the BTSSR remains uncertain, drought may result in a non-significant increasing trend in vegetation activity and the ecological restoration program may be one of the main driving forces behind the increasing trend in vegetation activity. All of these findings will enrich our knowledge of human activities that impact vegetation in arid and semi-arid environments and will provide a scientific basis for the management of ecological restoration programs.

DOI

[28]
Xin Zhongbao, Xu Jiongxin, Zheng Wei, 2008. Spatiotemporal variations of vegetation cover on the Chinese Loess Plateau (1981-2006): Impacts of climate changes and human activities. Science in China Series D: Earth Sciences, 51(1): 67-78.

[29]
Xu Lili, Li Baolin, Yuan Yechenget al., 2015. A temporal-spatial iteration method to reconstruct NDVI time series datasets.Remote Sensing, 7(7): 8906-8924.

[30]
Xu Xingkui, Levy J K, Lin Zhaohuiet al., 2006. An investigation of sand-dust storm events and land surface characteristics in China using NOAA NDVI data. Global and Planetary Change, 52(1): 182-196.Observations from 560 weather stations in China show that sand–dust storms occur most frequently in April in north China. The region consists of Sub-dry Mid Temperate, Dry Mid Temperate, Sub-dry South Temperate and Dry South Temperate Zones and much of the land surface is desert or semi-desert: it is relatively dry with minimal rainfall and a high annual mean temperature. In most regions of China, the annual mean frequency of sand–dust events decreased sharply between 1980 and 1997 and then increased from 1997 to 2000. Statistical analyses demonstrate that the frequency of sand–dust storms correlates highly with wind speed, which in turn is strongly related to land surface features; on the other hand, a significant correlation between storm events and other atmospheric quantities such as precipitation and temperature was not observed. Accordingly, land surface cover characteristics (vegetation, snowfall and soil texture) may play a significant role in determining the occurrence of sand–dust storms in China. Analysis of Normalized Difference Vegetation Index derived from National Oceanic and Atmospheric Administration and Empirical Orthogonal Function show that since 1995 surface vegetation cover in large areas of Northern China has significantly deteriorated. Moreover, a high correlation is shown to exist among the annual occurrence of sand–dust storms, surface vegetation cover and snowfall. This suggests that the deterioration of surface vegetation cover may strongly influence the occurrence of sand–dust storms in China. Soils with coarse and medium textures are found to be more associated with sand–dust storms than other soils.

DOI

[31]
Xu Xuegong, Chen Xiaoling, Guo Honghaiet al., 2001. A study of land use and land cover quality change: Taking Yellow River Delta as a case.Acta Geographica Sinica, 56(6): 640-648. (in Chinese)Land use and land cover change (LUCC) plays, an important part in the studies of global environmental change and sustainable development. Land quality change can particularly reflect the impacts of human socio-economic activities on environment. By means of land classification for LUCC to different times of remote sensing information, picking-up vegetation index (NDVI), and assaying field repeated soil samples, as well as statistical analysis, this paper studies land use and land cover quality change of past several to 21 years in the Yellow River Delta. The conclusions are as follows: 1.In the Yellow River Delta, although sediment loads carried by the Yellow River result in rapid expansion of land area, the main driving force of LUCC is derived from human economic activities. 2.In the macroscopic view, land use and land cover quality change shows a tendency to improve because of water conservancy projects, vegetation cover and increase of per unit area yield of crop so that the overall ecological environment is improving in the mass. But in the microcosmic and point analysis, there are different and imbalanced development within the region. The task of transforming saline land is still arduous. The hidden trouble of soil fertility depression can not be neglected. 3.Both natural force and human action can engender environmental positive and negative effects. But it is more difficult to restore the latter made by human activities. The paper brings forward measures for sustainable land use. Finally, there is a discussion about issues of further study.

DOI

[32]
Xu Zhongmin, Cheng Guodong, 2005. Impacts of population and affluence on environment in China.Journal of Glaciology and Geocryology, 27(5): 767-773.Growing evidence demonstrated that human has dramatically altered the global environment.Identifying the specific forces driving environmental impacts is a hot topic in the field of sustainable development.One key limitation to a precise understanding of anthropogenic impacts is the absence of a set of refined analytic tools.Firstly,the analytic utility of the well-known IPAT identity and its newly advance,including the developed ImPACT identity and STIRPAT model,is assessed.Then the stochastic model in details and illustrated its application are introduced.With STIRPAT,it is easy to determine the population and affluence elasticity of impact,using cross-sectional,time-series data,and the antilog of the residuals in STIRPAT can be interpreted as a specific multiplier of technology on environmental impacts or the eco-efficiency of technology.Secondly,taking China as a case,the anthropogenic driving forces of environmental impacts using the STIRPAT model and cross-sectional data in 1999 is unpacked.The ecological footprint was taken as the index of environmental impacts due to its strength in accounting for impacts wherever they occur geographically and providing a common unit of measurement for comparing diverse types of impacts.A series of index like urbanization rate,economic structure,economic system position and natural location are considered in the empirical model.Among these variables,the social and political variables like economic system position and natural location are coded as dummy variables.The quadratic terms of affluence and urbanization rate are included to examine the environmental Kuznets curve hypothesis.Thirdly,the analysis results show that population has a proportional effect(approximately unit elasticity) on ecological footprint,and affluence monotonically increases the ecological footprint with a relative low degree than population. Natural location appears to affect the ecological footprint,with southern China having considerably lower impact than northern China.At he same time,the technological eco-efficiency of sample provinces was discussed in details.The most important finding in the empirical study was that overall finding don’t support the environmental Kuznets curve hypothesis.Finally we discussed the advantage of using the STIRPAT and analyses the reason why not support the environmental Kuznets curve hypothesis in empirical analysis.Based on the analysis of future environmental impacts using estimation model,we put forward that the social adaptation should be taken as the direction of succeeding research.

[33]
Yi Lang, Ren Zhiyuan, Zhang Chonget al., 2014. Vegetation cover, climate and human activities on the Loess Plateau.Resources Sciences, 36(1): 166-174. (in Chinese)Here, spatial and temporal variation in vegetation cover on the Loess Plateau is analyzed using Sen + Mann-Kendall, correlation analysis and residual analysis methods based on the SPOT VGT normal difference vegetation index and meteorological data from 1999-2010. We found that Loess Plateau vegetation cover shows an increasing trend and its growth has been 0.1497/a. However, there is an obvious spatial distribution between regions and in the eastern region vegetation NDVI growth is better than the western region. The change in vegetation cover is correlated with precipitation and this is the main factor driving vegetation change. The Green for Grain Project has greatly increased vegetation cover and rehabilitation across the Loess Plateau, but regional urbanization and industrialization, overgrazing, logging and excessive reclamation and mining have decreased vegetation NDVI in the area. Overall, however, there has been a net positive impact and the Green for Grain Project has highlighted the ecological effects across the Loess Plateau.

[34]
Zhang Jiping, Zhang Linbo, Xu Cuiet al., 2014. Vegetation variation of mid-subtropical forest based on MODIS NDVI data: A case study of Jinggangshan City, Jiangxi Province. Acta Ecologica Sinica, 34(1): 7-12.Vegetation variation is an important topic of global change research, which is of great significance to deeply understand the relationship between vegetation and global change or human activities, and to disclose regional environment evolution and transition. The dynamics of forest vegetation in the mid-subtropical zone have received little attention. Thus, this paper takes the typical distribution area of the subtropical forest ecosystem — Jinggangshan City in Jiangxi Province as a study area. The changes within the year, inter-annual changes trend and spatial variation of the mid-subtropical forest vegetation index during the recent 10years are analyzed based on MODIS NDVI data from 2000–2011 with the spatial resolution of 250m. The Savitzky–Golay filter is used to smooth the original MODIS NDVI data. The forest distribution data is taken as the mask to eliminate the impact of non-forest cover area. The results showed that: (1) The changes of forest vegetation index within the year present a single peak mode with the maximum value in July; in the past 10years, the forest vegetation index fluctuated with a downward trend; NDVI values were high and stable in summer and autumn, but low and unstable in winter; (2) The distribution of NDVI values of forest vegetation had great spatial difference. The NDVI values were low in the area nearby non-forest area in the north, where the non-forest vegetation is widely distributed. The NDVI values were high in the northwestern and southeastern areas. The distribution of NDVI values are comparatively even in the middle area with the NDVI values of more than 0.7; (3) High NDVI values (>0.75) distributed most in the northwestern and southeastern areas with the altitude of 400–600m. Low NDVI values (<0.65) distributed mostly in the northern areas with the altitude less than 400m. As for different altitude zones, NDVI values are high in the area with altitude of 400–800m and low in the area with altitude below 400m or above 1200m. There is an agreement between the spatial distribution of the NDVI value of forest vegetation and regional topography, because topography has great impacts on the distribution of forest types which are different in coverage; (4) The NDVI value of forest vegetation presents a downward trend in the northern area, but an increasing trend in the southern area. The vegetation coverage tends to decrease with high population density and intensive distribution of township and scenic spot.

DOI

[35]
Zhang Li, Guo Huadong, Ji Leiet al., 2013. Vegetation greenness trend (2000 to 2009) and the climate controls in the Qinghai Tibetan Plateau.Journal of Applied Remote Sensing, 7(1): 073572-073572.The Qinghai-Tibetan Plateau has been experiencing a distinct warming trend, and climate warming has a direct and quick impact on the alpine grassland ecosystem. We detected the greenness trend of the grasslands in the plateau using Moderate Resolution Imaging Spectroradiometer data from 2000 to 2009. Weather station data were used to explore the climatic drivers for vegetation greenness variations. The results demonstrated that the region-wide averaged normalized difference vegetation index (NDVI) increased at a rate of 0.036 yr. Approximately 20% of the vegetation areas, which were primarily located in the northeastern plateau, exhibited significant NDVI increase trend (p-value <0.05). Only 4% of the vegetated area showed significant decrease trends, which were mostly in the central and southwestern plateau. A strong positive relationship between NDVI and precipitation, especially in the northeastern plateau, suggested that precipitation was a favorable factor for the grassland NDVI. Negative correlations between NDVI and temperature, especially in the southern plateau, indicated that higher temperature adversely affected the grassland growth. Although a warming climate was expected to be beneficial to the vegetation growth in cold regions, the grasslands in the central and southwestern plateau showed a decrease in trends influenced by increased temperature coupled with decreased precipitation.

DOI

[36]
Zhang Qingyu, Zhao Dongsheng, Wu Shaohonget al., 2013. Research on vegetation changes and influential factors based on eco-geographical regions of Inner Mongolia.Scientia Geographica Sinica, 33(5): 594-601. (in Chinese)<p>This study constructed growing season NDVI in 1982-2011 based on GIMMS and MODIS data in Inner Mongolia. The spatial and temporal characteristics of inter-annual NDVI changes were analyzed and natural and human influence factors were investigated in different eco-geographical regions. The results show that, linear regression equation is a good method to modify NDVI in GIMMS and MODIS remote images. The growing season NDVI increased on the whole and the increase rate was 0.265% and displayed significant inter-annual fluctuations in the past 30 years. NDVI decreased significantly in 1982-1986, then increase significantly during 1997-2002, and relative steady phases were in 1986-1997 and in 2002-2011. NDVI that increased most significantly were located in the northern of Inner Mongolia. However, there were 5.075% regions decreased which mainly distributed on typical steppe in Hulun Buir and Xilin Gol. NDVI change rates of different vegetations from eco-geographical region were in the following order: farm and shrub &gt; forest &gt; farm and typical steppe &gt; meadow and meadow steppe &gt; typical steppe and farm &gt; typical steppe &gt; desert steppe &gt; desert. NDVI change rate was fastest in IIC2 eco-geographical region which was 0.277 and slowest in IID2 eco-geographical region which was 0.001. NDVI was significantly correlated with precipitation in most regions and presented obvious strap regularity from east to west, which was negative correlation in the eastern region, positive correlation in center region and no correlation in the western region. However, great differences existed in different eco-geographical region of Inner Mongolia. Eco-geographical region of IIA3, IA1 had biggest correlation which more than 0.5 but significant negative correlate between NDVI and precipitation in all regions. NDVI had little significantly positive correlations with temperature in Inner Mongolia whose correlations were less than 0.2 in most eco-geographical regions. However, NDVI exhibited significant positive correlations with temperature in highland desert steppe region of Western Inner Mongolia and highland steppe region of Eastern Inner Mongolia. Vegetation that influenced by human activities was gradually increased with the increase of vegetation complex degree in the last 30 years. There are most effects by human activities in IIC1, IIC2, IIIB3 eco-geographical region which located on the south of the Da Hinggan Mountains and least effects in IA1, IIB2, IIA3 eco-geographical region which distributed in the northeastern of the mountains. In the areas where human activities heavily restrained NDVI increased by 41.165%, and they were located in IIC3, IIC4 and IID2 eco-geographical region, in the other eco-geographical regions NDVI were promoted about 58.835% obviously. In IIC1, IIC2, IIIB3 eco-geographical region human activities promote NDVI most significantly. NDVI was promoted by national policies such as the natural forest protection project, conversion of cropland to forest and grassland project, desertification treatment and so on. However, over grazing, excessive reclamation, rapid urbanization etc could lead NDVI decrease.</p>

[37]
Zhang Wentong, 2004. Advanced Tutorial for SPSS Statistical Analysis. Beijing: Higher Education Press, 91-117. (in Chinese)

[38]
Zhou Xinyin, Shi Huading, Wang Xiuru, 2014. Impact of climate and human activities on vegetation coverage in the Mongolian Plateau.Arid Zone Research, 31(4): 604-610. (in Chinese)Global climate change and Global Change and Terrestrial Ecosystems (GCTE) are currently the hot and difficult topics in researching global change. Climate change impacts significantly the global ecosystems, and it has become as an important issue to ascertain the interaction between climate change and ecosystems at different scales and reveal the responses of ecosystems to climate change. Based on GIMMS Normalized Difference Vegetation Index (NDVI) data in the Mongolian Plateau during the period from 1981 to 2006, the spatial and temporal variations of vegetation coverage were studied, and the factors affecting the change of vegetation coverage were analyzed from the perspectives of climate change and human activities. Vegetation coverage in the Mongolian Plateau was generally improved in a fluctuation way during the period of 1981-2006, and the improvement included the following phases: ① Relatively stable phase during the period of 1981-1988; ② Persistently increasing phase during the period of 1989-1993; ③ Relatively low phase during the period of 1994-1998; and ④ Persistently increasing phase during the period of 1999-2006. There was an obvious zonal spatial and temporal distribution of annual maximum NDVI in the Mongolian Plateau during the period of 1981-2006, and the NDVI change trend was different from different land use types: The vegetation in forest area with high NDVI value was in degeneration, there was a significant negative correlation between temperature and precipitation, and the area with vegetation regeneration was much smaller than that with vegetation degeneration. The vegetation coverage in farmland with relatively low NDVI value was in a significant increase trend, there was a significant increase trend of both temperature and precipitation, the NDVI value was obviously increased under the dramatic effect of human activities, and the area with vegetation regeneration in farmland and grasslands were much larger than that with vegetation degeneration.

Outlines

/