Orginal Article

Analysis of spatio-temporal features of a carbon source/sink and its relationship to climatic factors in the Inner Mongolia grassland ecosystem

  • DAI Erfu , 1 ,
  • HUANG Yu 2 ,
  • Wu Zhuo , 1, 3 ,
  • ZHAO Dongsheng 1
Expand

Author: Dai Erfu (1972-), PhD and Professor, specialized in comprehensive study of physical geography, climate change and regional response, simulation of LUCC. E-mail:

*Corresponding author: Wu Zhuo (1988-), PhD Candidate, specialized in land use and ecological process. E-mail:

Received date: 2015-09-20

  Accepted date: 2015-10-23

  Online published: 2016-07-25

Supported by

National Basic Research Program of China (973 Program), No.2015CB452702, No.2012CB416906

National Natural Science Foundation of China, No.41571098, No.41371196

National Key Technology R&D Program, No.2013BAC03B04

Copyright

Journal of Geographical Sciences, All Rights Reserved

Abstract

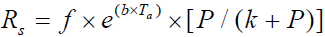
Global climate change has become a major concern worldwide. The spatio-temporal characteristics of net ecosystem productivity (NEP), which represents carbon sequestration capacity and directly describes the qualitative and quantitative characteristics of carbon sources/sinks (C sources/sinks), are crucial for increasing C sinks and reducing C sources. In this study, field sampling data, remote sensing data, and ground meteorological observation data were used to estimate the net primary productivity (NPP) in the Inner Mongolia grassland ecosystem (IMGE) from 2001 to 2012 using a light use efficiency model. The spatio-temporal distribution of the NEP in the IMGE was then determined by estimating the NPP and soil respiration from 2001 to 2012. This research also investigated the response of the NPP and NEP to the main climatic variables at the spatial and temporal scales from 2001 to 2012. The results showed that most of the grassland area in Inner Mongolia has functioned as a C sink since 2001 and that the annual carbon sequestration rate amounts to 0.046 Pg C/a. The total net C sink of the IMGE over the 12-year research period reached 0.557 Pg C. The carbon sink area accounted for 60.28% of the total grassland area and the sequestered 0.692 Pg C, whereas the C source area accounted for 39.72% of the total grassland area and released 0.135 Pg C. The NPP and NEP of the IMGE were more significantly correlated with precipitation than with temperature, showing great potential for C sequestration.

Cite this article

DAI Erfu , HUANG Yu , Wu Zhuo , ZHAO Dongsheng . Analysis of spatio-temporal features of a carbon source/sink and its relationship to climatic factors in the Inner Mongolia grassland ecosystem[J]. Journal of Geographical Sciences, 2016 , 26(3) : 297 -312 . DOI: 10.1007/s11442-016-1269-0

1 Introduction

Climate change has become a major cause for concern worldwide. Several international climate negotiations have been held since the establishment of the Intergovernmental Panel on Climate Change in 1988 (Mansanet-Bataller and Pardo, 2008; Houghton et al., 1992). The carbon cycle and the greenhouse effect have long been the focus of global change research programs, such as the Global Carbon Project and the Global Change and Terrestrial Ecosystem (Suand Zhou, 2002). According to the United Nations Framework Convention on Climate Change, the sink or source of greenhouse gases (GHG) refers to any process, activity, or mechanism that eliminates or emits GHG, aerosols, and their precursor compounds from or into the atmosphere (Houghton et al., 2001). Study of the carbon sinks of terrestrial ecosystems has become a point of particular interest in the world because of the challenge of global climate change (Zhan et al., 2012). In recent years, many studies in different regions have addressed carbon sinks using various models and have consistently shown carbon sinks in the Northern Hemisphere at mid-latitude (Battle et al., 2000; Pan et al., 2011; Sarmiento et al., 2010). As gigantic carbon pools, grassland ecosystems are integral for carbon cycling in terrestrial ecosystems (Yang et al., 2010; Yang et al., 2008).
Grasslands of China account for 10% of the world’s total grassland area, and estimations show that they store 9%-16% of the world’s total grassland carbon (Ni, 2002). As one of the dominant types of terrestrial ecosystems, grassland ecosystems serve a variety of ecological purposes, such as functioning as a windbreak and in sand fixation, in water and soil conservation, and in biodiversity protection (Zhao et al., 2004; Adams et al., 1990; Scurlock and Hall, 1998). Grasslands in northern China account for 78% of the total grassland area in China, and Inner Mongolia grasslands located in the arid and semi-arid climate zones are an important constituent of the Eurasian temperate steppes, and a classic representation of the northern grasslands (Sun, 2005). In addition, they are located in one of the International Geosphere-Biosphere Programme (IGBP) terrestrial transects, which is a region that is very sensitive to climate change (Bai et al., 2008; Steffen et al., 1992). Therefore, it is of great importance to study the carbon sources/sinks (C sources/sinks) and their relationship with climatic factors in the Inner Mongolia grassland ecosystems (IMGE) in order to understand the effects of global climate change. Net primary productivity (NPP) and net ecosystem productivity (NEP) are the two most important indices for quantitatively analyzing C sources/sinks and can be used to indicate the response of grassland ecosystems to climate change (Woodwell et al., 1978; Raich and Schlesinger, 1992). NEP is an important index used to represent the carbon budget on a larger spatial scale and also to represent the process of carbon exchange between the ecosystem and the atmospheric system (Sitch et al., 2003; Mack et al., 2004; Zhang et al., 2014). The ecosystem is a C sink when the NEP is above zero; otherwise, it is a C source (Woodwell et al., 1978).The variable pattern of the NPP and NEP for grassland ecosystems, which is affected by global climate change, is related to the effect of temperature and precipitation on the metabolism of plants and is also related to the spatial pattern of climatic factors, especially in arid and semi-arid ecosystems (Bai et al., 2004; Zhang et al., 2014). Therefore, accurate assessment of the grassland ecosystem carbon reservoirs in this region and their dynamics will certainly contribute to a better understanding of the relationship between the climate and grassland ecosystems, as well as achieving the sustainable utilization of grassland resources (Niu, 2001; Zhang et al., 2013).
In this study, which was based on field sampling data, remote sensing data and ground meteorological observation data, NPP remote sensing estimation and soil heterotrophic respiration models were used to estimate the NPP and NEP of the IMGE from 2001 to 2012. The dynamics of the spatio-temporal features of the NPP and NEP over the same period of time and their relationships with temperature and precipitation were determined, and the spatial distribution of C sinks and C sources in the area over the last 10 years was mapped. The results of this study may help to facilitate the adoption and implementation of effective measures to increase C sinks and decrease C sources in grassland ecosystems.

2 Data sources and method

2.1 Study area

The study area covers the temperate steppe in Inner Mongolia, extending from the Greater Hinggan Mountains in the east to Juyan Lake in the west and adjoining Mongolia in the north. The area features a long, narrow strip of sloping land that stretches from northeast to southwest. In 2010, the grasslands in this region, which span approximately 52.15 × 10⁴ km2, accounted for 44.08% of the total area of Inner Mongolia. Topographically, the area belongs to the Inner Mongolian Plateau, with an elevation of 1000-1200 m. The landscape is mostly flat. The Greater Hinggan Mountain is in the northeast, and the Yinshan and Helan Mountains are in the southwest. The climate types of the area are semi-humid, semi-arid, and arid, and the hydrothermal conditions in this region are zonally distributed from northeast to southwest. Here, precipitation decreases from 400 mm to 100 mm, the accumulative temperature (≥10°C) increases from 2050°C to 2400°C, and the Ivanov moisture index decreases from 1.0 to 0.3 (Niu, 2001). In the study area, differences in hydrothermal conditions, topography and other factors result in vegetation spatial heterogeneity, such as meadow steppe (zones IIB3 and IIB1), typical steppe (zones IIC1, IIC2, IIC3, IIC4, and IID1), and desert steppe (zone IID2), in sequence from east to west (Table 1 and Figure 1).
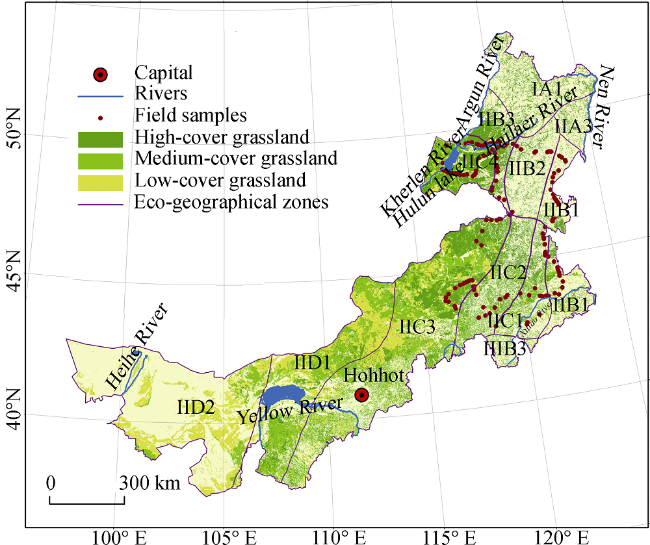
Table 1 Eco-geographical zonal systems of Inner Mongolia
Temperature
zones
Humid and arid
zones
Codes Eco-zones Vegetation type
I Cold tem-
perate zone
A (humid zone) IA1 Deciduous coniferous forest north of Greater Hinggan Mts. Coniferous forest, wetland
II Temperate
zone
A (humid zone) IIA3 Mixed forest east of Songliao Plain Mixed forest, wetland
B (semi-humid zone) IIB1 Forest steppe at center of Songliao Plain Meadow steppe, farmland
IIB2 Steppe forest at the center of Greater Hinggan Mts. Broadleaf forest, meadow
IIB3 Forest steppe west of Greater Hinggan Mts. Meadow steppe
C (semi-arid zone) IIC1 Steppe zone in Xiliao River Plain Typical steppe, farmland
IIC2 Forest steppe south of Greater Hinggan Mts. Typical steppe, shrub
IIC3 Steppe zone east of Inner
Mongolia
Typical steppe, farmland
IIC4 Steppe zone of Hulun Buir Typical steppe, meadow
D (arid zone) IID1 Desert steppe zone in Ordos and west of Inner Mongolia Typical steppe, desert
IID2 Desert zone in Alax and
Hexi Corridor
Desert, desert steppe
III Warm
temperate zone
B (semi-humid zone) IIIB3 Montane deciduous broadleaf forest in North China Farmland, typical steppe

Note: The eco-zones mentioned above are represented by codes (Zhang et al., 2013).

Figure 1 Eco-geographical regionalization, field samples and grassland distribution in Inner Mongolia in 2010

2.2 Data sources and processing

To estimate grassland NPP and NEP, and to investigate their relationship with climatic variables, remote sensing images, meteorological data, field sampling data and other results from other mapping techniques were collected and sorted. The remote sensing images were EOS/MODIS vegetation index products MOD13Q1 provided by NASA (https://ladsweb.nascom.nasa.gov/data/search.html), with a temporal resolution of 16 d and a spatial resolution of 250 m × 250 m. Meteorological data, including temperature and precipitation data, were obtained from the Chinese Surface Monthly Climate Datasets available on the China Meteorological Data Sharing Service System (http://cdc.nmic.cn/home.do). Solar radiation data were derived from the Chinese Monthly Solar Radiation Datasets. Field sampling data were obtained by field sampling from July to August in 2011 and 2012. A total of 120 trial plots were established, and three quadrats of 1 m × 1 m were distributed randomly in each plot. Aerial biomass samples were collected after removal of the adhered soil and gravel, dried at 65°C for 24 h, and then weighed. Other mapping techniques included the land use data and digital elevation model provided by the Resource and Environment Scientific Data Center, Chinese Academy of Sciences.
Data preprocessing mainly involved the processing of remote sensing images and mete-orological data. After applying transformation of projection, montage, clip, maximum value composite, and Savitzky-Golay filter to the remote sensing images, monthly MODIS NVDI data from 2001 to 2012 in Inner Mongolia were obtained. Temperature and precipitation data were processed using ANUSPLIN, a professional interpolation software for meteorological data based on the theory of the thin plate smoothing spline function and incorporating the co-variate linear sub-model, which enhances the precision of spatial interpolation of meteorological data and reflects rates between the meteorological variables and their influencing factors (Liu et al., 2008). Kriging spatial interpolation methods were applied to solar radiation data using the Geostatistical Analyst Module in ArcGIS software.

2.3 Method

2.3.1 Methods for NPP estimation
NPP, defined as the rate at which all of the plants in an ecosystem accumulate chemical energy through photosynthesis, is calculated by subtracting the value of the gross primary production (GPP) from autotrophic respiration (Ra). NPP estimation has been done by many previous studies around the world (Prince and Goward, 1995; DelGrosso et al., 2008; Goetz et al., 1999; Fang et al., 2000). In this study, the light use efficiency (LUE)-based remote sensing estimation model improved by Zhu et al. (2005) was used to estimate the NPP (g C/m2) in the study area from 2001 to 2012. Compared with other models, there are three advantages to this model. Firstly, it incorporates the classification of vegetation coverage and considers the effects of classification accuracy on NPP estimation. Secondly, combined with observed NPP, the maximum LUE for typical vegetation types in China are simulated based on minimum error, and thus the model is highly suited to China. Finally, this model is combined with existing regional evapotranspiration models, and computation of the water restriction factor is driven by ground meteorological data (Zhu et al., 2007). In this model, NPP can be calculated using the absorbed photosynthetically available radiation (APAR) and real LUE(ε) (Eqn. 1). The input parameters include monthly mean temperature, monthly total precipitation, monthly total solar radiation, normalised difference vegetation index (NDVI) time-series data, vegetation map, and static parameter documents. The outputs of this model include time-series documents of NPP and vegetation coverage:
NPP(x, t)=APAAR(x ,t)×ε(x,t) (1)
where APAR(x, t) is the solar radiation absorbed by pixel x in the month t (g C/m2) and ε(x, t) is the real LUE of pixel x in the month t (g C/MJ).
2.3.2 Methods for NEP estimation
The C sink of an ecosystem corresponds to the difference between NPP and heterotrophic respiration (Rh) regardless of other natural and anthropogenic factors (Eqn. 2):
NEP=NPP-Rh
To estimate Rh, the soil respiration estimation model proposed by Bond-Lamberty et al. (2004) was used (Eqn. 3):
ln(Rh)=0.22+0.87×(Rs)
where Rh is the annual rate of soil heterotrophic respiration (kg C/m2·a) and Rs is the annual rate of soil respiration (kg C/m2·a). The model was found to be effective (p<0.05) based on over 100 samples.
To estimate Rs, the soil respiration model proposed by Raich et al. (2002) was used (Eqn. 4):
where b is the temperature sensitivity coefficient (b= lnQ10/10), Ta is the monthly mean temperature (°C), P is the monthly precipitation (cm), and both f and k are constants (f=1.250, k=4.259).
2.3.3 Interannual variations in NPP and NEP
The interannual variations in NPP and NEP from 2001 to 2012 were determined using Theil-Sen median tendency analysis. There are certain advantages in estimating the tendency for long time-series data. The Theil-Sen is a non-parametric statistical test for a trend detection data sequence, and it is resistant to data error (Yuan et al., 2013) (Eqn. 5):
where (NPP/NEP)i is the value of NPP or NEP in the year i and (NPP/NEP)j is the value of NPP or NEP in the year j. When NPP/NEP>0, NPP or NEP shows an increasing trend. Otherwise, NPP or NEP shows a decreasing trend.
2.3.4 Correlation analysis
Based upon the pixels in a local region, spatial analysis was performed to identify correlations between the NPP/NEP of a grassland ecosystem and meteorological variables, such as temperature and precipitation. Subsequently, the biased correlation coefficients were calculated (Mu et al., 2013) (Eqn. 6):
where Rxy is the correlation coefficient between x and y, xi is NPP in the year i. yi is mean precipitation or mean temperature in the year i. 
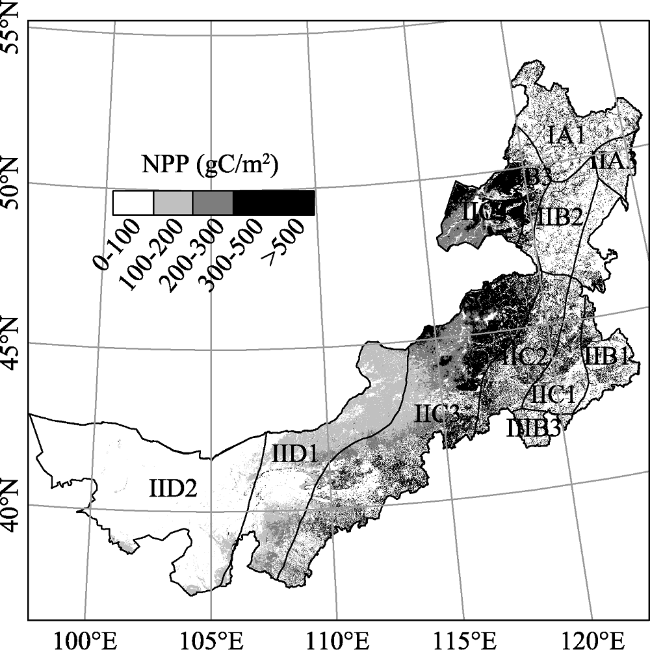
is the average NPP for years. is mean precipitation or mean temperature over years (2001-2012) and n is the number of samples.

3 Results

Based on previously described methods, results were mainly discussed from three aspects: the spatio-temporal characteristics of NPP and NEP, the spatio-temporal dynamics of NPP and NEP, and the response of the main climatic variables to NPP and NEP, and were validated by comparing the estimated and the measured values of NPP.

3.1 Spatio-temporal characteristics of NPP and NEP

3.1.1 Spatio-temporal characteristics of NPP
Generally, the NPP of grasslands in Inner Mongolia decreased from east to west from 2001 to 2012 (Figure 2). The average annual NPP and total annual NPP in this region were 278.83 g C/m2 and 0.146 Pg C, respectively. Comparison between NPPs in different eco-geographical zones showed a strong spatial heterogeneity and a longitudinal zonal pattern (Table 2). The highest value of NPP was in the northern forest steppe zone, followed by the typical central and western desert steppe zones.
Figure 2 Spatial distribution of average NPP in the Inner Mongolia grassland ecosystem from 2001 to 2012
The major vegetation type in the east of Inner Mongolia was meadow, which was mingled with forests. Because of the effect of the forests on the transitional region, the grassland productivity was relatively higher than that of any other zones. This type of ecosystem was mainly distributed in zones IIB3 and IIB1, where the average annual NPPs were 487.44 g C/m2 and 405.04 g C/m2, respectively. In central Inner Mongolia, the major vegetation cover was typical steppe, which comprises the main body of the Inner Mongolia steppe. The average annual NPP in this area ranged from 200 g C/m2 to 500 g C/m2. In addition, the average annual grassland NPPs in zones IIC2, IIC1, IIC4, and IIC3 were 466.14, 363.14, 323.67, and 301.91 g C/m2, respectively, and the average annual NPP to the west of zones IIC3 and IIC4 only ranged from 200 g C/m2 to 300 g C/m2. In the west of Inner Mongolia, the major vegetation cover was desert steppe and typical steppe. The average annual grassland NPP ranged from 0 g C/m2 to 200 g C/m2. This type of ecosystem was mainly concentrated in zones IID1 and IID2, and the average annual NPP in these areas were 153.08 g C/m2 and 76.48 g C/m2, respectively.
Table 2 Average NPP in eco-geographical zones of the Inner Mongolia grassland ecosystem from 2001 to 2012
Eco-zones NPP (g C/m2)
IA1 590.99
IIA3 591.27
IIB1 405.05
IIB2 593.64
IIB3 487.52
IIC1 363.16
IIC2 466.15
IIC3 301.88
IIC4 323.65
IID1 153.05
IID2 76.45
IIIB3 528.94
3.1.2 Spatio-temporal characteristics of NEP
Similarly, the accumulated interannual NEP in Inner Mongolia from 2001 to 2012 showed a significant decreasing trend from east to west (Figure 3). The areas occupied by the C sink (NEP>0) and C source (NEP<0) sectors were approximately 31.43 × 10⁴ km2 (60.28% of the total steppe area) and 20.71 × 10⁴ km2 (39.72% of the total steppe area), respectively. The average quantity of C sequestered by the grassland ecosystem in the C sink sector over the past 12 years was 2201.25 g C/m2, and the total C sequestration for the entire study area was approximately 0.692 Pg C. The average grassland ecosystem C emitted in the C source sector over the past 12 years was 651.47 g C/m2, and the total C emission in the entire study area was approximately 0.135 Pg C. In addition, the total amount of net C sink in the IMGE was as high as 0.557 Pg C from 2001 to 2012, and the annual rate of C sequestration was 0.046 Pg C/a.
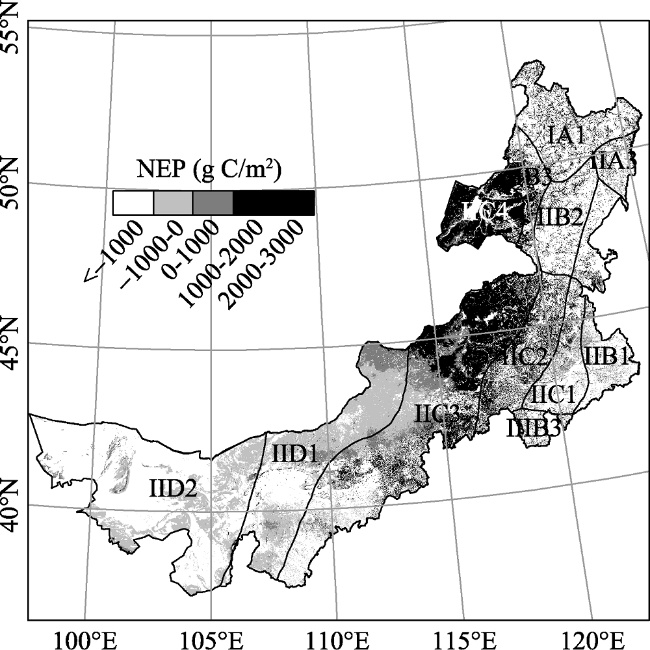
Table 3 Average NEP in eco-geographical zones of the Inner Mongolia grassland ecosystem from 2001 to 2012
Eco-zones NEP (g C/m2)
IA1 4448.90
IIA3 3972.41
IIB1 1297.88
IIB2 4353.57
IIB3 3194.29
IIC1 885.54
IIC2 2626.31
IIC3 715.18
IIC4 1295.56
IID1 -960.22
IID2 -1436.88
IIIB3 2849.03
The C source/sink distribution of grassland ecosystems in different eco-zones showed spatial distinction and longitudinal zonation (Table 3). The C sink sector was mainly represented by zones IIB3, IIC2, IIC4, and IIC3, where the average accumulated C over the past 12 years was 3967.65, 3028.35, 2085.38, and 1146.61 g C/m2, respectively. The IIB1 steppe zone in the central area of the Songliao Plain and the IIC1 steppe zone in the Xiliao River Plain were generally C sinks, but their C sink capability was relatively low, with average accumulated C sequestrations of 607.85 and 428.10 g C/m2, respectively, from 2001 to 2012. The C source sector mainly covered zones IID1 and IID2, with average annual C emissions of 383.05 and 530.69 g C/m2, respectively. Additionally, the south of IIB1 and the southwest of IIC1 were also shown to be C sources.
Figure 3 Spatial distribution of the total NEP in the Inner Mongolia grassland ecosystem from 2001 to 2012

3.2 Spatio-temporal dynamics of NPP and NEP

3.2.1 Interannual variations of NPP and NEP
The NPP and NEP of the IGME increased throughout the study period (Figure 4). The average annual NPP ranged from 200 g C/m2 to 350 g C/m2 and the NEP ranged from 50 g C/m2 to 150 g C/m2. The annual growth rates of the NPP and NEP were 3.781 and 2.104 g C/m2·a, respectively. Looking at the time series, the NPP and NEP were hardly synchronized from 2001 to 2012. The oscillations and variations of the NPP and NEP over the past 12 years suggested that the NEP was closely linked to the NPP and to soil respiration.
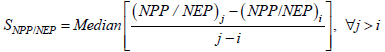
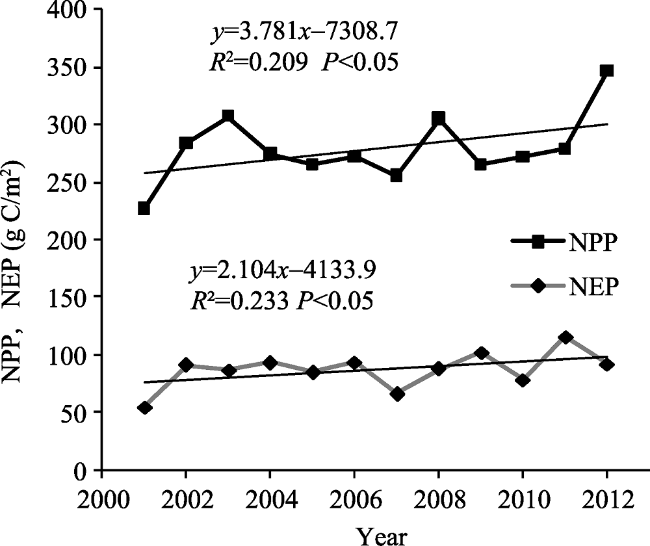
Figure 4 The variation trend in NPP and NEP in the Inner Mongolia grassland ecosystem from 2001 to 2012
3.2.2 Spatio-temporal dynamics of NPP
The NPP in the grassland ecosystems in most parts of Inner Mongolia showed an increasing trend from 2001 to 2012 (Figure 5). The average growth rate was 3.56 g C/m2·12a. The area of grassland that showed an increased NPP was 43.56 × 10⁴ km2, accounting for 83.6% of the total steppe area. Areas showing an NPP growth rate from 0-5 g C/m2·12a accounted for 47.3%, those showing an NPP growth rate from 5-10 g C/m2·12a accounted for 26.64%, and those showing an NPP growth rate from 10-15 g C/m2·12a accounted for 8.21%. Consequently, only 1.45% of the NPP growth rate exceeded 15 g C/m2·12a. The area of grassland showing a decreased NPP was 8.55 × 10⁴ km2, or 16.4% of the total steppe area. Grassland showing a negative NPP growth rate from 0-10 g C/m2·12a accounted for 12.76% of the total steppe area, and only 3.64% of the negative NPP growth rate exceeded 10 g C/m2·12a.
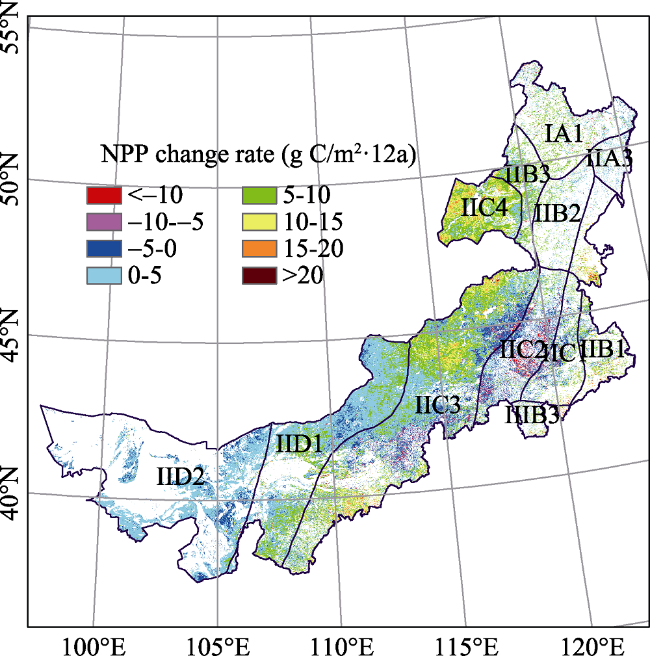
Table 4 Trend in NPP in eco-geographical zones of the Inner Mongolia grassland ecosystem from 2001 to 2012
Eco-zones SNPP
IA1 5.55
IIA3 3.17
IIB1 7.44
IIB2 4.34
IIB3 6.36
IIC1 3.01
IIC2 -1.99
IIC3 3.07
IIC4 11.40
IID1 3.04
IID2 0.93
IIIB3 3.73
Even if an increase in the grassland NPP was evident, the grassland NPP in most parts of Inner Mongolia showed no distinct spatial distribution features from east to west during 2001-2012 (Table 4). The NPP increase was clustered together in the northeastern study area, including zones IIC4, IIB1, and IIB3, with growth rates of 8.66, 7.12, and 5.72 g C/m2·12a, respectively. The NPP significantly decreased area was mainly concentrated in zone IIC2, with a negative growth rate of 1.45 g C/m2·12a.
3.2.3 Spatio-temporal dynamics of NEP
The NEP also increased in most parts of the Inner Mongolia steppe from 2001 to 2012 (Figure 6). The average annual growth rate was approximately 2.16 g C/m2·12a, which was slightly lower than that of the NPP. Overall, the pattern of variation was consistent with that of the NPP, which suggested that the increase in the grassland NPP may partly denote the increase in grassland carbon sequestration. The area of the increased NEP grassland in the entire region was 36.9 × 10⁴ km2, accounting for 70.8% of the total steppe area. Areas showing an NEP growth rate ranging from 0-5 g C/ m2·12a accounted for 43.23% of the total steppe area, those showing an NEP growth rate ranging from 5-10 g C/m2·12a accounted for 21.05% of the total steppe area, and those showing an NEP growth rate from 10-15 g C/m2·12a accounted for 5.69%. Consequently, only 0.83% of the NEP growth rate exceeded 15 g C/m2·12a. The area of the decreased-NEP grassland was 8.55 × 10⁴ km2, or 29.2% of the total steppe area, which was larger than that of the decreased-NPP grassland. 27.65% of this total area showed a negative NEP growth rate ranging from 0-10 g C/m2·12a, and only 1.55% of this area showed a rate above10 g C/m2·12a.
The NEP in most parts of the Inner Mongolia steppe showed an increasing trend during the study period, which was very similar to the NPP trend, but the growth rate varied across different zones (Table 5). The NEP increased most in the northeastern part of the area studied, including zones IIC4 and IIB3 with average growth rates of 6.62 g C/m2·12a and 3.67 g C/m2·12a, respectively. This was followed by the central and western parts, including zones IID1, IIC3, and IID2 with average growth rates of 3.66, 3.25 and 0.44 g C/m2·12a, respectively. In zones IIC2, IIB1 and IIC1, the NEP decreased significantly, with average negative growth rates of 3.14, 2.84, and 1.85 g C/m2·12a, respectively.
Figure 5 Spatio-temporal pattern and NPP average change rate in the Inner Mongolia grassland ecosystem from 2001 to 2012
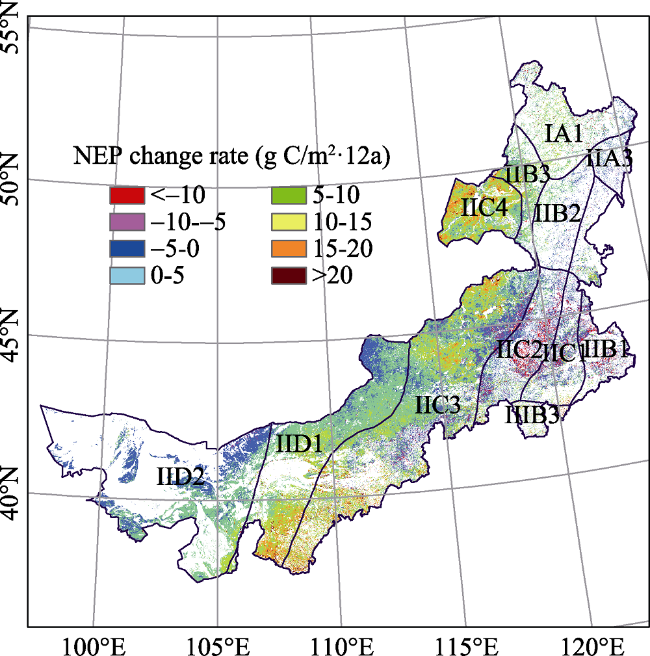
Figure 6 Spatio-temporal pattern and the NEP average change rate in the Inner Mongolia grassland ecosystem from 2001 to 2012

3.3 Response of main climatic variables to NPP and NEP

3.3.1 Patterns of temperature and precipitation
The spatial distribution of the annual mean temperature (AMT) and annual precipitation (AP) in the study area over the period 2001- 2012 is shown in Figure 7. The AMT was 3.82°C, and the AP was 263.97 mm. Additionally, climatic variables displayed significant spatial variation, showing an increasing trend in precipitation (Figure7a) and a decreasing trend in temperature from south-west to north-east (Figure 7b).
Table 5 Trend in NEP in eco-geographical zones of the Inner Mongolia grassland ecosystem from 2001 to 2012
Eco-zones SNEP
IA1 2.40
IIA3 -1.75
IIB1 -2.35
IIB2 -0.51
IIB3 3.11
IIC1 -3.50
IIC2 -2.83
IIC3 3.55
IIC4 7.57
IID1 3.35
IID2 2.04
IIIB3 1.06
The eastern meadow steppe region, represented by zone IIB3, has a cold and temperate continental monsoon climate with cold, dry and long winters and warm, humid, and short summers. This area has an annual temperature ranging from -3°C to 8°C and an annual precipitation of 350-580 mm. By contrast, zone IIB1, which lies in a transitional area between semi-humid and semi-humid climate zones, has an AMT of 5-7°C and an annual precipitation of 300-550 mm. The typical central steppe ecosystem is mainly concentrated in the semi-arid climate zone, including zones IIC1, IIC2, IIC3 and IIC4, and both AP and AMT show a southwest to northeast gradient. This region also experiences a temperate continental monsoon climate, which is dominated by a polar continental air mass with high-latitude inland north winds prevailing in winter and by a polar marine air mass with prevailing eastern and southeastern winds. Fortunately, pastures benefit from the concurrence of hot months and precipitation. From east to west, the AP in the Hulun Buir, Xilin Gol, and Ulan Qab plateaus progressively decreased, whereas the AMT progressively increased. The western desert steppe region is mainly concentrated in the semi-arid climate zone, including zones IID1 and IID2, where the climate type is temperate dry monsoon with an AP below 150 mm and an AMT of 7°C or above. Controlled by a cold air mass, the winter is long and extremely cold without much snowfall, whereas the summer season is dry with little rainfall, which is mainly controlled by westerly and subtropical winds. The disadvantageous hydrothermal combination in this region has a negative effect on the growth of the pasture, resulting in fluctuations in pasture production and quality, leading ultimately to widespread degradation.
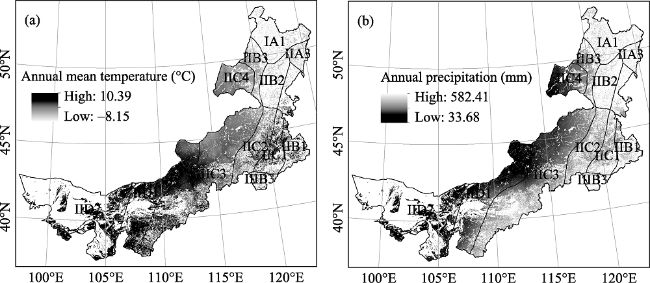
Figure 7 The spatial pattern of the annual mean temperature (a) and the annual precipitation (b) in the Inner Mongolia grassland ecosystem from 2001 to 2012
3.3.2 Response of temperature and precipitation to NPP
Overall, NPP and temperature showed a negative correlation (Figure 8a), and the mean correlation coefficient for the entire area was -0.117. The area of grassland with a positive correlation between NPP and AMT was 18.2 × 10⁴ km2, which accounted for 34.92% of the total steppe area. These areas were mainly concentrated in the south of the IIC3 steppe zone, the north of the IID1 desert steppe zone in Ordos, the IIC1 steppe zone in the Xiliao River Plain, and the IIC2 south Greater Hinggan Mountain forest steppe zone. The area of grassland with NPP negatively correlated with AMT was 33.82 × 10⁴ km2, which accounted for 64.89% of the total steppe area. These areas were mainly concentrated in the southeast of the IIB3 west Greater Hinggan Mountain forest steppe zone, in the IIC4 Hulun Buir steppe zone, the south of the IIC3 steppe zone in eastern Inner Mongolia, and the south of the IID1 desert steppe zone in Ordos. The distribution of correlation significance showed no strong consistency between the NPP and temperature in most parts of the study area, which suggested that temperature was not a climatic restricting factor influencing the grassland NPP in Inner Mongolia.
NPP and precipitation mostly showed a positive correlation (Figure 8b), and the mean correlation coefficient for the entire study area was 0.53. The area of grassland with NPP that was positively correlated with AP was 49.11× 10⁴ km2, which accounted for 94.24% of the total steppe area, which extended to zones IIC3 and IIC4 in the typical steppe and zones IID1 and IID2 in the desert steppe. The area of grassland with NPP that was positively correlated with AP was 3.01× 10⁴ km2, which accounted for 5.76% of the total steppe area and was mainly concentrated in zone IIB3 where precipitation was a restricting factor in the NPP. The distribution of significance (Figure 8b) showed that NPP and precipitation were most positively correlated in zones IIC3, IIC4, and IID1.This correlation was not negative in other zones, nor was it significant. Therefore, the major climate restricting factor of the NPP in Inner Mongolia was precipitation, and optimal hydrothermal conditions are required for pastures to flourish in this area.
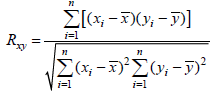
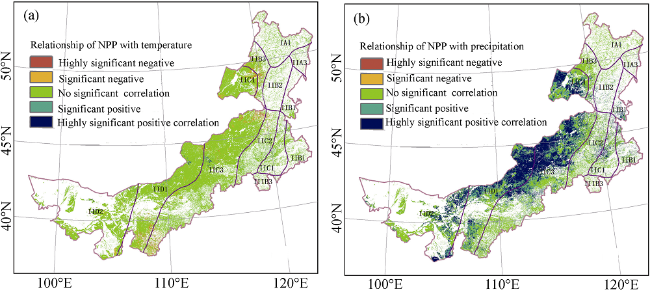
Figure 8 The significant relationship of NPP with temperature (a) and precipitation (b) in the Inner Mongolia grassland ecosystem
3.3.3 Response of temperature and precipitation to NEP
NEP and temperature were mostly negatively correlated (Figure 9a), and the mean correlation coefficient for the entire area was -0.132. The area of grassland with NEP that was positively correlated with the AMT was 17.84× 10⁴ km2, which accounted for 34.23% of the total steppe area. These areas were mainly concentrated in zones IID1 and IID2, where the grassland NEP increased with temperature increase. The area of grassland with NEP that was negatively correlated with the AMT was 34.28× 10⁴ km2, which accounted for 65.72% of the total steppe area. These areas were mainly concentrated in zones IIC4, IIB3, and the north of zone IIC3. The distribution of correlation significance showed no strong correlation between grassland NEP and temperature in most parts of the study area, which suggested that temperature was not a restricting factor for the grassland NEP in Inner Mongolia.
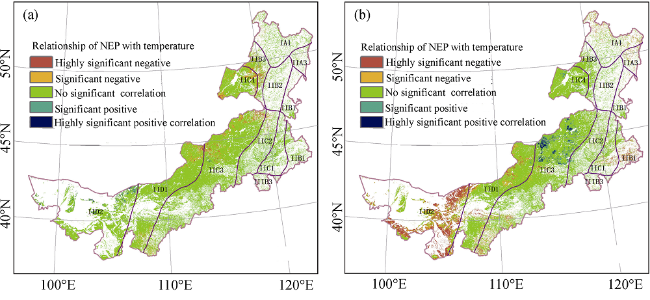
Figure 9 The significant relationship of NEP with temperature (a) and precipitation (b) in the Inner Mongolia grassland ecosystem
The correlation between NEP and precipitation was positive in some sub-areas, whereas it was negative in others (Figure 9b). The mean correlation coefficient for the entire area was 0.15. The area of grassland with NEP that was positively correlated with AP was 19.38× 10⁴ km2, which accounted for 37.18% of the total area. These areas were mainly concentrated in the IIC4 Hulun Buir steppe zone and the IIC3 steppe zone east of Inner Mongolia. The grassland with NEP that was negatively correlated with the AP was mainly concentrated in zones IIB3, IIB1, IID1 and IID2. The distribution of correlation significance showed that grasslands with a positive correlation between NEP and precipitation were mainly concentrated in the IIC3 steppe zone east of Inner Mongolia. However, the grasslands with NEP that were negatively correlated with precipitation were mainly concentrated in zone IID2. No significant correlation was observed between NEP and precipitation in other areas.

3.4 Validation

The estimated and measured NPP from 2011 to 2012 showed a positive correlation (Figure 10, R2=0.54), but the simulated NPP values were relatively scattered and generally higher than the actual measured values. This might be because the NPP includes biomass that accumulated underground. However, for some species no consistent linear relationship exists between underground biomass and above-ground biomass. In general, the average interannual grassland NPP in Inner Mongolia may be estimated to be 278.83 g C/m2. Bao et al. (2009) estimated the grassland NPP in Inner Mongolia using MODIS data and the CASA model. They found an average NPP value of 262.05 g C/m2 from 2002 to 2006, which is similar to the results reported in this paper. The figures for the estimation and spatial distribution of the NEP in this study were similar to the results of Tao et al. (2006), whose work was based on the CEVSA model. Uncertainties in the estimation of the NPP can be reduced by enhancing data accuracy, parameter adjustment and observation experiments. However, the uncertainty about soil respiration is a much more complex problem. The soil respiration model adopted in this research was constructed using the results for over 1000 samples, using the Bond-Lamberty and Thomson method (Bond-Lamberty et al., 2004), but most of the data for this model were not collected throughout the year and were only extrapolated from soil respiration rates during the growing season. Such errors are not negligible and this model will inevitably influence the accurate estimation of soil respiration, leading to uncertainties in NEP estimation.
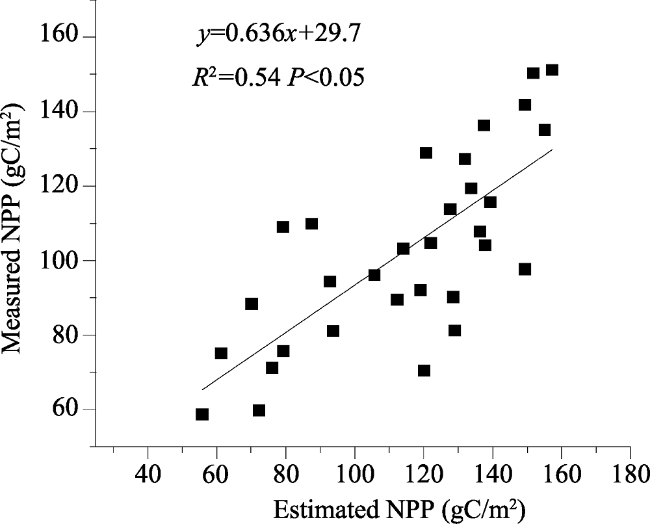
Figure 10 The relationship between the estimated and the measured values of NPP in 2011 and 2012

4 Discussion

Several uncertainties in the NPP and NEP estimation may be observed in this study. Firstly, the resolution of the remote sensing images was 1 km × 1 km. The NPP retrieved using satellite data was taken as the mean value of a 1 km2 area, but measured sampling was carried out in an area of 1 m2. Disparities in spatial resolution may cause estimation errors. Secondly, the pasture is composed of various plant species. Extracting accurate information on the species from mixed image cells of the remote sensing data is impossible, and our measured samples did not cover all of the relevant species in this area. The NEP represents the net photosynthetic productivity of an ecosystem and indicates its C sequestration capability. The ecosystem is a C source when the NEP<0 and is a C sink when the NEP>0. This index has been extensively applied to global C cycling since the 1990s. However, net biome productivity (NBP) was recently proposed as a indicator at a larger scale, which is calculated by subtracting the value of the NEP from the value of the non-biotic respiration (NR) induced by natural and anthropogenic disturbances, such as forest fires, pests, defoliation, forestry cutting and production (Fang et al., 2001). Issues concerning how to distinguish between abiotic and biotic effects and quantitative assessments of C sequestration capability should be addressed in the future studies. In this paper, only the effects of climatic variables, such as precipitation and temperature, on the spatial distribution of NPP and NEP are discussed. Other factors, such as soil heterotrophic respiration and nitrogen deposition (Peng et al., 2014), have been ignored. In the future, both natural factors (e.g., radiation, evaporation and carbon dioxide concentration) and anthropogenic factors (e.g., grazing and enclosure) must be fully incorporated into the process of C sequestration in regional ecosystems to clarify the effects of climate change and anthropogenic activities on the capability of C sinks.

5 Conclusions

In this study, the NPP and NEP of the IMGE were estimated from 2001 to 2012 based on NPP remote sensing estimation and soil heterotrophic respiration models. Dynamics in the spatio-temporal features of NPP and NEP during the study period and their relationships with temperature and precipitation were also analyzed. The main results are as follows:
(1) In general, the NPP and NEP in the IMGE showed higher values in the east and lower values in the west from 2001 to 2012, with mean NPPs of 278.83 g C/m2. During this period, the C sink sector accounted for 60.28% of the total steppe area, with an average accumulated C sequestration of 2186.47 g C/m2 and total C sequestration of 0.687 Pg C. The C source sector accounted for 39.72% of the total area, with an average C emission of 660.32 g C/m2 and a total C emission of 0.137 Pg C. This difference between C sequestration and C emission suggests that the net total C sink in this area is as high as 0.557 Pg C and that the annual C sequestration rate is 0.046 Pg C/a.
(2) Temporally, both the NPP and NEP of the IMGE increased from 2001 to 2012. The mean NPP ranged from 200 g C/m2 to 350 g C/m2 with an annual growth rate of 3.781 g C/m2. The mean NEP ranged from 50 g C/m2 to 150 g C/m2 with an annual growth rate of 2.104 g C/m2. The variations in NPP and NEP were not completely synchronized.
(3) Spatially, our observations showed an increase in the grassland NPP in most parts of Inner Mongolia over the past 12 years, and the area of increased NPP grassland accounted for 83.6% of the total steppe area. The variations in NEP distribution were very similar to those of the NPP, but the growth rates varied. The area of increased NEP grassland accounted for 70.8% of the total steppe area.
(4) The NPP in most temperate steppes was positively correlated with precipitation, but negatively correlated with temperature. The major factor restricting the NPP in temperate steppes is moisture. Satisfactory pasture production requires optimum hydrothermal conditions. The NEP in most parts of the IMGE had a weak negative correlation with precipitation and a weak positive correlation with temperature, indicating that these climatic variables are not the major restricting factors affecting C sinks in the Inner Mongolia steppe.

The authors have declared that no competing interests exist.

[1]
Adams J M, Faure H, Faure-Denard Let al., 1990. Increases in terrestrial carbon storage from the Last Glacial Maximum to the present.Nature, 348(6303): 711-714.

[2]
Bai Yongfei, Han Xingguo, Wu Jianguoet al., 2004. Ecosystem stability and compensatory effects in the Inner Mongolia grassland.Nature, 431(7005): 181-184.Numerous studies have suggested that biodiversity reduces variability in ecosystem productivity through compensatory effects; that is, a species increases in its abundance in response to the reduction of another in a fluctuating environment. But this view has been challenged on several grounds. Because most studies have been based on artificially constructed grasslands with short duration, long-term studies of natural ecosystems are needed. On the basis of a 24-year study of the Inner Mongolia grassland, here we present three key findings. First, that January-July precipitation is the primary climatic factor causing fluctuations in community biomass production; second, that ecosystem stability (conversely related to variability in community biomass production) increases progressively along the hierarchy of organizational levels (that is, from species to functional group to whole community); and finally, that the community-level stability seems to arise from compensatory interactions among major components at both species and functional group levels. From a hierarchical perspective, our results corroborate some previous findings of compensatory effects. Undisturbed mature steppe ecosystems seem to culminate with high biodiversity, productivity and ecosystem stability concurrently. Because these relationships are correlational, further studies are necessary to verify the causation among these factors. Our study provides new insights for better management and restoration of the rapidly degrading Inner Mongolia grassland.

DOI PMID

[3]
Bai Yongfei, Wu Jianguo, Xing Qiet al., 2008. Primary production and rain use efficiency across a precipitation gradient on the Mongolia plateau.Ecology, 89(8): 2140-2153.Understanding how the aboveground net primary production (ANPP) of arid and semiarid ecosystems of the world responds to variations in precipitation is crucial for assessing the impacts of climate change on terrestrial ecosystems. Rain-use efficiency (RUE) is an important measure for acquiring this understanding. However, little is known about the response pattern of RUE for the largest contiguous natural grassland region of the world, the Eurasian Steppe. Here we investigated the spatial and temporal patterns of ANPP and RUE and their key driving factors based on a long-term data set from 21 natural arid and semiarid ecosystem sites across the Inner Mongolia steppe region in northern China. Our results showed that, with increasing mean annual precipitation (MAP), (1) ANPP increased while the interannual variability of ANPP declined, (2) plant species richness increased and the relative abundance of key functional groups shifted predictably, and (3) RUE increased in space across different ecosystems but decreased with increasing annual precipitation within a given ecosystem. These results clearly indicate that the patterns of both ANPP and RUE are scale dependent, and the seemingly conflicting patterns of RUE in space vs. time suggest distinctive underlying mechanisms, involving interactions among precipitation, soil N, and biotic factors. Also, while our results supported the existence of a common maximum RUE, they also indicated that its value could be substantially increased by altering resource availability, such as adding nitrogen. Our findings have important implications for understanding and predicting ecological impacts of global climate change and for management practices in arid and semiarid ecosystems in the Inner Mongolia steppe region and beyond.

DOI PMID

[4]
Bao Gang, Bao Yuhai, ALateng Tuyaet al., 2009. Estimation of vegetation net primary productivity using MODIS data and CASA model in Inner Mongolia.The National Agricultural Remote Sensing Technology Conference, 247-256. (in Chinese)

[5]
Battle M, Bender M L, Tans P Pet al., 2000. Global carbon sinks and their variability inferred from atmospheric O2 and δ13C.Science, 287(5462): 2467-2470.

[6]
Bond-Lamberty B, Wang C, Gower S T, 2004. A global relationship between the heterotrophic and autotrophic components of soil respiration.Global Change Biology, 10(10): 1756-1766.Abstract Soil surface CO 2 flux ( R S ) is overwhelmingly the product of respiration by roots (autotrophic respiration, R A ) and soil organisms (heterotrophic respiration, R H ). Many studies have attempted to partition R S into these two components, with highly variable results. This study analyzes published data encompassing 54 forest sites and shows that R A and R H are each strongly ( R 2 >0.8) correlated to annual R S across a wide range of forest ecosystems. Monte Carlo simulation showed that these correlations were significantly stronger than any correlation introduced as an artefact of measurement method. Biome type, measurement method, mean annual temperature, soil drainage, and leaf habit were not significant. For sites with available data, there was a significant ( R 2 =0.56) correlation between total detritus input and R H , while R A was unrelated to net primary production. We discuss why R A and R H might be related to each other on large scales, as both ultimately depend on forest carbon balance and photosynthate supply. Limited data suggest that these or similar relationships have broad applicability in other ecosystem types. Site-specific measurements are always more desirable than the application of inferred broad relationships, but belowground measurements are difficult and expensive, while measuring R S is straightforward and commonly done. Thus the relationships presented here provide a useful method that can help constrain estimates of terrestrial carbon budgets.

DOI

[7]
Del Grosso S, Parton W, Stohlgren Tet al., 2008. Global potential net primary production predicted from vegetation class, precipitation, and temperature.Ecology, 89(8): 2117-2126.

[8]
Fang Jingyun, Ke Jinhu, Tang Zhiyaoet al., 2001. Implications and estimations of four terrestrial productivity parameters.Acta Phytoecologica Sinica, 25(4): 414-419. (in Chinese)Biological productivity is the m atter production capacity of different organism levels(individual, community, ecosystem,region and biome),and an indicator of system health that it reflects and controls m atter cycles and energy flows of the system·Four parameters for measuring biological productivity exist, gross primary productivity(),net primary productivity (N PP),net ecosystem productivity (N EP)and ne t b iom e p roductivity (N B P),and are jointly termed as“4P in abbreviation. The methods of estim ation of these parameters are discussed in relation to c1imate change and a relationship am ong them is established through the currency of the cycle. Several term s derived from“4P are alsore-defined in this context. Despite only making up a part of gross photosynthate production, finalecosystem production ()is the capital for future organic matter and controls maintenance and development of the ecosystem.

[9]
Fang Jingyun, Tang Y,Lin J et al., 2000. Global Ecology: Climate Change and Ecological Responses. Beijing: Higher Education Press. (in Chinese)

[10]
Goetz S J, Prince S D, Goward S Net al., 1999. Satellite remote sensing of primary production: An improved production efficiency modeling approach.Ecological Modelling, 122(3): 239-255.Application and validation of a modified production efficiency model (PEM) appropriate for the regional and global scales is presented. The model calculates not just the conversion efficiency of absorbed photosynthetically active radiation (APAR) but also the component carbon fluxes that ultimately determine net and gross primary production. This approach, driven with remotely sensed observations, moves beyond simple correlative or associative models to a more mechanistic basis and avoids the need for a full suite of ecophysiological process algorithms that require explicit (e.g. species-specific) parameterization. We show that surface variables recovered from the satellite observations, including net primary production, are in good agreement with field measurements and independent model simulations in a number of ecosystems. These results illustrate the utility of PEMs for terrestrial primary production modeling over large areas and suggest that some complex ecophysiological models may be functionally simpler than their structure suggests.

DOI

[11]
Houghton J T, Callander B A, Varney S K, 1992. Climate Change 1992: The Supplementary Report to the IPCC Scientific Assessment. Cambridge, UK: Cambridge University Press.

[12]
Houghton J T, Ding Y, Griggs D J et al., 2001.Climate Change 2001: The Scientific Basis. Cambridge, UK: Cambridge University Press.This section describes the scientific basis for positive changes in rain. Extensive scientific literature exists on these subjects including scientific reviews by Braham (1986), Dennis (1980), and others listed in the references provided at the end of this section.

[13]
Liu Zhihong, McVicar T R, Li Lingtaoet al., 2008. Interpolation for time series of meteorological variables using ANUSPLIN. Journal of Northwest A&F University (Natural Science Edition), 36(10): 227-234. (in Chinese)Objective】 The interpolation processes of the meteorological variables using the ANUSPLN in coarse sandy hilly catchments of the loess plateau were introduced in this paper.It should be a useful reference for setting parameters,analyzing the errors and selecting the correct covariates.【Method】 In the interpolation of different meteorological variables,a professional interpolation package ANUSPLIN was used in which one or more influenced factors were introduced as covariate sub-models.【Result】 Time Series of monthly meteorological data from 1980 to 2000 on the geomorphologically complex Coarse Sandy Hilly Region in Loess Plateau were interpolated to surfaces,and the lapes rate of the meteorological variable changing with its influence factors were calculated.【Conclusion】 Based on the thin plate smoothing spline function,using multiple covariates as linear sub-models in addition to the independent spline variables,ANUSPLIN can develop the interpolation accuracy and reflect the rates between the meteorology variables and their influenced factors,and especially adapt to time series of data.For the research area,partial thin plate smoothing spline model using one or more linear sub-models with 3 spline order is the best model for most meteorological variables.Temperature interpolation is easier with less error,for 1995-07 month,the mean relative error is about 1%,the interpolation errors for wind and vapor pressure are moderate,and higher for sunshine hour and rain in which max relative error reach 50% in some way.

DOI

[14]
Mack M C, Schuur E A G, Bret-Harte M Set al., 2004.Ecosystem carbon storage in arctic tundra reduced by long-term nutrient fertilization.Nature, 431(7007): 440-443.Abstract Global warming is predicted to be most pronounced at high latitudes, and observational evidence over the past 25 years suggests that this warming is already under way. One-third of the global soil carbon pool is stored in northern latitudes, so there is considerable interest in understanding how the carbon balance of northern ecosystems will respond to climate warming. Observations of controls over plant productivity in tundra and boreal ecosystems have been used to build a conceptual model of response to warming, where warmer soils and increased decomposition of plant litter increase nutrient availability, which, in turn, stimulates plant production and increases ecosystem carbon storage. Here we present the results of a long-term fertilization experiment in Alaskan tundra, in which increased nutrient availability caused a net ecosystem loss of almost 2,000 grams of carbon per square meter over 20 years. We found that annual aboveground plant production doubled during the experiment. Losses of carbon and nitrogen from deep soil layers, however, were substantial and more than offset the increased carbon and nitrogen storage in plant biomass and litter. Our study suggests that projected release of soil nutrients associated with high-latitude warming may further amplify carbon release from soils, causing a net loss of ecosystem carbon and a positive feedback to climate warming.

DOI PMID

[15]
Mansanet-Bataller M, Pardo Á, 2008. What you should know about carbon markets.Energies, 1(3): 120-153.Since the entry into force of the Kyoto Protocol, carbon trading has been in continuous expansion. In this paper, we review the origins of carbon trading in order to understand how carbon trading works in Europe and, specifically, the functioning of the European Union Emission Trading Scheme (EU ETS) and the workings of several spot, futures and options markets where European Union Allowances are traded. As well, the linking of the EU ETS with the other United Nations carbon markets is also studied.

DOI

[16]
Mu Shaojie, Li Jianlong, Zhou Weiet al., 2013. Spatial-temporal distribution of net primary productivity and its relationship with climate factors in Inner Mongolia from 2001 to 2010.Acta Ecologica Sinica, 33(12): 3752-3764. (in Chinese)Net primary productivity(NPP) and its responses to global change is one of the focuses of global change research.Based on MODIS NDVI data,land use classification data and meteorological data,spatio-temporal changes of the NPP of Inner Mongolia vegetation during 2001—2010 were simulated using improved light use efficiency model(CASA model).The relationships between NPP and climate factors were analyzed based on partial correlation coefficients of the two-group elements.The results showed that average annual NPP from 2001 to 2010 was 340.0 gCm-2a-1 in the study area,exhibiting obvious increase trend from southwest to northeast with a mean change rate of 200.5 gCm-2a-1/10°.The mean NPP of forest,grassland,cropland and desert were 521.9、270.3、405.7 and 85.3 gCm-2a-1,respectively,which showed significant differences.During 2001—2010,the average annual total NPP of Inner Mongolia vegetation was 322.7 TgCa-1,ranging from 276.8 to 354.4 TgCa-1.Over the 10 years period,extremely significant increase of vegetation NPP occurred in Alxa desert,the western margin of Mu Us sandy land,north of Hetao plain,the eastern and western margin of Hunshandak sandy land and northwest of Hulun Buir league,while extremely significant decrease of vegetation NPP mainly occurred in the grassland in the central of Inner Mongolia.Climate factors exerted various influences on different vegetation types.Temperature was the dominant driving force of NPP of forest,while precipitation influenced the NPP of grassland,cropland and desert vegetation more seriously.

[17]
Ni J, 2002. Carbon storage in grasslands of China.Journal of Arid Environments, 50(2): 205-218.lt;h2 class="secHeading" id="section_abstract">Abstract</h2><p id="">Carbon storage in grasslands of China was estimated by the carbon density method and based on a nationwide grassland resource survey finished by 1991. The grasslands in China were classified into 18 types, which are distributed mostly in the temperate region and on the Tibetan Plateau, and scattered in the warm-temperate and tropical regions. Based on the median estimate, vegetation, soil and total carbon storage of grasslands in China were 3&middot;06, 41&middot;03 and 44&middot;09 Pg C, respectively. Vegetation had low carbon storage and most carbon was stored in soils. Of the four types of regions that have grasslands, alpine region (54&middot;5%) and temperate region (31&middot;6%) hold more than 85% of the total grassland carbon (in both vegetation and soils) in China. Considering specific types within these two regions, three grassland types, alpine meadow (25&middot;6%), alpine steppe (14&middot;5%) and temperate steppe (11%) constituted more than half of all carbon stored in China's grasslands. In general and regardless of regional vegetation types, steppes (38&middot;6%) and meadows (38&middot;2%) made up more than 2/3 of total grassland carbon. The carbon storage in alpine grasslands may have a significant and long-lived effect on global C cycles. This study estimated more carbon storage in vegetation and less in soils than previous studies. The differences of grassland carbon between this study and two previous studies were due probably to four reasons, i.e. different estimation methods, different classification systems of grasslands, different areas of grasslands, and different carbon densities. China's grasslands cover only 6&ndash;8% of total world grassland area and have 9&ndash;16% of total carbon in the world grasslands. They make a big contribution to the world carbon storage and may have significant effects on carbon cycles, both in global and in arid lands.</p>

DOI

[18]
Niu Jianming, 2001. Impacts prediction of climatic change on distribution and production of grassland in Inner Mongolia.Acta Agrestia Sinica, 9(4): 277-282. (in Chinese)The response of grassland to two scenarios of climatic changes was studied and based on forest steppe,typical steppe and desert steppe in lnner Mongolia by means of life zone classification system.Results showed that grassland vegetation is likely to be impacted significantly by climatic change in Inner Mongolia. On the one hand, grassland areas decreased remarkably.The south boundary of grassland shifted northward with a great extent.Forest steppe disappeared from this region.On the other hand,grassland production decreased strongly too.Desert steppe showed the most lost of NPP among grassland types and scenarios.It is suggested that the response of grassland to climatic change reveal spatial shifting of grassland types in the east and south part of this region,while display a rapid decrease of production in the arid region located in the west part.In addition,this study also demonstrated that grassland was more sensitive to the elevation of temperature.

[19]
Pan Y D, Birdsey R A, Fang J Yet al., 2011. A large and persistent carbon sink in the world’s forests.Science, 333(6045): 988-993.The terrestrial carbon sink has been large in recent decades, but its size and location remain uncertain. Using forest inventory data and long-term ecosystem carbon studies, we estimate a total forest sink of 2.4 ± 0.4 petagrams of carbon per year (Pg C year(-1)) globally for 1990 to 2007. We also estimate a source of 1.3 ± 0.7 Pg C year(-1) from tropical land-use change, consisting of a gross tropical deforestation emission of 2.9 ± 0.5 Pg C year(-1) partially compensated by a carbon sink in tropical forest regrowth of 1.6 ± 0.5 Pg C year(-1). Together, the fluxes comprise a net global forest sink of 1.1 ± 0.8 Pg C year(-1), with tropical estimates having the largest uncertainties. Our total forest sink estimate is equivalent in magnitude to the terrestrial sink deduced from fossil fuel emissions and land-use change sources minus ocean and atmospheric sinks.

DOI PMID

[20]
Peng Q, Qi Y C, Dong Y S, et al.2014. Litter decomposition and C and N dynamics as affected by N additions in a semi-arid temperate steppe, Inner Mongolia of China.Journal of Arid Land, 6(4): 432-444.&nbsp;Litter decomposition is the fundamental process in nutrient cycling and soil carbon (C) sequestration in terrestrial ecosystems. The global-wide increase in nitrogen (N) inputs is expected to alter litter decomposition and,ultimately, affect ecosystem C storage and nutrient status. Temperate grassland ecosystems in China are usually N-deficient and particularly sensitive to the changes in exogenous N additions. In this paper, we conducted a 1,200-day in situ experiment in a typical semi-arid temperate steppe in Inner Mongolia to investigate the litter decomposition as well as the dynamics of litter C and N concentrations under three N addition levels (low N with 50 kg N/(hm<sup>2</sup>&bull;a) (LN), medium N with 100 kg N/(hm<sup>2</sup>&bull;a) (MN), and high N with 200 kg N/(hm<sup>2</sup>&bull;a) (HN)) and three N addition forms (ammonium-N-based with 100 kg N/(hm<sup>2</sup>&bull;a) as ammonium sulfate (AS), nitrate-N-based with 100 kg N/(hm2&bull;a) as sodium nitrate (SN), and mixed-N-based with 100 kg N/(hm<sup>2</sup>&bull;a) as calcium ammonium nitrate (CAN)) compared to control with no N addition (CK). The results indicated that the litter mass remaining in all N treatments exhib&not;ited a similar decomposition pattern: fast decomposition within the initial 120 days, followed by a relatively slow decomposition in the remaining observation period (120&ndash;1,200 days). The decomposition pattern in each treatment was fitted well in two split-phase models, namely, a single exponential decay model in phase I (&lt;398 days) and a linear decay function in phase II (&gt;398 days). The three N addition levels exerted insignificant effects on litter decomposition in the early stages (&lt;398 days, phase I; P&gt;0.05). However, MN and HN treatments inhibited litter mass loss after 398 and 746 days, respectively (P&lt;0.05). AS and SN treatments exerted similar effects on litter mass remaining during the entire decomposition period (P&gt;0.05). The effects of these two N addition forms differed greatly from those of CAN after 746 and 1,053 days, respectively (P&lt;0.05). During the decomposition period, N concentrations in the decomposing litter increased whereas C concentrations decreased, which also led to an exponential decrease in litter C:N ratios in all treatments. No significant effects were induced by N addition levels and forms on litter C and N concentrations (P&gt;0.05). Our results indicated that exogenous N additions could exhibit neutral or inhibitory effects on litter decomposition, and the inhibitory effects of N additions on litter decomposition in the final decay stages are not caused by the changes in the chemical qualities of the litter, such as endogenous N and C concentrations. These results will provide an important data basis for the simulation and prediction of C cycle processes in future N-deposition scenarios.

DOI

[21]
Prince S D, Goward S N, 1995. Global primary production: A remote sensing approach.Journal of Biogeography, 22(4/5): 815-835.A new model of global primary production (GLObal Production Efficiency Model, GLO-PEM), based on the production efficiency concept, is described. GLO-PEM is the first attempt to model both global net and gross primary production using the production efficiency approach and is unique in that it uses satellite data to measure both absorption of photosynthetically active radiation (APAR) and also the environmental variables that affect the utilization of APAR in primary production. The use of satellite measurements gives global, repetitive, spatially contiguous and time specific observations of the actual vegetation. GLO-PEM is based on physiological principles, in particular the amount of carbon fixed per unit absorbed photosynthetically active radiation (epsilon) is modelled rather than fitted using field observations.

DOI

[22]
Raich J W, Potter C S, Bhagawati D, 2002. Interannual variability in global soil respiration, 1980-94.Global Change Biology, 8(8): 800-812.We used a climate-driven regression model to develop spatially resolved estimates of soil-COemissions from the terrestrial land surface for each month from January 1980 to December 1994, to evaluate the effects of interannual variations in climate on global soil-to-atmosphere COfluxes. The mean annual global soil-COflux over this 15-y period was estimated to be 80.4 (range 79.3-81.8) Pg C. Monthly variations in global soil-COemissions followed closely the mean temperature cycle of the Northern Hemisphere. Globally, soil-COemissions reached their minima in February and peaked in July and August. Tropical and subtropical evergreen broad-leaved forests contributed more soil-derived COto the atmosphere than did any other vegetation type (6530% of the total) and exhibited a biannual cycle in their emissions. Soil-COemissions in other biomes exhibited a single annual cycle that paralleled the seasonal temperature cycle. Interannual variability in estimated global soil-COproduction is substantially less than is variability in net carbon uptake by plants (i.e., net primary productivity). Thus, soils appear to buffer atmospheric COconcentrations against far more dramatic seasonal and interannual differences in plant growth. Within seasonally dry biomes (savannas, bushlands and deserts), interannual variability in soil-COemissions correlated significantly with interannual differences in precipitation. At the global scale, however, annual soil-COfluxes correlated with mean annual temperature, with a slope of 3.365Pg65C65yper °C. Although the distribution of precipitation influences seasonal and spatial patterns of soil-COemissions, global warming is likely to stimulate COemissions from soils.

DOI

[23]
Raich J W, Schlesinger W H, 1992. The global carbon dioxide flux in soil respiration and its relationship to vegetation and climate.Tellus B, 44(2): 81-99.We review measured rates of soil respiration from terrestrial and wetland ecosystems to define the annual global CO 2 flux from soils, to identify uncertainties in the global flux estimate, and to investigate the influences of temperature, precipitation, and vegetation on soil respiration rates. The annual global CO 2 flux from soils is estimated to average (卤 S.D.) 68 卤 4 PgC/ yr, based on extrapolations from biome land areas. Relatively few measurements of soil respiration exist from arid, semi-arid, and tropical regions; these regions should be priorities for additional research. On a global scale, soil respiration rates are positively correlated with mean annual air temperatures and mean annual precipitation. There is a close correlation between mean annual net primary productivity (NPP) of different vegetation biomes and their mean annual soil respiration rates, with soil respiration averaging 24% higher than mean annual NPP. This difference represents a minimum estimate of the contribution of root respiration to the total soil CO 2 efflux. Estimates of soil C turnover rates range from 500 years in tundra and peaty wetlands to 10 years in tropical savannas. We also evaluate the potential impacts of human activities on soil respiration rates, with particular focus on land use changes, soil fertilization, irrigation and drainage, and climate changes. The impacts of human activities on soil respiration rates are poorly documented, and vary among sites. Of particular importance are potential changes in temperatures and precipitation. Based on a review of in situ measurements, the Q 10 value for total soil respiration has a median value of 2.4. Increased soil respiration with global warming is likely to provide a positive feedback to the greenhouse effect. DOI: 10.1034/j.1600-0889.1992.t01-1-00001.x

DOI

[24]
Sarmiento J L, Gloor M, Gruber Net al., 2010. Trends and regional distributions of land and ocean carbon sinks.Biogeosciences, 7(8): 2351-2367.We show here a new estimate of the variability and long-term trends in the net land carbon sink from 1960 onwards calculated from the difference between fossil fuel emissions, the observed atmospheric growth rate, and the ocean uptake obtained by recent ocean model simulations forced with reanalysis wind stress and heat and water fluxes. The net land carbon sink appears to have increased by 0.88 ( 0.77 to 1.04) Pg C yr 1 after ~1988/1989 from a relatively constant mean of 0.27 Pg C yr 1 before then to 1.15 Pg C yr 1 thereafter (the sign convention is negative out of the atmosphere). This result is significant at the 1% critical level. The increase in net land uptake is partially compensated by a reduction in the expected oceanic uptake, which we estimate from model simulations as about 0.35 (0.26 to 0.49) Pg C yr 1. This implies that the atmospheric growth rate must have decreased by about 0.53 ( 0.51 to 0.55) Pg C yr 1 (equivalent to 0.25 ppm yr 1) below what would have been projected if the ocean uptake had continued to grow at the rate expected from a constant climate model and if the net land uptake had continued at its pre-1988/1989 level. A regional synthesis and assessment of the land carbon sources and sinks over the post 1988/1989 period reveals broad agreement that the northern hemisphere land is a major sink of atmospheric CO2, but there remain major discrepancies with regard to the sign and magnitude of the net flux to and from tropical land.

DOI

[25]
Scurlock J M O, Hall D O, 1998. The global carbon sink: A grassland perspective.Global Change Biology, 4(2): 229-233.The challenge to identify the biospheric sinks for about half the total carbon emissions from fossil fuels must include a consideration of below-ground ecosystem processes as well as those more easily measured above-ground. Recent studies suggest that tropical grasslands and savannas may contribute more to the `missing sink' than was previously appreciated, perhaps as much as 0.5 Pg (=鈥0.5 Gt) carbon per annum. The rapid increase in availability of productivity data facilitated by the Internet will be important for future scaling-up of global change responses, to establish independent lines of evidence about the location and size of carbon sinks.

DOI

[26]
Sitch S, Smith B, Prentice I Cet al., 2003. Evaluation of ecosystem dynamics, plant geography and terrestrial carbon cycling in the LPJ dynamic global vegetation model.Global Change Biology, 9(2): 161-185.ABSTRACT

DOI PMID

[27]
Steffen W L, Walker B H, Ingram J S Let al., 1992. Global change and terrestrial ecosystems: The Operational Plan. Stockholm, Sweden: Global Change Report, No.21.This major new book presents a collection of essays by leading authorities who address the current state of knowledge. The chapters bring together the early results of an international scientific research program designed to address what will happen to our ability to produce food and fiber, and what effects there will be on biological diversity under rapid environmental change. This book addresses how these changes to terrestrial ecosystems will feed back to further environmental change. International in scope, this state-of-the-art assessment will interest policymakers, students and scientists interested in global change, climate change and biodiversity. Special features include descriptions of a dynamic global vegetation model, developing generic crop models and a special section on the emerging discipline of global ecology.

DOI

[28]
Su Yongzhong, Zhao Halin, 2002. Advances in researches on soil organic carbon storages, affecting factors and its environmental effects.Journal of Desert Research, 22(3): 220-228. (in Chinese)Soil organic carbon is a significant component of the earth's carbon reservoir, and its storage and fluxes play a major role in the globe budget of carbon. This paper reviewed the advances of domestic and overseas studies on the estimation of soil organic carbon pool, the influence of natural factors and anthropomorphic disturbances including land use/cover changes, over-grazing, agricultural practices and rises of CO<sub>2</sub> on soil organic carbon storages. In addition, the effects of soil organic carbon on soil quality and environment regulation, some strategies of sequestering C in soil were presented. The significance of studies on soil organic carbon changes and its ecological effects were discussed.

[29]
Sun Honglie, 2005. Ecosystems of China. Beijing: Science Press. (in Chinese)

[30]
Tao Bo, Cao Mingkui, Li Keranget al., 2006.Spatial pattern and its change of Chinese terrestrial net ecosystem productivity from 1981 to 2000. Science in China Series D:Earth Sciences, 36(12): 1131-1139. (in Chinese)

[31]
Woodwell G M, Whitaker R H, Reiners W Aet al., 1978. The biota and the world carbon budget.Science, 199(4325): 141-146.This article has no associated abstract. ( fix it )

DOI PMID

[32]
Yang Yuanhe, Fang Jingyun, Ma Wenhonget al., 2010. Soil carbon stock and its changes in northern China’s grasslands from 1980s to 2000s.Global Change Biology, 16(11): 3036-3047.Abstract Climate warming is likely to accelerate the decomposition of soil organic carbon (SOC) which may lead to an increase of carbon release from soils, and thus provide a positive feedback to climate change. However, SOC dynamics in grassland ecosystems over the past two decades remains controversial. In this study, we estimated the magnitude of SOC stock in northern China's grasslands using 981 soil profiles surveyed from 327 sites across the northern part of the country during 2001–2005. We also examined the changes of SOC stock by comparing current measurements with historical records of 275 soil profiles derived from China's National Soil Inventory during the 1980s. Our results showed that, SOC stock in the upper 30cm in northern China's grasslands was estimated to be 10.5PgC (1Pg=10 15 g), with an average density (carbon stock per area) of 5.3kgCm 612 . SOC density (SOCD) did not show significant association with mean annual temperature, but was positively correlated with mean annual precipitation. SOCD increased with soil moisture and reached a plateau when soil moisture was above 30%. Site-level comparison indicated that grassland SOC stock did not change significantly over the past two decades, with a change of 0.08kgCm 612 , ranging from 610.30 to 0.46kgCm 612 at 95% confidence interval. Transect-scale comparison confirmed that grassland SOC stock remained relatively constant from 1980s to 2000s, suggesting that soils in northern China's grasslands have been carbon neutral over the last 20 years.

DOI

[33]
Yang Yuanhe, Fang Jingyun, Tang Yanhonget al., 2008. Storage, patterns and controls of soil organic carbon in the Tibetan grasslands.Global Change Biology, 14(7): 1592-1599.The soils of the Qinghai-Tibetan Plateau store a large amount of organic carbon, but the magnitude, spatial patterns and environmental controls of the storage are little investigated. In this study, using data of soil organic carbon (SOC) in 405 profiles collected from 135 sites across the plateau and a satellite-based dataset of enhanced vegetation index (EVI) during 2001-2004, we estimated storage and spatial patterns of SOC in the alpine grasslands. We also explored the relationships between SOC density (soil carbon storage per area) and climatic variables and soil texture. Our results indicated that SOC storage in the top 165m in the alpine grasslands was estimated at 7.465Pg C (165Pg=1065g), with an average density of 6.565kg65m. The density of SOC decreased from the southeastern to the northwestern areas, corresponding to the precipitation gradient. The SOC density increased significantly with soil moisture, clay and silt content, but weakly with mean annual temperature. These variables could together explain about 72% of total variation in SOC density, of which 54% was attributed to soil moisture, suggesting a key role of soil moisture in shaping spatial patterns of SOC density in the alpine grasslands.

DOI

[34]
Yuan Lihua, Jiang Weiguo, Shen Wenminget al., 2013. The spatio-temporal changes of vegetation cover in the Yellow River Basin from 2000 to 2010.Acta Ecologica Sinica, 33(24): 7798-7806. (in Chinese)

[35]
Zhan Jinyan, Yan Haiming, Chen Binet al., 2012. Decomposition analysis of the mechanism behind the spatial and temporal patterns of changes in carbon bio-sequestration in China.Energies, 5(2): 386-398.Great attention has been paid to carbon bio-sequestration due to increasing concerns over global warming. Understanding the relationship between carbon bio-sequestration and its influencing factors is of great significance for formulating appropriate management measures for global warming mitigation. Since change in carbon bio-sequestration is a complex process, it is difficult to take into account all of its influencing factors, while the panel data model may provide an effective way to measure their subtle effects. In this paper, decomposition analysis is applied to further analyze these influencing factors. The results indicate that climatic, demographic and geographical variables play important roles in explaining the spatial heterogeneity of carbon bio-sequestration in China, which is consistent with previous researches. Meanwhile, the irrigation rate is found to be the most critical factor influencing carbon bio-sequestration changes, followed by climatic and economic factors. These results may provide decision makers in China with important scientific reference information for formulating regional carbon bio-sequestration management policies, which are of great significance to alleviating and adapting to global warming.

DOI

[36]
Zhang G N, Chen Z H, Zhang A Met al., 2014. Influence of climate warming and nitrogen deposition on soil phosphorus composition and phosphorus availability in a temperate grassland, China. Journal of Arid Land, 6(2): 156-163.Climate warming and nitrogen (N) deposition change ecosystem processes, structure, and functioning whereas the phosphorus (P) composition and availability directly influence the ecosystem structure under condi-tions of N deposition. In our study, four treatments were designed, including a control, diurnal warming (DW), N deposition (ND), and combined warming and N deposition (WN). The effects of DW, ND, and WN on P composition were studied by <sup>31</sup>P nuclear magnetic resonance (<sup>31</sup>P NMR) spectroscopy in a temperate grassland region of China. The results showed that the N deposition decreased the soil pH and total N (TN) concentration but increased the soil Olsen-P concentration. The solution-state <sup>31</sup>P NMR analysis showed that the DW, ND and WN treatments slightly decreased the proportion of orthophosphate and increased that of the monoesters. An absence of myo-inositol phosphate in the DW, ND and WN treatments was observed compared with the control. Furthermore, the DW, ND and WN treatments significantly decreased the recovery of soil P in the NaOH&ndash;EDTA solution by 17%&ndash;20%. The principal component analysis found that the soil pH was positively correlated with the P recovery in the NaOH&ndash;EDTA solution. Therefore, the decreased soil P recovery in the DW and ND treatments might be caused by an indirect influence on the soil pH. Additionally, the soil moisture content was the key factor limiting the available P. The positive correlation of total carbon (TC) and TN with the soil P composition indicated the influence of climate warming and N deposition on the biological processes in the soil P cycling.

DOI

[37]
Zhang Li, Guo Huadong, Jia Gensuoet al., 2014. Net ecosystem productivity of temperate grasslands in northern China: An upscaling study.Agricultural and Forest Meteorology, 184: 71-81.Grassland is one of the widespread biome types globally, and plays an important role in the terrestrial carbon cycle. We examined net ecosystem production (NEP) for the temperate grasslands in northern China from 2000 to 2010. We combined flux observations, satellite data, and climate data to develop a piecewise regression model for NEP, and then used the model to map NEP for grasslands in northern China. Over the growing season, the northern China's grassland had a net carbon uptake of 15802±022502g02C02m 612 during 2000–2010 with the mean regional NEP estimate of 12602Tg02C. Our results showed generally higher grassland NEP at high latitudes (northeast) than at low latitudes (central and west) because of different grassland types and environmental conditions. In the northeast, which is dominated by meadow steppes, the growing season NEP generally reached 200–30002g02C02m 612 . In the southwest corner of the region, which is partially occupied by alpine meadow systems, the growing season NEP also reached 200–30002g02C02m 612 . In the central part, which is dominated by typical steppe systems, the growing season NEP generally varied in the range of 100–20002g02C02m 612 . The NEP of the northern China's grasslands was highly variable through years, ranging from 129 (2001) to 21702g02C02m 612 02growing season 611 (2010). The large interannual variations of NEP could be attributed to the sensitivity of temperate grasslands to climate changes and extreme climatic events. The droughts in 2000, 2001, and 2006 reduced the carbon uptake over the growing season by 11%, 29%, and 16% relative to the long-term (2000–2010) mean. Over the study period (2000–2010), precipitation was significantly correlated with NEP for the growing season ( R 2 02=020.35, p -value02<020.1), indicating that water availability is an important stressor for the productivity of the temperate grasslands in semi-arid and arid regions in northern China. We conclude that northern temperate grasslands have the potential to sequester carbon, but the capacity of carbon sequestration depends on grassland types and environmental conditions. Extreme climate events like drought can significantly reduce the net carbon uptake of grasslands.

DOI

[38]
Zhang Qingyu, Zhao Dongsheng, Wu Shaohonget al., 2013. Research on vegetation changes and influence factors based on eco-geographical regions of Inner Mongolia.Scientia Geographica Sinica, 33(5): 594-601. (in Chinese)This study constructed growing season NDVI in 1982-2011 based on GIMMS and MODIS data in Inner Mongolia.The spatial and temporal characteristics of inter-annual NDVI changes were analyzed and natural and human influence factors were investigated in different eco-geographical regions.The results show that,linear regression equation is a good method to modify NDVI in GIMMS and MODIS remote images.The growing season NDVI increased on the whole and the increase rate was 0.265% and displayed significant inter-annual fluctuations in the past 30 years.NDVI decreased significantly in 1982-1986,then increase significantly during 1997-2002,and relative steady phases were in 1986-1997 and in 2002-2011.NDVI that increased most significantly were located in the northern of Inner Mongolia.However,there were 5.075% regions decreased which mainly distributed on typical steppe in Hulun Buir and Xilin Gol.NDVI change rates of different vegetations from eco-geographical region were in the following order: farm and shrub forest farm and typical steppe meadow and meadow steppe typical steppe and farm typical steppe desert steppe desert.NDVI change rate was fastest in IIC2 eco-geographical region which was 0.277 and slowest in IID2 eco-geographical region which was 0.001.NDVI was significantly correlated with precipitation in most regions and presented obvious strap regularity from east to west,which was negative correlation in the eastern region,positive correlation in center region and no correlation in the western region.However,great differences existed in different eco-geographical region of Inner Mongolia.Eco-geographical region of IIA3,IA1 had biggest correlation which more than 0.5 but significant negative correlate between NDVI and precipitation in all regions.NDVI had little significantly positive correlations with temperature in Inner Mongolia whose correlations were less than 0.2 in most eco-geographical regions.However,NDVI exhibited significant positive correlations with temperature in highland desert steppe region of Western Inner Mongolia and highland steppe region of Eastern Inner Mongolia.Vegetation that influenced by human activities was gradually increased with the increase of vegetation complex degree in the last 30 years.There are most effects by human activities in IIC1,IIC2,IIIB3 eco-geographical region which located on the south of the Da Hinggan Mountains and least effects in IA1,IIB2,IIA3 eco-geographical region which distributed in the northeastern of the mountains.In the areas where human activities heavily restrained NDVI increased by 41.165%,and they were located in IIC3,IIC4 and IID2 eco-geographical region,in the other eco-geographical regions NDVI were promoted about 58.835% obviously.In IIC1,IIC2,IIIB3 eco-geographical region human activities promote NDVI most significantly.NDVI was promoted by national policies such as the natural forest protection project,conversion of cropland to forest and grassland project,desertification treatment and so on.However,over grazing,excessive reclamation,rapid urbanization etc could lead NDVI decrease.

[39]
Zhao Tongqian, Ouyang Zhiyun, Jia Liangqinget al., 2004. Ecosystem services and their valuation of China grassland.Acta Ecologica Sinica, 24(6): 1101-1110. (in Chinese)Grassland ecosystem is the biggest one in China terrestrial ecosystems, and plays special role in maintaining the structure, functions and ecological processes of natural ecosystems. At present, a series of ecological problems are becoming more and more serious because of grassland degradation in some regions. One of the essential reasons is that some important ecological functions of grassland ecosystem and their values are neglected. The economic valuation of grassland ecosystem services, especially the regulating and supporting services that is remarkable but unfamiliar by public, will help to the conservation, reclamation and rational of grassland resources in China.The services of China grassland ecosystem that provide indirect values for being comprise soil erosion control, rainfall regulation, soil C accumulation (weather regulation), waste degradation, nutrient cycling, air quality purifying, cultural diversity, and biodiversity maintenance.

[40]
Zhu Wenquan, Chen Yunhao, Xu Danet al., 2005. Advances in terrestrial net primary productivity (NPP) estimation models.Chinese Journal of Ecology, 24(3): 296-300. (in Chinese)Net primary productivity (NPP) estimation is an important study field of global change and terrestrial ecosystems (GCTE).Climate-productivity relationship models,eco-physiological processing models and light utilization efficiency models are the three main kinds of models for terrestrial NPP estimation.The achievements and problems of these models were reviewed comprehensively and systematically,and a strong development trend of NPP estimation was presented in this paper.Present research on the terrestrial NPP estimation mainly focus on the eco-physiological process models,and the regional scaling is the key problem of their application.Light utilization efficiency models based on remote sensing are an absolutely new method for NPP estimation in recent years.Remote sensing information can be used in a relatively simple modeling framework to estimate global NPP of terrestrial vegetation from direct satellite observations.However,their fundamental understanding of ecological process is not clear.Substantial studies showed that remote sensing applications,coupled with the eco-physiological process models,would be a major developing field in the estimation of terrestrial NPP.It can enhance our ability to model the spatial pattern and dynamics of NPP at both regional and global scales.

DOI

[41]
Zhu Wenquan, Pan Yaozhong, Zhang Jinshui, 2007. Estimation of net primary productivity of Chinese terrestrial vegetation based on remote sensing.Journal of Plant Ecology, 31(3): 413-424. (in Chinese)Aims Net primary productivity (NPP) is a key component of the terrestrial carbon cycle. Model simulation is commonly used to estimate regional and global NPP given difficulties to directly measure NPP at such spatial scales. A number of NPP models have been developed in recent years as research issues related to food security and biotic response to climatic warming have become more compelling. However, large uncertainties still exist because of the complexity of ecosystems and difficulties in determining some key model parameters. Methods We developed an estimation model of NPP based on geographic information system (GIS) and remote sensing (RS) technology. The vegetation types and their classification accuracy are simultaneously introduced to the computation of some key vegetation parameters, such as the maximum value of normalized difference vegetation index (NDVI) for different vegetation types. This can remove some noise from the remote sensing data and the statistical errors of vegetation classification. It also provides a basis for the sensitivity analysis of NPP on the classification accuracy. The maximum light use efficiency (LUE) for some typical vegetation types in China is simulated using a modified least squares function based on NOAA/AVHRR remote sensing data and field-observed NPP data. The simulated values of LUE are greater than the value used in the CASA model and less than the values simulated with the BIOME-BGC model. The computation of the water restriction factor is driven with ground meteorological data and remote sensing data, and complex soil parameters are avoided. Results are compared with other studies and models. Important findings The simulated mean NPP in Chinese terrestrial vegetation from 1989-1993 is 3.12 Pg C (1 Pg=1015 g). The simulated NPP is close to the observed NPP, and the total mean relative error is 4.5% for 690 NPP observation stations distributed in the whole country. This illustrates the utility of the model for the estimation of terrestrial primary production over regional scales.

DOI

Outlines

/