Orginal Article

Potential promoted productivity and spatial patterns of medium- and low-yield cropland land in China

  • YAN Huimin , 1 ,
  • JI Yongzan 1, 2 ,
  • LIU Jiyuan 1 ,
  • LIU Fang 1 ,
  • HU Yunfeng 1 ,
  • KUANG Wenhui 1
Expand
  • 1. Institute of Geographic Sciences and Natural Resources Research, CAS, Beijing 100101, China
  • 2. University of Chinese Academy of Sciences, Beijing 100049, China

Author: Yan Huimin, PhD, specialized in land use change. E-mail:

Received date: 2015-06-09

  Accepted date: 2015-08-20

  Online published: 2016-07-25

Supported by

STS Project of CAS, No.KFJ-EW-STS-001

National Natural Science Foundation of China, No.41430861

Copyright

Journal of Geographical Sciences, All Rights Reserved

Abstract

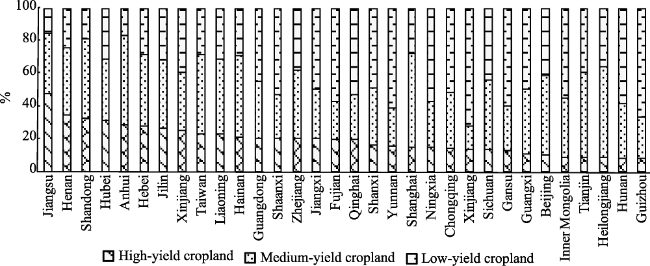
With a continuously increasing population and better food consumption levels, improving the efficiency of arable land use and increasing its productivity have become fundamental strategies to meet the growing food security needs in China. A spatial distribution map of medium- and low-yield cropland is necessary to implement plans for cropland improvement. In this study, we developed a new method to identify high-, medium-, and low-yield cropland from Moderate Resolution Imaging Spectroradiometer (MODIS) data at a spatial resolution of 500 m. The method could be used to reflect the regional heterogeneity of cropland productivity because the classification standard was based on the regionalization of cropping systems in China. The results showed that the proportion of high-, medium-, and low-yield cropland in China was 21%, 39%, and 40%, respectively. About 75% of the low-yield cropland was located in hilly and mountainous areas, and about 53% of the high-yield cropland was located in plain areas. The five provinces with the largest area of high-yield cropland were all located in the Huang-Huai-Hai region, and the area amounted to 42% of the national high-yield cropland area. Meanwhile, the proportion of high-yield cropland was lower than 15% in Heilongjiang, Sichuan, and Inner Mongolia, which had the largest area allocated to cropland in China. If all the medium-yield cropland could be improved to the productive level of high-yield cropland and the low-yield cropland could be improved to the level of medium-yield cropland, the total productivity of the land would increase 19% and 24%, respectively.

Cite this article

YAN Huimin , JI Yongzan , LIU Jiyuan , LIU Fang , HU Yunfeng , KUANG Wenhui . Potential promoted productivity and spatial patterns of medium- and low-yield cropland land in China[J]. Journal of Geographical Sciences, 2016 , 26(3) : 259 -271 . DOI: 10.1007/s11442-016-1267-2

1 Introduction

Continuous population growth and food consumption have placed huge pressure on agriculture and natural resources, and greatly increased food production is needed to ensure global food security (Foley et al., 2011). Grain production in most arable land is far below the potential productivity of high-producing cropland under similar climatic conditions (Foley et al., 2011; Tilman et al., 2011). There is therefore great potential to improve the actual productivity and the land use efficiency of arable land. A substantial rise in food production can be achieved through the adoption of new technologies, improved water and nutrient-use efficiency, and advanced agricultural management (Foley et al., 2011; Foley et al., 2005; Shi et al., 2010; Tilman et al., 2011; Zhang et al., 2005). China is the world’s largest producer and consumer of agricultural products, and is faced with increasing resource constraints to agricultural development (Shi et al., 2010). The sustained and steady growth of agriculture in China will have to rely on an acceleration of agricultural science and technological innovation that will improve the efficiency of resource utilization [Chen Xiwen: stick to the path of agricultural modernization with Chinese characteristics, http://cpc.people.com.cn/ GB/64162/82819/114926/114927/6840448.html (2008/01/30)] and result in efficient, high-yielding agriculture coordinated with sustainable resource use.
To improve the basic conditions for agricultural production, the Chinese government initiated a medium- and low-yield cropland improvement project in 1988, and a high-standard cropland construction project in 2009. From 1988 to 2012, approximately 661 million hectares (ha) of cropland[Wang Guangkun: http://www.farmer.com.cn/xwpd/btxw/201312/t20131206_920451.htm (2013/12/06)]) in 2045 counties and 222 state-owned farms were covered by these types of projects. In 2013, the State Council of the People’s Republic of China approved the “National Comprehensive Agricultural Development and High-standard Farmland Construction Plan” with a goal of 800 million mu (15 mu = 1 ha) of high-standard cropland and improved medium- and low-yield cropland by 2020. Therefore, an accurate and explicit spatial expression of medium- and low-yield cropland distribution is necessary before implementing a cropland promotion plan.
Current studies show that high-, medium-, and low-yield cropland can be identified using the following three methods. The first one is the cropland quality method based on field survey data. This method classifies cropland into quality levels using obstacle factors as key indicators. High-yield cropland has few limitations, and classification of medium- and low-yield cropland is conducted according to different limitation levels (Lin, 2008). The second one is the average yield method based on statistical data (Lin, 2008; Wu, 2009). A certain deviation (e.g., 15% or 50 kg) from the average yield is taken as the upper or lower limit of medium-yield cropland. The third one is the potential productivity method (Lin, 2008), in which classification of high-, medium-, and low-yield cropland is conducted according to the ratio values of their actual productivity to potential productivity. These methods have both advantages and disadvantages. The cropland quality method requires systematic and detailed fieldwork to evaluate the limiting factors of cropland; it is labor intensive, requires capital investment, and is time consuming, and it is difficult for near real-time monitoring and evaluation of cropland quality on a large scale. The average yield method is hard to avoid the interference of cropping system adjustments and crop variety changes. In addition, county-based statistical data is important for qualifying the actual productivity of cropland at a national or regional scale; however, it cannot evaluate the quality of specific plots. The potential productivity method needs an estimation of the maximum potential productivity of cropland and involves complex computational processes. Therefore, a novel method for spatially explicit monitoring and effective evaluation of cropland quality on a large scale is needed to improve the sustainable use of arable land.
The development of satellite observation techniques provides data access for land use change and the monitoring of crop growth for different spatial-temporal scales (Li Folin, 2005). The development of productivity models makes them increasingly applicable to the simulation of the productivity of various ecosystems and their responses to climate and land use changes at multiple scales (Huang et al., 2008; Li Folin, 2005; Wang et al., 2010; Yan et al., 2012). Large developments in remote sensing technology and remote sensing models for cropland productivity make it feasible to propose a novel classification method of high-, medium-, and low-yield cropland. Ecosystem net primary productivity (NPP) represents the accumulated organic matter of plants per unit area and time. It directly represents cropland actual productivity and provides a unified measurement for the productivity of various crops. Remote sensing based NPP estimation has become an effective and feasible metric to monitor high-, medium-, and low-yield cropland. The VPM (Vegetation Photosynthesis Model) is one of the important methods for estimating NPP based on MODIS data. The VPM can estimate ecosystem productivity in regions with multiple cropping systems (Yan et al., 2012; Yan et al., 2009). In this study, we simulated cropland NPP using a VPM model and MODIS data with a spatial resolution of 500 m. We then identified high-, medium-, and low-yield cropland according to the derived standard in each cropping system zone of China. We finally estimated the level of potential productivity of medium- and low-yield cropland.

2 Data and methods

2.1 The VPM model

The VPM (Xiao et al., 2004) is a satellite-based light use efficiency model used in estimating ecosystem productivity. The model has been validated by CO2 flux observation data in different cropland ecosystems, including spring corn (Wang et al., 2010) in northeast China and a winter wheat-summer maize rotation in Yucheng (Yan et al., 2009).
In the VPM, gross primary productivity (GPP) is estimated based on Monteith’s equation; estimation of GPP is expressed as:
GPP=εg×FPARchl×PAR (1)
where εg is the light use efficiency (μmol CO2/μmol PPFD), FPARchl is the fraction of photosynthetically active radiation (PAR) absorbed by leaf chlorophyll in the canopy, and PAR is the photosynthetically active radiation (μmol photosynthetic photon flux density, PPFD).
Light use efficiency (εg) is affected by temperature, water, and leaf phenology:
εg = ε0×Tscalar × Wscalar × Pscalar (2)
where ε0 is the maximum radiation use efficiency (μmol CO2/μmol PAR). The value of ε0 was calculated from NEE (Net Ecosystem Exchange) and incident PAR observed from CO2 eddy flux tower sites (Yan et al., 2012). Tscalar, Wscalar, and Pscalar are the scalars for the effects of temperature, water, and leaf phenology on the light use efficiency of vegetation, respectively. More detailed methods for calculating the parameters above have been reported by Kalfas et al. (2011).
NPP is estimated as the ratio of autotrophic respiration to GPP. According to the experimental results of respiration rate on wheat, sunflower, sorghum, and beans, the ratio value of autotrophic respiration to GPP generally remains constant and equal to 0.42 (Albrizio et al., 2003; Ball, 1996; Cheng et al., 2000; Gifford, 1995).

2.2 Data

(1) Cropland distribution
Cropland distribution data came from the National Land-Use/Land-Cover Dataset (NLCD) with a mapping scale of 1:100 000. The dataset was interpreted from Landsat TM/ETM images with a 30-m spatial resolution and its accuracy was validated by extensive field survey data.
(2) Cropland productivity
National cropland NPP during 2000-2008 was simulated using a VPM model. In order to eliminate effects from climate fluctuation and agricultural management changes, the average NPP of 2001-2010 was taken as the cropland productivity for high-, medium-, and low-yield cropland classification.
(3) Cropping system zones of China
To take into account the regional differences in natural and climatic conditions, a map of China’s cropping system zones was used in this study. China’s arable land is divided into three cropping zones, 12 major zones, and 38 sub-zones in terms of heat, water, topography, cropping systems, crop types, and socio-economic conditions (Figure 1). Within each cropping sub-zone, a standard for high-, medium-, and low-yield cropland classification was developed in this study.
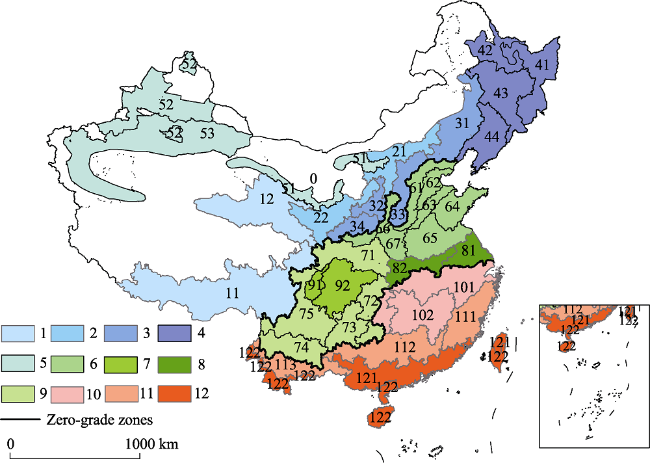
Figure 1 Map of China’s cropping system zones. The zero-grade zones classify the land as single-, double-, and triple-cropping zones. The numbers, ranging from 1 to 12, represent the codes of major zones and are marked in the same color. Thirty-eight sub-zones are labeled by numbers.
The driving data for the VPM model included the Enhanced Vegetation Index (EVI) and Land Surface Water Index (LSWI), temperature and PAR, in which EVI and LSWI were calculated from MODIS surface reflectance product (MOD09A1, http://www.edc.usgs.gov/) with 500 m spatial and 8-day temporal resolution. Temperature data was derived from meteorological observations provided by the China Meteorological Data Sharing Service System (http://www.cma.gov.cn/2011qxfw/2011qsjgx/). PAR data was retrieved from MODIS surface reflectance product.

2.3 High-, medium-, and low-yield cropland classification method

In this study, medium-, and low-yield cropland indicated the cropland with a lower or much lower productivity output than their potential under the current natural and socio-economic conditions. High-yield cropland referred to highly productive cropland with few limiting factors to its agricultural production.
To avoid misclassification caused by mixed pixels, we chose pixels with a cropland area percentage of not less than 50% within each 500 m x 500 m grid for the classification criteria, and obtained frequency distribution histograms of NPP in different agricultural regions. There were four typical frequency distribution histograms in 38 sub-zones (Figure 2), and each of them had a concentrated distribution. The NPP values at two inflection points before and after the concentrated distribution were regarded as the boundary values, and the grids outside the intervals with low frequency were taken as noise. NPPa and NPPb represented two inflection points (NPPa<NPPb); NPPdif was defined as the difference between NPPb and NPPa. Theoretically, the proportion of high-, medium-, and low-yield cropland area should be the same, which means NPPa+1/3*NPPdif should be the upper limit of low-yield cropland, and NPPb-1/3*NPPdif should be the lower limit of high-yield cropland. However, considering the continuous cropland improvement projects in recent years, the proportions for the three types of cropland were adjusted to 30%, 35%, and 35%, respectively. The boundaries for high-, medium-, and low-yield cropland are expressed as follows:
Upper limit for low-yield cropland = NPPa + NPPdif*30%
Lower limit for high-yield cropland = NPPb - NPPdif*35%
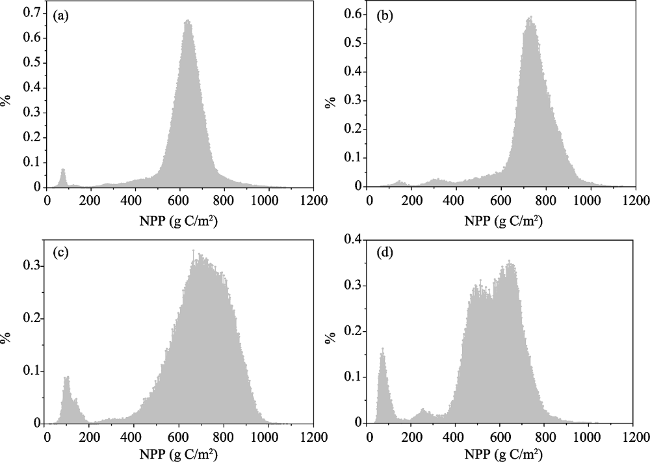
Figure 2 Four typical frequency distribution histograms
43-single cropping zone in Songnen Plain (a); 82-irrigated and dryland zone in Hubei-Henan-Anhui hilly plain (b); 61-irrigated double cropping and dryland single cropping in piedmont plain of Yanshan and Taihang Mountains (c); 33-semi-humid and drought-prone single cropping in east Shanxi Province (d)

3 Results

3.1 Spatial patterns of high-, medium-, and low-yield cropland

The proportional areas of high-, medium-, and low-yield cropland in China were approximately 20.66%, 39.56% and 39.78%, respectively. High-yield cropland is mainly distributed in the North China Plain, the middle and lower reaches of the Yangtze River Plain, Sichuan Basin, central Jilin, and northeastern Liaoning. These regions provide the best conditions for crop growth with flat terrain and abundant water resources. A small amount of high-yield cropland is distributed in central Shaanxi, northern Ningxia, central and southern Gansu, and northwestern Xinjiang. Although these regions have a relatively poor climate conditions, natural rivers ensure water supply and agricultural development, so they offer a greater productive potential than other cropland in the same agricultural region. Medium-yield cropland is mainly concentrated in the Northeast China Plain, Sichuan Basin, southern and central Henan, and northern Anhui, most of which are surrounding or close to high-yield cropland. Low-yield cropland is distributed in regions with poor natural geographic and climatic conditions, such as the Loess Plateau, the Yunnan-Guizhou Plateau, and the farming-pastoral ecotone of Inner Mongolia (Figure 3).
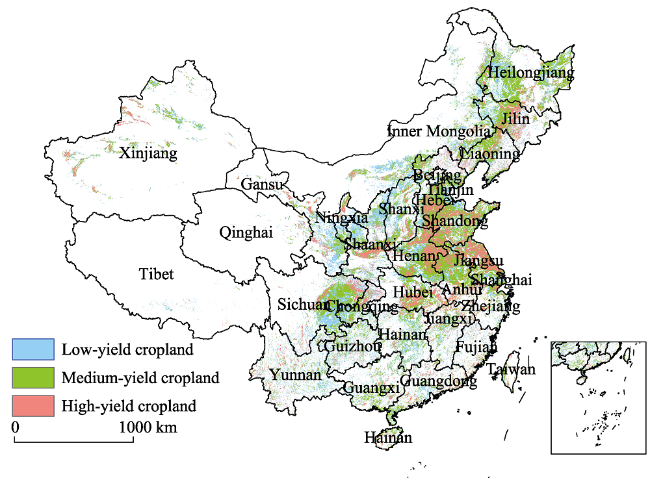
Figure 3 The distribution map of high-, medium-, and low-yield cropland in China
Besides temperature and water conditions, topography is an important factor causing regional differences in cropland productivity. In this study, degrees of relief were extracted from a 1-km digital elevation model (DEM) with an appropriate analysis window of 5 km × 5 km (Zhang et al., 2012). The regions with a relief degree lower than 30 m were defined as plain areas and regions with a relief degree higher than 30 m were defined as hilly and mountainous areas (Liu et al., 2001). In China, 40% of cropland is located in plain areas, while 60% of cropland is located in hilly and mountainous areas. In the plain areas, medium-yield cropland accounted for 48.14%, while high- and low-yield cropland accounted for 27.95% and 23.91%, respectively. In the hilly and mountainous areas, low-yield cropland accounted for the largest area, being 49.15%, and proportions of medium- and high-yield cropland were 34.61% and 16.24%, respectively (Figure 4). In general, about 75% of low-yield cropland was located in the hills and mountains, and the area of medium-yield cropland distributed on the plains was similar to that of the hills and mountains, while proportions of high-yield cropland distributed on the plains and in the hilly and mountainous areas were 53% and 47%, respectively.
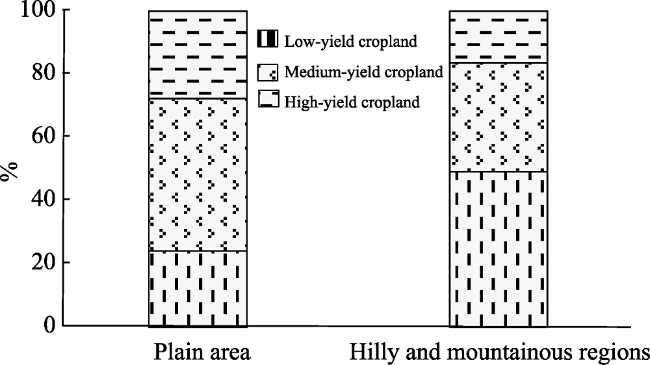
Figure 4 The composition of different terrain areas and croplands
The five provinces with the largest high-yield cropland areas were Henan, Shandong, Jiangsu, Hebei, and Anhui located in the Huang-Huai-Hai Plain region, followed by Hubei, Jilin, and Sichuan provinces. The spatial distribution of high-yield cropland in the above eight provinces was concentrated, and the sum of these high-yield areas accounted for 57.3% of the national high-yield cropland area. Medium- and low-yield cropland was mainly located in Heilongjiang, Sichuan, Inner Mongolia, Henan, and Hebei, accounting for 34.88% of the national medium-, and low-yield cropland area. There were 12 provinces (autonomous regions) in which the proportion of high-yield cropland was greater than the national average (20.66%); Jiangsu ranked first with approximately 50% of high-yield cropland. There were 17 provinces (autonomous regions and municipalities) with proportional areas of low-yield cropland greater than the national average (39.78%; Figure 5).
Figure 5 The proportions of high-, medium-, and low- yield cropland in each province

3.2 Potential promoted productivity of medium- and low-yield cropland

Medium- and low-yield cropland refers to arable land that has a potential for increased productivity, because their current productivity levels are far below their potential productivity under the current natural and social conditions. The summed area of medium- and low-yield cropland accounted for 79.34% of the total cropland area in China. In this study, it was assumed that promoted medium- and low-yield cropland had the potential to reach new levels of productivity that may be as high as high-yield cropland in the same sub-zone of the cropping system zones. Therefore, the promoted potential of medium- and low-yield cropland productivity after reformation could be estimated according to the difference between the lower limit for high-yield cropland productivity and the upper limit for medium- or low-yield cropland productivity in each sub-zone. We suggest that low-yield cropland can reach medium-yield levels and that medium-yield cropland can reach high-yield levels, through the reformation of these arable lands. The average productivity of high-, medium-, and low-yield cropland in sub-zones is defined as Phigh, Pmedium, and Plow, respectively, while Pmedium-Plow and Pmedium-Plow represent the promoted potential for medium- and low- yield cropland productivity (Table 1 and Figure 6).
Table 1 Promoted potential of medium- and low-yield cropland productivity in sub-zones (gC/m2/a)
Sub-zone
code
Promoted potential of low-yield cropland productivity Promoted potential of medium-yield cropland productivity Sub-zone
code
Promoted potential of low-yield cropland productivity Promoted potential of medium-yield cropland productivity
11 167.53 214.61 65 135.99 91.91
12 149.05 134.14 66 154.66 157.73
21 80.97 115.43 67 91.62 87.16
22 134.49 197.51 71 145.93 138.42
31 120.70 129.34 72 128.45 101.59
32 67.47 95.10 73 82.74 80.06
33 122.54 122.51 74 269.63 241.69
34 122.43 145.19 75 150.37 163.29
41 89.15 97.85 81 190.49 135.47
42 75.86 122.82 82 93.59 110.83
43 84.80 80.20 91 79.49 72.63
44 100.80 66.66 92 86.92 124.33
51 238.04 195.18 101 174.25 178.35
52 214.61 248.09 102 131.90 117.79
53 225.30 190.01 111 197.00 248.66
61 159.29 150.06 112 146.24 119.47
62 126.33 120.05 113 247.75 266.32
63 138.81 112.36 121 206.51 216.96
64 147.89 117.72 122 297.01 321.38
The productivity of medium- and low-yield cropland in China was 49,263.07×104 tC/a and 15,859.72×104 tC/a. The promoted potential of medium- and low-yield cropland productivity was approximately 9318.65×104 tC/a and 3813.85×104 tC/a, respectively. Thus, the productivity of medium- and low-yield cropland productivity would increase 18.92% and 24.05%, respectively. The top five provinces with the highest promoted potential of low-yield cropland productivity were Yunnan, Sichuan, Heilongjiang, Inner Mongolia, and Guangdong; their promoted potential was higher than 200×104 tC/a. The high promoted potential in Yunnan, Sichuan, and Inner Mongolia benefited from the large areas of low-yield cropland, while the high promoted potential of productivity per unit area in low-yield cropland was the main reason for the high potential promoted productivity in Guangdong (Table 2 and Figure 6).
Table 2 Production capability and potential promoted productivity of low-yield cropland in each province
Province Area proportion of low-yield cropland (%) Low-yield cropland
productivity (×104 C)
Proportion of low-yield cropland productivity (%) Potential promoted productivity (×104 C) Increase rate % Proportion of potential promoted productivity (%)
Heilongjiang 7.96 1732.78 10.93 258.18 14.90 6.77
Jilin 3.29 452.45 2.85 88.00 19.45 2.31
Liaoning 2.78 270.01 1.70 50.67 18.77 1.33
Beijing 0.28 51.19 0.32 15.38 30.04 0.40
Tianjin 0.38 90.19 0.57 21.86 24.24 0.57
Hebei 3.85 662.04 4.17 173.34 26.18 4.55
Shandong 2.70 440.02 2.77 108.70 24.70 2.85
Henan 3.60 1021.36 6.44 175.70 17.20 4.61
Shanxi 4.18 569.75 3.59 141.79 24.89 3.72
Shaanxi 5.39 430.27 2.71 97.09 22.56 2.55
Gansu 5.54 520.49 3.28 163.77 31.46 4.29
Xinjiang 3.26 413.12 2.60 157.81 38.20 4.14
Inner Mongolia 8.75 1008.00 6.36 235.99 23.41 6.19
Ningxia 1.48 161.57 1.02 68.00 42.09 1.78
Qinghai 0.61 22.78 0.14 9.06 39.80 0.24
Tibet 0.46 19.03 0.12 10.77 56.60 0.28
Jiangsu 1.42 337.51 2.13 102.14 30.26 2.68
Anhui 1.85 476.93 3.01 104.79 21.97 2.75
Hubei 2.89 376.33 2.37 86.22 22.91 2.26
Hunan 4.98 699.15 4.41 174.32 24.93 4.57
Jiangxi 3.09 532.08 3.35 114.66 21.55 3.01
Zhejiang 1.48 480.30 3.03 154.58 32.18 4.05
Shanghai 0.17 44.21 0.28 14.97 33.86 0.39
Guangdong 2.75 679.24 4.28 231.58 34.09 6.07
Guangxi 3.56 532.55 3.36 169.57 31.84 4.45
Fujian 1.75 521.27 3.29 162.21 31.12 4.25
Hainan 0.35 95.89 0.60 40.13 41.85 1.05
Taiwan 0.26 78.64 0.50 31.66 40.26 0.83
Sichuan 7.54 1772.73 11.18 265.77 14.99 6.97
Yunnan 5.91 751.06 4.74 292.76 38.98 7.68
Chongqing 2.79 468.50 2.95 64.14 13.69 1.68
Guizhou 4.69 148.30 0.94 28.23 19.04 0.74
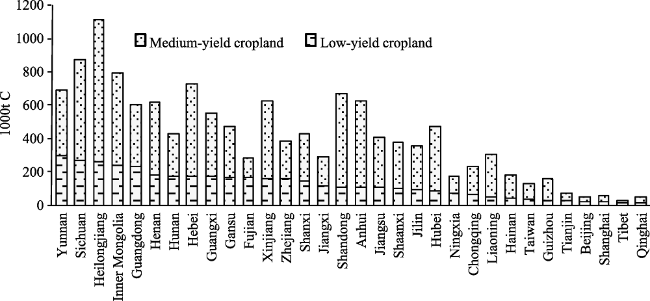
Figure 6 Potential promoted productivity in each province (ordered by total amount)
The top five provinces for promoted potential in medium-yield cropland were Heilongjiang, Sichuan, Shandong, Inner Mongolia, and Hebei, with a promoted potential above 550× 104 tC/a; Heilongjiang had the highest potential of approximately 851.49×10⁴ tC/a. The high potential in these five provinces was due to the large area of widely distributed medium-yield cropland, although the growth rates were all less than 25%. The area and productivity of medium-yield cropland in Henan and Anhui were higher than those in Hebei and Inner Mongolia, but the promoted potential and growth rate were relatively low. The growth rate of promoted potential for medium-yield cropland was only 13.06% in Henan (Table 3).
The lowest five provinces with promoted potential of medium-yield cropland productivity were those regions with developed economies and small areas of cropland (Beijing, Tianjin, and Shanghai) or regions with poor natural conditions (Qinghai and Tibet). The promoted potential of low- and medium-yield cropland productivity in these regions was less than 25×104 tC/a and 50×104 tC/a, respectively.
Table 3 Production capacity and potential promoted productivity of medium-yield cropland in province
Province Area proportion of medium-yield cropland (%) Medium-yield cropland
productivity (×104 C)
Proportion of medium-yield cropland
productivity (%)
Potential promoted productivity (×104 C) Increase rate (%) Proportion of potential promoted productivity (%)
Heilongjiang 12.53 5591.56 11.35 851.49 15.23 9.14
Jilin 4.50 2027.35 4.12 263.31 12.99 2.83
Liaoning 4.20 1902.89 3.86 251.32 13.21 2.70
Beijing 0.33 154.59 0.31 34.50 22.31 0.37
Tianjin 0.50 228.52 0.46 43.74 19.14 0.47
Hebei 6.07 2731.25 5.54 552.14 20.22 5.93
Shandong 7.06 3542.15 7.19 558.29 15.76 5.99
Henan 6.38 3368.73 6.84 440.08 13.06 4.72
Shanxi 3.08 1272.41 2.58 282.19 22.18 3.03
Shaanxi 2.70 1226.67 2.49 279.82 22.81 3.00
Gansu 2.53 1046.96 2.13 303.88 29.03 3.26
Xinjiang 2.99 1618.20 3.28 465.51 28.77 5.00
Inner Mongolia 5.80 2385.04 4.84 556.47 23.33 5.97
Ningxia 0.73 284.72 0.58 99.90 35.08 1.07
Qinghai 0.32 113.63 0.23 36.18 31.84 0.39
Tibet 0.09 30.99 0.06 13.94 44.97 0.15
Jiangsu 3.58 1908.20 3.87 303.91 15.93 3.26
Anhui 6.18 3316.31 6.73 519.71 15.67 5.58
Hubei 3.60 1871.25 3.80 379.66 20.29 4.07
Hunan 2.85 1543.79 3.13 250.27 16.21 2.69
Jiangxi 1.90 1029.40 2.09 171.48 16.66 1.84
Zhejiang 1.66 849.77 1.72 230.50 27.12 2.47
Shanghai 0.35 168.73 0.34 42.25 25.04 0.45
Guangdong 2.14 1287.21 2.61 367.70 28.57 3.95
Guangxi 2.91 1694.63 3.44 382.28 22.56 4.10
Fujian 0.71 408.86 0.83 118.86 29.07 1.28
Hainan 0.62 445.10 0.90 139.98 31.45 1.50
Taiwan 0.44 292.91 0.59 92.02 31.42 0.99
Sichuan 7.30 3655.76 7.42 603.26 16.50 6.47
Yunnan 2.29 1430.87 2.90 390.90 27.32 4.19
Chongqing 1.88 969.52 1.97 162.34 16.74 1.74
Guizhou 1.78 865.09 1.76 130.82 15.12 1.40

4 Conclusions

A spatial distribution map of medium- and low-yield cropland is necessary for planning cropland improvement and meeting the demand for food security in China. In this study, a spatial distribution map of high-, medium-, and low-yield cropland was developed from satellite observation data at a spatial resolution of 500 m. Based on this map and the estimated actual cropland productivity, the potential productivity from promoting medium- and low-yield cropland was estimated. The results of this study showed that:
(1) The proportional areas of high-, medium-, and low-yield cropland in China were approximately 20.66%, 39.56%, and 39.78%, respectively. About 75% of low-yield cropland was located in the hilly and mountainous areas. In the plain areas, about 48% of the cropland was medium-yield, followed by high-yield cropland (28%), and the low-yield area was similar to the high-yield area.
(2) Of China’s medium- and low-yield cropland areas, more than 85% was distributed in Guizhou, Hunan, Heilongjiang, Tianjin, Inner Mongolia, Beijing, Guangxi, Gansu, Sichuan, Xinjiang, and Chongqing. Tibet, Guizhou, and Yunnan had the highest proportional areas (>60%) of low-yield cropland. The three provinces of Heilongjiang, Sichuan, and Inner Mongolia had the largest cropland area, but their high-yield areas covered no more than 15% of the total cropland area.
(3) In the case where all medium-yield cropland is improved to high-yield cropland and all low-yield cropland is improved to medium-yield cropland, the productivity of medium- and low-yield cropland would increase 19% and 24%, respectively. The promoted potential of medium-yield cropland productivity was 2.44 times of that of low-yield cropland.

5 Discussion

Cropland is classified into seven grades according to cropland quality in the “Distribution of medium- and low-yield cropland and the potential of grain productivity in China (1988).” The seven grades are aggregated into high-, medium-, and low-yield cropland. The areas of high-, medium-, and low-yield cropland account for 32.16%, 32.90%, and 34.94% of the national cropland area, respectively (Lin, 2008). According to the “Cropland resources and their development and utilization in China (1992),” based on the average yield method (Agricultural Natural Resources and Agricultural Regional Planning Institute of Chinese Academy of Agricultural Sciences, 1992; Lin, 2008), the proportional areas of high-, medium-, and low-yield cropland are 21.54%, 37.24%, and 41.22%, respectively. Based on the potential productivity method, the area of high-, medium-, and low-yield cropland accounted for approximately 34.92%, 41.95%, and 23.14%, respectively. The proportional area of high-, medium-, and low-yield cropland obtained in this study were similar to those of “Cropland resources and their development and utilization in China.” However, the proportional area of high-yield cropland was lower than that of the other two methods. The results of each method have the ability to reflect the regional patterns of cropland quality. However, the difference between the previous studies and our study is that, county scale is the smallest spatial unit that can be identified in the previous studies, while a grid detail of 500 m resolution can be identified in this study.
Faced with limited arable land resources, improving the efficiency of cropland utilization is the only choice for the sustainable development of agriculture and national food security. The detailed spatial patterns of high-, medium-, and low-yield cropland are the basis for a comprehensive improvement of cropland. The notable development of remote sensing technology and ecosystem productivity models made it possible to identify high-, medium-, and low-yield cropland. Remote sensing-based ecosystem productivity models can estimate the spatial patterns of cropland NPP at the grid level and therefore largely improve the spatial precision of high-, medium-, and low-yield cropland distribution relative to traditional county statistics data-based methods. Moreover, remote sensing information can reflect the comprehensive effects of natural conditions and management on crop growth. Based on the cropping system zones of China, high-, medium-, and low-yield cropland are classified under different natural and socio-economic conditions, so cropland quality can be identified region-by-region, rather than classified by a nationwide standard. In this study, cropland productivity was calculated based on 500-m MODIS datasets. To eliminate the effect of mixed pixels on the classification criteria of high-, medium-, and low-yield cropland, the NPP values of pixels with a cropland area proportion of not less than 50% were used in each agricultural region, and cropland was the major land use type. However, this method is not effective to reduce the uncertainty in those pixels with low proportional areas of cropland. Therefore, productivity data at higher spatial resolutions is required for a more accurate planning of medium- and low-yield cropland improvement.

The authors have declared that no competing interests exist.

[1]
Agricultural Natural Resources and Agricultural Regional Planning Institute of Chinese Academy of Agricultural Sciences, National Soil and Fertilizer Station, 1992. Chinese Arable Land Resources and Its Exploitation. Beijing: Surveying and Mapping Press. (in Chinese)

[2]
Albrizio R, Steduto P, 2003. Photosynthesis, respiration and conservative carbon use efficiency of four field grown crops. Agricultural and Forest Meteorology, 116(1): 19-36.The present work aims at testing the hypothesis that carbon use efficiency (CUE) of sunflower, grain sorghum, wheat and chickpea crops, having different photosynthetic pathways (C 3 , C 4 ) and yield composition (carbohydrates, proteins, lipids), will hold constant over the natural thermal regime occurring during the entire crop cycle in the open field. All crops were well watered. Sunflower and sorghum had two treatments of nitrogen application, while wheat had only one suitable level of nitrogen, and chickpea had no nitrogen at all. Canopy temperature, day-time net photosynthesis ( P ), and night-time respiration ( R ) were monitored by closed-system canopy chambers, properly automated for continuous measurements. Night-time respiration response to temperature and noon-time photosynthesis were measured at leaf scale, as well. Results showed a strictly linear relationship (i.e. constant CUE) between cumulative P (∑ P ) and cumulative R (∑ R ) over the entire cycle of sorghum (slope=2.28) and wheat (3.35), and up to anthesis of sunflower (2.08) and chickpea (2.83), irrespective of the thermal regimes evolution and nitrogen nutritional levels. The same linearity was maintained when relationships were observed in terms of biomass versus ∑ R . In sunflower, significant deviation from linearity is observed after anthesis, with a difference between the two nitrogen treatments. No conclusions could be drawn for post-anthesis chickpea due to the interruption of the experiment caused by an intense thunderstorm. Leaf-scale respiration responses to temperature were insufficient to explain the corresponding behaviour at canopy-level.

DOI

[3]
Ball J T, 1996. Sensitivity of leaf photosynthesis to CO2 concentration is an invariant function for C3 plants: A test with experimental data and global applications. Global Biogeochemical Cycles, 10(2): 209-222.ABSTRACT The mutational response index and measurements of codon bias were determined in eight potential open reading frames in a Frankia operon that encodes genes for nitrogen fixation. The functionality of the different open reading frames is assessed in light of these results and compared with previously published results, as is the applicability of these techniques to the assessment of translational function of putative open reading frames.Key words: Frankia, codon usage, codon bias, open reading frames, mutation pressure.

DOI

[4]
Cheng W X, Sims D A, Luo Yet al., 2000. Photosynthesis, respiration, and net primary production of sunflower stands in ambient and elevated atmospheric CO2 concentrations. Global Change Biology, 6(8): 931-941.The effect of elevated CO2 on photosynthesis, respiration, and growth efficiency of sunflower plants at the whole-stand level was investigated using a whole-system gas exchange facility (the EcoCELLs at the Desert Research Institute) and a 13C natural tracer method. Total daily photosynthesis (GPP), net primary production (NPP), and respiration under the elevated CO2 treatment were consistently...

DOI

[5]
Foley J A, DeFries R, Asner G Pet al., 2005. Global consequences of land use. Science, 309(5734): 570-574.Land use has generally been considered a local environmental issue, but it is becoming a force of global importance. Worldwide changes to forests, farmlands, waterways, and air are being driven by the need to provide food, fiber, water, and shelter to more than six billion people. Global croplands, pastures, plantations, and urban areas have expanded in recent decades, accompanied by large increases in energy, water, and fertilizer consumption, along with considerable losses of biodiversity. Such changes in land use have enabled humans to appropriate an increasing share of the planet's resources, but they also potentially undermine the capacity of ecosystems to sustain food production, maintain freshwater and forest resources, regulate climate and air quality, and ameliorate infectious diseases. We face the challenge of managing trade-offs between immediate human needs and maintaining the capacity of the biosphere to provide goods and services in the long term.

DOI PMID

[6]
Foley J A, Ramankutty N, Brauman K Aet al., 2011. Solutions for a cultivated planet. Nature, 478(7369): 337-342.Increasing population and consumption are placing unprecedented demands on agriculture and natural resources. Today, approximately a billion people are chronically malnourished while our agricultural systems are concurrently degrading land, water, biodiversity and climate on a global scale. To meet the world's future food security and sustainability needs, food production must grow substantially while, at the same time, agriculture's environmental footprint must shrink dramatically. Here we analyse solutions to this dilemma, showing that tremendous progress could be made by halting agricultural expansion, closing 'yield gaps' on underperforming lands, increasing cropping efficiency, shifting diets and reducing waste. Together, these strategies could double food production while greatly reducing the environmental impacts of agriculture.

DOI PMID

[7]
Gifford R M, 1995. Whole plant respiration and photosynthesis of wheat under increased CO2 concentration and temperature: Long-term vs. short-term distinctions for modelling. Global Change Biology, 1(6): 385-396.Short- and long-term effects of elevated CO 2 concentration and temperature on whole plant respiratory relationships are examined for wheat grown at four constant temperatures and at two CO 2 concentrations. Whole plant CO 2 exchange was measured on a 24 h basis and measurement conditions varied both to observe short-term effects and to determine the growth respiration coefficient (r g ), dry weight maintenance coefficient (r m ), basal (i.e. dark acclimated) respiration coefficient (r g ), and 24 h respiration:photosynthesis ratio (R:P). There was no response of r g to short-term variation in CO2 concentration. For plants with adequate N supply, r g was unaffected by the growth-CO 2 despite a 10% reduction in the plant's N concentration (%N). However, r m was decreased 13%, and r b was decreased 20% by growth in elevated CO 2 concentration relative to ambient. Nevertheless, R:P was not affected by growth in elevated CO 2 . Whole plant respiration responded to short-term variation of &plusmn; 5 &deg;C around the growth temperature with low sensitivity (Q 10 = 1.8 at 15 &deg;C, 1.3 at 30 &deg;C). The shape of the response of whole plant respiration to growth temperature was different from that of the short term response, being a slanted S-shape declining between 25 and 30 &deg;C. While r m , increased, r g decreased when growth temperature increased between 15 and 20 &deg;C. Above 20 &deg;C r m became temperature insensitive while r g increased with growth temperature. Despite these complex component responses, R:P increased only from 0.40 to 0.43 between 15&deg; and 30 &deg;C growth temperatures. Giving the plants a step increase in temperature caused a transient increase in R:P which recovered to the pre-transient value in 3 days. It is concluded that use of a constant R:P with respect to average temperature and CO 2 concentration may be a more simple and accurate way to model the responses of wheat crop respiration to &lsquo;climate change&rsquo; than the more complex and mechanistically dubious functional analysis into growth and maintenance components.

DOI

[8]
Huang M, Ji J J, Peng L L, 2008. The response of vegetation net primary productivity to climate change during 1981-2000 in the Tibetan Plateau. Climatic and Environmental Research, 13(5): 608-617. (in Chinese)Based on the 0.1°×0.1° resolution map of vegetation type,soil texture and meteorological data,the atmosphere-vegetation interaction model(AVIM2) was used to simulate the response of net primary productivity(NPP) to climate change in the Tibetan Plateau.The results show that the vegetation NPP increased during the past 20 years in the Tibetan Plateau owe to the combination effects of the temperature and precipitation change.The changes of annual mean temperature and annual precipitation were positively correlated with the change of NPP during the last 20 years.The influence of precipitation change to forests and grassland NPP were higher than that of temperature,whereas the effects of precipitation to shrubs were lower than that of temperature.The total NPP for shrub and forest increased 1.14% and 0.88% per year,individually.There increasing trend reach the statistically significant level.The increasing trend for grassland NPP was gentler than that for forests and shrubs.On the whole study region,the average annual mean temperature increased 0.058 ℃ per year,annual precipitation increased and the total vegetation NPP increased during 1981—2000.

[9]
Kalfas J L, Xiao X, Vanegas D Xet al., 2011. Modeling gross primary production of irrigated and rain-fed maize using MODIS imagery and CO2 flux tower data. Agricultural and Forest Meteorology, 151(12): 1514-1528.Information on gross primary production (GPP) of maize croplands is needed for assessing and monitoring maize crop conditions and the carbon cycle. A number of studies have used the eddy covariance technique to measure net ecosystem exchange (NEE) of CO2 between maize cropland fields and the atmosphere and partitioned NEE data to estimate seasonal dynamics and interannual variation of GPP in ma...

DOI

[10]
Li F L, Li B X, Cao W X, 2005. Status and prospect of crop-yield assess by remote sensing. Journal of Yunnan Agricultural University, 5(20): 680-684. (in Chinese)The application status of crop-yield assess by remote sensing is reviewed.4 aspects are prospected of technique-integration,facility service,data processing, agro-standardization,agronomy-mechanism,widening consumer.

[11]
Lin P S, 2008. Study on the distribution and possible production increase of medium and low-yield farmland in China. Beijing: Chinese Academy of Agricultural Sciences. (in Chinese)

[12]
Liu X H, Yang Q k, Tang G A, 2001. Extraction and application of relief of China based on DEM and GIS method. Bulletin of Soil and Water Conservation, 21(1): 57-62.Based on micro scale DEM datum, optimum size of analysis windows of relief, which is 5 km脳5 km, is defined by means of windows analysis and sample statistical method. Relief in soil erosion of China has been extracted using ARC/INFO software and mapped using Arcview. Applicability of relief was analyzed and initially application of relief factor in assessment of Chinese potential soil and water loss is studied.

[13]
Shi Q H, Wang H, Chen Fet al., 2010. The spatial-temporal distribution characteristics and yield potential of medium-low yielded farmland in China. Chinese Agricultural Science Bulletin, 26(19): 369-373. (in Chinese)Improving medium-low yielded farmland is one of the most important ways to realize total arable land equilibrium and protect food security of China. In this study, we use the national agricultural sub-county data and the second national soil survey data to investigate the type, spatial-temporal distribution characteristics and yield potential of medium-low yielded farmland in China. The results showed that the farmland quality had increased gradually from 1985 to 2008. Low-yield farmland ' proportion had decreased form 50.01% to 28.61%; the proportion of medium-yield farmland ' s had increased from 24.86% to 37.91%; high-yield farmland ' proportion had increased from 25.13% to 33.48% . The main distribution areas of medium-low yielded farmland are northeast China, north China and the lower-middle reaches of Yangtze River. The main types were barren land, arid land, sloping land, water logging paddy land, water logging dry land, saline-alkali land, aeolian sandy land and so on. We also calculated the production potential and proposed the technical countermeasures, future research direction and policy recommendations to improve the medium-low yielded farmland.

[14]
Tilman D, Balzer C, Hill Jet al., 2011. Global food demand and the sustainable intensification of agriculture. Proceedings of the National Academy of Sciences, 108(50): 20260-20264.Global food demand is increasing rapidly, as are the environmental impacts of agricultural expansion. Here, we project global demand for crop production in 2050 and evaluate the environmental impacts of alternative ways that this demand might be met. We find that per capita demand for crops, when measured as caloric or protein content of all crops combined, has been a similarly increasing function of per capita real income since 1960. This relationship forecasts a 100–110% increase in global crop demand from 2005 to 2050. Quantitative assessments show that the environmental impacts of meeting this demand depend on how global agriculture expands. If current trends of greater agricultural intensification in richer nations and greater land clearing (extensification) in poorer nations were to continue, 651 billion ha of land would be cleared globally by 2050, with CO-C equivalent greenhouse gas emissions reaching 653 Gt yand N use 65250 Mt yby then. In contrast, if 2050 crop demand was met by moderate intensification focused on existing croplands of underyielding nations, adaptation and transfer of high-yielding technologies to these croplands, and global technological improvements, our analyses forecast land clearing of only 650.2 billion ha, greenhouse gas emissions of 651 Gt y, and global N use of 65225 Mt y. Efficient management practices could substantially lower nitrogen use. Attainment of high yields on existing croplands of underyielding nations is of great importance if global crop demand is to be met with minimal environmental impacts.

DOI PMID

[15]
Wang Y, Huang M, Wang X G, 2010. Impacts of land use and climate change on agricultural productivity in Shanghai. Acta Scientiae Circumstantiae, 30(3): 641-648. (in Chinese)The impacts of land use and climate change on the agricultural productivity of Shanghai were studied by using simulated cropland net primary productivity(NPP) data from 1961 to 2006.The data were based on the Atmosphere-Vegetation Interaction Model(AVIM2),and Landsat TM satellite images from 1987,1997 and 2004.The results indicated that the annual agricultural NPP,driven by climate change,increased 64.37 g·m -2·a -1 with a growth rate of 1.43g·m-2·a-1 during 1961~2006.Both annual mean temperature and precipitation had significant positive correlations with cropland NPP.For cropland area,its proportion of the total area of Shanghai decreased from 76% in 1987 to 43% in 2004.Considering both land use and climate change factors,the total NPP of the early 21st century decreased by 42% compared with that of the 1980s.However,the land use change had greater impact than climate change on total cropland NPP in Shanghai.From the 1980s to the 1990s,the decrease of land use contributed 78% to the change of total NPP,and it increased to 92% from the 1990s in the early period of 21st century.

DOI

[16]
Wang Z, Xiao X M, Yan X D, 2010. Modeling gross primary production of maize cropland and degraded grassland in northeastern China. Agricultural and Forest Meteorology, 150(9): 1160-1167.Measurements from individual CO60 eddy flux sites provide valuable information on the seasonal dynamics of gross primary production (). In this study, we estimated seasonal dynamics of from 3 years (2004-2006) of the eddy covariance observations at cropland and degraded grassland in a semi-arid area of Tongyu county (44.5667°N, 122.8833°E), Northeast China. The biophysical performance of vegetation indices (, NDVI, and LSWI) derived from the 8-day Moderate Resolution Imaging Spectroradiometer (MODIS) surface reflectance product and their relations to dynamics were evaluated. The quantitative relationships between the vegetation indices and CO60 flux data clearly demonstrated the improvement of over NDVI, in terms of the phase and magnitude of . Canopy-level maximum light use efficiency, 07 68, was estimated for both and grassland by using the observed CO60 flux data and Photosynthetically Active Radiation (PAR) data from eddy flux tower sites. For cropland, the 07 68 value was 0.56gC/mol PAR, and for degraded grassland, the 07 68 value was 0.37gC/mol PAR. We conducted a simulation of the Vegetation Model (VPM) using the Enhanced Vegetation Index () and the Land Surface Index (LSWI) derived from the 8-day (MODIS) surface reflectance product, as well as site-specific climate data. The comparison between simulated and estimated from tower CO60 flux data showed good agreement in both cropland and degraded grassland. This study highlighted the biophysical performance of improved vegetation indices in relation to and demonstrated the potential of the satellite-driven VPM model for scaling-up of of cropland and grassland in semi-arid ecosystems.

DOI

[17]
Wu B F, Du X, Meng J Het al., 2009. A remote sensing method to classify high, medium and low yield cropland and its application in Huang-Huai-Hai Basin. Modern Agricultural Development and National Food Security & Huang-Huai-Hai Modern Agricultural Development Strategy Forum Proceedings, 104-108. (in Chinese)

[18]
Xiao X M, Hollinger D, Aber Jet al., 2004. Satellite-based modeling of gross primary production in an evergreen needleleaf forest. Remote Sensing of Environment, 89(4): 519-534.The eddy covariance technique provides valuable information on net ecosystem exchange (NEE) of CO 2 , between the atmosphere and terrestrial ecosystems, ecosystem respiration, and gross primary production (GPP) at a variety of CO 2 eddy flux tower sites. In this paper, we develop a new, satellite-based Vegetation Photosynthesis Model (VPM) to estimate the seasonal dynamics and interannual variation of GPP of evergreen needleleaf forests. The VPM model uses two improved vegetation indices (Enhanced Vegetation Index (EVI), Land Surface Water Index (LSWI)). We used multi-year (1998–2001) images from the VEGETATION sensor onboard the SPOT-4 satellite and CO 2 flux data from a CO 2 eddy flux tower site in Howland, Maine, USA. The seasonal dynamics of GPP predicted by the VPM model agreed well with observed GPP in 1998–2001 at the Howland Forest. These results demonstrate the potential of the satellite-driven VPM model for scaling-up GPP of forests at the CO 2 flux tower sites, a key component for the study of the carbon cycle at regional and global scales.

DOI

[19]
Yan H M, Fu Y L, Xiao X Met al., 2009. Modeling gross primary productivity for winter wheat-maize double cropping system using MODIS time series and CO2 eddy flux tower data. Agriculture, Ecosystems & Environment, 129(4): 391-400.Accurate and spatially explicit monitoring of gross primary productivity of agricultural ecosystems at a large scale is of great significance to assessment of crop conditions and agricultural production, and is necessary for understanding the carbon balance of the terrestrial biosphere. Identifying crop intensity (including multiple cropping and crop calendar) dynamics and assigning appropriate light use efficiency to C3 and C4 crops could substantially improve our ability to model and evaluate the seasonal dynamics of carbon flux in intensified agricultural ecosystems. In this paper, we have analyzed temporal dynamics of vegetation indices and phenological characteristics in the winter-wheat and maize double cropping system using multi-year satellite images from the moderate resolution imaging spectral radiometer (MODIS) and in situ observation of key crop phenological transition dates. The multiple cropping and crop calendar information were incorporated into simulations of the satellite-based vegetation photosynthesis model (VPM). Canopy-level maximum light use efficiency, a key parameter in the satellite-based VPM model, was estimated for both winter wheat (C3) and maize (C4) based on the observed CO 2 flux data from an eddy flux tower site in a winter wheat-maize double cropping agro-ecosystem in the Huang-Huai-Hai plain, China. The seasonal dynamics of GPP predicted by the VPM model agreed well with estimated GPP from eddy flux tower data. These results demonstrate the potential of the satellite-driven VPM model for scaling-up GPP estimation of intensified agricultural ecosystems, which is relevant to food production and security.

DOI

[20]
Yan H M, Liu J Y, Huang H Q et al., 2012. Impacts of cropland transformation on agricultural production under urbanization and Grain for Green Project in China. Acta Geographica Sinica, 2012, 67(5): 579-588. (in Chinese)In this study, the changes of agricultural production from cropland transformation in the periods of the late 1980s-2000 and 2000-2005 were estimated based on: 1) the cropland transformation results derived from Landsat TM imagery by artificial interpretation method, and 2) net primary productivity (NPP) data from the light use efficiency models of Global Production Efficiency Model (GloPEM) and Vegetation Photosynthesis Model (VPM). Changes of regional grain production capacity were mainly from two aspects of cropland transformation: cropland conversion (e.g. urbanization, converting cropland into forest) and land reclamation (e.g. converting grassland into cropland). The impacts of different cropland transformation types on agricultural production within the two periods were evaluated, a series of comparisons were conducted between the two periods as well as different regions. Results indicated that the agricultural production loss due to urban sprawl accounted for more than 60% during both stages (1980s-2000 and 2000-2005) in the total loss. In the first stage, generally, agricultural production increased evidently. The increased production from land reclamation was 87% higher than production decrease from cropland conversion. However, in the second stage (2000-2005) the agricultural production loss due to cropland conversion was 31% higher than the production increase from land reclamation, in other words, the production decrease due to cropland loss could not be compensated by limited land reclamation, as unban expansion and Grain for Green (GFG) project played an important role in cropland transformation since around 2000. Production losses from GFG project and urbanization were 57 % and 85 % higher than that in the previous stage, respectively. Due to GFG project, the states of agricultural production equilibrium changed from positive balance from the 1980s to 2000 into a negative balance during 2000-2005. the loss of agricultural production mainly occurred in Northeast China, Inner Mongolia, Yunnan and Zhejiang provinces from the 1980s to 2000, and then transferred to Inner Mongolia, Shaanxi, Gansu, Sichuan and Guizhou provinces from 2000 to 2005. The production loss due to urbanization mainly occurred in Jiangsu, Hebei, Anhui, Shandong, Henan and Guangdong provinces from the 1980s to 2000, then changed into provinces of Zhejiang, Guangdong, Shandong, Fujian and Jiangsu during 2000-2005. The land reclamation foci transferred from Northeast China to Northwest China in the two stages, the greatest contribution regions to agricultural production shifted from the Xinjiang Uygur Autonomous Region from the 1980s to 2000 into Heilongjiang Province during 2000-2005. Due to the cropland transformation from urbanization and GFG project, two thirds of provinces showed a significant change in agricultural production balance state in the two stages.

[21]
Zhang L, Zhang F G, Jiang G Het al., 2005. Potential improvement of medium low yielded farmland and guarantee of food safety in China. Research of Agricultural Modernization, 26(1): 22-25. (in Chinese)Firstly,this paper analyzed the changes of the food productive capacity in two aspects in China:the total output of grain and the yield per unit of area. Then according to the differences between the input and output of the mediumlow yielded farmland and the high one, it advanced that reforming the mediumlow yielded farmland to enhance the productive capacity of cultivated land is an important way to guarantee food safety, also it has great significance on preventing farmland degradation as well as the environment protection.

[22]
Zhang W, Li A N, 2012. Study on the optimal scale for calculating the relief amplitude in China based on DEM. Geography and Geo-Information Science, 28(4): 8-12. (in Chinese)On the base of SRTM and ASTER DEM data,13 experimental areas across China are selected.Through computing the "change point" of average relief amplitude curve with the gradient scale,the optimal calculation scale of relief amplitude in China is acquired.Based on the previous work,the mountain area of every experimental area can be calculated with mountain definition standard.Then,the calculation results are tested by the way of manual interpretation mountain range.The result show that,firstly,relationship exits between the optimal calculation scale of relief amplitude and DEM data,the DEM data scale greater,the optimal calculation scale of relief amplitude greater;secondly,relationship exits between the optimal calculation scale of relief amplitude and landscape;thirdly,for the SRTM and ASTER DEM,selecting 4.72 km2 and 3.20 km2 as the optimal calculation scale of relief amplitude is reasonable and testing accuracy is greater than 90%.The study provides a feasible method and reference for calculating the optimal calculation scale of relief amplitude and determining the range of mountain in China.

DOI

Outlines

/