Orginal Article

The climatic impacts of land use and land cover change compared among countries

  • LIU Jiyuan , 1 ,
  • SHAO Quanqin 1 ,
  • YAN Xiaodong 2 ,
  • FAN Jiangwen 1 ,
  • ZHAN Jinyan 2 ,
  • DENG Xiangzheng 1 ,
  • KUANG Wenhui 1 ,
  • *HUANG Lin , 1
Expand
  • 1. Key Laboratory of Land Surface Pattern and Simulation, Institute of Geographic Sciences and Natural Resources Research, CAS, Beijing 100101, China
  • 2. Beijing Normal University, Beijing 100875, China

Author: Liu Jiyuan (1947-), Professor, specialized in remote sensing of natural resources and environment, land use and land cover change and ecological effects at macro-scale. E-mail:

*Corresponding author: Huang Lin (1981-), Associate Professor, specialized in the climatic/ecological effects of land use and land cover change. E-mail:

Received date: 2015-12-01

  Accepted date: 2016-03-18

  Online published: 2016-07-25

Supported by

National Natural Science Foundation of China, No.41371409, No.41371019

Global Change Scientific Research Program of China, No.2010CB950900

Copyright

Journal of Geographical Sciences, All Rights Reserved

Abstract

Land use and land cover change (LULCC) strongly influence regional and global climate by combining both biochemical and biophysical processes. However, the biophysical process was often ignored, which may offset the biogeochemical effects, so measures to address climate change could not reach the target. Thus, the biophysical influence of LULCC is critical for understanding observed climate changes in the past and potential scenarios in the future. Therefore, it is necessary to identify the mechanisms and effects of large-scale LULCC on climate change through changing the underlying surface, and thus the energy balance. The key scientific issues on understanding the impacts of human activities on global climate that must be addressed including: (1) what are the basic scientific facts of spatial and temporal variations of LULCC in China and comparative countries? (2) How to understand the coupling driving mechanisms of human activities and climate change on the LULCC and then to forecasting the future scenarios? (3) What are the scientific mechanisms of LULCC impacts on biophysical processes of land surface, and then the climate? (4) How to estimate the contributions of LULCC to climate change by affecting biophysical processes of land surface? By international comparison, the impacts of LULCC on climate change at the local, regional and global scales were revealed and evaluated. It can provide theoretical basis for the global change, and have great significance to mitigate and adapt to global climate changes.

Cite this article

LIU Jiyuan , SHAO Quanqin , YAN Xiaodong , FAN Jiangwen , ZHAN Jinyan , DENG Xiangzheng , KUANG Wenhui , *HUANG Lin . The climatic impacts of land use and land cover change compared among countries[J]. Journal of Geographical Sciences, 2016 , 26(7) : 889 -903 . DOI: 10.1007/s11442-016-1305-0

1 Introduction

The impacts of human activities on global climate change are mainly attributed to greenhouse gases, aerosols, and land use activities (IPCC, 2014). Currently, the process to solve global warming is a serious challenge facing the international community, and the core concern of the intergovernmental negotiations on climate change and “mitigation” is reducing the greenhouse gases and increasing the sinks (Le Quéré et al., 2014). Although many studies of climate change considered that greenhouse gas emissions is the main causes for climate change, and ignored the impacts of land use change on climate through changes in land surface biophysical processes, which may overestimate the role of carbon emissions and neglected the scientific regulation of human behaviors on land use (Marland et al., 2003; Gibbard et al., 2005; Paeth et al., 2009).
Land use and land cover change (LULCC) underwent rapid variations at different spatial and temporal scales. It impacts the climate system significantly by changing the land cover violently at different scales (Feddema et al., 2005; Mahmood et al., 2014), and thus becoming one of the important human activities to influence the climate change (GLP, 2005; IPCC, 2007; Foley et al., 2005; Pielke et al., 2011). LULCC strongly influence regional climate through both biogeochemical and biophysical processes (Pielke et al., 2002; Houghton and Hackler, 2003; Feddema et al., 2005; Chapin et al., 2008; Diffenbaugh et al., 2009). Its impacts are mainly manifested in the two key processes of the radiation/energy exchanges between atmosphere and land surface, and the carbon adjustment.
On the one hand, LULCC impacts the climate system by change the carbon cycles through the emissions or absorptions on the atmospheric greenhouse gases (Pielke et al., 2002; Ramankutty et al., 2007). On the other hand, LULCC results in the varied surface albedo and roughness, and the urban expansion leads to the enhancement of heat island effect, which then affects the surface heat budget and vertical transport of water vapor, and the changes of temperature, humidity, wind speed, evapotranspiration, etc. (Paeth et al., 2009), by a series of biophysical processes to impact the climate change. LULCC alter the surface patterns of sensible and latent heat into the atmosphere (Mahmood et al., 2010), whether warming or cooling effects of LULCC depends on factors like temperature, precipitation, soil water content, and surface reflectivity (Betts, 2011), and more or less warming or cooling depends on the local background climate (Pitman et al., 2011). Therefore, consideration of the biophysical processes would shift the relative values of some ecoregions, and sometimes even reversing (Betts, 2000; Anderson-Teixeira et al., 2012).
However, the existing global LULCC datasets showed lower precision and lack of dynamic changes. Available dynamic models of LULCC have been mostly driven by human activities or climate, but failed to coupling the two factors. The insufficient ability to obtain critical surface parameters resulted in the lack of the knowledges on the influences of LULCC on the spatial and temporal variations of land-atmosphere energy exchange through the radiation energy balance and land surface roughness. Climate model simulations embedded dynamic LULCC is less, and therefore the feasibility to mitigate the climate warming by LULCC has not been fully demonstrated. The key questions need to be addressed including: (1) what are the basic scientific facts of spatial and temporal variations of LULCC in China and comparative countries? (2) How to understand the coupling driving mechanisms of human activities and climate change on the LULCC and then to forecasting the future scenarios? (3) What are the scientific mechanisms of LULCC impacts on biophysical processes of land surface, and then the climate? (4) How to estimate the contributions of LULCC to climate change by affecting biophysical processes of land surface?
Therefore, it is necessary to identify the mechanisms and effects of large-scale LULCC on climate change through changing the underlying surface, and impacting the water and heat distribution patterns and thus the energy balance, and to achieve the quantitative analysis on the climate impact of large-scale LULCC process, which are the key scientific issues on understanding the impacts of human activities on global climate that must be addressed. By international comparison, the climatic impacts of LULCC at the country scale could be revealed and evaluated, which can not only provide scientific theories for the study of global change and earth system models, but is also significant to mitigate and adapt to global climate changes by the scientific regulation of human land use.

2 Methods on the climatic impacts of LULCC

The impacts of land use and land cover change on global climate primarily applied the satellite and ground integration methods coupled LULCC, climate and ecosystem, which focus on multi-scale LULCC process and its climatic effects, to build series of database with mutual evaluation between earth observation from space and ground stations network. And then a relatively completed system with simulation, prediction and validation of land system and surface atmosphere could be developed.
Existing datasets of LULCC, long-term ecosystem flux observation, meteorological observation, model simulation, remote sensing retrieval, transect survey and forest inventory etc. were collected. The classification information on the second-level land cover types and LULCC were extracted based on Landsat images and MODIS/AVHRR data, especially for those typical types of agriculture and cropland abandoned, deforestation and afforestation, grassland degradation and restoration, urbanization. Then the dynamic patterns and driving factors of LULCC were analyzed.
The impacts of land use change on land surface radiation energy balance and hydrothermal exchange were observed comparatively by establishing new flux equipment around existing flux observation stations. The spatial and temporal data of evapotranspiration and land surface biophysical parameters (albedo, roughness, net radiation, etc.) were retrieved. Then the biophysical effects of land use change and its mechanisms were analyzed.
Bayesian ensemble approach integrated multi-model of regional integrated environmental model system (RIEMS), weather research and forecasting model (WRF) and regional climate model (RegCM3) were applied to simulate the impacts of LULCC on climate in China and other comparative countries.
Scientific research platform to simulate the impacts of large-scale land use change on climate were developed, which consists of LULCC dynamic models coupled natural and human factors, climate model, and land surface model. In support of remote sensing retrieval and field observation, the climatic effects of large-scale land use change were simulated.
The past, current and future LULCC patterns and their driving mechanisms in different spatial scales of typical region or country, and global range were analyzed comprehensively. The impacts of LULCC on the climate regulation services of ecosystem through hydrothermal exchange and then on climate were discussed.
Finally, the countermeasures and consulting researches could be suggested on regulation of human land use change, climate adaptation and mitigation, strategies and recommendations for environmental diplomacy.

3 Spatial and temporal patterns of LULCC in different countries

Based on the China’s 1:100,000-scale land use and land cover change datasets (Liu et al., 2003a; Liu et al., 2003b; Liu et al., 2010) in the late 1970s, the late 1980s, 1995, 2000 and 2005, LULCC dataset for 2010 was constructed by the human-computer interactive interpretation method based on the 2010 Landsat TM images covering China (Zhang et al., 2012). At the same time, a standardized LULCC data of comparative countries were made, and the LULCC data in the 1950s, 1970s and 2005 of the United States of America (USA), LULCC data of the Brazil, India, Mongolia, Russia, and the five Central Asian countries (Kazakhstan, Turkmenistan, Kyrgyzstan, Uzbekistan, Tajikistan) in 1970s and 2005 were produced.
The spatial and temporal characteristics of LULCC and its driving causes in the past 20 years at a national scale were investigated by Liu et al. (2014). It is shown that LULCC across China presented large variations in the spatial and temporal patterns in the last 30 years. The total area of cropland was nearly constant, although it decreased in southern regions and increased in northern regions. And the cropland reclamation expanded in northern regions showed a shift from the northeast part to the northwest. The rapid expansion trend of built-up lands in eastern China was spread gradually out to the central and western regions. Woodland area was decreased in the former 10 years, and then increased in the latter 10 years. The desert area was increased before 2000 and decreased after 2000. Grassland area showed a continuous decrease in the 20 years. The main anthropogenic driving factors of land use change patterns in the first decade of the 21st century shifted from land development to both land development and environment conservation.
The dynamic patterns of LULCC in comparative countries were analyzed. From the 1950s to 1970s, urbanization in Eastern USA, agriculture on grassland in Central and Western USA were primary land use change types. From the 1970s to 2005, the continued urbanization presented obvious regional differences. According to comparative analysis on the patterns and rates of urban expansion in China and the USA, Kuang et al. (2014) found that the expansion area of impervious surface in three megacities of China showed five times larger than that in USA. From the viewpoint of expansion patterns, impervious surface in China’s megacities expanded abruptly outward from the urban center in a cyclic structure, however, impervious surface in USA’s megacities expanded constantly and smoothly in the inner cities with patch patterns.
In Brazil, the main characteristics in the past 30 years showed the increasing cropland and urbans, and decreasing forest and grassland. The area of LULCC reached 7.943×10⁵ km2, accounting for 9.33% of the total land area in Brazil. According to Lu et al. (2014) and Du et al. (2015), the direct driving forces for the LULCC presented as climate change, land use policy, population growth and migration, etc. which are all the same factors in the developing countries.
From the 1970s to 2005 in India, the areas of cropland, urban and waters showed the largest changes, with cropland and forest decreasing by 3.69×10⁴ km2 and 0.46×10⁴ km2, water and urban areas increased by 4.05×10⁴ km2 and 0.86×10⁴ km2, respectively. In the five countries of Central Asia, urban areas in all countries increased in the past 30 years, cropland was decreased in Kazakhstan but increased in other four, water areas decreased in Uzbekistan and Tajikistan but increased in other three.
It is crucial to reconstruct the historical land cover change to assess the human impacts on the climate. Representative global historical land use datasets of HYDE (History Database of the Global Environment) and SAGE were developed by the Center for Sustainability and the Global Environment (SAGE) in University of Wisconsin-Madison and the Netherlands Environmental Assessment Agency. However, due to the differences in reconstruction methods, input data, and model assumptions, we can see large discrepancies and biases of those datasets, especially in China. Based on historical cropland areas, population numbers and the land suitable for agriculture, He et al. (2013c) and Li et al. (2015) produced a provincial cropland dataset of China from 1661 to 1996, and then allocated it into 10 km×10 km grid cells. The cropland increased from about 55.5×10⁴ km2 in 1661 to 130.0×10⁴ km2 in 1996. To capture the spatial distribution of cropland, land cover maps in 2000 detected from satellite were applied.
In addition, historical forest and cropland cover of China, the USA, India and Brazil in the past 300 years were reconstructed by integrated applying SAGE, HYDE and LULCC datasets in recent decades. The land development process in the past 300 years has obvious differences compared among China, USA, Brazil and India. In one hundred years from the early 18th century to the 20th century, cropland area in USA increased significantly following the implementation of development policy in western and central regions. The large-scale land development was contained till the 1930s. Since 1887, Brazil’s cropland began to grow rapidly, and large-scale land development activities expanded to the eastern and southern regions. As two ancient civilizations, China and India both has a long history of agricultural development and earlier cropland expansion. In recent 300 years, cropland area showed a sustained growing trend driven by the pressure of population.
The scenarios of land use patterns of China and comparative countries were analyzed by dynamics model of LULCC. Xu et al. (2013) designed three scenarios of baseline, economic development and ecological conservation based on socio-economic development, and explored the possible trends of China’s land use change according to the three scenarios with different parameters by applying the Agriculture-Land-Use module and Edmonds-Reilly- Barnes module of global change assessment model (GCAM model). Three future scenarios of global terrestrial ecosystems during the periods of 2010-2039, 2040-2069 and 2070-2099 were developed by Yue et al. (2011), based on a high accuracy and speed method (HASM) of surface modelling. Applying observed temperature data of 2766 weather stations scattered over the world, the regression formulations among temperature, elevation and latitude are simulated. And then the mean annual bio-temperature, mean annual precipitation and potential evapotranspiration ratio were simulated by HASM.

4 The impacts of LULCC on climate

4.1 Integrated climatic impacts of LULCC

The impacts of typical LULCC on land surface temperature were analyzed by applying meteorological observation data and remote sensing images. Meteorological observations are influenced by surrounding land cover types. Based on LULCC datasets from the late 1980s to 2005, NCEP/DOE AMIP-2 reanalysis datasets, and observed temperature data of 136 meteorological stations, Gong et al. (2012) summarized the impacts of land cover types on climate warming, and showed that the changing trends of annual mean, maximum and minimum air temperatures are most significant in built-up areas, moderate in cropland area, and less significant in forest area in southern China. Forest plays a cooling effect on temperature, while built-up land and cropland have warming effect.
The land use change impacts on land surface radiation energy balance were analyzed mainly based on high spatial and temporal resolution remote sensing retrieved products, to reveal the driving mechanisms of LULCC on land surface albedo change, and then the biophysical mechanisms of LULCC on affecting regional climate change. Zhai et al. (2014) showed that the average radiative forcing of LULCC was 0.062 W/m2 during 1990-2010 in China, and the huge spatial heterogeneity of LULCC radiative forcing indicated warming effects on climate system.
Land surface models were applied to investigate the impact phenomenon and mechanisms of LULCC on land surface energy balance through the land surface thermal-hydrologic exchange, such as NOAH, CLM, SiB2, EASS, etc. Based on the process-based land surface model EASS, Yan et al. (2014) investigated that the contributions of climate change and LULCC on surface energy changes were 4:1 or even higher over eastern China in the past 30 years, and the impacts of LULCC on the land surface heat fluxes showed large seasonal variations. For next 40 years, Yan et al. (2013) investigated spatial and temporal variation patterns of sensible heat flux (H) and evapotranspiration (ET) under the land cover and climate scenarios across southern China, and showed that H displays a downward trend (10%) and ET presents an increasing trend (15%).
Due to the diversities and uncertainties of LULCC in China, few researches focused on the impacts of LULCC on China’s climate system. In northern China, Dong et al. (2013) simulated the impact of LULCC on surface air temperature applying RIEMS 2.0, and showed that the effects of deforestation in temperate zones is more like summer deforestation in tropical zones and winter deforestation in boreal zones. Compared to higher latitudes, the net radiation absorption change from forest converted to cropland at lower latitudes has less influence on the air temperature, but the latent heat flux has a stronger influence.
The climate system model of intermediate complexity (MPM-2) was applied to assess the global-scale biophysical climatic effects of land cover change for the past millennium. Due to the changes in albedo and precipitation, the impacts of land cover change was most obvious over Eurasia, with the maximum cooling by about 0.8ºC during summer at middle latitudes, however, the maximum warming by about 0.1ºC during the Northern Hemisphere summer at low latitudes over the Southern Hemisphere. For the climatic impacts of historical deforestation, Wang Y et al. (2013a, 2013b) simulated a cooling biophysical effect on global mean annual temperature by about 0.13ºC, in which the maximum cooling over Eurasia by 0.5ºC and the minimum over the Southern Hemisphere by 0.02ºC.

4.2 The climatic impacts of urbanization

Urbanization results in higher land surface temperatures in urban areas than its surrounding rural areas, and it causes several obvious effects on land surface energy balance (Zhao et al., 2014). Climatic impacts of urbanization are often estimated by the air temperature differences between meteorological stations located in and out of urban areas. However, it is difficult to rely on those observation data alone due to the sparse density of stations, and the potentially influences from surrounding local conditions. In addition, many studies also applying the satellite derived products to compare the differences of land surface temperature in one or several big cities (Peng et al., 2012; Clinton and Gong, 2013). However, a systematic evaluation on the impact phenomenon and mechanism of urbanization on surface temperature is still missing.
The urbanization leads to the effects of urban heat island, especially in the winter. When a meteorological station was forced to ‘enter’ cities, the observed regional air temperature would be overestimated. The overestimation is relatively higher in eastern regions than in the central and western regions due to its largest urbanization area and rapid rate. By comparing the original observations of urban meteorological stations with the surrounding background temperature, Shao et al. (2011) estimated the average intensity of urban heat island in China since 1970, and showed that the mean temperature increased by about 1.58°C in China in the last 40 years, of which about 0.01°C was contributed by urbanization.
Urbanization and cropland irrigation influenced the climate at local and regional scales. Several studies documented the impacts of urbanization or cropland irrigation on temperature separately. However, few studies analyzed the combined effects. Shi et al. (2014) analyzed the impacts of irrigation and urbanization on the surface temperatures on the Huang-Huai-Hai Plain in China, and indicated the significant cooling effect of cropland irrigation on maximum temperatures by 0.17-0.20ºC/decade, and a warming effect on minimum temperature by 0.43ºC/decade from 1955 to 2007. In those regions combined with urbanization and cropland irrigation, the warming effects of urbanization on extreme daily maximum temperature seems to be partially offset by the cooling effects of irrigation.
The field observation and model simulation were integrated to analyze the discrepancies of the radiation balance in different underlying surfaces and modeled the radiation balance by changing the land cover type but keeping all other inputs unchanged, then to discuss the impacts of urbanization on climate in typical regions. Cui et al. (2012) showed that annual average net radiations for four land use types of forest, grass, roads and buildings ranged of 38.2-53.4 W/m2, and minimum on the grass surface and maximum on the road surface. The urbanization that transferred from forest or grass to road or from grass to building will lead to increasing net radiation.
Urbanization is an important contribution of human activities to climate change. By coupling the WRF with a single-layer urban canopy model, the impacts of urbanization on climate in the Beijing-Tianjin-Hebei metropolitan area was simulated by Wang et al. (2013a, 2013b). It is shown that urbanization can only heat the air inside the urban boundary layer below 850 hPa and has more than 1°C impact on annual mean air temperature in urban areas, with maximum difference of almost 2°C. The heat island effects of urbanization that forcing the underlying surface thermal source enhanced the vertical air movement and formed a convergence zone over the urban areas, and the low-level convergence together with the increasing moisture in layer between 850 and 700 hPa triggered the increasing of convective precipitation. Urbanization in the Beijing-Tianjin-Hebei metropolitan area resulted in intensification and expansion of the regions experiencing extreme heat waves, and the average temperature increased by approximately 0.60°C that is most obvious at night by up to 0.95°C. Therefore, the mitigation strategies to increasing the roof albedo can reduce the urban mean temperature by approximately 0.51°C and offset nearly 80% of the heat wave from urbanization in the last 20 years.
From our comparisons in Figure 1 we can see that urbanization results in the decreased net radiation was less than the decreased latent heat flux, and the heating effects of the land surface to the atmosphere showed the negative values, therefore its net biophysical effect was warming in almost all climate zones. The main difference of the warming effects of urbanization presented as the warming enhancement per unit urban area was lower in arid and semiarid regions than humid and moist regions, and over twice higher in China, India and Brazil than that in the USA, due to significantly variations in patterns and rates of urbanization. Therefore, urban landscape planning based on biophysical mechanism can reduce the urban heat island intensity effectively.
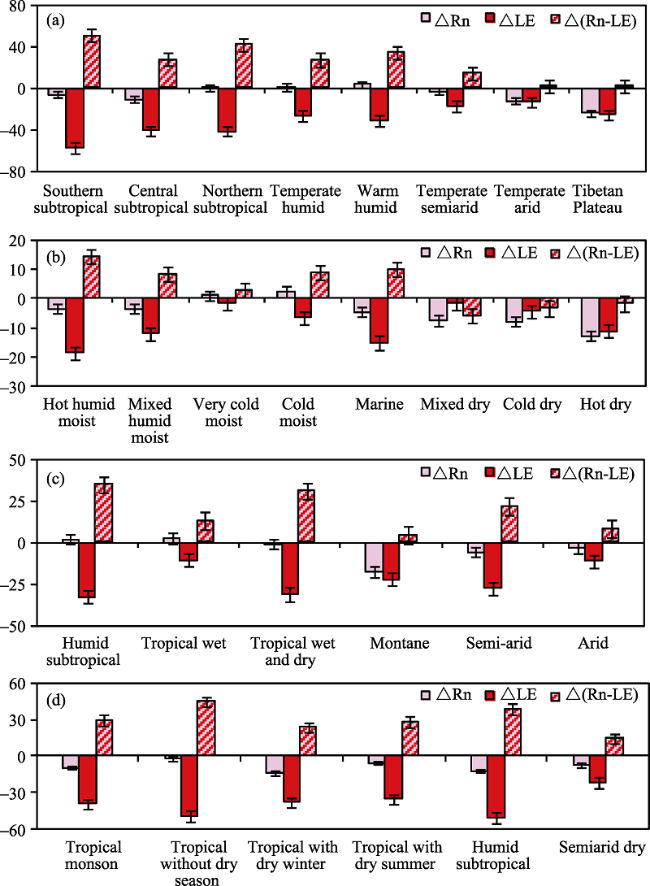
Figure 1 The biophysical forcing of urbanization compared in varied climate zones of China (a), USA (b), India (c) and Brazil (d)

4.3 The climatic impacts of cropland expansion

Due to the surface wind and boundary layer height could be altered by increasing canopy height of crops during the growth processes (Lu et al., 2015), the cropland plays a very important role through biophysical processes under the climate change (Feddema et al., 2005; Foley et al., 2005). Therefore, when LULCC such as conversion of forest to cropland occurs, it generates higher surface albedo and then alters the energy budget obviously (Bonan, 2008). Both field observation and modeling have shown that regional transfer from forest to rain-fed cropland can reduce the evapotranspiration and then the precipitation (Sampaio et al., 2007). However, previous studies have mainly focused on the simulation of potential impacts on the mean climate (Davin et al., 2014), from the local and regional scale to subcontinental and global scale, whereas the influence mechanisms and variations has never been explored.
The greenness of cropland increased in spring leads to the cooling and wetting effects and conversely substantially decreased in early summer results in warming and drying effects in the North China Plain during 1982-2006, according to the simulation from Zhang et al. (2013c). It is shown that the cooling or warming impacts of greenness changes in cropland accounted for about 47% of the spatial variations in spring daily maximum temperature change and 44% in early summer. It also showed that the wetting or drying effects accounted for about 48% of the spatial variations in spring daily minimum humidity change and about 19% in early summer. Therefore, the increased greenness of cropland responds to higher transpiration rate and humidity, less sensible heat flux, and consequently cooling and wetting effects.
The role of cropland irrigation in regulating the regional climate has been widely recognized. Mao et al. (2011) simulated the impacts of cropland irrigation on regional climate over India using the RIEMS 2.0. During 1990-2000, the temporal difference of the two regional climate model sensitivity experiments (rain-fed cropland and irrigated cropland) showed that a regional cooling effect exists driving by irrigation with annual averaged 2 m air temperature decreasing 1.4ºC and the precipitation rate increasing 0.35 mm/d at the national scale. The irrigation cooling effect can contribute to the increased latent heat flux and decreased sensible heat flux. The increased precipitation rate depends on the offset between the positive convective rainfall and the negative large-scale none-convective rainfall. The seasonal difference indicated that the climate of pre-monsoon season and June is more sensitive than monsoon season (July to September) to irrigation. The national averaged change in temperature was 3.18ºC in pre-monsoon season and 0.43ºC in monsoon season, respectively.
Conversion of grassland or forest to cropland caused decreased net radiation and increased latent heat flux in China’s arid and semiarid regions, so the net biophysical effect was cooling. Whereas it caused increased net radiation and decreased latent heat flux in subtropical regions, therefore warming was the net biophysical effect. In USA, Brazil and India, whatever in arid or humid regions, the net biophysical effects of conversion of grassland or forest to cropland presented as cooling. The net radiation decreased and latent heat flux increased in dry regions in Western USA, and the increased net radiation less than increased latent heat flux in moist regions in Eastern USA. The net radiation and latent heat flux both decreased in Brazil, but the decreased amount of net radiation was less than that of latent heat flux (Figure 2).
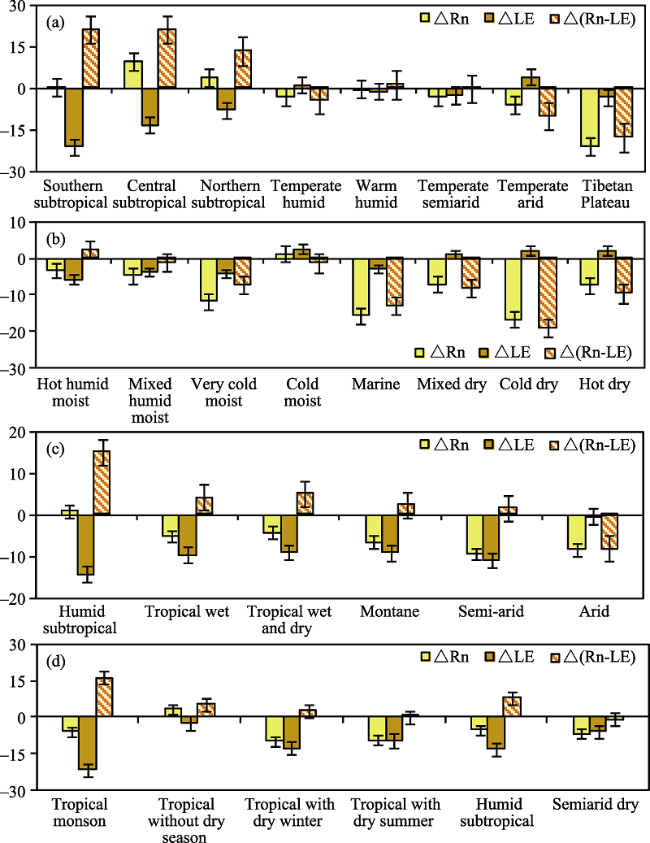
Figure 2 The biophysical forcing of cropland expansion compared in varied climate zones of China (a), USA (b), India (c) and Brazil (d)

4.4 The climatic impacts of afforestation

The promotion of afforestation has often been pointed out as a significant mitigation and adaptation strategy of climate change. The biogeochemical effects of afforestation result in atmosphere carbon dioxide absorption and carbon sequestration, which have a cooling impact on the regional climate (Betts, 2011). In addition, the biophysical effects of afforestation can lead to climate warming by changing the land surface albedo, roughness, evapotranspiration and then surface energy transfer processes (Anderson et al., 2010), particularly at high latitudes. Here, the biophysical impacts of afforestation were analyzed for varied climate zones in different countries.
From the comparisons in Figure 3, we can see that afforestations in humid subtropical and tropical regions of the four countries have net cooling influences on regional temperature with higher warming reductions per unit area, due to its increased net radiation being less than the increased latent heat flux. However, afforestation in arid and dry regions of China, USA and India have weak cooling or even warming influences, because the increased net radiations are typically overwhelmed the increased latent heat flux, or the cooling carbon effects of afforestation are outweighed the net warming effects related to higher net radiation and lower evapotranspiration. The net biophysical effect of afforestation in whole Brazil showed cooling effects. Therefore, from the climate perspectives, afforestation in the humid, subtropical, tropical regions and the whole Brazil would be obviously beneficial in adapting to and mitigating climate warming, however it would only offer marginal benefits in temperate regions, and even counterproductive in arid and semiarid regions.
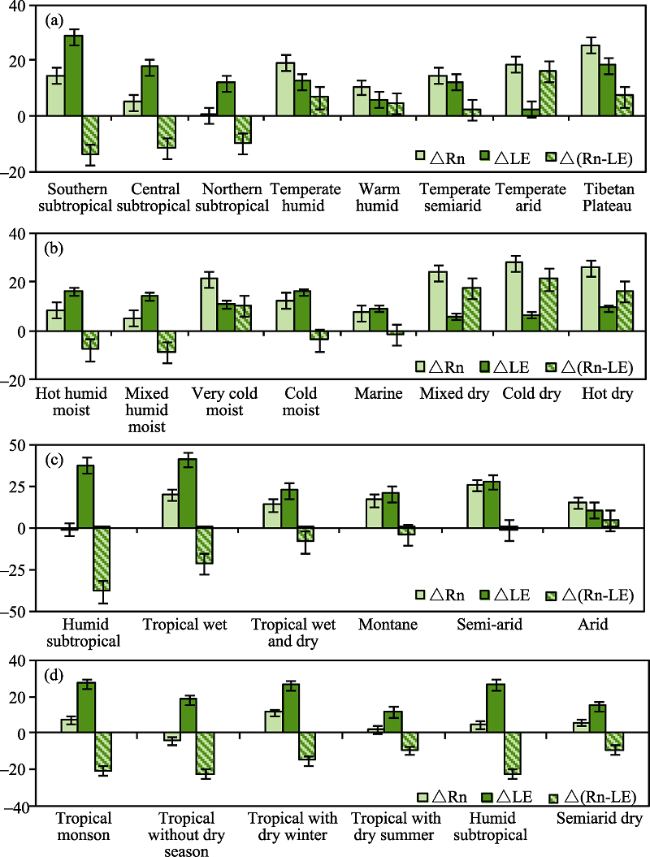
Figure 3 The biophysical forcing of afforestation compared in varied climate zones of China (a), USA (b), India (c) and Brazil (d)

5 Projecting the potential impacts of LULCC on climate

Most previous studies focused on the relationship and simulation analysis of historical LULCC and climate change, with fewer explorations for the impacts of future LULCC on regional climate. The future scenarios of the LULCC impacts on biophysical processes and then the climate were simulated and analyzed combining EASS and WRF simulation.
Northeast China is one of the regions with the highest intensity of human activities, which have an important role in influencing the regional climate. Shi et al. (2013) simulated the climatic effects of cultivated land reclamation by the WRF model, and indicated the increasing temperature and decreasing precipitation during 2030-2040. In the overgrazing regions of northwestern China, Li et al. (2013) explored the potential climatic impacts of grassland degradation from 2010 to 2040, which will lead to increasing summer temperature by 0.4-1.2ºC and decreasing winter temperature by 0.2ºC, and decreasing precipitation by 4-20 mm both in summer and winter.
As one of the major types of LULCC, the expansion of cultivated land will impact on regional climate change in the future. By applying the WRF model, Qu et al. (2013) forecasted the changes of energy flux and then the temperature based on the future cultivated land reclamation in India, and then the impacts of cultivated land reclamation on climate change were also analyzed. The cultivated land reclamation will lead to the increase in latent heat flux and the decrease in sensible heat flux, and further lead to changes of regional temperature. Furthermore, the cultivated land reclamation mainly leads to a temperature decrease in the summer, while it leads to a temperature increase in the winter.
In Mongolia, the potential climatic impacts of future grassland changes were simulated by WRF model for 2010-2020 and 2040-2050. The baseline underlying surface data in 1993, the atmospheric forcing datasets of RCP 6.0 from CMIP5, and the predicted underlying surface data which can be derived through overlaying the grassland degradation information to the map of baseline underlying surface were applied. Future grassland degradation could result in an increasing temperature in most areas by a range of -0.1ºC to 0.4ºC, and decreasing precipitation by 10-50 mm (Zhang et al., 2013a).
In the northeastern megalopolis in the USA, The impacts of future urbanization on regional climate are simulated by Lin et al. (2013). It is shown that the future urbanization will result in the increasing mean annual temperature by 2-5ºC in new urban regions and decreasing temperature by 0.4-1.2ºC in southern megalopolis. And the warming will be more obvious in summer than that in winter. For the annual total precipitation, it will respectively decrease by about 5.8, 7.1 and 8.4 mm during the periods of 2010-2020, 2040-2050 and 2090-2100.
In the Brazilian Amazon, the potential climatic impacts of future deforestation was simulated in the 21st century by Zhang et al. (2013b), and it is shown that 5.12% of the forests will be transferred to cropland and pasture in the northwestern part and 13.11% to cropland/woodland mosaic in the southeastern part, respectively. And then those LULCC will result in obvious reduction of sensible and latent heat flux, decreasing precipitation and increasing land surface temperature.

6 Conclusions

(1) Based on “global vision”, quick information obtained methodology of large-scale LULCC integrated remote sensing and geoscience knowledge was constructed for China and comparative countries. The spatial and temporal datasets in the past 30 to 300 years and future 50 to 100 years of China and comparative countries were produced. The dynamic LULCC processes and its driving mechanism were revealed between China, the United States, Brazil, India, Central Asia and other countries. The absence of high-resolution temporal LULCC data in the global change research was solved. The LULCC dynamic model coupled climate change and human activities were developed to improve the reliability and accuracy of LULCC simulation, and to achieve the scenario simulation and forecasting LULCC process in multiple spatial and temporal scales.
(2) The research frameworks on the biophysical effects of LULCC were developed by integrating the observation, retrievals and simulation to enhance the integration of satellite and ground ability to obtain land surface parameters. In the scale of typical region and country, the impacts of LULCC on land surface biophysical parameters and the spatial variations were quantitatively analyzed and simulated. The mechanisms of LULCC impacts on climate through land surface biophysical processes were obvious, which were not only controled by LULCC types, but also dependent on local climate background.
(3) The impacts of multiple spatial and temporal scale land use change on climate were simulated by applying land surface process model and climate model based on high resolution LULCC dynamic datasets. The contributions of large-scale LULCC impacts on climate by changing the land surface-atmosphere processes were quantitatively assessed. Effects of LULCC on climate were varied by different scales. In local scale, the impacts of LULCC on radiation and energy balance was greater than that of greenhouse gases, which resulted in local temperature change with the similar magnitude of greenhouse gases. However, those impacts were weak in regional scale.
(4) The future scenarios of LULCC and its climatic effects were projected, and accordingly accurate understanding on the scope and extent of the future LUCC process on climate change was simulated. By optimizing human land use activities, the regional climate could be regulated. Therefore, we need to choose the reasonable patterns of land use under future socio-economic development. LUCC can be one of the effective measurements to mitigate climate change, but its negative effects required further assessment.
(5) The climatic impacts of LULCC on regional and global climate change should arouse great concerns by the global change scientific community. In the future, the impacts of LULCC should focus on cloud formation and precipitation change. In addition, due to less research focused on the biophysical consequences of land management changes, such as irrigation, forest thinning, grazing, etc., those anthropogenic activities should modify the land surface without changing the land cover types. Therefore, as suggested by Luyssaert et al. (2014), the land management needs to be considered in the earth system science to further study the human impacts on the climate system.

The authors have declared that no competing interests exist.

1
Anderson-Teixeira K J, Snyder P K, Twine T Eet al., 2012. Climate-regulation services of natural and agricultural ecoregions of the Americas.Nature Climate Change, 2: 177-181.Terrestrial ecosystems regulate climate through both biogeochemical (greenhouse-gas regulation) and biophysical (regulation of water and energy) mechanisms1,2. However, policies aimed at climate protection through land management, including REDD+ (where REDD is Reducing Emissions from Deforestation and Forest Degradation) 3 and bioenergy sustainability standards4, account only for biogeochemical mechanisms. By ignoring biophysical processes, which sometimes offset biogeochemical effects5,6, policies risk promoting suboptimal solutions1,2,4,7 10. Here, we quantify how biogeochemical11 and biophysical processes combine to shape the climate regulation values of 18 natural and agricultural ecoregions across the Americas. Natural ecosystems generally had higher climate regulation values than agroecosystems, largely driven by differences in biogeochemical services. Biophysical

DOI

2
Anderson R G, Canadell J G, Randerson J Tet al., 2010. Biophysical considerations in forestry for climate protection.Frontiers in Ecology and the Environment. doi: 10.1890/090179.Only about 12 % of Earth land is located in protectedareas, and less than half of this is managed primarily for biodiversity conservation (Hoekstra et al. 2005). Although protected areas are an essential part of any cred-ible conservation strategy (Margules and Pressey 2000), it is becoming increasingly clear that reserves alone will not protect biodiversity because they are too few, too isolated, too static, and not always safe from over-exploitation (Liu et al. 2001; Bengtsson et al. 2003; Rodrigues et al. 2004). For these reasons, it is now widely recognized that conser-vation within protected areas needs to be complemented by conservation outside protected areas (Daily 2001; Lindenmayer and Franklin 2002). Production industries like agriculture and forestry dom-inate human land use (Morris 1995). These industries directly depend on a range of vital ecosystem services,

DOI

3
Betts R A.2000. Offset of the potential carbon sink from boreal afforestation by decreases in surface albedo.Nature, 408: 187-190.Carbon uptake by forestation is one method proposed to reduce net carbon dioxide emissions to the atmosphere and so limit the radiative forcing of climate change. But the overall impact of forestation on climate will also depend on other effects associated with the creation of new forests. In particular, the albedo of a forested landscape is generally lower than that of cultivated land, especially when snow is lying, and decreasing albedo exerts a positive radiative forcing on climate. Here I simulate the radiative forcings associated with changes in surface albedo as a result of forestation in temperate and boreal forest areas, and translate these forcings into equivalent changes in local carbon stock for comparison with estimated carbon sequestration potentials. I suggest that in many boreal forest areas, the positive forcing induced by decreases in albedo can offset the negative forcing that is expected from carbon sequestration. Some high-latitude forestation activities may therefore increase climate change, rather than mitigating it as intended.

DOI PMID

4
Betts R A.2011. Climate science: Afforestation cools more or less.Nature Geoscience, 4: 504-505.Forests affect climate not only by taking up carbon, but also by absorbing solar radiation and enhancing evaporation. In the tropics, the climate benefit of afforestation may be nearly double that expected from carbon budgets alone.

DOI

5
Bonan G B.2008. Forests and climate change: Forcings, feedbacks, and the climate benefits of forests.Science, 320: 1444-1449.The world's forests influence climate through physical, chemical, and biological processes that affect planetary energetics, the hydrologic cycle, and atmospheric composition. These complex and nonlinear forest-atmosphere interactions can dampen or amplify anthropogenic climate change. Tropical, temperate, and boreal reforestation and afforestation attenuate global warming through carbon sequestration. Biogeophysical feedbacks can enhance or diminish this negative climate forcing. Tropical forests mitigate warming through evaporative cooling, but the low albedo of boreal forests is a positive climate forcing. The evaporative effect of temperate forests is unclear. The net climate forcing from these and ot

DOI PMID

6
Clinton N, Gong P, 2013. MODIS detected surface urban heat islands and sinks: Global locations and controls.Remote Sensing of Environment, 134: 294-304.Urbanization is a global problem with emergent properties. The difference in temperature between urban and rural surfaces is one such property that affects health, energy consumption budgets, regional planning and climate. We used remotely sensed datasets and gridded population to estimate the magnitude of thermal differentials (urban heat islands and/or sinks), the timing of heat differential events, and the controlling variables. The global scope of the study provides a consistent analytical environment that enables identification of the key factors that contribute to deleterious heat differentials. We propose new indices of thermal differential and use them to show particular prevalence of heat islands and sinks in arid regions. A variable ranking analysis indicates that development intensity, vegetation amount and the size of the urban metropolis are the most important urban variables to predict heat differentials. Population was of lesser importance in this study. Urban structure indices were also ranked lower, though a different measurement scale qualifies this conclusion. The results support the paradigm of compact development and incorporation of vegetation to the urban infrastructure. (C) 2013 Elsevier Inc. All rights reserved.

DOI

7
Cui Y P, Liu J Y, Hu Y Fet al., 2012. Modeling the radiation balance of different urban underlying surfaces.Chinese Science Bulletin, 57: 1046-1054.An urban net all-wave radiation parameterization scheme is evaluated using annual datasets for 2010 recorded at a Beijing urban observation site.The statistical relationship between observed data and simulation data of net radiation has a correlation coefficient of 0.98 and model efficiency of 0.93.Therefore,it can be used to simulate the radiation balance of Beijing.This study analyzes the variation in the radiation balance for different underlying surfaces.To simulate radiation balance differences,we set four pure land-cover types(forest,grass,roads,and buildings).Keeping all other conditions inputted unchanged,we model the radiation balance by changing the land-cover type.The results show that the effects of different underlying surfaces on radiation differ,and that there is much upward long-wave radiation,accounting for 84.3% of the total radiation energy falling incident on the land surface.The annual averages of net radiation for the four land-cover types are in the range of 38.2-53.4 W/m2.The net radiation of the grass surface is minimal while that of the roads surface is maximal.Additionally,with urbanization the net radiation values of common types of land-cover change,such as conversion from forest to roads,grass to roads,and grass to buildings,all have increasing trends,indicating that net radiation usually increases with urban sprawl.

DOI

8
Davin E L, Seneviratne S I, Ciais Pet al., 2014. Preferential cooling of hot extremes from cropland albedo management.Proceedings of the National Academy of Sciences, 111(27): 9757-9761.Not Available

DOI PMID

9
Dong S Y, Yan X D, Xiong Z, 2013. Varying responses in mean surface air temperature from land use/cover change in different seasons over northern China.Acta Ecologica Sinca, 33: 167-171.Research on the impacts of land use change on climate change has become a foremost topic in the field of global climate change research. Although many researchers have studied the impacts of LUCC, data related to these impacts on the Chinese climate system remain sparse because of the diversity of China’s regional changes in land use, especially related to agricultural changes. Therefore, additional studies are needed that address regional LUCC in combination with climate modeling. Two simulations with current land use/cover patterns and potential natural vegetation cover were used to investigate the impact of LUCC on surface air temperature in northern China. Simulations of 1102years of climate in northern China (1 January 1990–31 December 2000) were carried out using Regional Environment Integrated Modeling System 2.0 (RIEMS2.0). The results showed that: (1) When potential natural vegetation cover types were changed to current vegetation cover types, mean summer surface air temperature decreased in the central northeastern area, eastern Gansu Province and Ningxia Hui Autonomous Region, but increased in Shanxi, Henan and Anhui provinces. Also, surface air temperature changed significantly on a local scale in the central northeastern area, central Henan Province and eastern Gansu Province ( P 02<020.05). In winter, major portions of the study area exhibited non-significant decreases in mean surface air temperature. (2) In summer, a temperate forests removal simulation in northern China behaved more like a tropical forests removal simulation. In winter, removal of the temperate forests in northern China behaved more like a boreal forests removal simulation. In model grids where forest were converted to cropland, the net radiation absorbed has less influence on surface air temperature at lower vs. higher latitudes. Further, latent heat flux has a stronger influence on surface air temperature at lower latitudes.

DOI

10
Du G M, Kuang W H, Meng F Het al., 2015. Spatiotemporal pattern and driving forces of land use/cover change in Brazil.Progress in Geography, 34(1): 73-82.Land use/cover change (LUCC) is one of the hot topics in the study of global change. In this research, the authors adopted the method of human-computer interaction to amend the 2005 ESA GlobalCover land use data based on the Landsat TM/ETM remotely sensed data around 2005, then used the inverse phase visual interpretation method to extract land use/cover change information between 1980 and 2005 based on the Landsat MSS/ TM remotely sensed data in the 1980s, and analyzed the Spatiotemporal pattern and driving forces of the change. The results show that in the 25 years between 1980 and 2005, that area of land use/cover change reached 794300 km<sup>2</sup> in Brazil, accounting for 9.33% of the total land area. Among these, cropland increased by 201800 km<sup>2</sup> cropland/ natural vegetation mosaic increased by 107000 km<sup>2</sup> forest area decreased by 531200 km<sup>2</sup> shrub and grassland converted to other land use types by 236000 km<sup>2</sup> and the opposite conversion was 447000 km<sup>2</sup> with a net increase of this land use category by 211000 km<sup>2</sup> water increased by 4600 km<sup>2</sup> urban and built-up areas extended by 7573.87 km<sup>2</sup>. But the land use macroscopic structure did not change. Regional differences of the main land use change forms including deforestation, grassland in- and out- conversion, Land reclamation, and urban and built-up area expansion led to different land use/cover change characteristics in tropical and subtropical moist broadleaf forest ecological zone, tropical and subtropical dry broadleaf forest ecological zone, tropical and subtropical steppe ecological zone, grassland and marsh wetland ecological zone, desert and xeric plants ecological zone, and mangrove forest ecological zone. Natural geographical conditions such as landform, climate, and vegetation profoundly affected the macro pattern of land use and the possibility of land use change. Although climate change had a certain impact on cropland reclamation and the increase of grassland, land use policy, economy and foreign trade development, population growth and migration, and road construction were the direct causes of land use change in Brazil.

DOI

11
Feddema J J, Olsson K, Bonan Get al., 2005. How important is land cover change for simulating future climates?Science, 310(5754): 1674-1678.Different future land cover patterns, as represented by two IPCC SRES scenarios, lead to contrasting future climate simulations. Conversion of forest to agriculture in the Amazon leads to local warming equivalent to atmospheric forcing effects. In other tropical locations land cover effects on local temperatures are minimized because of differences in large-scale circulation responses. Mid-latitude climate impacts include cooling with agricultural expansion. Daily diurnal temperature ranges are strongly affected over much of the terrestrial surface. These results indicate that choices humans make about future land use could have a significant impact on future climate change in addition to the effect of atmospheric greenhouse gases and aerosols.

12
Foley J A, DeFries R, Asner G Pet al., 2005. Global consequences of land use.Science, 309: 570-574.Land use has generally been considered a local environmental issue, but it is becoming a force of global importance. Worldwide changes to forests, farmlands, waterways, and air are being driven by the need to provide food, fiber, water, and shelter to more than six billion people. Global croplands, pastures, plantations, and urban areas have expanded in recent decades, accompanied by large increases in energy, water, and fertilizer consumption, along with considerable losses of biodiversity. Such changes in land use have enabled humans to appropriate an increasing share of the planet's resources, but they also potentially undermine the capacity of ecosystems to sustain food production, maintain freshwater and forest resources, regulate climate and air quality, and ameliorate infectious diseases. We face the challenge of managing trade-offs between immediate human needs and maintaining the capacity of the biosphere to provide goods and services in the long term.

DOI PMID

13
Gibbard S, Caldeira K, Bala Get al., 2005. Climate effects of global land cover change.Geophysical Research Letters, 32, L23705. doi: 10.1029/2005GL024550.When changing from grass and croplands to forest, there are two competing effects of land cover change on climate: an albedo effect which leads to warming and an evapotranspiration effect which tends to produce cooling. It is not clear which effect would dominate. We have performed simulations of global land cover change using the NCAR CAM3 atmospheric general circulation model coupled to a slab ocean model. We find that global replacement of current vegetation by trees would lead to a global mean warming of 1.3°C, nearly 60% of the warming produced under a doubled COconcentration, while replacement by grasslands would result in a cooling of 0.4°C. It has been previously shown that boreal forestation can lead to warming; our simulations indicate that mid-latitude forestation also could lead to warming. These results suggest that more research is necessary before forest carbon storage should be deployed as a mitigation strategy for global warming.

DOI

14
Global Land Project.Global Science Plan and Implementation Strategy. IGBP Report 53/IHDP Report 19. 2005.

15
Gong T Y, Shao Q Q, Liu J Yet al., 2012. The impact of land use/cover types on climate warming in southern China.Geographical Research, 31(8): 1465-1478. (in Chinese)In this article we have analyzed the impact of land cover types on climate warming in southern China based on observation data of 136 reference meteorological stations from China Meteorological Bureau in Southern China,the 1:100000 national land cover data from the 1980s to 2005 and NCEP/DOE AMIP-ⅡReanalysis.We extracted the underlying surface of 3-km radius buffer zones around the meteorological stations in different historical periods,and distinguished the observational environment of the meteorological stations.Then,annual,seasonal and monthly changes of air temperature are analyzed.We compared the difference of temperature change at meteorological stations with different observational environments which are respectively cropland,built-up land and woodland,and drew some conclusions about the impact of land cover types on climate warming in southern China.The result shows that,in southern China,among the three main types of land cover in the study area,the changing trends of the annual average,annual average maximum and the annual average minimum temperature in built-up areas are most significant,while those in cropland area are moderate,and those in forest area are least significant.By analysis of OMR values which are observed minus data of NCEP/DOE AMIP-ⅡReanalysis,we found that the changing trend of annual average temperature in built-up land is still most significant(0.105℃/10a),followed by cropland area(0.056℃/10a),and forest area(-0.025℃/10a).So,it is concluded that forest plays an inhibitory effect in climate warming,while built-up land and cropland play an enhanced effect,and urban areas enhance the climate warming more than cropland.We also conclude that the changing trends of average seasonal and monthly temperature in woodland are less significant than those of any other land cover types.

DOI

16
He F N, Li S, Zhang X Zet al., 2013. Comparisons of cropland area from multiple datasets over the past 300 years in the traditional cultivated region of China.Journal of Geographical Sciences, 23: 978-990.Abstract<br/><p class="a-plus-plus">Land use/cover change is an important parameter in the climate and ecological simulations. Although they had been widely used in the community, SAGE dataset and HYDE dataset, the two representative global historical land use datasets, were little assessed about their accuracies in regional scale. Here, we carried out some assessments for the traditional cultivated region of China (TCRC) over last 300 years, by comparing SAGE2010 and HYDE (v3.1) with Chinese Historical Cropland Dataset (CHCD). The comparisons were performed at three spatial scales: entire study area, provincial area and 60 km by 60 km grid cell. The results show that (1) the cropland area from SAGE2010 was much more than that from CHCD; moreover, the growth at a rate of 0.51% from 1700 to 1950 and −0.34% after 1950 were also inconsistent with that from CHCD. (2) HYDE dataset (v3.1) was closer to CHCD dataset than SAGE dataset on entire study area. However, the large biases could be detected at provincial scale and 60 km by 60 km grid cell scale. The percent of grid cells having biases greater than 70% (&lt;-70% or &gt;70%) and 90% (&lt;-90% or &gt;90%) accounted for 56%–63% and 40%–45% of the total grid cells respectively while those having biases range from −10% to 10% and from −30% to 30% account for only 5%–6% and 17% of the total grid cells respectively. (3) Using local historical archives to reconstruct historical dataset with high accuracy would be a valuable way to improve the accuracy of climate and ecological simulation.</p><br/>

DOI

17
Houghton R A, Hackler J L, 2003. Sources and sinks of carbon from land-use change in China.Global Biogeochemical Cycles, 17(2): 1034. doi: 10.1029/2002GB001970.Changes in land use contribute to the current terrestrial carbon sink in most regions of the northern midlatitudes but are poorly documented for China, the world's third largest country. We attempted to reconstruct the last 300 years of land-use change in China, emphasizing changes in the area of forests. Changes in the area of croplands were inadequate for reconstruction of forest loss because the long-term loss of forest area was more than twice the current area of croplands. We used historical information to reconstruct changes in forest area over time and the ecological literature to estimate the carbon stocks of the major natural ecosystems (vegetation and soil). We used a bookkeeping model to calculate the flux of carbon to or from living vegetation, dead vegetation, soils, and wood products under different types of land use. According to the data and assumptions, 180 (range: 80-200) 10ha of forest were lost, and 17-33 PgC were released to the atmosphere between 1700 and 2000. About 25% of the loss was from soils. The accelerated clearing and logging of forests in northeastern and southwestern China led to emissions of carbon that reached peaks of 0.2-0.5 PgC yrfrom the late 1950s through the 1970s. Lower rates of deforestation since then, as well as expanding areas of tree plantations, reversed the net flux of carbon from a source to a sink during the 1990s.

DOI

18
IPCC Fourth Assessment Report: Climate Change 2007 (AR4). IPCC, Geneva Change 2007 (AR4). IPCC, Geneva, Switzerland. 2007.

19
Kuang W H, Chi W F, Lu D Set al., 2014. A comparative analysis of megacity expansions in China and the U.S.: Patterns, rates and driving forces.Landscape and Urban Planning, 132: 121-135.Research on physical characteristics and land-cover dynamic changes of megacities over time provides valuable insights for effectively regulating urban planning and management. This study conducts a comparative analysis of 30-year urban expansion patterns and rates among three metropolises in China (Beijing, Shanghai, and Guangzhou) and another three in the USA (New York, Los Angeles, and Chicago) based on time-series impervious surface area (ISA) data extracted from multitemporal Landsat images using the linear spectral mixture analysis approach. This research indicates significantly different urbanization patterns and rates between the Chinese and American megacities. The ISA expansion area in Chinese megacities was five times higher than that in American megacities during the past three decades. The Chinese megacities expand outward from the urban core to the periphery in a concentric ring structure, whereas the American megacities increase ISA mainly within the inner cities with patch-filling patterns. The Chinese megacities are in the development stage where population and economic conditions significantly influence urban expansion patterns and rates, but the American megacities are in the developed stage where population and economic conditions are not important forces driving the ISA expansion. The ISA intensity in the American megacities decreases constantly and smoothly, but ISA intensity in Chinese megacities decays abruptly within certain distances, depending on different cities and years. The most obvious urban expansions were between 8 and 20 km in Beijing in the 1980s, between 14 and 50 km in Shanghai in the 2000s, and between 8 and 18 km in Guangzhou in the 1990s.

DOI

20
Le Quéré C, Moriarty R, Andrew R Met al., 2015. Global carbon budget 2014.Earth System Science Data, 7, 47-85.

21
Li S C, He F N, Zhang X Z, 2015. A spatially explicit reconstruction of cropland cover in China from 1661 to 1996.Regional Environment Change. doi: 10.1007/s10113-014-0751-4.Reconstruction of cropland cover is crucial for assessing human impact on the environment. In this study, based on existing studies concerning historical cropland, population data and government inventories, we obtained a provincial cropland area dataset of China for 1661–1996 via collection, revision and reconstruction. Then, the provincial cropland area was allocated into grid cells of 1002×021002km depending on the land suitability for cultivation. Our reconstruction indicates that cropland increased from ~55.502×0210 4 km 2 in 1661 to ~130.002×0210 4 km 2 in 1996. From 1661 to 1873, cropland expanded tremendously in the Sichuan Basin, and land reclamation was greatly enhanced in North China Plain. For 1873–1980, agricultural development occurred primarily in northeastern China. After 1980, most provinces in the traditionally cultivated region of China experienced decreases in cropland area. In comparison with satellite-based data for 2000, we found that our reconstruction generally captures the spatial distribution of cropland. Also, differences are mostly <2002% (6120 to 2002%). Compared with HYDE 3.1 dataset, which is designed for the global scale, our model is more suitable for reconstructing the historical crop cover of China at 1002×021002km grid scale. Our reconstruction can be used in climate models to study the impact of crop cover change on the climate and carbon cycle.

DOI

22
Li Y F, Li Z H, Li Z Het al., 2013. Numerical simulation of the effects of grassland degradation on the surface climate in overgrazing area of Northwest China. Advances in Meteorology, Article ID 270192.land-use change; regional climate; northern china; desertification; impact; model; restoration; mongolia

DOI

23
Lin Y Z, Liu A P, Ma E Jet al., 2013. Impacts of future urban expansion on regional climate in the Northeast Megalopolis, USA. Advances in Meteorology, Article ID 362925.In this paper, evidences for influences of future urban expansion on regional climate in the Northeast megalopolis, USA, are presented. The model-based analysis shows that future urban expansion will significantly result in regional climate change. An average annual temperature increase ranging from 2°C to 5°C in new urban area and an average annual temperature decrease ranging from 0.40°C to 1.20°C in the south of the megalopolis will be caused by future urban expansion. The average annual precipitation of the simulation area will decrease due to future urban expansion by 5.75?mm, 7.10?mm, and 8.35?mm in the periods of 2010–2020, 2040–2050, and 2090–2100, respectively. The warming effect of future urban expansion in original and new urban area and drought effects in nonurban area will be more serious in summer than in winter. A cooling effect will turn up in original urban area in winter. This research further shows that a study at the scale of megalopolis helps to understand the integrated effect of combination and interaction of multiple cities and their surrounding areas which may crucially determine regional climate pattern and should be highly valued in the future. 1. Introduction Urban expansion is regarded as one of the most noticeable effects of human activities that cover a very small fraction of Earth’s land surface but notably affect climate. It usually removes and replaces crops and natural vegetation with nonevaporating and nontranspiring surfaces such as metal, asphalt, and concrete [1, 2]. These artificial surfaces are characterized by specific thermal properties (albedo, thermal conductivity, and emissivity) which are different from those of nonurban areas [3–5]. The alteration of regional thermal properties along with urban expansion will inevitably result in the redistribution of incoming solar radiation and affect the surface energy budgets [6, 7]. Consequently, the wind velocity, mixing layer depth, and thermal structures in the boundary layer, as well as the local and regional atmospheric circulations, are changed [8–11]. One of the most widely concerned phenomena of urban-induced climate change is the effect of urban heat island (UHI), which describes the difference in ambient air temperature between an urban area and its surrounding rural area. A lot of researches have been implemented focusing on the UHI in a single city [12–14]. Though neglecting the integrated effect of combination and interaction of multiple cities at regional scale, these researches help greatly in understanding the influences of urban expansion on climate.

DOI

24
Liu J Y, Kuang W H, Zhang Z Xet al., 2014. Spatiotemporal characteristics, patterns, and causes of land-use changes in China since the late 1980s.Journal of Geographical Sciences, 24(2): 195-210.lt;p>Land-use/land-cover changes (LUCCs) have links to both human and nature interactions. China's Land-Use/cover Datasets (CLUDs) were updated regularly at 5-year intervals from the late 1980s to 2010,with standard procedures based on Landsat TM\ETM+ images. A land-use dynamic regionalization method was proposed to analyze major land-use conversions. The spatiotemporal characteristics,differences,and causes of land-use changes at a national scale were then examined. The main findings are summarized as follows. Land-use changes (LUCs) across China indicated a significant variation in spatial and temporal characteristics in the last 20 years (1990-2010). The area of cropland change decreased in the south and increased in the north,but the total area remained almost unchanged. The reclaimed cropland was shifted from the northeast to the northwest. The built-up lands expanded rapidly,were mainly distributed in the east,and gradually spread out to central and western China. Woodland decreased first,and then increased,but desert area was the opposite. Grassland continued decreasing. Different spatial patterns of LUC in China were found between the late 20th century and the early 21st century. The original 13 LUC zones were replaced by 15 units with changes of boundaries in some zones. The main spatial characteristics of these changes included (1) an accelerated expansion of built-up land in the Huang-Huai-Hai region,the southeastern coastal areas,the midstream area of the Yangtze River,and the Sichuan Basin;(2) shifted land reclamation in the north from northeast China and eastern Inner Mongolia to the oasis agricultural areas in northwest China;(3) continuous transformation from rain-fed farmlands in northeast China to paddy fields;and (4) effectiveness of the &quot;Grain for Green&quot; project in the southern agricultural-pastoral ecotones of Inner Mongolia,the Loess Plateau,and southwestern mountainous areas. In the last two decades,although climate change in the north affected the change in cropland,policy regulation and economic driving forces were still the primary causes of LUC across China. During the first decade of the 21st century,the anthropogenic factors that drove variations in land-use patterns have shifted the emphasis from one-way land development to both development and conservation.The &quot;dynamic regionalization method&quot; was used to analyze changes in the spatial patterns of zoning boundaries,the internal characteristics of zones,and the growth and decrease of units. The results revealed &quot;the pattern of the change process,&quot; namely the process of LUC and regional differences in characteristics at different stages. The growth and decrease of zones during this dynamic LUC zoning,variations in unit boundaries,and the characteristics of change intensities between the former and latter decades were examined. The patterns of alternative transformation between the &quot;pattern&quot; and &quot;process&quot; of land use and the causes for changes in different types and different regions of land use were explored.</p>

DOI

25
Lu D S, Li G Y, Moran Eet al., 2014. A comparative analysis of approaches for successional vegetation classification in the Brazilian Amazon.GIScience & Remote Sensing, 51(6): 695-709.Research on separation of successional stages has been an active topic for the past two decades because successional vegetation plays an important role in the carbon budget and restoration of soil fertility in the Brazilian Amazon. This article examines classification of successional stages by conducting a comparative analysis of classification algorithms (maximum likelihood classifier – MLC, artificial neural network – ANN, K-nearest neighbour – KNN, support vector machine – SVM, classification tree analysis – CTA, and object-based classification – OBC) on varying remote-sensing data-sets (Landsat and ALOS PALSAR). Through this research we obtained the following four major conclusions: (1) Landsat data provide higher classification accuracy than ALOS PALSAR data, and individual PALSAR data cannot effectively separate successional stages; (2) Fusion of Landsat and PALSAR data provides better classification than individual sensor data; (3) Depending on the data-set, the best classification algorithm varies, MLC and CTA are recommended for Landsat or fusion images; and KNN is recommended for the combination of Landsat and PALSAR data as extra bands; (4) the MLC based on fusion images is recommended for vegetation classification in the moist tropical region when sufficiently representative training samples are available.

DOI

26
Lu Y Q, Jin J M, Kueppers L M, 2015. Crop growth and irrigation interact to influence surface fluxes in a regional climate-cropland model (WRF3.3-CLM4crop).Climate Dynamics, 45(11): 3347-3363.

27
Luyssaert S, Jammet M, Stoy P Cet al., 2014. Land management and land-cover change have impacts of similar magnitude on surface temperature.Nature Climate Change, 4: 389-393.Anthropogenic changes to land cover (LCC) remain common, but continuing land scarcity promotes the widespread intensification of land management changes (LMC) to better satisfy societal demand for food, fibre, fuel and shelter1. The biophysical effects of LCC on surface climate are largely understood2, 3, 4, 5, particularly for the boreal6 and tropical zones7, but fewer studies have investigated the biophysical consequences of LMC; that is, anthropogenic modification without a change in land cover type. Harmonized analysis of ground measurements and remote sensing observations of both LCC and LMC revealed that, in the temperate zone, potential surface cooling from increased albedo is typically offset by warming from decreased sensible heat fluxes, with the net effect being a warming of the surface. Temperature changes from LMC and LCC were of the same magnitude, and averaged 2 K at the vegetation surface and were estimated at 1.7 K in the planetary boundary layer. Given the spatial extent of land management (42-58% of the land surface) this calls for increasing the efforts to integrate land management in Earth System Science to better take into account the human impact on the climate

DOI

28
Mahmood R, Pielke R A, Hubbard K Get al., 2014. Land cover changes and their biogeophysical effects on climate. International Journal of Climatology, 34(4): 929-953.

DOI

29
Mahmood R, Quintanar A I, Conner Get al., 2010. Impacts of land use/land cover change on climate and future research priorities.Bulletin of the American Meteorological Society, 91(1): 37-46.Abstract No Abstract available.

DOI

30
Mao H Q, Yan X D, Xiong Zet al., 2011. Modeled impact of irrigation on regional climate in India.Acta Ecologica Sinica, 31(4): 1038-1045. (in Chinese)In order to provide food to more than six billion people,global irrigated croplands have expanded dramatically in recent decades.The role of irrigation in modifying the regional climate has been widely recognized in recent studies.India,one of the most intensely irrigated regions of the world,was selected as the simulation experiment region to determine the impact of irrigation on regional climate.Two 11-year(January,1990-December,2000) simulation experiments were conducted by using the Regional Integrated Environmental Model System(RIEMS) version 2 over Indian region:(i) Rainfed cropland(RFC) and(ii) Irrigated cropland(IGC).We discarded the first year from the January 1990-December 1990 model running as equilibration time,and reported results of the final 10 years(January 1991-December 2000) as differences between the two cases(IGC-RFC).RIEMS2.0 uses the Biosphere-Atmosphere Transfer Scheme(BATS 1e) as its land surface process scheme.In BATES 1e root zone soil moisture is set to field capacity throughout the year in the irrigated crop area,and the soil moisture is the function of rainfall,evapotranspiration,and soil feature in other non-irrigated areas.Over the 10 year time period,the temporal difference of the two regional climate model sensitivity experiments showed that a regional irrigation cooling effect exists with annual averaged 2 m air temperature decreasing 1.4 and the precipitation rate increasing 0.35mm/d at the national scale.From the spatial difference of temperature and precipitation we found that the irrigation effect on climate was not only confined to the near-surface atmosphere in irrigated grid cells,but also spread to adjacent grid cells.The irrigation cooling effect can contribute to the increased latent heat flux and decreased sensible heat flux.The increased precipitation rate depends on the offset between the positive convective rainfall and the negative large scale none-convective rainfall.The positive convective rainfall is intrigued by the two factors that can fuel deep convection,one is added water vapor and the other is a greater latent heat fluxes that result from intensified evapotranspiration because of irrigation.The large scale none-convective rainfall decreased because of the weak divergence circulation of wind field at 850hPa which weakened the water vapor transportation from the sea to India peninsula.The results of seasonal difference indicated that the climate of pre-monsoon season and June is more sensitive than monsoon season(July to September) to irrigation.The national averaged change in temperature was 3.18 in pre-monsoon season and 0.43 in monsoon season,respectively.This seasonal differences can be explained by the fact that pre-monsoon season is much drier than monsoon season.During the dry season evapotranspiration difference between irrigated cropland and rainfed cropland is greater than that of the wet season.The results of this paper are limited by the BATS treatment that sets the soil moisture as a constant to field capacity throughout the year without considering about the seasonal variation of irrigation.A much more reasonable irrigation parameterization scheme is supposed to be coupled to BATS1E.

31
Marland G, Pielke R A, Apps Met al., 2003. The climatic impacts of land surface change and carbon management, and the implications for climate-change mitigation policy.Climate Policy, 3: 149-157.lt;h2 class="secHeading" id="section_abstract">Abstract</h2><p id="">Strategies to mitigate anthropogenic climate change recognize that carbon sequestration in the terrestrial biosphere can reduce the build-up of carbon dioxide in the Earth&rsquo;s atmosphere. However, climate mitigation policies do not generally incorporate the effects of these changes in the land surface on the surface albedo, the fluxes of sensible and latent heat to the atmosphere, and the distribution of energy within the climate system. Changes in these components of the surface energy budget can affect the local, regional, and global climate. Given the goal of mitigating climate change, it is important to consider all of the effects of changes in terrestrial vegetation and to work toward a better understanding of the full climate system. Acknowledging the importance of land surface change as a component of climate change makes it more challenging to create a system of credits and debits wherein emission or sequestration of carbon in the biosphere is equated with emission of carbon from fossil fuels. Recognition of the complexity of human-caused changes in climate does not, however, weaken the importance of actions that would seek to minimize our disturbance of the Earth&rsquo;s environmental system and that would reduce societal and ecological vulnerability to environmental change and variability.</p>

DOI

32
Paeth H, Born K, Girmes Ret al., 2009. Regional climate change in tropical and Northern Africa due to greenhouse forcing and land use changes.Journal of Climate, 22: 114-132.Human activity is supposed to affect the earth s climate mainly via two processes: the emission of greenhouse gases and aerosols and the alteration of land cover. While the former process is well established in state-of-the-art climate model simulations, less attention has been paid to the latter. However, the low latitudes appear to be particularly sensitive to land use changes, especially in tropical Africa where frequent drought episodes were observed during recent decades. Here several ensembles of long-term transient climate change experiments are presented with a regional climate model to estimate the future pathway of African climate under fairly realistic forcing conditions. Therefore, the simulations are forced with increasing greenhouse gas concentrations as well as land use changes until 2050. Three different scenarios are prescribed in order to assess the range of options inferred from global political, social, and economical development. The authors find a prominent surface heating and a weakening of the hydrological cycle over most of tropical Africa, resulting in enhanced heat stress and extended dry spells. In contrast, the large-scale atmospheric circulation in upper levels is less affected, pointing to a primarily local effect of land degradation on near-surface climate. In the model study, it turns out that land use changes are primarily responsible for the simulated climate response. In general, simulated climate changes are not concealed by internal variability. Thus, the effect of land use changes has to be accounted for when developing more realistic scenarios for future African climate.

DOI

33
Peng S S, Piao S L, Ciais Pet al., 2012. Surface urban heat island across 419 global big cities.Environmental Science and Technology, 46: 696-703.Urban heat island is among the most evident aspects of human impacts on the earth system. Here we assess the diurnal and seasonal variation of surface urban heat island intensity (SUHII) defined as the surface temperature difference between urban area and suburban area measured from the MODIS. Differences in SUHII are analyzed across 419 global big cities, and we assess several potential biophysical and socio-economic driving factors. Across the big cities, we show that the average annual daytime SUHII (1.5 ± 1.2 °C) is higher than the annual nighttime SUHII (1.1 ± 0.5 °C) (P < 0.001). But no correlation is found between daytime and nighttime SUHII across big cities (P = 0.84), suggesting different driving mechanisms between day and night. The distribution of nighttime SUHII correlates positively with the difference in albedo and nighttime light between urban area and suburban area, while the distribution of daytime SUHII correlates negatively across cities with the difference of vegetation cover and acti...

DOI PMID

34
Pielke Sr R A, Marland G, Betts R Aet al., 2002. The influence of land-use change and landscape dynamics on the climate system: Relevance to climate change policy beyond the radiative effect of greenhouse gases. Philosophical Transactions of the Royal Society of London Series A: Special Theme Issue, 360: 1705-1719.

35
Pielke Sr R A, Pitman A, Niyogi Det al., 2011. Land use/land cover changes and climate: Modeling analysis and observational evidence. Wiley Interdisciplinary Reviews: Climate Change, 2(6): 828-850.

36
Pitman A J, Avila F B, Abramowitz Get al., 2011. Importance of background climate in determining impact of land-cover change on regional climate.Nature Climate Change, 1: 472-475.ABSTRACT Humans have modified the Earth’s climate through emissions of greenhouse gases and through land-use and land-cover change (LULCC)1. Increasing concentrations of greenhouse gases in the atmosphere warm the mid-latitudes more than the tropics, in part owing to a reduced snow–albedo feedback as snow cover decreases2. Higher concentration of carbon dioxide also increases precipitation in many regions1, as a result of an intensification of the hydrological cycle2. The biophysical effects of LULCC since pre-industrial times have probably cooled temperate and boreal regions and warmed some tropical regions3. Here we use a climate model to show that how snow and rainfall change under increased greenhouse gases dominates how LULCC affects regional temperature. Increased greenhouse-gas-driven changes in snow and rainfall affect the snow–albedo feedback and the supply of water, which in turn limits evaporation. These changes largely control the net impact of LULCC on regional climate. Our results show that capturing whether future biophysical changes due to LULCC warm or cool a specific region therefore requires an accurate simulation of changes in snow cover and rainfall geographically coincident with regions of LULCC. This is a challenge to current climate models, but also provides potential for further improving detection and attribution methods

DOI

37
Qu Y, Wu F, Yan H Met al., 2013. Possible influence of the cultivated land reclamation on surface climate in India: A WRF model based simulation. Advances in Meteorology, Article ID 312716.Land use/cover change (LUCC) has become one of the most important factors for the global climate change. As one of the major types of LUCC, cultivated land reclamation also has impacts on regional climate change. Most of the previous studies focused on the correlation and simulation analysis of historical LUCC and climate change, with few explorations for the impacts of future LUCC on regional climate, especially impacts of the cultivated land reclamation. This study used the Weather Research and Forecasting (WRF) model to forecast the changes of energy flux and temperature based on the future cultivated land reclamation in India and then analyzed the impacts of cultivated land reclamation on climate change. The results show that cultivated land reclamation will lead to a large amount of land conversions, which will overall result in the increase in latent heat flux of regional surface as well as the decrease in sensible heat flux and further lead to changes of regional average temperature. Furthermore, the impact on climate change is seasonally different. The cultivated land reclamation mainly leads to a temperature decrease in the summer, while it leads to a temperature increase in the winter.

DOI

38
Ramankutty N, Gibbs H K, Achard Fet al., 2007. Challenges to estimating carbon emissions from tropical deforestation.Global Change Biology, 13: 51-66.An accurate estimate of fluxes associated with tropical deforestation from the last two decades is needed to balance the global budget. Several studies have already estimated emissions from tropical deforestation, but the estimates vary greatly and are difficult to compare due to differences in data sources, assumptions, and methodologies. In this paper, we review the different estimates and datasets, and the various challenges associated with comparing them and with accurately estimating emissions from deforestation. We performed a simulation study over legal Amazonia to illustrate some of these major issues. Our analysis demonstrates the importance of considering land-cover dynamics following deforestation, including the fluxes from reclearing of secondary vegetation, the decay of product and slash pools, and the fluxes from regrowing forest. It also suggests that accurate -flux estimates will need to consider historical land-cover changes for at least the previous 20 years. However, this result is highly sensitive to estimates of the partitioning of cleared into instantaneous burning vs. long-timescale slash pools. We also show that flux estimates based on 'committed flux' calculations, as used by a few studies, are not comparable with the 'annual balance' calculation method used by other studies.

DOI

39
Sampaio G, Nobre C, Costa M Het al., 2007. Regional climate change over eastern Amazonia caused by pasture and soybean cropland expansion. Geophysical Research Letters, 34(17).1] Field observations and numerical studies revealed that large scale deforestation in Amazonia could alter the regional climate significantly, projecting a warmer and somewhat drier post-deforestation climate. In this study we employed the CPTEC-INPE AGCM to assess the effects of Amazonian deforestation on the regional climate, using simulated land cover maps from a business-as-usual scenario of future deforestation in which the rainforest was gradually replaced by degraded pasture or by soybean cropland. The results for eastern Amazonia, where changes in land cover are expected to be larger, show increase in near-surface air temperature, and decrease in evapotranspiration and precipitation, which occurs mainly during the dry season. The relationship between precipitation and deforestation shows an accelerating decrease of rainfall for increasing deforestation for both classes of land use conversions. Continued expansion of cropland in Amazonia is possible and may have important consequences for the sustainability of the region's remaining natural vegetation.

DOI

40
Shao Q Q, Sun C Y, Liu J Yet al., 2011. Impact of urban expansion on meteorological observation data and overestimation to regional air temperature in China.Journal of Geographical Sciences, 21(6): 994-1006.Since the implementation of the reform and opening up policy in China in the late 1970s, some meteorological stations 'entered' cities passively due to urban expansion. Changes in the surface and built environment around the stations have influenced observations of air temperature. When the observational data from urban stations are applied in the interpolation of national or regional scale air temperature dataset, they could lead to overestimation of regional air temperature and inaccurate assessment of warming. In this study, the underlying surface surrounding 756 meteorological stations across China was identified based on remote sensing images over a number of time intervals to distinguish the rural stations that 'entered' into cities. Then, after removing the observational data from these stations which have been influenced by urban expansion, a dataset of background air temperatures was generated by interpolating the observational data from the remaining rural stations. The mean urban heat island effect intensity since 1970 was estimated by comparing the original observational records from urban stations with the background air temperature interpolated. The result shows that urban heat island effect does occur due to urban expansion, with a higher intensity in winter than in other seasons. Then the overestimation of regional air temperature is evaluated by comparing the two kinds of grid datasets of air temperature which are respectively interpolated by all stations' and rural stations' observational data. Spatially, the overestimation is relatively higher in eastern China than in the central part of China; however, both areas exhibit a much higher effect than is observed in western China. We concluded that in the last 40 years the mean temperature in China increased by about 1.58A degrees C, of which about 0.01A degrees C was attributed to urban expansion, with a contribution of up to 0.09A degrees C in the core areas from the overestimation of air temperature.

DOI

41
Shi Q L, Lin Y Z, Zhang E Pet al., 2013. Impacts of cultivated land reclamation on the climate and grain production in Northeast China in the future 30 years. Advances in Meteorology, Article ID 853098.China, as a large agricultural country as well as a major country with great demand for grain, has played a more and more important role in the international grain market. As Northeast China is one of the major commodity grain bases in China as well as one of the regions with the highest intensity of human activities, it plays an important role in influencing the global food security. This study first generally analyzed the cultivated land reclamation and the climate change of temperature and precipitation in Northeast China during 2000-2010. Then, on the basis of these data, the climatic effects of cultivated land reclamation in Northeast China during 2030-2040 were simulated by the weather research forecast (WRF) model. Finally, the possible effects of the climate change on the grain yield and the potential influence on the food security were analyzed. The simulation result indicated that the temperature in Northeast China would be increasing on the whole, while the precipitation would be decreasing. The result of this study can provide some theoretical support to the agricultural economic development in Northeast China and serve the national macropolicy and food security strategy of the whole China.

DOI

42
Shi W J, Tao F L, Liu J Y, 2014. Regional temperature change over the Huang-Huai-Hai Plain: The roles of irrigation versus urbanization. International Journal of Climatology, 34(4): 1181-1195.

DOI

43
Wang M N, Yan X D, Liu J Yet al., 2013a. The contribution of urbanization to recent extreme heat events and a potential mitigation strategy in the Beijing-Tianjin-Hebei metropolitan area.Theoretical and Applied Climatology, 114: 407-416.

44
Wang M N, Zhang X Z, Yan X D, 2013b. Modeling the climatic effects of urbanization in the Beijing-Tianjin-Hebei metropolitan area.Theoretical and Applied Climatology, 113: 377-385.

45
Wang Y, Yan X D, 2013a. Climate responses to historical land cover changes.Climate Research, 56: 147-155.This study assessed the biogeophysical effects of land cover change on climate using MPM-2 during the past millennium. Simulations based on the Climate and Environmental Retrieval and Archive (CERA) land cover dataset were carried out to equilibrium from AD 800 to 2000 after a spin-up time of 5300 yr. We concluded that there was a cooling biogeophysical effect of about 0.13 degrees C in global mean annual temperature in response to historical deforestation, with a maximum cooling of 0.5 degrees C over Eurasia and a minimum cooling of 0.02 degrees C at low latitudes over the Southern Hemisphere. Much larger contrasts were found on a seasonal scale, while these changes were largely offset on an annual scale. Seasonally, cooling occurred in the middle northern latitudes and warming occurred in the low southern latitudes due to historical deforestation. The effect of land cover change was most pronounced over Eurasia, with a maximum cooling of approximately 0.8 degrees C at middle latitudes during summer and a maximum warming of 0.1 degrees C at low latitudes over the Southern Hemisphere during the Northern Hemisphere summer, owing to the changes in albedo and precipitation. These results suggest that changes in land cover triggered a chain of feedbacks in the climate system, and they highlight the need for further research in this area.

DOI

46
Wang Y, Yan X D, Wang Z M, 2013b. Simulation of the influence of historical land cover changes on the global climate.Annales Geophysicae, 31: 995-1004.In order to estimate biogeophysical effects of historical land cover change on climate during last three centuries, a set of experiments with a climate system model of intermediate complexity (MPM-2) is performed. In response to historical deforestation, the model simulates a decrease in annual mean global temperature in the range of 0.07-0.14 degrees C based on different grassland albedos. The effect of land cover changes is most pronounced in the middle northern latitudes with maximum cooling reaching approximately 0.6 degrees C during northern summer. The cooling reaches 0.57 degrees C during northern spring owing to the large effects of land surface albedo. These results suggest that land cover forcing is important for study on historical climate change and that more research is necessary in the assessment of land management options for climate change mitigation.

DOI

47
Xu Q, Jiang Q, Cao Ket al., 2013. Scenario-based analysis on the structural change of land uses in China. Advances in Meteorology, Article ID 919013.Land Use/Land Cover change (LUCC) is a key aspect of global environmental change, which has a significant impact on climate change. In the background of increasing global warming resulting from greenhouse effect, to understand the impact of land use change on climate change is necessary and meaningful. In this study, we choose China as the study area and explore the possible land use change trends based on the AgLU module and ERB module of global change assessment model (GCAM model and Global Change Assessment Model). We design three scenarios based on socioeconomic development and simulated the corresponding structure change of land use according to the three scenarios with different parameters. Then we simulate the different emission of CO2 under different scenarios based on the simulation results of structure change of land use. At last, we choose the most suitable scenario that could control the emission of CO2 best and obtain the relatively better land use structure change for adaption of climate change. Through this research we can provide a theoretical basis for the future land use planning to adapt to climate change.

DOI

48
Yan J W, Chen B Z, Feng Met al., 2013. Research on land surface thermal-hydrologic exchange in southern China under future climate and land cover scenarios. Advances in Meteorology, Article ID 969145.Climate change inevitably leads to changes in hydrothermal circulation. However, thermal-hydrologic exchanging caused by land cover change has also undergone ineligible changes. Therefore, studying the comprehensive effects of climate and land cover changes on land surface water and heat exchanges enables us to well understand the formation mechanism of regional climate and predict climate change with fewer uncertainties. This study investigated the land surface thermal-hydrologic exchange across southern China for the next 40 years using a land surface model (ecosystem-atmosphere simulation scheme (EASS)). Our findings are summarized as follows. (i) Spatiotemporal variation patterns of sensible heat flux (H) and evapotranspiration (ET) under the land cover scenarios (A2a or B2a) and climate change scenario (A1B) are unanimous. (ii) Both H and ET take on a single peak pattern, and the peak occurs in June or July. (iii) Based on the regional interannual variability analysis, H displays a downward trend (10%) and ET presents an increasing trend (15%). (iv) The annual average H and ET would, respectively, increase and decrease by about 10% when woodland converts to the cultivated land. Through this study, we recognize that land surface water and heat exchanges are affected greatly by the future climate change as well as land cover change.

DOI

49
Yan J W, Liu J Y, Chen B Zet al., 2014. Changes in the land surface energy budget in eastern China over the past three decades: Contributions of land-cover change and climate change.Journal of Climate, 27: 9233-9252.

50
Zhai J, Liu R G, Liu J Yet al., 2014. Radiative forcing over China due to albedo change caused by land cover change during 1990-2010. Journal of Geographical Sciences, 24(5): 789-801.<p>Land cover change affects surface radiation budget and energy balance by changing surface albedo and further impacts the regional and global climate. In this article, high spatial and temporal resolution satellite products were used to analyze the driving mechanism for surface albedo change caused by land cover change during 1990-2010. In addition, the annual-scale radiative forcing caused by surface albedo changes in China's 50 ecological regions were calculated to reveal the biophysical mechanisms of land cover change affecting climate change at regional scale. Our results showed that the national land cover changes were mainly caused by land reclamation, grassland desertification and urbanization in past 20 years, which were almost induced by anthropogenic activities. Grassland and forest area decreased by 0.60% and 0.11%, respectively. The area of urban and farmland increased by 0.60% and 0.19%, respectively. The mean radiative forcing caused by land cover changes during 1990-2010 was 0.062 W/m<sup>2</sup> in China, indicating a warming climate effect. However, spatial heterogeneity of radiative forcing was huge among different ecological regions. Farmland conversing to urban construction land, the main type of land cover change for the urban and suburban agricultural ecological region in Beijing-Tianjin-Tangshan region, caused an albedo reduction by 0.00456 and a maximum positive radiative forcing of 0.863 W/m<sup>2</sup> which was presented as warming climate effects. Grassland and forest conversing to farmland, the main type of land cover change for the temperate humid agricultural and wetland ecological region in Sanjiang Plain, caused an albedo increase by 0.00152 and a maximum negative radiative forcing of 0.184 W/m<sup>2</sup> implying cooling climate effects.</p>

DOI

51
Yue T X, Fan Z M, Chen C Fet al., 2011. Surface modelling of global terrestrial ecosystems under three climate change scenarios.Ecological Modelling, 222(14): 2342-2361.A high accuracy and speed method (HASM) of surface modelling is developed to find a solution for error problem and to improve computation speed. A digital elevation model (DEM) is established on spatial resolution of 13.5 km x 13.5 km. Regression formulations among temperature, elevation and latitude are simulated in terms of data from 2766 weather observation stations scattered over the world by using the 13.5 km x 13.5 km DEM as auxiliary data. Three climate scenarios of HadCM3 are refined from spatial resolution of 405 km x 270 km to 13.5 km x 13.5 km in terms of the regression formulations. HASM is employed to simulate surfaces of mean annual bio-temperature, mean annual precipitation and potential evapotranspiration ratio during the periods from 1961 to 1990(T(1)), from 2010 to 2039 (T(2)), from 2040 to 2069 (T(3)), and from 2070 to 2099 (T(4)) on spatial resolution of 13.5 km x 13.5 km. Three scenarios of terrestrial ecosystems on global level are finally developed on the basis of the simulated climate surfaces. The scenarios show that all polar/nival, subpolar/alpine and cold ecosystem types would continuously shrink and all tropical types, except tropical rain forest in scenario A1Fi, would expand because of the climate warming. Especially at least 80% of moist tundra and 22% of nival area might disappear in period T(4) comparing with the ones in the period T(1). Tropical thorn woodland might increase by more than 97%. Subpolar/alpine moist tundra would be the most sensitive ecosystem type because its area would have the rapidest decreasing rate and its mean center would shift the longest distance towards west. Subpolar/alpine moist tundra might be able to serve as an indicator of climatic change. In general, climate change would lead to a continuous reduction of ecological diversity. (C) 2010 Elsevier B.V. All rights reserved.

DOI

52
Zhang F, Li X, Wang W Met al., 2013a. Impacts of future grassland changes on surface climate in Mongolia. Advances in Meteorology, Article ID 263746.Climate change caused by land use/cover change (LUCC) is becoming a hot topic in current global change, especially the changes caused by the grassland degradation. In this paper, based on the baseline underlying surface data of 1993, the predicted underlying surface data which can be derived through overlaying the grassland degradation information to the map of baseline underlying surface, and the atmospheric forcing data of RCP 6.0 from CMIP5, climatological changes caused by future grassland changes for the years 2010-2020 and 2040-2050 with the Weather Research Forecast model (WRF) are simulated. Themodel-based analysis shows that future grassland degradation will significantly result in regional climate change. The grassland degradation in future could lead to an increasing trend of temperature in most areas and corresponding change range of the annual average temperature of -0.1 degrees C-0.4 degrees C, and it will cause a decreasing trend of precipitation and corresponding change range of the annual average precipitation of 10 mm-50 mm. This study identifies lines of evidence for effects of future grassland degradation on regional climate in Mongolia which provides meaningful decision-making information for the development and strategy plan making in Mongolia.

DOI

53
Zhang T, Zhan J Y, Wu Fet al., 2013b. Regional climate variability responses to future land surface forcing in the Brazilian Amazon. Advances in Meteorology, Article ID 852541.Tropical deforestation could destabilize regional climate changes. This paper aimed to model the potential climatological variability caused by future forest vulnerability in the Brazilian Amazon over the 21th century. The underlying land surface changes between 2005 and 2100 are first projected based on the respectable output produced by Hurtt et al. Then the weather research and forecasting (WRF) model is applied to assess the impacts of future deforestation on regional climate during 2090-2100. The study results show that the forests in the Brazilian Amazon will primarily be converted into dryland cropland and pasture in the northwest part and into cropland/woodland mosaic in the southeast part, with 5.12% and 13.11%, respectively. These land surface changes will therefore lead to the significant reduction of the sum of sensible heat flux and latent heat flux and precipitation and the increase of the surface temperature. Furthermore, the variability of surface temperature is observed with close link to the deforested areas.

DOI

54
Zhang X Z, Tang Q H, Zheng J Yet al., 2013c. Warming/cooling effects of cropland greenness changes during 1982-2006 in the North China Plain.Environmental Research Letters, 8, 024038. doi: 10.1088/1748-9326/8/2/ 024038.Radiation effects; Cooling; Drying; Heat flux; Transpiration; Wetting

DOI

55
Zhang Z X, Wang X, Zhao X Let al., 2014. A 2010 update of national land use/cover database of China at 1:100000 scale using medium spatial resolution satellite images.Remote Sensing of Environment, 149: 142-154.

56
Zhao L, Lee X, Smith R Bet al., 2014. Strong contributions of local background climate to urban heat islands.Nature, 511: 216-219.The urban heat island (UHI), a common phenomenon in which surface temperatures are higher in urban areas than in surrounding rural areas, represents one of the most significant human-induced changes to Earth's surface climate. Even though they are localized hotspots in the landscape, UHIs have a profound impact on the lives of urban residents, who comprise more than half of the world's population. A barrier to UHI mitigation is the lack of quantitative attribution of the various contributions to UHI intensity (expressed as the temperature difference between urban and rural areas, ΔT). A common perception is that reduction in evaporative cooling in urban land is the dominant driver of ΔT (ref. 5). Here we use a climate model to show that, for cities across North America, geographic variations in daytime ΔT are largely explained by variations in the efficiency with which urban and rural areas convect heat to the lower atmosphere. If urban areas are aerodynamically smoother than surrounding rural areas, urban heat dissipation is relatively less efficient and urban warming occurs (and vice versa). This convection effect depends on the local background climate, increasing daytime ΔT by 3.002±020.302kelvin (mean and standard error) in humid climates but decreasing ΔT by 1.502±020.202kelvin in dry climates. In the humid eastern United States, there is evidence of higher ΔT in drier years. These relationships imply that UHIs will exacerbate heatwave stress on human health in wet climates where high temperature effects are already compounded by high air humidity and in drier years when positive temperature anomalies may be reinforced by a precipitation-temperature feedback. Our results support albedo management as a viable means of reducing ΔT on large scales.

DOI PMID

Outlines

/