
Journal of Geographical Sciences >
Mapping and ranking global mortality, affected population and GDP loss risks for multiple climatic hazards
Author: Shi Peijun (1959-), PhD and Professor, specialized in natural hazards, global environmental change, insurance, risk governance, natural resources, and land use policy. E-mail: spj@bnu.edu.cn
Received date: 2015-12-23
Accepted date: 2016-03-15
Online published: 2016-07-25
Supported by
The Innovative Research Group Project of National Natural Science Foundation of China, No.41321001
The National Basic Research Program (973 Program), No.2012CB955404
The Program for Introducing Talents of Disciplines to Universities funded by the Ministry of Education and State Administration of Foreign Experts Affairs, China, No.B08008
Copyright
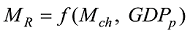
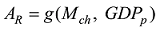
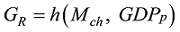
Coping with extreme climate events and its related climatic disasters caused by climate change has become a global issue and drew wide attention from scientists, policy-makers and public. This paper calculated the expected annual multiple climatic hazards intensity index based on the results of nine climatic hazards including tropical cyclone, flood, landslide, storm surge, sand-dust storm, drought, heat wave, cold wave and wildfire. Then a vulnerability model involving the coping capacity indicator with mortality rate, affected population rate and GDP loss rate, was developed to estimate the expected annual affected population, mortality and GDP loss risks. The results showed that: countries with the highest risks are also the countries with large population or GDP. To substantially reduce the global total climatic hazards risks, these countries should reduce the exposure and improving the governance of integrated climatic risk; Without considering the total exposure, countries with the high mortality rate, affected population rate or GDP loss rate, which also have higher or lower coping capacity, such as the Philippines, Bangladesh and Vietnam, are the hotspots of the planning and strategy making for the climatic disaster risk reduction and should focus on promoting the coping capacity.
SHI Peijun , YANG Xu , FANG Jiayi , WANG Jing’ai , XU Wei , HAN Guoyi . Mapping and ranking global mortality, affected population and GDP loss risks for multiple climatic hazards[J]. Journal of Geographical Sciences, 2016 , 26(7) : 878 -888 . DOI: 10.1007/s11442-016-1304-1
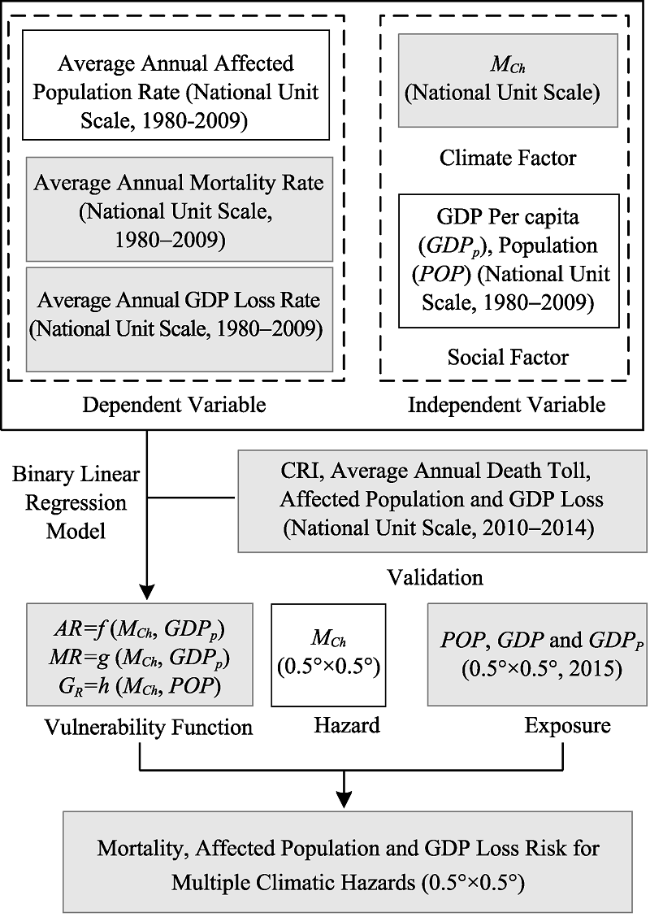
Figure 1 Technical flowchart for calculating the global affected population, mortality and GDP loss risks for multiple climatic hazards |
Table 1 Sources and descriptions of the data |
| Dataset | Data source | Resolution | Time |
|---|---|---|---|
| Climatic Hazards Intensity Indexes | World Atlas of Natural Disaster Risk (Shi and Kasperson, 2015) | 0.5°×0.5° | Annual expectation |
| Global Climate Risk Index (CRI) | German Federal Ministry for Economic Cooperation and Development (BMZ) Germanwatch Program | Country unit | 1994-2013 |
| Lack of Coping Capacity Index (LCCI) | European Commission’s Joint Research Centre (JRC) INFORM model | Country unit | 2015 |
| Death Toll and Affected Population | Emergency Events Database (EM-DAT) | Country unit | 1980 - 2014 |
| Population and GDP density (Grid unit) | Greenhouse Gas Initiative (GGI) Program of the International Institute for Applied Systems Analysis (IIASA) | 0.5°×0.5° | 2000, 2010 and 2020* |
| Total Population and GDP (Country unit) | World Bank | Country unit | 1980-2014 |
*Note: In the GGI database, the time interval of population and GDP density data is ten years, therefore the population and GDP density data in 2015 is represented by the average values of 2010 and 2020. These density data have converted to the population data and GDP data before we used it to calculate, map or rank the risks. |
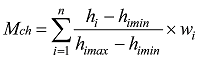
Table 2 Hazard intensity index and weights of each hazard when calculating Mch (Shi and Kasperson, 2014) |
| i | Climatic hazards | Expected annual intensity index* | Weight (%) |
|---|---|---|---|
| 1 | Flood | Expected annual accumulated three-day extreme precipitation (mm) | 45.21 |
| 2 | Tropic cyclone | Expected annual speed of 3s gust wind (m/s) | 36.89 |
| 3 | Landslide | Expected annual landslide hazard index | 6.96 |
| 4 | Drought (maize) | Expected annual normalized cumulative water stress index during the crop’s growing season | 2.51 |
| Drought (wheat) | 0.63 | ||
| Drought (rice) | 2.09 | ||
| 5 | Heat wave | Expected annual maximum temperature (°C) | 1.74 |
| 6 | Cold wave | Expected annual largest temperature drop (°C) | 1.61 |
| 7 | Wildfire (forest) | Expected annual ignition probability of forest wildfire (%) | 1.03 |
| Wildfire(grassland) | Expected annual ignition probability of grassland wildfire (%) | 0.61 | |
| 8 | Storm surges | Expected annual maximum inundation area (km2) | 0.51 |
| 9 | Sand-dust storm | Expected annual energy of sand-dust storm (J/m3) | 0.22 |
*Note: The expected annual intensity index is an absolute value outputted at grid unit (0.5°×0.5°), which can be calculated by hazard intensity value in different return period or the analysis of historical disaster data. e.g., the expected annual accumulated three-day extreme precipitation of flood is calculated by the extreme value analysis of global daily precipitation data; the expected annual speed of 3s gust wind of tropic cyclone is calculated by the historical disaster data analysis using Gumbel distribution; the equation to calculate the expected annual landslide hazard index is I=12.45D-0.42, where D is the rainfall duration (h). (Hong et al., 2006); the equation to calculate the expected annual normalized cumulative water stress index during the crop’s growing season is |


 is the average value of the country or region.
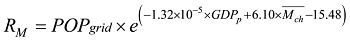
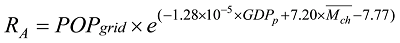
Figure 2 Global expected annual mortality rate for multiple climatic hazards |
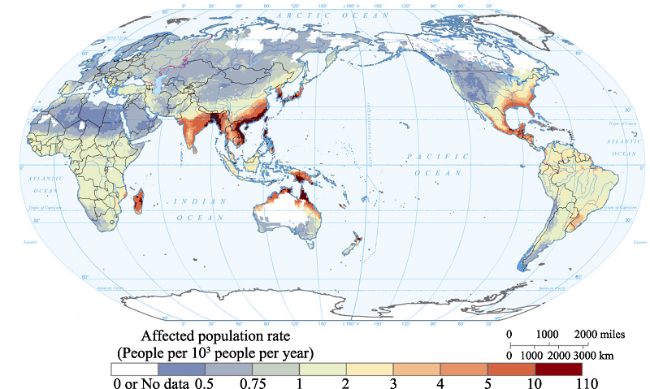
Figure 3 Global expected annual affected population rate for multiple climatic hazards |
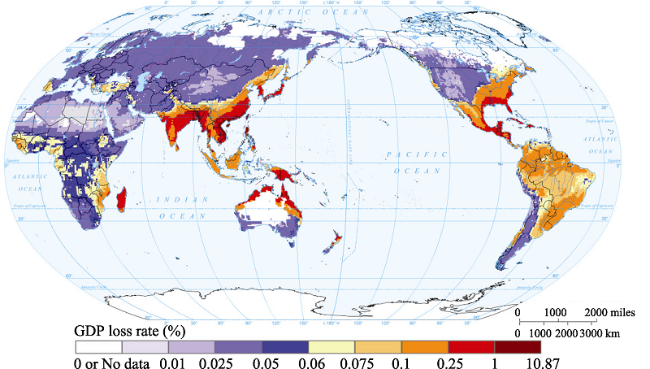
Figure 4 Global expected annual GDP loss rate for multiple climatic hazards |
Table 3 Top 15 countries with the highest expected annual mortality rate, affected population rate and GDP loss rate for multiple climatic hazards |
| Expected annual mortality rate | Expected annual affected population rate | Expected annual GDP loss rate | ||||||
|---|---|---|---|---|---|---|---|---|
| Rank | Country | Per million people per year | Rank | Country name | Per thousand people per year | Rank | Country | Per year (%) |
| 1 | Philippines | 6.87 | 1 | Philippines | 31.55 | 1 | Philippines | 7.53 |
| 2 | Bangladesh | 4.16 | 2 | Bangladesh | 16.14 | 2 | Bangladesh | 3.05 |
| 3 | Vietnam | 3.56 | 3 | Vietnam | 13.83 | 3 | Vietnam | 2.68 |
| 4 | Laos | 2.61 | 4 | Laos | 9.49 | 4 | Bhutan | 1.66 |
| 5 | South Korea | 2.47 | 5 | South Korea | 8.98 | 5 | New Caledonia | 1.66 |
| 6 | Madagascar | 2.40 | 6 | New Caledonia | 8.91 | 6 | Lao PDR | 1.62 |
| 7 | Belize | 2.38 | 7 | Belize | 8.49 | 7 | Korea, Rep. | 1.62 |
| 8 | New Caledonia | 2.38 | 8 | Madagascar | 8.47 | 8 | Japan | 1.60 |
| 9 | Dominican Republic | 2.08 | 9 | Japan | 8.13 | 9 | Madagascar | 1.53 |
| 10 | Japan | 2.08 | 10 | Dominican Republic | 7.19 | 10 | Belize | 1.50 |
| 11 | Burma | 2.02 | 11 | Burma | 7.08 | 11 | China | 1.33 |
| 12 | Papua New Guinea | 1.88 | 12 | Papua New Guinea | 6.40 | 12 | Dominican Republic | 1.24 |
| 13 | Guatemala | 1.76 | 13 | Bhutan | 6.09 | 13 | Myanmar | 1.16 |
| 14 | Bhutan | 1.75 | 14 | Guatemala | 5.86 | 14 | Papua New Guinea | 1.12 |
| 15 | North Korea | 1.60 | 15 | China | 5.44 | 15 | Guatemala | 0.94 |
Table 4 Top 15 countries with the highest total expected annual mortality risk, affected population risk and GDP loss risk for multiple climatic hazards |
| Total expected annual mortality risk | Total expected annual affected population risk | Total expected annual GDP loss risk | ||||||
|---|---|---|---|---|---|---|---|---|
| Rank | Country | People Per year | Rank | Country Name | Million people per Year | Rank | Country | Billion USD Per year |
| 1 | India | 2194 | 1 | China | 7.89 | 1 | China | 75.85 |
| 2 | China | 2181 | 2 | India | 7.25 | 2 | Japan | 74.93 |
| 3 | Bangladesh | 927 | 3 | Bangladesh | 3.60 | 3 | United States | 49.14 |
| 4 | Philippines | 726 | 4 | Philippines | 3.34 | 4 | Philippines | 23.47 |
| 5 | Vietnam | 374 | 5 | Vietnam | 1.46 | 5 | India | 11.57 |
| 6 | United States | 243 | 6 | Japan | 0.95 | 6 | Korea, Rep. | 5.96 |
| 7 | Japan | 242 | 7 | United States | 0.79 | 7 | Mexico | 4.08 |
| 8 | Indonesia | 181 | 8 | Indonesia | 0.51 | 8 | Brazil | 3.73 |
| 9 | Brazil | 156 | 9 | Mexico | 0.47 | 9 | Vietnam | 3.72 |
| 10 | Mexico | 152 | 10 | South Korea | 0.46 | 10 | Bangladesh | 2.90 |
| 11 | South Korea | 126 | 11 | Brazil | 0.44 | 11 | Indonesia | 2.52 |
| 12 | Burma | 125 | 12 | Burma | 0.44 | 12 | Thailand | 2.46 |
| 13 | Pakistan | 122 | 13 | Thailand | 0.33 | 13 | Germany | 2.36 |
| 14 | Nigeria | 110 | 14 | Pakistan | 0.32 | 14 | Myanmar | 2.13 |
| 15 | Thailand | 104 | 15 | Nigeria | 0.29 | 15 | France | 1.87 |
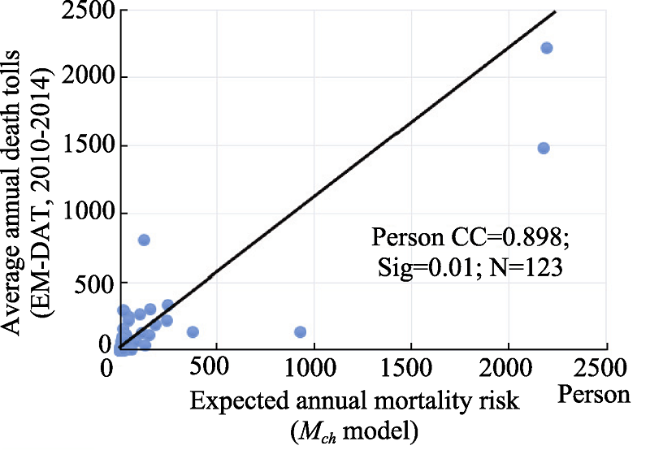
Figure 5 Comparison of the expected annual mortality risk (model) and the historical disaster data in EM-DAT |
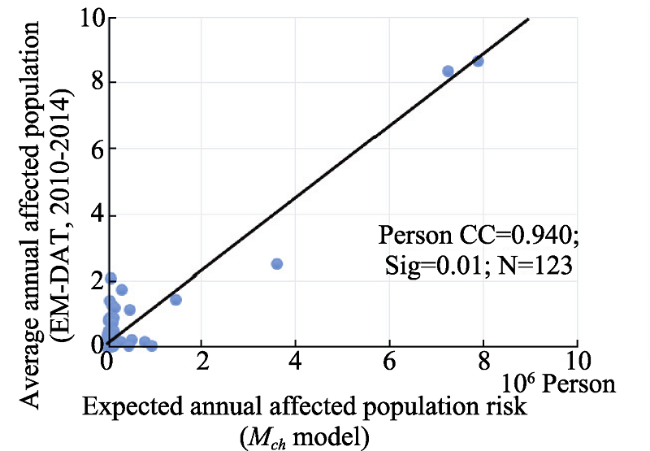
Figure 6 Comparison of the expected annual affected population risk (model) and the historical disaster data in EM-DAT |
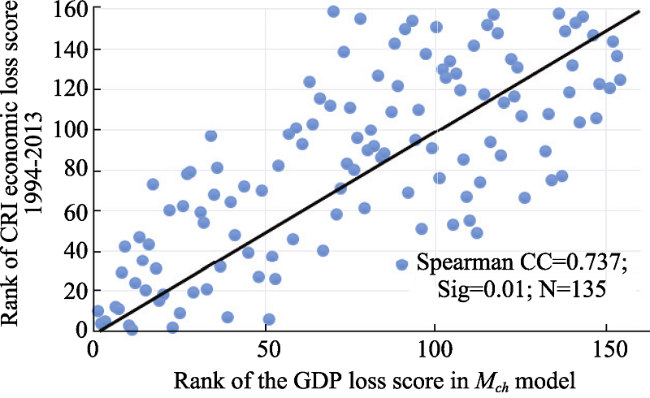
Figure 7 Comparison of the rank of CRI economic loss score and the rank of the GDP loss score in model |
The authors have declared that no competing interests exist.
| 1 |
|
| 2 |
|
| 3 |
|
| 4 |
Emergency Events Database (EM-DAT), .
|
| 5 |
Europe Commission Joint Research Centre (JRC), 2014. Index for Risk Management-INFORM. Luxembourg: EU
|
| 6 |
|
| 7 |
|
| 8 |
|
| 9 |
Intergovernmental Panel on Climate Change (IPCC). 2012. IPCC Special Report on Managing the Risks of Extreme Events and Disasters to Advance Climate Change Adaptation (SREX). Cambridge: Cambridge University Press.
|
| 10 |
IPCC, 2014: Summary for policymakers. In: Climate Change 2014: Impacts, Adaptation, and Vulnerability. UNEP.
|
| 11 |
International Strategy for Disaster Reduction, 2004. Living with Risk: A Global Review of Disaster Reduction Initiatives (United Nations, New York).
|
| 12 |
|
| 13 |
|
| 14 |
|
| 15 |
|
| 16 |
|
| 17 |
|
| 18 |
|
| 19 |
United Nations Development Programme (UNDP), 2004. Reducing Disaster Risk: A Challenge for Development. New York: UNDP.
|
| 20 |
United Nations University Institute for Environment and Human Security (UNU-EHS), 2013. World Risk Report (2013).
|
| 21 |
United Nations International Strategy for Disaster Reduction (UNISDR). 2015. Sendai framework for disaster risk reduction 2015-2030. A/CONF.224/CRP.1. Geneva: UNISDR.
|
| 22 |
. Accessed on 26 January 2016.
|
| 23 |
World Meteorological Organization (WMO), 2013. Reducing and managing risks of disasters in a changing climate.WMO Bulletin, 62(Special Issue): 23-31.
|
| 24 |
|
| 25 |
|
/
| 〈 |
|
〉 |
 where HI is the expected annual normalized cumulative water stress index; WSi is the water stress value on the i day; n is the number of days affected by water stress within the growing season; the expected annual maximum temperature and expected annual largest temperature drop are calculated by the historical disaster data analysis using Weibull distribution; the expected annual ignition probability of grassland wildfire is calculated by the historical disaster data analysis using binomial distribution; the expected annual ignition probability of forest wildfire, the expected annual maximum inundation area of storm surges and the expected annual energy of sand-dust storm are calculated by the fuzzy mathematics using the method of information diffusion(
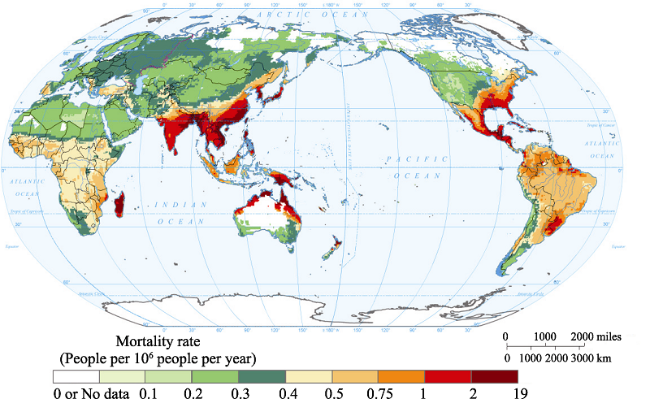