Orginal Article

Implications of mass elevation effect for the altitudinal patterns of global ecology

  • ZHANG Baiping , 1, 2 ,
  • *YAO Yonghui , 1
Expand
  • 1. State Key Laboratory of Resources and Environment Information System, Institute of Geographic Sciences and Natural Resources Research, CAS, Beijing 100101, China
  • 2. Jiangsu Center for Collaborative Innovation in Geographical Information Resource Development and Application, Nanjing 210023, China

Author: Zhang Baiping, Professor, specialized in physical geography and applied GIS. E-mail:

*Corresponding author: Yao Yonghui, Associate Professor, E-mail:

Received date: 2016-03-09

  Accepted date: 2016-03-30

  Online published: 2016-07-25

Supported by

National Natural Science Foundation of China, No.41421001, No.41571099, No.41030528

Copyright

Journal of Geographical Sciences, All Rights Reserved

Abstract

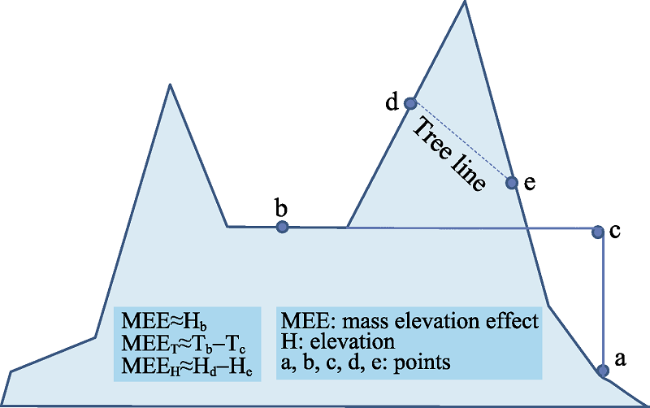
The varied altitudinal gradient of climate and vegetation is further complicated by mass elevation effect (MEE), especially in high and extensive mountain regions. However, this effect and its implications for mountain altitudinal belts have not been well studied until recently. This paper provides an overview of the research carried out in the past 5 years. MEE is virtually the heating effect of mountain massifs and can be defined as the temperature difference on a given elevation between inside and outside of a mountain mass. It can be digitally modelled with three factors of intra-mountain base elevation (MBE), latitude and hygrometric continentality; MBE usually acts as the primary factor for the magnitude of MEE and, to a great extent, could represent MEE. MEE leads to higher treelines in the interior than in the outside of mountain masses. It makes montane forests to grow at 4800-4900 m and snowlines to develop at about 6000 m in the southern Tibetan Plateau and the central Andes, and large areas of forests to live above 3500 m in a lot of high mountains of the world. The altitudinal distribution of global treelines can be modelled with high precision when taking into account MEE and the result shows that MEE contributes the most to treeline distribution pattern. Without MEE, forests could only develop upmost to about 3500 m above sea level and the world ecological pattern would be much simpler. The quantification of MEE should be further improved with higher resolution data and its global implications are to be further revealed.

Cite this article

ZHANG Baiping , *YAO Yonghui . Implications of mass elevation effect for the altitudinal patterns of global ecology[J]. Journal of Geographical Sciences, 2016 , 26(7) : 871 -877 . DOI: 10.1007/s11442-016-1303-2

Our ecological world is extremely rich and varied. Complexity in ecology is of at least six distinct types: spatial, temporal, structural, process, behavioral, and geometric (Loehle, 2004), and any of these types has only been partially understood and, thus, deserves wide and thorough studies. Studies of classification and mapping of global climate and vegetation have provided us a relatively full but broad-brush view of the world ecology, and basic relationship between climate and vegetation has been explored (Köppon, 1920; Holdridge, 1947; Walter, 1979; Bailey and Hogg, 1986; Barry, 2008). Latitudinal patterns of montane altitudinal (vegetation) belts have also been outlined (Hermes, 1955; Troll, 1973; Miehe et al., 2007; Körner, 2012), and one of the most striking ecological phenomena is the occurrence of extremely high treelines (4800 m or so above sea level) and snowlines (6000 m above sea level) at about northern latitude 30° and southern latitude 20°. In comparison, treelines are at only about 3500 m even in equatorial mountains, e.g., 3400-3700 m at Mount Kinabalu of Malaysia (Kitayama, 1992) and about 3400-3500 m in the Kilimanjaro in Tanzania (Malyshev, 1993; Bussmann, 2006). Although there exists indeed a trend for the treeline and snowline to rise from polar to equatorial areas and from continental rims to inland areas (Zhang and Zhao, 2014), these extremely high treelines and snowlines completely disrupt the overall global ecological pattern. This is truly a significant event in the altitudinal distribution of world ecosystems. Ecologically, treelines were often correlated with some isotherms, e.g., warmest month temperature of 10℃ (Brockmann, 1919; Daubenmire, 1954; Grace, 1977; Ohsawa, 1990), annual biotemperature of 3℃(Holdridge, 1947, 1967), warmth index of 15℃·month (Kira, 1945; Ohsawa, 1990; Fang et al., 1996), seasonal mean ground temperature of 6.7℃±0.8℃ or 6.4℃±0.7℃ (Körner and Riedl, 2012; Paulsen and Körner, 2014), etc. But, what factors push the treelines or related isotherms upwards to so high elevations? The heating effect of immense mountains may easily come to mind. There was a German term “Massenerhebungseffekt” (in English, mass elevation effect) used to denote the heating effect and the resulting higher treelines in the interior of large mountains. This paper tries to quantify this effect and show its significances for the altitudinal patterns of global ecology.

1 Mass elevation effect (MEE): conceptual model

The concept of MEE was first introduced by A. de Quervain in 1904 to account for the observed tendency for temperature-related parameters such as treeline and snowline to occur at higher elevations in the central Alps than on their outer margins (Quervain, 1904). The occurrence of physiognomically and sometimes floristically similar vegetation types at higher altitudes on large mountain masses than on small isolated peaks and even islands are also regarded as MEE (Grub,1971; Barry, 2008; Leuschner, 1996; Flenley, 2007). Steenis (1961) even considered as “MEE” the difference between the lowest distribution height of a species and the necessary height for the species to occur at. The much higher elevation of the same type of altitudinal belts in the interior than in the outsides of the Tibetan Plateau was attributed to MEE (Zheng, 2000).
MEE is essentially the results of the thermodynamic effect of mountain masses (Schroeter, 1908). It leads to higher temperature in the interior than in the outside of mountain masses on the same elevations and at similar latitudes. The most prominent example is the lofty Tibetan Plateau (averagely 4500 m), which acts as a “hot source”, especially in warm seasons of the year. For example, at an elevation of the mean elevation of the plateau, the monthly mean temperature differences between the plateau and the Sichuan Basin range from 3.58℃ for April to 6.63℃ for June (Yao and Zhang, 2015). Temperature difference between inside and outside of a mountain mass is essential for MEE and has been defined as the real value of MEE (Zhang and Yao, 2015). Higher limits of the same type of altitudinal belts in the inside than in the outside are the result of MEE, and the vertical difference is proportional to MEE. To a great extent, the intra-mountain base elevation (MBE) could represent MEE, for it is closely related with MEE (Han et al., 2011; Zhang and Yao, 2015). In other words, MEE, height difference in altitudinal belts between inside and outside, and the intra-mountain base elevation are all closely related. They all can indicate the magnitude of MEE, to varied degrees (Figure 1).
Figure 1 A conceptual model of mass elevation effect

2 The digital model of mass elevation effect

As defined above, MEE is virtually the temperature difference on a given elevation between inside and outside of a lofty mountain mass. We have calculated MEE for the main mountain ranges or plateaus of the world, namely, the Tibetan Plateau, the Alps, Scandinavia, the Rocky Mountains, the Andes, and the New Zealand Mountains (Zhang and Yao, 2015; Yao and Zhang, 2015), and the results for three giant mountain masses are shown in Figures 2-4. For the high-elevation weather stations, air temperature of the hottest month is usually 2-4℃ higher than in the outside for the Alps, about 4-8℃ for the Andes, and 4-12℃ for the Tibetan Plateau. The MEE of the Tibetan Plateau is the highest and most varied thanks to its extremely high, extensive and complex mass. It was ever considered that the magnitude of MEE depends on the average height and the area of a mountain mass (Holtmeier, 2003; Körner, 2012). This really seems quite rational. But we found that the magnitude of MEE is closely related with the inner base elevation rather than with the absolute height and the average height. In other words, intra-mountain base elevation, namely, the average elevation of the intra-mountain basin or the great river basin (Zhang et al., 2012), is the most important factor for the formation of MEE. Other factors must also contribute to MEE. Through trial and error, we had such a hypothesis that latitude and moisture conditions (hygrometric continentality) are also significant to MEE. Then, we developed a linear model for MEE, with MEE as the dependent variable and the three factors just mentioned as independent variables. The mode is like this:
MEE = aLAT + bMBE + cHCONT + d (1)
where LAT is latitude, MBE intra-mountain base elevation, HCONT hygrometric continentality, and a, b, c and d are coefficients or constant.
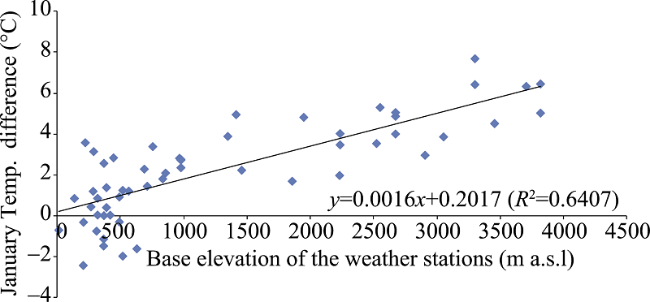
Figure 2 MEE and intra-mountain base elevation in the Andes
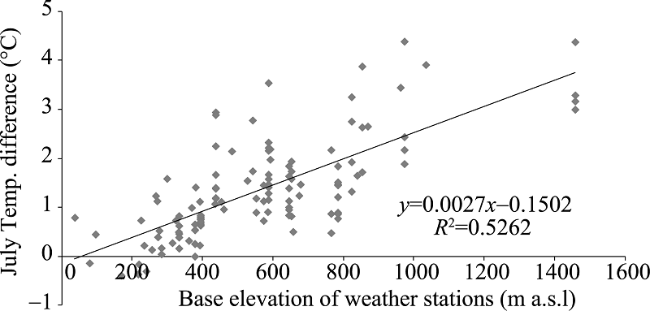
Figure 3 MEE and intra-mountain base elevation in the Alps
The result was shown in Table 1. It was clearly shown that MEE could be well explained by the three factors and that intra-mountain base elevation contributes the most to MEE and acts, therefore, as the primary MEE- forming factor. A slight exception occurs for the New Zealand mountains where hygrometric continentally contributes the most. This is understandable that marine climate prevails in New Zealand and the mountains are not very high.
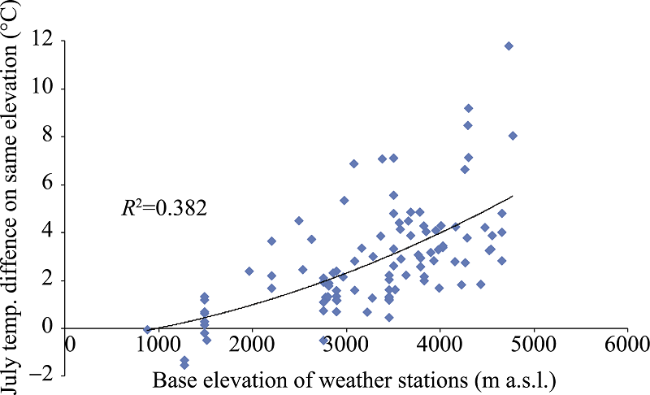
Figure 4 MEE and intra-mountain base elevation in the Tibetan Plateau
Table 1 Contribution of MEE-influencing factors to MEE and the model coefficient of determination
MEE factors Tibetan Plateau Alps Scandinavia Rocky Mts. Andes New Zealand
Latitude 38.41 6.19 17.67 38.52 4.36 28.30
Intra-mountain
base elevation
42.66 56.67 56.10 61.01 82.80 32.84
Hygrometric
continentality
18.93 37.14 26.23 0.47 12.84 38.86
Model R2 0.515 0.563 0.476 0.501 0.646 0.544

3 Extremely high treelines and snowlines as the results of MEE

The most significant contribution of MEE to the global ecological pattern is pushing montane plants and communities upwards to high elevations, especially in the extensive and massive mountain regions. Extremely high forests, defined as those above 4500 m in this paper, are distributed only in two highlands of the world, the southeastern Tibetan Plateau (29°N and 30°N) and central Andes, with a few treeline sites at about 4000 m in southern Rocky Mountains (Table 2).
Table 2 Distribution of the extremely high treelines in the world
Treeline site Longi (°) Lati (°) Elev (m) MBE (m) Location References
Nevado Sajama -68.9 -18.1 4800 4200 Central Andes Troll, 1973
Baxoi county 96.74 29.75 4900 4200 S.E. Tibetan Plateau Miehe, 2007
Nyemo River (E) 90.03 29.31 4800 3850 S.E. Tibetan Plateau Schickhoff, 2005
Kyi Chu catchment 91.60 30.29 4850 3800 S.E. Tibetan Plateau Miehe, 2007
Porong Ka Monastery 91.16 29.77 4600 3700 S.E. Tibetan Plateau Schickhoff, 2005
Pamtschü 91.96 29.30 4600 3650 S.E. Tibetan Plateau Schickhoff, 2005
Nevado de Toluca -99.7 19.1 4010 2800 Southern Rocky Mts. Körner & Paulsen, 2004
Pico de Orizaba -97.3 19.1 4020 2600 Southern Rocky Mts. Körner & Paulsen, 2004
Pico de Valley -97.3 19.1 4000 2600 Southern Rocky Mts. Hoch & Körner, 2005
These extremely high treelines are not close to the equator. Rather, they occur in the highlands with high base elevation (Table 2). This is just what we want to show. Let’s consider the elevation of treelines in the southern flank of the Himalaya and in Mt. Kilimanjaro. We have expected their treelines to be very high. But actually, their treelines are at elevations of 3500-3600 m or slightly higher, much lower than those (4600-4800 m) in the southeastern Tibetan Plateau and the central Andes where the base elevation is at about 3800-4300 m. Therefore, we must say that the high intra-mountain base elevation induces intense heating effect and pushes treelines to very high position. Calculation showed that the July isotherm of 10℃ is at about 4700-4900 m in the inner southeastern Tibetan Plateau, which almost perfectly coincides with the elevation of treelines (Yao and Zhang, 2013). In the same areas, the world highest snowlines are also identified, at about 5800-6000 m. Our analysis reveals that MBE contributes significantly to the extremely high distribution of snowlines (Han et al., 2011).
We have also shown that treelines could even occur above 5000 m in the western Tibetan Plateau and western central Andes if precipitation were enough there (Zhang and Yao, 2015). It is safe to say that high intra-mountain base elevation gives rise to intense MEE which, in turn, leads to extremely high distribution of montane forests. What can we call these forests? At so high elevation, could we still only call them montane forests? According to our traditional paradigm or classic mountain ecological classification, forests could not be matched with the term “alpine”! Then, the term “alpine forests” could not be coined and used. Out of frustration, the forests at elevations of about 4500 m above sea level could at least be called “high-elevation forests” before the term “Alpine forests” is accepted.

4 Global treeline distribution model with MEE as a variable

Treelines, as a prominent transitional ecotone between forested mountain slopes and alpine meadow/shrub, are highly complex in altitudinal distribution and sensitive to warming climate. Great efforts have been made to explore their distribution patterns and ecological mechanisms for more than 100 years, and quite a number of geographical and ecophysiological models were developed to correlate treeline altitude with latitude or a isotherm of given value. But these models are all mountain/region-specific or global-specific, having great difficulties in explaining cross-scale treeline patterns due to the extreme diversity and complexity of treeline site conditions. Jobbagy and Jackson (2000) developed a global treeline elevation distribution mode, with annual mean temperature and the annual arrange of temperature as independent variables. Their model could only explain 79% of the variation of forest lines (almost treelines). Their data for model development were extremely limited, almost without treeline data sites above 3500 m. So, their so-called “global control of forest line elevation” must be unreliable. Just like other researchers, they completely neglected the crucial “mass elevation effect.” We collected and compiled a second-hand dataset for a total of 594 treeline sites all over the world, and explored how MEE affects global treeline elevation by developing a ternary linear regression model with intra-mountain base elevation (MBE, as a proxy of MEE), latitude and continentality as independent variables (Zhao et al., 2015). The results indicated that MBE, latitude and continentality together could explain 92% of global treeline elevation variability, and that MBE contributes the most (52.2%), latitude the second (40%) and continentality the least (7.8%) to the altitudinal distribution of global treelines. Comparatively, MEE is more significant in the Northern Hemisphere than in the Southern. This is understandable for more extensive and higher mountain masses exist in the Northern Hemisphere. It is clear that taking MEE into treeline model development greatly enhanced the ability of explanation of the model and effectively deepened our understanding of the global geographic control of treeline distribution.

5 Conclusions

(1) MEE is a powerful agent in shaping the altitudinal pattern of global ecology. The strong heating effect or MEE push forests upwards to about 4800-4900 m in southeastern Tibetan Plateau and the central Andes. But, this effect has been largely neglected in the past.
(2) Intra-mountain base elevation is the most important MEE-forming factor. The area, average elevation and absolute height of mountain masses only seem important.
(3) MEE, defined as the temperature difference on a given elevation between inside and outside of a mountain mass could be digitally modeled with intra-mountain base elevation, latitude and hygrometric continentality.
(4) When MEE is taken into account, the global treeline model would have much higher ability of explanation. This greatly deepens our understanding of geographic pattern and formation mechanism of global treelines.
(5) MEE makes the world full of variety. Without MEE, any trees grow at most up to the elevation of 3500 m; without MEE, temperature laps rate would be rather consistent; and without MEE, the world of climate and vegetation would be much plainer.

The authors have declared that no competing interests exist.

1
Bailey R G, Hogg H C, 1986. A world ecoregions map for resource partitioning.Environmental Conservation, 13: 195-202.

2
Barry R G, 2008. Mountain Weather and Climate. Boulder, USA: University of Colorado.

3
Brockmann J H, 1919. Baumgrenze und Klimacharakter. Beitr.Geobot.Landesaufnahme.Baumgrenze und Klimacharakter von H. Brockmann-Jerosch (Beitr01ge zur geobotanischen Landesaufnahme, 6) Rascher, 1919

4
Bussmann R W, 2006. Vegetation zonation and nomenclature of African Mountains: An overview.Lyonia, 11: 41-66.Abstract This review provides an overview on the vegetation zonation of a large part of the mountain systems of the African continent. The Atlas and Jebel Marra are discussed as examples for the dry North African Mountains. The Drakensberg range is shown as

5
Daubenmire R, 1954. Alpine timberlines in the Americas and their interpretation.Butler University Botanical Studies, 11: 119-135.ABSTRACT The literature of plant geography has long contained references to the facts that (1) in progressing from the poles toward the equator, alpine timberline increases in elevation above sea level, and that (2) the elevation of this timberline exhibits considerable variation at any one latitude on different mountain systems. More recently a third fact concerning the geography of this vegetation boundary has been documented; the latitude-altitude relationship is not rectilinear.

6
Fang J Y, Oshawa M, Kira T, 1996. Vertical vegetation zones along 30°N latitude in humid East Asia.Vegetatio, 126: 135-149.

7
Flenley J, 2007. Ultraviolet insolation and the tropical rainforest: Altitudinal variations, Quaternary and recent change, extinctions, and biodiversity. In: Bush M B, Flenley J R. Tropical Rainforest Responses to Climatic Change. Chichester, UK: Praxis, 219-235.

8
Grace J, 1977. Plant Response to Wind. London: Academic Press.

9
Grubb J P, 1971. Interpretation of Massenerhebung effect on tropical mountains.Nature, 229: 44-45.ABSTRACT THREE types of rain forest can generally be recognized on wet tropical mountains: lowland rain forest, lower Montane rain forest and upper Montane rain forest1–3. These forest types can be defined both by distinctive plant associations1 and by the altitudinal limits within which they lie. These limits, however, vary with the type of mountain. On small, isolated mountains and outlying ridges of major ranges, the upper limit of lowland rain forest is about 700–900 m and that of the lower Montane rain forest about 1,200–1,600 m, whereas on the main ridges of major ranges the limits are higher, approximately 1,200–1,500 m and 1,800–2,300 m, respectively4. This phenomenon is known as the ‘Massenerhebung’ effect.

DOI PMID

10
Han F, Zhang B P, Yao Y Het al., 2011. Mass elevation effect and its contribution to the altitude of snowline in the Tibetan Plateau and surrounding areas. Arctic, Antarctic,and Alpine Research, 43(2): 207-212.In exploring geographical distribution of mountain altitudinal belts (e.g., snowline, timber line, etc.), many unitary or dibasic fitting models have been developed to depict the relationship between altitudinal belts' elevation and longitude or latitude, or both. However, most of these models involve small scales and could not be applied to other regions, while those established for the northern hemisphere or the whole globe, are of very low precision. The reason is that these models neglect one of the most important factors controlling the distribution of altitudinal beltsass elevation effect (, short as MEE in the following text). This concept (MEE) was introduced more than 100 years ago by A. de Quervain to account for the observed tendency for temperature-related parameters such as tree line and snowline to occur at higher elevations in the central Alps than on their outer margins. Although it has been widely observed and its effect on the elevation of mountain vegetation belts recognized, this phenomenon has not been quantitatively studied. We compiled 143 snowline descriptions from literature covering the Tibetan Plateau and its surrounding areas. Snowline elevation is related to longitude, latitude, and mountain base elevation (MBE), to construct a multivariate linear regression equation. These three factors could explain 83.5% of snowline elevation's variation in the Tibetan plateau and its surrounding areas. Longitude, latitude, and MBE (representing MEE to some extent) contribute 16.14%, 51.64%, and 32.22%, respectively, to the variability of snowline elevation. North of latitude 32N, the three factors' contribution amounts to 18.72%, 44.27%, and 37.01%, respectively; to the south, their contribution is 28.12%, 15.37%, and 56.51%, respectively. A non-linear model was also constructed, but it only enhances the ability slightly in fitting of snowline's distribution. Our analysis reveals that latitude and MBE are significant controlling factors of snowline elevation. Longitude, which stands for precipitation to a great extent, has limited impact on snowline's distribution. MEE should be further studied, or directly quantified so that it can be adequately incorporated into the development of spatial models for altitudinal belts, whereby the precision of such models could be greatly enhanced.

DOI

11
Hermes K, 1955. Die Lage der oberen waldgrenze in den Gebirgender Erde und ihr abstand zur schneegrenze. Kölner Geo-graphische Arbeiten, 5(115).

12
Hoch G, Körner C, 2005. Growth, demography and carbon relations of Polylepis trees at the world's highest treeline. Functional Ecology, 19: 941-951.Summary Growth, reproductive success and non-structural carbon pools in Philippi trees were examined across a transect between 4360 and 481002m altitude on Nevado Sajama, Bolivia. The mean 6110-cm soil temperature of 5·402°C under trees at the treeline during the 265-day growing season matched the threshold temperature found at other subtropical and tropical treelines. Beyond 440002m is restricted to the warmer and drier equator-facing slopes, suggesting a direct thermal limitation of tree growth. Maximum tree height, annual shoot increment and mean tree-ring width decreased with altitude. Trees near the upper range limit reached a maximum tree height of 3·302m and a maximum stem diameter of 3402cm. The smallest tree-height classes dominated populations at all altitudes, and the uppermost site revealed the highest proportion of seedlings. Tree-size demography indicates a critical phase for tree establishment during the sapling stage, when trees emerge from sheltered niches near the ground. No evidence of a depletion of mobile C stores (sugars, starch and lipids) was found in any tissue type with increasing elevation, suggesting a limitation of C investment (growth) rather than C acquisition (photosynthesis) at treeline. (2005) doi: 10.1111/j.1365-2435.2005.01040.x

DOI

13
Holdridge L R, 1947. Determination of world plant formations from simple climatic data.Science, 105: 367-368.

14
Holdridge L R, 1967. Life zone ecology. Tropical Science Center, San Jose, Costa Rica.

15
Holtmeier F K, 2003. Mountain Timberlines: Ecology, Patchiness, and Dynamics. Dordrecht, Boston, London: Kluwer Academic Publishers.2004) Mountain Timberlines—Ecology, Patchiness, And Dynamics. Arctic, Antarctic, and Alpine Research: Vol. 36, No. 4, pp. 635-635. doi: http://dx.doi.org/10.1657/1523-0430(2004)036[0635:BR]2.0.CO;2

DOI

16
Jobbagy E G, Jackson RB, 2000. Global controls of forest line elevation in the northern and southern hemispheres.Global Ecology and Biogeography, 9(3): 253-268.An exploration was made of whether the independent evolutionary history of extratropical forests in the southern and northern hemispheres affects the temperature altitude relationship of mountain forest lines. 115 forest line descriptions were compiled from the literature, covering the major extratropical mountain ranges of the world. Forest line altitude was related to thermal regimes using me...

DOI

17
Kira T, 1945. A New Classification of Climate in Eastern Asia as the Basis for Agricultural Geography. Horticultural Institute. Kyoto: Kyoto University.

18
Kitayama K, 1992. An altitudinal transect study of the vegetation on Mount Kinabalu, Borneo.Plant Ecology, 102: 149-171.A quantitative transect analysis of altitudinal sequences of forest canopy species from 600 to 3400 m asl on Mt. Kinabalu (4101 m), Borneo, resulted in four discrete altitudinal vegetation zones. These were made up of mutually exclusive species groups for lowland (<1200 m asl), lower montane (1200 to 2000–2350 m asl), upper montane (2000–2350 to 2800 m asl), and subalpine (2800 to the forest line, 3400 m asl) zones. Zonal soil types were correlated with the vegetation zones. In upslope sequence, these were: lowland Oxisols, montane Histosol/Spodosol complex, and subalpine Inceptisols. The highest contents of organic carbon, extractable phosphorus, and exchangeable magnesium and potassium were recorded in the lower and upper montane zones. The upper boundaries of the lowland, upper montane and subalpine zones coincided with thermal thresholds of latitudinal bioclimatic zones: 18°C TMIN (K02ppen's tropical), WI 85 (Kira's warm temperate), and WI 45 (Kira's cool temperate), respectively. The upper limit of the lower montane zone was correlated with an abrupt increase of water surplus estimated from the annual rainfall minus annual potential evaporation. These climatic characteristics appear to define ecological altitudinal turnover points, so called ‘critical altitudes’, where groups of associated species are displaced by other groups.

DOI

19
Köppon W, 1920. Das geographische system der klimate. Beilin: Gebruder Borntrger, 1-50.

20
Körner C, 2012. Alpine Treelines: Functional Ecology of the Global High Elevation Tree Limits. Basel: Springer.

21
Leuschner C, 1996. Timberline and alpine vegetation on the tropical and warm-temperate oceanic islands of the world: Elevation, structure and floristics.Vegetatio, 123: 193-206.

22
Loehle C, 2004. Challenges of ecological complexity.Ecological Complexity, 1(1): 3-6.

DOI

23
Malyshev L, 1993. Levels of the upper forest boundary in Northern Asia.Vegetatio, 109: 175-186.On the Ural range the elevation of upper timberline changes at grade 71 m per degree of latitude in linear regression. Much lengthy cross-section—for the semi-arid regions of middle Siberia and adjacent Kazakhstan, and for the regions of eastern Siberia dominated by larch forests—exhibit parabolic regression of timberline levels upon geographic latitude. The longitudinal gradient of timberlines presumably depends on radiation balance related with the amount of precipitation. The arctic boundary of taiga in eastern Europe and Siberia lies mostly on average latitude 69° 36′ E. It correlates with mean July temperature 11.2 °C, or with duration of the growing season 128 days with stable temperature of air exceeding 0°C which amounts to 876°. Daily temperatures exceeding 5° and especially 10 °C are seemingly less influential there. The value of 11.2 °C deviates by about 1 °C from the value of ‘above 10 °C’ for three summer month reported by Langlet 1935, which shows the close environmental control regulating the northern and upper boundary of the northern, mostly coniferous forest on the northern hemisphere.

DOI

24
Miehe G, Miehe S, Vogel Jet al., 2007. Highest treeline in the Northern Hemisphere found in southern Tibet.Mountain Research and Development, 27(2): 169-173.ABSTRACT

DOI

25
Ohsawa M, 1990. An interpretation of latitudinal patterns of forest limits in South and East Asian mountains. Journal of Ecology, 78: 326-339.A discussion of forest limits (treelines) in S. and E. Asia in relation to floristics (mainly evergreen conifers with some deciduous broadleaves in northern temperate areas, but evergreen broadleaves on tropical mountains), temperature conditions (seasonality, minimum temperature affecting winter survival, minimum temperature sums affecting summer growth and reproduction), and altitude and lati...

DOI

26
Paulsen J, Korner C, 2014. A climate-based model to predict potential treeline position around the globe.Alpine Botany, 124: 1-12.In situ temperature measurements revealed that the position of the high-elevation treeline is associated with a minimum seasonal mean air temperature within a temperature-defined minimum season length across latitudes. Here, we build upon this experience and present the results of a global statistical analysis and a predictive model for low temperature treeline positions. We identified 376 natural treelines from satellite images across the globe, and searched for their closest climatic proxies using a climate database. The analysis included a snow and a water balance submodel to account for season length constraints by snow pack and drought. We arrive at thermal treeline criteria almost identical to those that emerged from the earlier in situ measurements: tree growth requires a minimum length of the growing season of 9402days. The model yields best fit when the season is defined as all days with a daily mean temperature >0.902°C, and a mean of 6.402°C across all these days. The resultant treeline model ‘TREELIM’ offers a robust estimation of potential treeline elevation based on climate data only. Error terms include imprecise treeline position in satellite images and climate approximations in mountainous terrain. The algorithm permits constraining low temperature limits of forest growth worldwide (including polar treelines) and also permits a bioclimatic stratification of mountain biota, for instance, for biodiversity assessments. As a side product, the model yields the global potentially forested area. The results support the isotherm theory for natural treeline formation. This completely independent statistical assessment of the climatic drivers of the global treeline phenomenon confirmed the results of a multi-year measurement campaign.

DOI

27
Quervain A, 1904. Die Hebung der atmosphärischen lsothermenin der Schweizer Alpen und ihre Beziehung zu deren Höhengrenzen.Gerlands Beitr. Geophys., 6: 481-533.

28
Schickhoff U, 2005. The upper timberline in the Himalayas, Hindu Kush and Karakorum: A review of geographical and ecological aspects. In: Broll G, Keplin B. Mountain Ecosystems. Berlin Heidelberg: Springer-Verlag, 275-354.Based on comprehensive evaluations and analyses of existing literature and data sources, a review of geographical and ecological aspects of the upper timberline in the Himalayan mountain system is pre

DOI

29
Schröter C, 1908. Das pflanzenleben der Alpen: Eine schilderung der hochgebrigsflora. Verlag von Albert Raustein, Verlag von Albert Raustein, Zurich, Switzerland.Das Pflanzenleben der Alpen : eine Schilderung der Hochgebirgsflora von C. Schroeter ; unter Mitwirkung von Heinrich und Marie Brockmann-Jerosch ... [et al.] ; Zeichnungen von Ludwig Schroeter Raustein, 1926 2. neubearb. und verm. Aufl

30
Troll C, 1973. The upper timberlines in different climatic zones.Arctic and Alpine Research, 5(3): 3-18.In the past the upper timberlines and their ecological causality were mostly studied in high mountains of the humid temperate zones of the Northern Hemisphere with their strong thermal contrasts of summer and winter. They are generally determined by the duration of certain summer temperature values and in their topoclimatic differentiation controlled by the accumulation and deflation of snow. But they are not climatically equivalent, not even in a relatively small mountain system such as the Alps or the Tatra mountains from what is shown by the change in the limit-forming trees (spruce, larch, pine, fir, beech, birch, etc.). The upper timberlines in the humid tropics are completely different in physiognomy, life forms, climatic conditions, and topoclimatic effects; they are without seasonal variations of temperatures. In most cases they are formed by a dense evergreen forest with dozens of broad-leaved trees, sometimes by a fringing woodland (Polylepis, Ericacea, Hagenia, Leptospermum). In the arid belts, which extend from tropical to cold temperate latitudes, where the forest belts have a lower and an upper limit ("girdle forests"), also the upper timberline can be caused, at least in part, by aridity factors. In the Mediterranean area and in the Middle East we distinguish a sub-Mediterranean subzone with upper timber belts of boreal types, a fully Mediterranean subzone with specific Mediterranean trees as uppermost timber belt (Quercus ilex, Q. tozza, Pinus leucodermis, Cedrus atlantica), and a southerly Mediterranean steppe belt where generally juniper species are upper limiting trees. The timberlines in the cool temperature zone of the Southern Hemisphere with its high oceanity show more affinity to the tropical highlands than to the boreal zones.

31
Walter H, 1979. Vegetation of the Earth and Ecological Systems of the Geo-biosphere. New York: Springer-Verlag.An English translation of the 3rd German edition [see FA 39, 3435].

DOI

32
Yao Y, Zhang B, 2013. A preliminary study of the heating effect of the Tibetan Plateau.PLoS One, 8(7): e68750.The immense and towering Tibetan Plateau acts as a heating source and, thus, deeply shapes the climate of the Eurasian continent and even the whole world. However, due to the scarcity of meteorological observation stations and very limited climatic data, little is quantitatively known about the heating effect of the plateau and its implications. This paper firstly collects climate data (2001–2007) from 109 observation stations and MODIS-based estimated monthly mean temperature data in the plateau and the neighboring Sichuan Basin, and conducts correlation and simple linear regression to reveal the altitudinal pattern of temperature. Then, according to the linear relationships of temperature and altitude for each month, it compares air temperature differences on the same elevation between the main plateau and surrounding mountains and the Sichuan Basin so as to quantify the heating effect and discuss its implication on timberline of the plateau. The results show that: 1) the heating effect of the plateau is significant. The temperature of the main plateau area was higher than that of free air on the same elevation above the neighboring areas; on the elevation of 4500 m (the main plateau), temperature is 1–6°C higher in the main Plateau than over the Sichuan Basin for different months and 5.9–10.7°C higher than in the Qilian Mountains in the northeastern corner of the plateau. 2) Even at altitudes of 5000–6000 m in the main Plateau, there are 4 months with a mean temperature above 0°C. The mean temperature of the warmest month (July) can reach 10°C at about 4600–4700 m. This may help explain why the highest timberline in the northern hemisphere is on the southeastern Tibetan Plateau.

DOI PMID

33
Yao Y, Zhang B, 2015. The mass elevation effect of the Tibetan Plateau and its implications for alpine treelines.Int. J. Climatol., 35: 1833-1846.The immense and towering Tibetan Plateau (TP) acts as a heating source and shapes the climate of not only the Eurasian continent but also the entire world. The mass elevation effect of the TP was first observed in the 1950s; however, due to the scarcity of meteorological observation stations and limited climatic data, little information on the mass elevation effect of the plateau and its implications for the position of Alpine treelines in the southeastern part of the TP is quantitatively known. This paper compares monthly mean air temperature differences at elevations of 4000, 4500, 5000, 5500 and 6000m between the main plateau, the Qilian Mts. in the northeastern corner of the plateau and the Sichuan Basin to the east of the plateau to quantify the mass elevation effect of the plateau. The TP air temperature data are retrieved from Terra moderate-resolution imaging spectroradiometer (MODIS) land surface temperature (LST), and the free-air temperatures over the westernmost Sichuan Basin are estimated using the measured lapse rate from Mt. Emei, which is located in the western portion of the Sichuan Basin. The results demonstrate the following important characteristics. (1) Owing to the mass elevation effect, air temperatures gradually increase from the eastern edge to the interior main TP. The monthly mean air temperature in the interior main plateau is approximately 2-7 degrees C higher than in the surrounding mountains and adjacent lowland areas. At an elevation of 4500m (corresponding to the mean altitude of the TP), the monthly mean temperature differences between the plateau and the Sichuan Basin range from 3.58 degrees C (April) to 6.63 degrees C (June); the monthly temperature differences between the plateau and the Qilian Mts. range from 1.6 degrees C (July) to 7.7 degrees C (March). (2) The mass elevation effect of the plateau pushes the 10 degrees C isotherm upward in the warmest month and is indicative of a warmth index of 15 degrees C month up to elevations of 4600-4700 m, which enables the treeline altitude in the interior TP 500-1000m higher than along the eastern edge. Therefore, mass elevation effect contributes to the occurrence of the highest treeline in the Northern Hemisphere, which is present on the southeastern TP.

DOI

34
Zhang B, Yao Y, 2015. Studies on Mass Elevation Effect. Beijing: China Environmental Science Press. (in Chinese)

35
Zhang B, Zhao F, 2014. Altitudinal belts: Global mountains, patterns and mechanisms. In: Encyclopedia of Natural Resources: Land. New York: Taylor and Francis.

36
Zhang S, Yao Y, Pang Yet al., 2012. Mountain basal elevation extraction and in the Taiwan Island.Journal of Geo-information Science, 14(5): 562-568. (in Chinese)

37
Zhao F, Zhang B, Zhang Set al., 2015. Contribution of mass elevation effect to the altitudinal distribution of global treelines.Journal of Mountain Science, 12(2): 289-297.Alpine treeline, as a prominent ecological boundary between forested mountain slopes and alpine meadow/shrub, is highly complex in altitudinal distribution and sensitive to warming climate. Great efforts have been made to explore their distribution patterns and ecological mechanisms that determine these patterns for more than 100 years, and quite a number of geographical and ecophysiological models have been developed to correlate treeline altitude with latitude or a latitude related temperature. However,on a global scale, all of these models have great difficulties to accurately predict treeline elevation due to the extreme diversity of treeline site conditions.One of the major reasons is that "mass elevation effect"(MEE) has not been quantified globally and related with global treeline elevations although it has been observed and its effect on treeline elevations in the Eurasian continent and Northern Hemisphere recognized. In this study, we collected and compiled a total of 594 treeline sites all over the world from literatures, and explored how MEE affects globaltreeline elevation by developing a ternary linear regression model with intra-mountain base elevation(IMBE, as a proxy of MEE), latitude and continentality as independent variables. The results indicated that IMBE, latitude and continentality together could explain 92% of global treeline elevation variability, and that IMBE contributes the most(52.2%), latitude the second(40%) and continentality the least(7.8%) to the altitudinal distribution of global treelines. In the Northern Hemisphere, the three factors' contributions amount to 50.4%, 45.9% and 3.7% respectively; in the south hemisphere, their contributions are 38.3%, 53%, and 8.7%, respectively. This indicates that MEE, virtually the heating effect of macro-landforms, is actually the most significant factor for the altitudinal distribution of treelines across the globe, and that latitude is relatively more significant for treeline elevation in the Southern Hemisphere probably due to fewer macro-landforms there.

DOI

38
Zheng D, 2000. Three dimensional differentiation of natural zonation. In: Zheng D et al. (ed.): Mountain Geoecology and Sustainable Development of the Tibetan Plateau. Springer.With its highest elevation, unique physical environment and rule of spatial differentiation, the Tibetan Plateau is a gigantic g茅omorphologie region on the earth. As a result of high elevation and large area, the type, characteristics and natural historical process of physical landscapes on the plateau are quite different from those of lowlands at the same latitudes as well as high latitudinal regions. In consequence, it has been labeled as high hierarchic regional unit, being one of the three largest physical regions in China. Comparable studies on altitudinal belt, some unique geo-ecological phenomena, physical regional differentiation and ecogeographical regional system of the Tibetan Plateau are dealt with in this chapter.

DOI

Outlines

/