Orginal Article

Review on carbon emissions, energy consumption and low-carbon economy in China from a perspective of global climate change

  • SHEN Lei , 1 ,
  • *SUN Yanzhi , 1, 2
Expand
  • 1. Institute of Geographic Sciences and Natural Resources Research, CAS, Beijing 100101, China
  • 2. University of Chinese Academy of Sciences, Beijing 100049, China

Author: Shen Lei, Professor, E-mail:

*Corresponding author: Sun Yanzhi, PhD Candidate, E-mail:

Received date: 2015-12-25

  Accepted date: 2016-04-06

  Online published: 2016-07-25

Supported by

National Natural Science Foundation of China, No.41271547

Strategic Priority Research Program - Climate Change: Carbon Budget and Related Issues of the Chinese Academy of Sciences, No.XDA05010400

National Natural Science Foundation of China, No.41401644

Copyright

Journal of Geographical Sciences, All Rights Reserved

Abstract

Accompanying the rapid growth of China’s population and economy, energy consumption and carbon emission increased significantly from 1978 to 2012. China is now the largest energy consumer and CO2 emitter of the world, leading to much interest in researches on the nexus between energy consumption, carbon emissions and low-carbon economy. This article presents the domestic Chinese studies on this hotpot issue, and we obtain the following findings. First, most research fields involve geography, ecology and resource economics, and research contents contained some analysis of current situation, factors decomposition, predictive analysis and the introduction of methods and models. Second, there exists an inverted “U-shaped” curve connection between carbon emission, energy consumption and economic development. Energy consumption in China will be in a low-speed growth after 2035 and it is expected to peak between 6.19-12.13 billion TCE in 2050. China’s carbon emissions are expected to peak in 2035, or during 2020 to 2045, and the optimal range of carbon emissions is between 2.4-3.3 PgC/year (1 PgC=1 billion tons C) in 2050. Third, future research should be focused on global carbon trading, regional carbon flows, reforming the current energy structure, reducing energy consumption and innovating the low-carbon economic theory, as well as establishing a comprehensive theoretical system of energy consumption, carbon emissions and low-carbon economy.

Cite this article

SHEN Lei , *SUN Yanzhi . Review on carbon emissions, energy consumption and low-carbon economy in China from a perspective of global climate change[J]. Journal of Geographical Sciences, 2016 , 26(7) : 855 -870 . DOI: 10.1007/s11442-016-1302-3

1 Introduction

The international community has placed much more emphases on the topic of global climate change over decades. In 2014, the Intergovernmental Panel on Climate Change (IPCC) released its fifth assessment report, which analyzed the causal relationship between human activity and global climate change, and emphasized the need to reduce greenhouse gas emissions and mitigate the effects of climate change (Qin, 2014).
Although the question regarding the global warming was first raised more than a century ago, researches about energy consumption and carbon emissions have made some progress recently (Figure 1). In the 19th century, researchers noted that carbon emissions from burning fossil fuels could contribute to global warming, discovering that 60% of greenhouse effect is induced by CO2 (Ozturk and Acaravci, 2010). Recent studies have estimated that the burning of fossil fuels contributes to 70% of total carbon emissions, and that human activity and energy consumptions are the primary causes of climate change (Zhang et al., 2012). On the one hand, economic growth depends on energy consumption, which results in carbon emission. On the other hand, reducing carbon emission will react on energy consumption, and restrict economic development (Zhang and Duan, 2012).
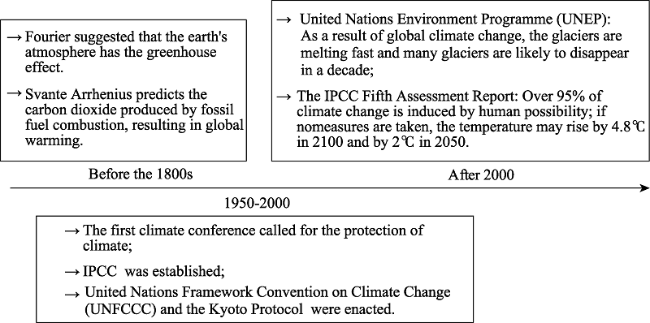
Figure 1 The cognitive evolution of climate change
Research concerning the nexus between energy consumption, carbon emissions and economic development has been undertaken over many years. In 1991, Makarov explored the role of energy consumption in the Soviet economy (Makarov and Bashmakov, 1991); Nulíček denoted that national economic development could increase the energy intensity (Nulíček, 1993). Over the past years, academics from around the world have continued a variety of related studies, including fossil fuel emissions (Andres et al., 1996), industrial structure and carbon emissions (Tunç et al., 2009), energy efficiency and emissions (Greening et al., 2000), as well as on the linkage between energy consumption and economic development (Begum et al., 2015).
Due to the large population and rapidly growing economy, from 1978 to 2012, Chinese annual energy consumption increases from 571 million to 3.63 billion TCE, while carbon emissions increase from 400 million to 7.95 billion tons. During this period, China’s energy consumption rises from 6% to 20.3% of the world’s total, making it the world’s largest consumer and emitter, with carbon emissions now accounting for 24.6%, up from 8.4% (Fan et al., 2015). Energy consumption and carbon emissions cannot be controlled within a short time, but in the face of climate change, China must confront its urgent pressures to reduce the carbon emissions. This paper presents a summary of the related research, revealing the interaction mechanisms of the climate change, energy consumption and low-carbon development. It will help to support green development, cycle development and low carbon development of China’s “13th Five-Year Plan” (2016-2020), and cope with the international climate change.

2 Methodology

In this article, we have collected 480 papers published in the database of China National Knowledge Infrastructure (CNKI) to summarize some progress of Chinese researchers in terms of three topic words of energy consumption, carbon emission and low-carbon economy. The topic words are processed at standardized level to control the use of the synonyms and polysemous words, promoting the precision and recall of the related literature. There are plenty of keywords under the topic words and we count all the keywords appearing in these papers. Keywords are the words occurring more frequently in the study and they can express the theme of literature. These papers are mainly published in some major journals, such as Acta Geographica Sinica, Journal of Natural Resources, and Economic Geography (Table 1).
Table 1 Related methods and information of this paper
Methods Topic word High frequency keywords The number of documents Type of journal
Biliometric
analysis
Co-word Analysis
‘energy consumption’, ‘carbon emission’, ‘low-carbon economy’ LMDI model,
economy growth,
climate change,
carbon emission
reduction, decomposition analysis, industrial
structure,
low-carbon,
carbon emission permits
480 Acta Geographica Sinica, Journal of Natural Resources, Economic Geography, Resources Science,
China Population, Resources and
Environment,
Ecological Economy and others
Biliometric analysis and co-word analysis are applied to analyze these publications. In order to discuss the characteristics and variations of science, as a quantitative method based on mathematical statistics, the bibliometrics is used to examine the numerical relationship, changes regulation and quantitative management of the literature. Co-word analysis shows the frequency of any two keywords in one paper to reflect the close connection, and the higher frequency indicates the closer relation. Based on the biliometric analysis, we analyze the keywords in the 480 papers and then make the co-word matrix of the keywords, which appear more than 20 times (Table 2). Table 2 shows that carbon emission, low-carbon economy and energy consumption appear most frequently in these collected literatures, and the couple of carbon emission and energy consumption occurs more often than any other couple, with 59 times. Through the co-word analysis, the research focuses of subject are very obvious.
Table 2 Co-word matrix of high frequency keywords (partial)
Carbon emission Low-
carbon economy
Energy consumption LMDI model Economic growth Climate change Carbon reduction Decomposition analysis Industrial structure Low-
carbon
Carbon emission 0 34 59 35 30 18 9 19 13 4
Low-carbon economy 34 0 18 9 6 11 3 4 5 0
Energy consumption 59 18 0 10 13 6 0 5 5 1
LMDI model 35 9 10 0 7 1 3 2 0 0
Economy growth 30 6 13 7 0 2 1 1 1 0
Climate change 18 11 6 1 2 0 5 0 1 1
Carbon reduction 9 3 0 3 1 5 0 0 0 0
Decomposition analysis 19 4 5 2 1 0 0 0 2 0
Industrial structure 13 5 5 0 1 1 0 2 0 2
Low-carbon 4 0 1 0 0 1 0 0 2 0
Basing on the collection of the research focuses, the rest sections of this article will present our literature analysis and main findings, indicating the status and trend of carbon emission, the nexus between energy consumption and carbon emissions, and some low-carbon economic models towards addressing the climate change, which will help to accelerate the green development goals in China during the 13th Five-Year Plan period. It will also provide some decision-making references to the development of renewable and low-carbon technologies necessary to combat global climate change.

3 CO2 emissions: status and trends

3.1 Increasingly carbon emissions and its driving force

At the present, because of the economic development, rapid urbanization and the energy-consuming activities undertaken in the society, a short-term reduction in China’s carbon emissions is impossible.
Since 2000, carbon emissions of global fossil fuels burning grow by 3% annually, with two-thirds coming from China (Gu et al., 2009). China’s carbon emissions continue to increase, surpassing the United States as the largest emitter in 2006 and accounting for 20% of global emissions. Between 2006 and 2013, emissions rise by an average of 15.7% annually from 4.97 to 10.44 billion tons, which is 29% of the world’s total (Yue et al., 2010).
The main sources of carbon emissions are industrial, agricultural, and household; however, the industrial fossil fuels consumption is the primary contributor. Carbon emissions in eastern China are apparently higher than the less developed central and western regions. Moreover, there are significant regional differences in carbon emissions of the industry, construction, and transportation (Sun et al., 2010).
Great deals of studies use decomposition and econometric models to explore the driving forces of carbon emissions; the most widely used models are structural decomposition analysis (SDA), indexed decomposition analysis (IDA) and production-theory decomposition analysis (PDA) (Zhang and Da, 2015). For analyzing energy consumption or carbon emissions, SDA is often combined with the input-output model, and the Logarithmic Mean Divisia Index (LMDI) is most prominently used in the IDA (Cansino et al., 2015). Of all the decomposition factors (Table 3), economic development and increased energy consumption are the greatest drivers of carbon emissions, but with the advance of technology, the improvement of energy efficiency will become the most important factor in carbon emissions reductions. The STIRPAT (Stochastic Impacts by Regression on Population, Affluence, and Technology) model used by Qu Shenning (2010) projects that China’s carbon emissions will peak either in 2035 or during 2020-2035, with the amount falling between 2.4-3.3 PgC/a (Hu et al., 2008; Qu et al., 2010; Yue et al., 2010).
Table 3 Studies of contributors to the changes of CO2 emissions in China
Authors Methods Time Research
subjects
Decomposition of impact factors
Impact factors Promoting factors Inhibitory
factors
Zhu and Zhang, 2011 IDA 1995-2008 Carbon
emission
intensity
Energy intensity, energy structure, industrial structure Energy intensity Energy structure, industrial structure
Zhao et al., 2014 Spatial Panel Data Analysis 1991-2010 Carbon emission intensity of energy consumption Per capita GDP, population density, energy consumption structure, transportation, energy price Per capita GDP, population density Energy
consumption
structure
Liu and Liu, 2009 LMDI 1992-2005 Carbon
emissions of
industrial combustion
Energy consumption, energy structure, technical factors, intermediate inputs, industrial structure, industrial output Energy
consumption, energy structure, industrial output
Song and Lu, 2009 LMDI 1990-2005 Carbon
emissions of energy
consumption
Output scale, energy structure, emission intensity, energy intensity Output scale Energy
intensity
Li et al., 2011 Kaya 1993-2008 Agricultural carbon
emission
Economic development, efficiency factor, structure factor, labor force scale Economic development Efficiency
factor, structure factor, labor force scale
Yang and Liu, 2012 STIRPAT, EKC 1995-2009 Carbon
emissions
Per capita GDP, population size, energy intensity, energy structure, industrial structure, urbanization rate, trade openness, foreign direct investment Per capita GDP, energy intensity
Guo, 2010 LMDI 1995-2007 Carbon
emissions
Economic aggregate, economic structure, energy use efficiency, energy consumption structure, carbon emission coefficient Economic aggregate Energy use
efficiency
In addition to the studies assessing China’s total carbon emissions, there is also a wealth of researches on the emissions of individual industries, such as the textile (Lin and Moubarak, 2013), steel (Lin and Wang, 2015), and cement industries (Shen et al., 2014). Most studies use a direct measure to estimate carbon emissions, leaving out the amounts generated through transportation and other intermediate processes; however, carbon footprint can help to correct this deficiency (Yang and Chen, 2014). Carbon footprint is a comprehensive method, including both direct and indirect emissions to assess the amount of CO2 produced in a region; it can be a useful tool in adjusting the climate legislation to localized development, reflecting the connections between local activity and climate change, and increasing the local understanding of climate change (Ramachandra, 2012).

3.2 Carbon emissions reductions and climate change

Governmental organizations around the world actively explore strategies for reducing carbon emissions and coping with the climate change. Energy-saving and emission-reduction have become the “green barrier” to international trade in order to protect the environment (Wang et al., 2015).
In response to climate change, many countries have proposed emission reduction targets, such as the European Union’s “Strategic Energy Technology Plan” and the United States’ target of 80% reductions by 2050 compared to 1990. Responding to international pressure, China pledges to reduce its carbon intensity of per unit GDP by 40%-45% for 2020 comparing with 2005, aiming to reach its emissions peak level by 2030 (Bi, 2015). Since 2014, China’s “12th Five-Year Plan” has addressed climate change targets, achieving the positive results by restructuring industries, increasing the efficiency of energy consumption, optimizing energy structures, limiting greenhouse gas emissions of non-energy activities and expanding forest carbon sinks. In 2014, China’s CO2 emissions of per unit GDP decreased by 6.2%, completing the 92.3% of carbon intensity reduction target proposed by the “12th Five-Year Plan” (NDRC, 2015).
Carbon trading, an important tool of the Kyoto Protocol agreement, is used to achieve international cooperation to mitigate climate change. Thus, an increasing amount of researches will focus on the carbon emissions trading pilot program and the possible carbon trading market to achieve emission reduction targets through carbon trading (Grubb, 2012). While exploring ways to achieve emission reductions, it is important to note the reconstruction role of international trade in globe carbon emission distribution, and the embodied carton emissions in carbon trading should be the focuses of the future researches (Zhang et al., 2015).

4 Energy consumption trends and the linkage between energy consumption and carbon emission

4.1 Energy consumption and its economic impact factors

China’s energy consumption is not only massive but increasing as well. Moreover, the regional differences are very large in energy consumption, which are affected by many factors with economic factors being the most obvious.
Energy is crucial significant for human existence and social development. Along with China’s economic growth, energy consumption has risen accordingly (Figure 2); in the past 10 years, this trend has been changing rapidly, which is 4.26 billion TCE in 2014, up by 13.65% from the previous year. For the energy consumption, coal, as the major consumption, has fallen from 90% of total China’s energy consumption in the 1950s to only 66% in 2014; while oil consumption has been generally steady for the past 30 years.
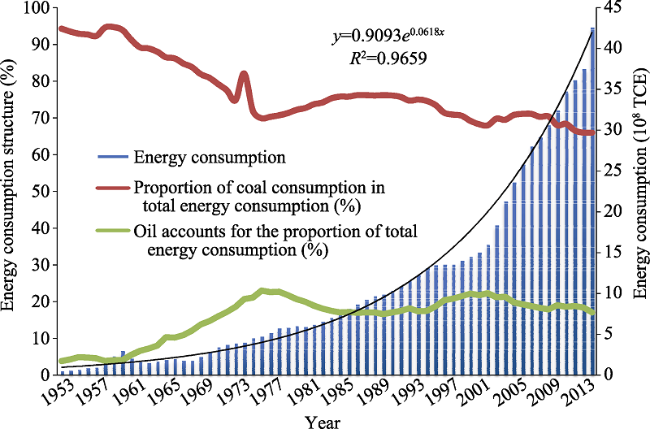
Figure 2 The trend of energy consumption from 1953 to 2013 in China
In China, spatial-temporal distribution differences of energy consumption are relatively large, decreasing geographically from east to west, though per capita consumption is clearly higher in the west. Energy consumption is still concentrated along China’s east coastal area at least until the mid-21st century, while energy supply remains located in the “three-northern” regions, namely east, central and west (Liu and Shen, 2011).
Decomposition models are also most used to study the impact factors of energy consumption, such as LMDI. The main factors are concentrated on three aspects of the scale, technology and structure, including economic growth, population size, urbanization, industrial structure and natural endowments. Among these, economic growth is the most impactful factor (Yang et al., 2013). Many studies have shown that country’s economic fluctuations will influence the energy consumption changes. Furthermore, when China’s GDP growth is below 18.04%, a steady linear relationship can be got between GDP and energy consumption; however, when growth exceeds 18.04%, the relationship becomes nonlinear, with a 1% rise in GDP and a 2.26% rise in energy consumption. This illustrates the crucial role of economic growth in accelerating the energy consumption (Du et al., 2009; Zhao and Fan, 2007). This paper establishes a simple comparison of China’s GDP and energy consumption during 1953-2014 in order to illustrate the related research findings. At the same time, it reveals that energy intensity has consistently decreased. GDP growth promotes the energy demands and energy consumption, as well as the improvement of energy efficiency. In the future, more new energy should be exploited and energy efficiency should be further improved. Moreover, the industrial structure should be adjusted to reduce the energy dependency (Zhao and Fan, 2011).

4.2 Continued increase in energy demand

China’s energy demands are constantly increasing and energy security must be strengthened to support the balance between energy supply and demand.
According to the International Energy Agency’s (IEA) predictions (IEA, 2010), China’s energy demand in 2035 will be twice the level in 2008, comprising about 23.4% of the world’s total, up from 17.4% in 2008 (Table 4). Considering the current energy consumption structure, the future development will remain dependent on domestic sources of energy, with coal consumption remaining the leading supply, and oil imports will uninterruptedly increase (Zhang, 2013).
Table 4 The forecast for energy demand in China
Energy demand (100 million tons of standard coal) Proportion (%)
1990 2008 2020 2030 2035 2008 2035
Coal 7.78 20.55 30.60 35.22 37.43 66 61
Petroleum 1.66 5.37 8.25 10.15 10.98 17 18
Natural gas 0.19 1.03 2.60 3.93 4.74 3 8
New energy 0.00 0.26 1.80 2.53 2.75 1 4
Hydrogen 0.16 0.73 1.34 1.54 1.63 2 3
Biomass energy 2.91 2.95 2.78 2.68 2.85 10 5
Renewable energy 0.00 0.10 0.47 0.79 0.92 0 1
Total 12.68 30.99 47.82 56.82 61.30 100 100
Shen Lei et al. (2015) suggest that China will be in the stage of low energy consumption growth after 2035, with the amount reaching 6.19-12.13 billion TCE in 2050. Although energy demands seem to be endlessly on the rise, the rate of increase is actually decreasing; so there is a hope that one day there will be an energy consumption plateau, and perhaps a decoupling of economic growth and energy consumption.
In order to keep a balance between supply and demand, it is crucial to ensure the energy security, including supply, production, utilization, transportation and environmental safety. It is important to establish a comprehensive energy management system to improve the energy efficiency and provide the diversification of energy sources. We should develop the new techniques, alternative energy and transportation capacity to safeguard the national energy security and satisfy the increasing energy consumption demands (Shen and Xue, 2011).

4.3 Energy consumption effect: increasing carbon emissions

In the literature collected for this study, of the 400 articles under the theme “energy consumption”, nearly 20% are related to the carbon emissions. And it has been a popular research topic since 2002, and carbon emission is the main result of energy consumption (Liu et al., 2002).
Globally, the burning of fossil fuels contributes to 70% of total carbon emissions. China is currently in a period of rapid economic growth, and its present coal-based energy structure is difficult to change. Currently, 80% of China’s energy demands are met by fossil fuels, so emissions caused by energy consumption may be the main part of the atmospheric carbon emission. Special attention should be given to the studies about the energy consumption and carbon emissions to explore the low-carbon pathways (Cui, 2015; Zhang et al., 2012).
Comparing the changing trend of China’s energy consumption and carbon emissions (Figure 3), we discover that the two exhibit the same trends, indicating the strong positive correlation between them. Research by Wu Hong et al. (2011) has proved the existence of a positive correlation between energy consumption and carbon emissions, as well as energy intensity and carbon emission intensity; there exits the direct Granger causality. Thus, with every 1% rise in energy consumption, carbon emissions rise by 1.16%. The effects of energy consumption on carbon emissions are clear and energy consumption is the most important cause of China’s CO2 emissions (Liu, 2011).
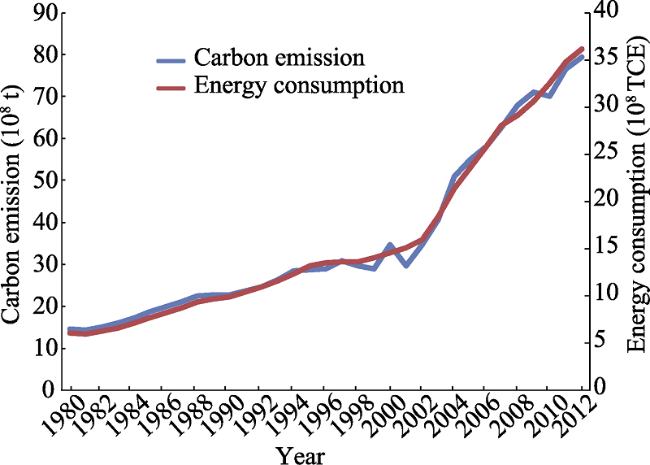
Figure 3 The linkage between energy consumption and carbon emission from 1980-2012 in China
In 2011, the burning of fossil fuels produces 7.99 billion tons of CO2, 25.4% of the world’s total emissions. In 2015, this figure increases to 8.01 billion tons; and with the continued rise in national energy demand, CO2 emissions are expected to continue to grow at a fast rate (IEA, 2013).

5 Low-carbon economic models for mitigating climate change

5.1 The connection between economic growth, energy consumption and carbon emissions

China’s economy is overly dependent on energy consumption, which is the primary source of greenhouse gases. However, it is becoming evident that energy, which is a scarce natural resource, is restraining economic growth. Thus, it is clear that the interconnectedness of energy consumption, carbon emissions and economic development deserves our more attention (Wu et al., 2013).
For the developed countries, the relation between economic growth and greenhouse gas emissions has been partially decoupled, while developing countries show a significant correlation (Contestabile, 2012). Researches about the nexus between energy consumption, carbon emissions and economic growth are concentrated on exploring the environmental Kuznets curve (EKC). Grossman, who believes that per capita income and environmental pollution exhibit an inverted “U-shaped” relationship, first proposes this curve (Grossman and Krueger, 1991). Panayotou (1997) subsequently sought to prove this concept, proposing the name “environmental Kuznets curve” firstly. There are dynamic relations between economic growth, energy consumption and the environment, where energy consumption may have an immediate positive effect on economic growth; however, this will do damage to environment (Kolstad and Krautkraemer, 1993). Subsequent studies have also discovered an inverted “U-shaped” link between per capita income and carbon emissions (Holtz-Eakin and Selden, 1995). Although Chinese scholars’ related researches begin relatively late, they make good use of statistical data, conduct quantitative analyses and find the similar results (He and Liu, 2004; Kuang, 2009). Zhao and Li (2011) pointed out that for every 1% increase in China’s GDP, carbon emissions rise by 0.36%. And carbon emissions and economic growth present an inverted “U-shaped” relationship, with the underlying mechanism of economic growth leading to energy consumption, which leads to larger carbon emissions (Chen and Zhang, 2012; Wang, 2014; Zhang and Cheng, 2009). Inversely, changes of carbon emissions also influence the economic growth and energy consumption, so there is the causation relationship between them (Figure 4).
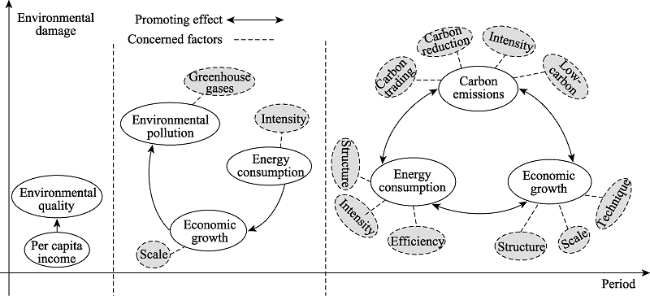
Figure 4 The tendency of linkage between carbon emission, energy consumption and economic development
At present, the rapid economic development of China depends on increasing energy consumption largely, resulting in carbon emissions. In order to achieve the carbon emission reductions target, we should improve the structure of economic development and energy consumption, increase the energy consumption efficiency, and promote the technological innovation. In the future, low-carbon economy will be the major model of economic development.

5.2 Development of low-carbon economy

Low-carbon economy has appeared initially in the UK government white paper entitled “Our Future: Creating a Low-Carbon Economy” in 2003, and it is a low-carbon development model of low consumption, low pollution, and low emissions. The white paper presents a new combination of energy innovation, emissions reduction technology, industrial structure innovation and human society development. It is an ideal economic model for reducing greenhouse gas emissions, realizing reductions targets, confronting global warming, and decoupling the connection between economic growth, energy consumption and carbon emissions (Song, 2010; Fu et al., 2008; Liu et al., 2010).
Since the establishment of low-carbon economy, Chinese scholars have begun to develop more applications than the theories (Figure 5). Currently, China’s low-carbon economic development exhibits a great difference between regions. The patterns of low-carbon economy in the eastern provinces are gradually formed. However, comparing to the eastern provinces, the western provinces’ low-carbon economic development is more influenced by energy structures, populations, economic development and consumption types. Generally speaking, we should embark from the local actual situation to develop low carbon economy, carefully designing the institutional arrangements to meet different development levels of different regions in our country (Li et al., 2015).
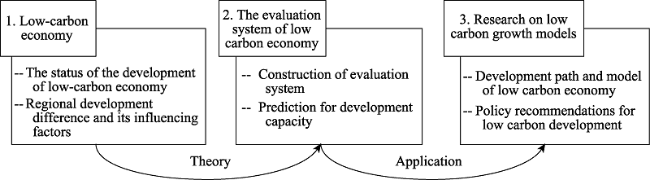
Figure 5 Transition from theory to application about study on low-carbon economy

5.3 Methods for establishing a low-carbon economy and policy recommendations

The goal of the low-carbon economy is to reduce carbon emissions, by lowering the energy consumption.
For structure adjustment, it is essential to reform the energy and industrial structure to achieve a low-carbon economy. In transforming the Chinese energy structure from one based on coal to a low-carbon one, China should follow the strategy of replacing fossil fuels with new and clean energy. In 2014, China’s GDP of tertiary industries are 9.2%, 42.6%, and 48.2%, and it is an improvement from 2013 (NDRC, 2015). In future, it will be important to further eliminate the high consumption and heavy polluting industries of the secondary economic sector, achieving a reasonable low-carbon energy structure. In China, developing the low-carbon industry and the circular economy is significant to realize the low-carbon economy. Structure adjustment will contribute 62%-67% of the emission reduction targets (Lin and Liu, 2011; Zhang and Duan, 2012).
From the viewpoint of technology, it is vital to improve energy efficiency and promote the widespread use of low-carbon technologies. In 2014, China’s energy consumption of per unit GDP falls by 4.8%, saving about 600 million TCE and 140 million tons of CO2 emissions. In the same year, CO2 emissions of per unit GDP decrease by 5.8%, down by a cumulative 15.8% from 2010 (NDRC, 2015). At the same time, there are already a great variety of low-carbon technologies in use all over the world, such as the EU’s Carbon Capture and Storage (CCS), and the United States’ “Climate Change Technology Program”, which aims to develop applications of hydrogen fuel cell technology, as well as containing plans for the future of American power and nuclear fusion (Liu et al., 2009).
From a policy perspective, energy consumption reduction could be achieved through regulatory means, taxation and the establishment of an emission-trading scheme. Specific methods should be adopted to reduce the energy consumption, including setting emissions caps, energy consumption or emissions standards, electricity supply quotas and energy or environmental taxes, as well as grants and subsidies (Cao and Zhang, 2010).
Overall, establishing a low-carbon economy will require the comprehensive support of policy, technology and funding. China should select a gentle way, mobilizing the enterprises and public to actively work together, to develop the circular economy pilot projects and build a unified low-carbon economic development system.

6 Application of methods in the previous studies

In the research progress on carbon emissions, energy consumption and low-carbon economy in China, many kinds of methods and models are adopted (Table 5). In addition to those listed in Table 5, other methods are also used. For example, a computable general equilibrium (CGE) model for calculating energy consumption and emissions under different economic growth scenarios; the decoupling theory for exploring the relationship between economic growth and environment; a life-cycle assessment for calculating carbon emissions, and the VAR model.
Table 5 The main research methods and models
Method and model Basic algorithm Application description
IPCC greenhouse gas emission inventory preparation method (Cheng, 2014) c=a×f C indicates carbon emission, a is the activity level, f is the emission factor. It provides a unified algorithm and reference standard for the estimation of carbon emission.
LMDI model C=(Y/P)×(E/Y)× (C/E) C indicates carbon emission, P is the population, Y/P is per capita GDP, E/Y represents the energy consumption intensity, C/E is the energy structure intensity; the method is widely used in carbon emissions calculation and its effect decomposition.
IPAT model I=P×A×T I depicts the impact of evaluation, P is the population, A expresses the wealthy degree, T represents the scientific and technological progress; the model is originally used for environmental impact assessment, after being improved for carbon dioxide impact factor analysis.
STIRPAT model (Song, 2012) The model is an extension of IPAT model, and a new factor is introduced in the model.
Econometric model y indicates carbon emission, x is the influencing factor of carbon emissions, α is the intercept, β is the coefficient, i is the number of cross section, t is the time, M represents the number of influencing factors of carbon emission; compared to the traditional time-series and cross-sectional data model, this model expands the amount of information, with dynamic reliability analysis, which is helpful to reflect the system structure.
Granger causality tests (Wu et al., 2013) If X helps to predict Y, then X is the granger cause of Y This model can only be used for the test of smooth sequence, and the information contained in the past X can improve the forecast of Y.
EKC model The relationship between economic development and environmental factors in inverted
U-shaped curve
Environmental Kuznets curve is used to illustrate the relationship between economic growth and carbon emissions, energy consumption.
Kaya identical equation GHG indicates the greenhouse gas emissions, TOE represents the energy consumption, GDP is the gross domestic product, POP is the population, f is the energy structure intensity, e is the energy consumption intensity, g is the per capita GDP, p is the population; the model is mainly used for analysis of the driving factors of carbon dioxide emissions.
Hierarchical Analysis Target-Criterion-Scheme The model is a kind of weight decision analysis method, which is mainly used to construct the evaluation system of low carbon economy. It is the basic step for the qualitative and quantitative analysis.
Input-output Analysis (Wang et al., 2015) c=f(I-A)-1×Y c denotes the energy carbon emissions vector, f is the direct carbon emission vector of the department, I is the intensity matrix, A is the input coefficient matrix, Y is the final demand matrix, (I-A)-1 is the Leontief inverse matrix; this model is used to analyze the carbon emissions of intermediate products in the economic operation process.

7 Conclusions

After literature comprehensive comparison and analysis, we found that most current studies concerning energy consumption, carbon emissions and low-carbon economies primarily have the following clear features.
First, the study of carbon emissions, energy consumption and low-carbon economies in China is developing rapidly, and presents many interesting results. Research contents involve the structural analysis, distribution pattern analysis, influencing factors and policy recommendations. The research fields involve geography, climatology, ecology and environmental economics. The scope of research, which is expanding daily, has spread from the national to industrial levels and from one-dimensional to multi-dimensional.
Second, bulks of studies show that there exists an inverted “U-shaped” linkage between economic development, energy consumption and carbon emission. Energy consumption in China will be in a low-speed growth after 2035 and it is expected to peak between 6.19- 12.13 billion TCE in 2050. China’s carbon emissions are expected to peak in 2035, or between 2020-2045, and the optimal range of carbon emissions is between 2.4-3.3 PgC/year. Recently, the connection between them also follows the rule of “economic development→energy consumption→carbon emissions”. For this reason, in order to safeguard the economic growth, we must find ways to reduce carbon emissions through innovative energy technologies.
Third but not the last, considering the international environment, future research should focus on the following three points. One is about international carbon trading, virtual carbon flows and energy structural reform, which should be paid more attention. Another is about research on the low-carbon economy that is relatively less concerned but a unified theoretical basis should be formed. As a result, the future research should focus on the improvement of theories towards green, circular, low-carbon economies and models. Studies of the low-carbon economy could be scaled down, focusing on micro-level analyses of low-carbon communities, households and personal behaviors. The last issue is about comprehensive evaluation methodology of carbon emissions, energy consumption and economic growth which should be established. Although the above three research areas have their own methods and theoretical bases, they all need a unified spatial analysis method. To end this objective, we strongly suggest that is necessary to establish a unified system for correctly evaluating the potential and sophisticated nexus among the carbon emissions, energy consumptions and low-carbon economy in further studies either in China or the world.

The authors have declared that no competing interests exist.

1
Andres R J, Marland G, Fung Iet al., 1996. A 1 degrees x1 degrees distribution of carbon dioxide emissions from fossil fuel consumption and cement manufacture, 1950-1990.Global Biogeochemical Cycles, 10(3): 419-429.

2
Begum R A, Sohag K, Abdullah S M Set al., 2015. CO2 emissions, energy consumption, economic and population growth in Malaysia.Renewable and Sustainable Energy Reviews, 41: 594-601.This study investigates the dynamic impacts of GDP growth, energy consumption and population growth on CO2 emissions using econometric approaches for Malaysia. Empirical results from ARDL bounds testing approach show that over the period of 1970–1980, per capita CO2 emissions decreased with increasing per capita GDP (economic growth); however from 1980 to 2009, per capita CO2 emissions increased sharply with a further increase of per capita GDP. This is also supported by the dynamic ordinary least squared (DOLS) and the Sasabuchi–Lind–Mehlum U (SLM U test) tests. Consequently, the hypothesis of the EKC is not valid in Malaysia during the study period. The results also demonstrate that both per capita energy consumption and per capita GDP has a long term positive impacts with per capita carbon emissions, but population growth rate has no significant impacts on per capita CO2 emission. However, the study suggests that in the long run, economic growth may have an adverse effect on the CO2 emissions in Malaysia. Thus, significant transformation of low carbon technologies such as renewable energy and energy efficiency could contribute to reduce the emissions and sustain the long run economic growth.

DOI

3
Bi Chao, 2015. Scheme and policies for peaking energy carbon emission in China.China Population Resources and Environment, 25(5): 20-27. (in Chinese)In November 2014,China Government officially proposed for the first time through U. S.- China Joint Announcement on Climate Change that China would achieve its CO2 emissions peak around 2030. Energy activities contribute more than 90% to total CO2 emissions in China. Energy carbon emission mitigation is essential for the 2030 peak goal. It is known that the energy carbon emission is determined by the total energy consumption and its structure. And the total energy consumption and its structure is determined by macroeconomic and social factors such as GDP growth,total populations and its structure,industrial structure,energy policies,fiscal institutions and so on. So the research of carbon emission peak should base on macroeconomic and social factors such as GDP growth,total populations and its structure,industrial structure,energy policies. In order to quantitatively analyze the path of carbon emission from energy consumption and overcome the complexities of the mechanism between the macro economy and the energy carbon emission,IESOCEM( Intertemporal Energy System Optimization and Carbon Emission Model) has been established and adopted in this paper on the basis of reference energy system and mathematics programming algorithm using the platform of GAMS. Firstly,some macro indicators in the period of 2015- 2050 such as GDP growth,total populations and its structure,industrial structure are assumed according to the New Normal Trend. Then the energy services demands have been forecasted accordingly,which drives the IESOCEM model to compute the total energy consumption and its structure and carbon emission as an economic and feasible scheme for the 2030 carbon emission peak goal. The computed scheme is as follows: the total energy consumption will increase gradually from 3. 91 billion tce( tonne of standard coal equivalent) in 2015 to 6. 265 billion tce in 2050 with annual growth rate slowing from 1. 8% to 0. 6%; the percentage of coal in the total primary energy consumption will drop from 64% in 2015 to 45% in 2050,while oil from 17% to 8%,natural gas from 7% to 11%,non-fossil energy from 12% to 36%; CO2 emission will experience fast growth in the period of 2015-2030 from 8. 01 billion tonnes to 9. 35 billion tonnes arriving the peak with the average growth rate of 89 million tonnes per year,then decline slowly to 9. 15 billion tonnes in 2050 with the average growth rate of 10 million tonnes per year. The carbon emission peak scheme is compared with the actual situation of energy and carbon emission in the year of 2013 and then policies suggestions are proposed. In order to make the 2030 carbon emission peak realized,systematic measures should be adopted in the period of 2015-2050: public-private partnership should be used and promoted to attract civil capital invested to renewable energy infrastructure for the increase of percentage of renewable energy in total energy consumption; China should enlarge gas imports and strengthen its bargaining power in gas imports through the establishment of gas imports union,encourage private capital to accelerate the construction of gas pipelines networks and gas storage facilities; the institutions of resource taxes,environmental taxes and consumption taxes should be reformed to accelerate the low-carbon transition of energy resource utilization.

4
Cansino J M, Sánchez-Braza A, Rodríguez-Arévalo M L, 2015. Driving forces of Spain’s CO2 emissions: A LMDI decomposition approach.Renewable and Sustainable Energy Reviews, 48: 749-759.

5
Cao Haixia, Zhang Fuming, 2010. Review of low carbon economy in China and abroad.Productivity Research, (3): 1-6. (in Chinese)

6
Chen Dehu, Zhang Jin, 2012. An empirical study of the environment Kuznets curve for China’s carbon emission: Based on spatial panel model.Statistics & Information Forum, 27(5): 48-53.

7
Cheng Hao, 2014. How to calculate the carbon emissions: IPCC national greenhouse gas inventory guide in 2006.China Statistics, (11): 28-30. (in Chinese)

8
Contestabile M, 2012. Sociology: Economic and emissions trends.Nature Climate Change, 2(10): 709-709.

9
Cui Jia, 2015. Study of driving factors and spatial driving types of carbon emission intensity in China [D]. Changchun: Jilin University. (in Chinese)

10
Du Jianli, Lin Zhenshan, Zhang Zhenzhenet al., 2009. Analysis on correlation of the increase of GDP and energy consumption in China based on empirical mode decomposition method.Progress in Geography, 28(1): 119-124. (in Chinese)<p>The energy is the important material foundation of a country's economic growth, and social development, economic development and energy use are closely related. EMD method is used for the first time to comparatively analyze the correlation of the increase of energy consumption and that of GDP in China. This paper tries to find out the correlation of the fluctuations between them in new ways. It reveals the relationship between energy consumption and GDP. Consequently, this will provide us some reference to the long -term socio -economic planning, energy development strategy and the formulation of relevant policies and regulations. The result shows that the increase of GDP reveals the time-scale fluctuations of about 4 years, 11 years, 18 years and 31 years. The increase of energy consumption reveals the time -scale fluctuations of about 4 years, 10 years, 18 years and 27 years, and the cycles of them match basically. We make a comparative analysis of their IMFs, and discover that energy consumption and GDP are interdependent. The conclusion shows that the theory of economics, energy consumption can advance economic growth, and energy development should take economic growth as the prerequisite. The shortage of energy will constraint on economic development. Therefore, using every means to increase energy supply and improve efficiency of energy use would be a major task to ensure China's sustainable and stable economic development.</p>

DOI

11
Fan J, Wang Q, Sun W, 2015. The failure of China’s Energy Development Strategy 2050 and its impact on carbon emissions.Renewable & Sustainable Energy Reviews, 49: 1160-1170.

12
Fu Xun, Ma Yonghuan, Liu Yijunet al., 2008. Development patterns of low carbon economy. China Population, Resources and Environment, 18(3): 14-19. (in Chinese)

13
Greening L A, Greene D L, Difiglio C, 2000. Energy efficiency and consumption: The rebound effect: A survey.Energy Policy, 28(6): 389-401.

14
Grossman G M, Krueger A B, 1991. Environmental impacts of a North American free trade agreement. National Bureau of Economic Research.A reduction in trade barriers generally will affect the environment by expanding the scale of economic activity, by altering the composition of economic activit

DOI

15
Grubb M, 2012. Emissions trading: Cap and trade finds new energy. Nature, 491(7426): 666-667.The article focuses on the implementation of carbon emissions trading schemes in different parts of the world. Emissions trading was enacted successfully through the U.S. Clean Air Act of 1990 to limit sulphur dioxide, a cause of acid rain. The European Union rapidly established a carbon cap and price covering carbon dioxide emissions from power generation and industry across 27 countries.

DOI PMID

16
Gu Chaolin, Tan Zongbo, Liu Wanet al., 2009. A study climate carbon emissions and low-carbon city planning.Urban Planning Forum, (3): 38-45. (in Chinese)

17
Guo Chaoxian, 2010. Decomposition of China’s carbon emissions based LMDI. China Population,Resources and Environment, 20(12): 4-9. (in Chinese)

18
He Jiankun, Liu Bin, 2004. Analysis of carbon emission intensity as the main index for greenhouse gas emission mitigation commitments. Journal of Tsinghua University (Science and Technology), 44(6): 740-743. (in Chinese)

19
Holtz-Eakin D, Selden T M, 1995. Stoking the fires? CO2 emissions and economic growth.Journal of Public Economics, 57(1): 85-101.

20
Hu Chuzhi, Huang Xianjin, Zhong Taiyanget al., 2008. Character of carbon emission in China and its dynamic development analysis. China Population,Resources and Environment, 18(3): 38-42. (in Chinese)

21
International Energy Agency, 2010. World Energy Outlook 2010. Paris: IEA.

22
International Energy Agency, 2013. CO2 emissions from fuel combustion highlights. Paris: IEA.CO2 emissions from fuel combustion: highlights - India Environment Portal

23
Kolstad C D, Krautkraemer J A, 1993. Natural resource use and the environment. Handbook of Natural Resource and Energy Economics, (3): 1219-1265.

24
Kuang Xinrui, 2009. A research on China’s economic development and CO2 emission [D]. Wuxi: Jiangnan University. (in Chinese)

25
Li Bo, Zhang Junbiao, Li Haipeng, 2011. Research on spatial-temporal characteristics and affecting factors decomposition of agricultural carbon emission in China. China Population,Resources and Environment, 21(8): 80-86. (in Chinese)

26
Li Xin, Wang Haibin, Chen Chaozhenet al., 2015. Inter-provincial discrepancy and spatiotemporal characteristics of carbon dioxide emission intensity from power energy consumption in China.Journal of Arid Land Resources and Environment, 29(1): 43-47. (in Chinese)

27
Lin B Q, Moubarak M, 2013. Decomposition analysis: change of carbon dioxide emissions in the Chinese textile industry.Renewable & Sustainable Energy Reviews, 26: 389-396.

28
Lin B Q, Wang X L, 2015. Carbon emissions from energy intensive industry in China: Evidence from the iron & steel industry.Renewable & Sustainable Energy Reviews, 47: 746-754.

29
Lin Jinhui, Liu Jun, 2011. Antidumping jumping FDI employment and welfare of the host country. On Economic Problems,(3): 37-40, 56. (in Chinese)Antidumping-jumping FDI will definitely bring diverse effects to the host country while it weakens the effect of protection.Among those effects,employment-effect is an important one.The main contributions of this paper include two aspects.The first one is that it introduces a variable ,representing the elasticity of employment effect brought by FDI,which is used in a model based on the framework of the general equilibrium model given by Jones(1965).Using the model,it finds the positive effects brought by the elasticity.The second one is that it provides several ways of increasing the elasticity of employment effect brought by antidumping-FDI.All of those ways apply specially to the feature of antidumping-jumping FDI,while not the common FDI.

30
Liu Hongguang, Liu Weidong, 2009. Decomposition of energy-induced CO2 emissions in industry of China.Progress in Geography, 28(2): 285-292.<p>There are many articles in the field of CO2 emission decomposition and the methods including Laspeyres index, Sample Average Division and Adaptive-Weighting Division are more scientific now, but many researchers just focused on one factor of carbon emission intensity or energy consumption intensity and lacked further decomposition. This paper presents a complex formula to calculate carbon emission, then examines the factors, including total energy consumption, energy mix, technology, inter -input, industrial structure and total industrial production, which have effects on CO2 emission from industrial energy during the period 1992~ 2005 by the decomposition method of LMDI proposed by Ang et al. The results show that the gross emission of CO2 induced by the energy consumption of manufacture in China increased rapidly during the period of 1992 -2005, especially in 2002 -2005 coherent with the economic development path. And the increase is mostly derived from the augment of total industrial production with the characteristics of heavy industrialization, low efficiency of energy consumption and the mix of primary energy with high proportion of coal. Beyond our expectation, the factors of technology (proportion of inter-input) and industrial structure do not have a big reduction of CO2 emission because of the economic development mainly driven by huge investment of infrastructure such as transportation, housing construction and primary manufacture such as steel, cement, chemistry and so on. But the quantity change of inter-input including other unaccounted factors is the primary contributor. The results indicate that accelerating technology upgrade, regulating industrial structure and energy mix, and developing CMD (Clean Development Mechanism) project are the efficient ways to reduce CO2 emissions.</p>

DOI

31
Liu Hui, Cheng Shengkui, Zhang Lei, 2002. The international latest research of the impacts of human activities on carbon emission.Progress in Geography, 21(5): 420-429.Global warming has been becoming a world wide issue in which anthropogenic emission of greenhouse gases (CO 2, CH 2, N 2O) plays a main role. According to the analysis of international study on it since 1990&rsquo;s, this paper summarized the main contents and the methods of international research on the impacts of human activities on carbon emission. The main contents are: ① energy consumption and carbon emission, including the transform of the structure of energy consumption and the construction of low emission supply system (LESS) ; ② economic development and carbon emission, which focus on the relationship between the different economic development style and carbon emission, including economic development stage, economic structure, and economic development speed; ③ agriculture and carbon cycle, including the relationship between land use/land cover change and carbon cycle, impacts of management of agricultural land and restoration of degraded land on carbon cycle, and the influence of agricultural development level and structure&rsquo;s change on carbon emission; ④ the economic cost of CO 2 emission limits and the strategies for optimal CO 2 emission abatement. Because carbon emission process caused by human activities is very complicated, more and more synthetical models, based on a vast amount of data, such as carbon emission/energy model, economic model of energy consumption and carbon emission limitation, DIAM model, etc., are used for analysis besides the traditional regression analysis and regional contrast analysis. Meanwhile, several issues on carbon cycle research that must be emphasized in China were analyzed.

DOI

32
Liu Lancui, Gan Lin, Cao Donget al., 2009. Analysis and enlightenment from climate policies of major economies.Sino-Global Energy, 14(9): 1-8. (in Chinese)In response lo climate change,the world's major greenhouse gas emitters such as the United States,the European Union,Australia and Japan have all set their objectives to control greenhouse gas emissions. To meet these objectives,these economies have enacted laws and regulations,established carbon emission trading systems and implemented various taxation policies lo deal with global climate change.Many countries are increasing their investment in the research and development of low -carbon technologies lo mitigate climate change and have enacted policies and laws on the development and utilization of renewable energy and established climate change foundations.China could gain certain enlightenment from these countries' climate policies lo perfect ils climate policy framework system.China should quicken its pace of building greenhouse gas statistical systems,promote energy saving through technical innovations and fiscal policies,develop renewable energy to reduce its reliance on fossil fuels and set up special scientific foundations and low -carbon technology foundations to tackle climate change.

DOI

33
Liu Litao, Shen Lei, 2011. Scenario analysis of energy zoning and function orientation on sustainable development of China.Journal of Natural Resources, 26(9): 1484-1495. (in Chinese)This paper constructs a preliminary framework of energy sustainable development zoning of China by comprehensively using of scenario analysis based on IPAT equation and GIS spatial analysis. And then it carries out research on energy sustainable development zoning and regional function orientation of China based on this framework. From the above analysis we drew the following conclusions: 1) upon entering the mid 21st century, the primary energy demand is still concentrated mostly in developed areas along the east coast of China, while energy supply is mainly distributed in the Northeast China, North China and Northwest China (&quot;Three North&quot; areas for short); 2) the highest energy dependence rates are found concentrated in the east coast of China, such as the Yangtze River Delta and Pearl River Delta, specifically including the cities of Shanghai, Beijing, the provinces of Zhejiang, Jiangsu, Guangdong and Hainan, while the minimum foreign energy dependence is mainly distributed in the &quot;Three North&quot; areas; 3) we can initially divide China into five regions by energy sustainability: strong unsustainable area (I), unsustainable area (II),weak sustainable area (III), sustainable area (IV) and strong sustainable area (V). Among them, for energy stronger input area (I), in order to achieve sustainable energy, the most significant choice is, on the one hand, to explore the potential of local energy resources realizing the localization of energy resources, while on the other hand, to diversify structure and sources of energy resources; for strong input area (II), achieving localization and diversification of energy resources is the main task; for self-sufficient area (III), enhancing the share of renewable energy in the energy structure and optimizing the energy structure is the core of the area; for strong output area (IV), as a regional energy security buffer is the main function of this area; and for stronger output area (V), as a national energy security protection zone and energy base are the primary responsibilities and functions of this area.

DOI

34
Liu Weidong, Zhang Lei, Wang Limaoet al., 2010. A sketch map of low-carbon economic development in China.Geographical Research, 29(5): 778-788.At the 2009 United Nations Climate Change Conference at Copenhagen,China announced its target of CO2 emission reduction,i.e. by 2020 the amount of CO2 emission per output unit (GDP) will drop by 40%-45% compared to that in 2005. The target will be incorporated into China's long term socio-economic planning. Towards such a target,there have been two distinct viewpoints in China. While some scholars tend to consider it quite easy,others argue that it is hard to achieve the target as China is still in the middle of rapid industrialization and urbanization. Based on existing literature and research,in this paper,we will first examine the factors affecting CO2 emission in China,and then analyze the potentials of major ways of CO2 emission reduction,and lastly propose a sketch map of low-carbon economic development. We try to argue that there exists a reversed U-shaped relationship between the amount of CO2 emission per output unit (carbon intensity) and industrial structure. Carbon intensity rises with economic growth at the early stage of industrialization,and decreases after going to the peak at the middle stage of industrialization. By employing a multiple regression,we find that the change of carbon (energy) intensity in the last 15 years in China can be well explained by two factors,i.e. the share of the tertiary industry in GDP and the share of high energy-consumption sectors in total value-added of the second industry (including thermal-power,metallurgy,chemical and construction materials). In 2002-2008,the tertiary share in GDP in China rose little while that of high energy-consumption sectors rose significantly,which resulted in an upturn of carbon intensity of economic output in China. Such "abnormal" can be partly attributed to China's development pattern of being a world factory of low-end commodities. Thus,we tend to argue that China might not be able to fulfill the 2020 target of CO2 emission reduction if it did not make a visible progress in changing the development pattern and industrial restructuring. That is,adjustment of industrial structure is a major way of fulfilling the 2020 target,which may contribute around 61.5%~67.2% of carbon intensity reduction. Besides,energy saving via technical measures and innovation in sectors like industries (13% of contribution),buildings (10%) and transportation (3%) can make significant contribution to fulfilling the target. Lastly,the development of non-fossil energy is another important path of low-carbon growth,which can contribute about 10% to carbon intensity reduction.

DOI

35
Liu Zhixiong, 2011. The relationship between energy consumption, economic growth and carbon emissions in China. Coal Economic Research,(4): 37-41, 65. (in Chinese)

36
Makarov A A, Bashmakov I, 1991. An energy development strategy for the USSR: Minimizing greenhouse gas emissions.Energy Policy, 19(10): 987-994.The second largest national consumer of commercial energy in the world, the USSR also emits large quantities of energy-related CO 2 . This study uses four long-term scenarios of energy use and related emissions to investigate opportunities for reducing the USSR's greenhouse gas emissions over the next 30 years. This paper shows that if no measures are taken to control these emissions, CO 2 and methane will increase by 1.5 to 2 times the 1990 level by the year 2020. However, this growth can be restrained dramatically through structural changes in the Soviet economy, improved energy efficiency and interfuel substitutions. Abating emissions of carbon in the USSR would entail the widespread implementation of energy policies and, for more substantial reductions, higher investments from the Soviet economy. Achieving these goals would also require broad support from the international community.

DOI

37
National Development and Reform Commission (NDRC), 2015. The 2015 Annual Report of China’s Response to Climate Change Policies and Action. Beijing.

38
Nulíček V, 1993. Possibilities of reduction of carbon dioxide emissions from energy processes in the Czech Republic.Energy Conversion and Management, 34(9): 753-774.The level of CO 2 emissions (as well as of the other) air-pollutants) is relatively very high in the Czech Republic. The greatest sources of them are energy transformation processes, i.e. fossil fuel combustion). Two most important reasons for high environmental burden in the CR are:

DOI

39
Ozturk I, Acaravci A, 2010. CO2 emissions, energy consumption and economic growth in Turkey.Renewable and Sustainable Energy Reviews, 14(9): 3220-3225.<h2 class="secHeading" id="section_abstract">Abstract</h2><p id="">This paper examines the long run and causal relationship issues between economic growth, carbon emissions, energy consumption and employment ratio in Turkey by using autoregressive distributed lag bounds testing approach of cointegration. Empirical results for Turkey over the period 1968&ndash;2005 suggest an evidence of a long-run relationship between the variables at 5% significance level in Turkey. The estimated income elasticity of carbon emissions per capita is &minus;0.606 and the income elasticity of energy consumption per capita is 1.375. Results for the existence and direction of Granger causality show that neither carbon emissions per capita nor energy consumption per capita cause real GDP per capita, but employment ratio causes real GDP per capita in the short run. In addition, EKC hypothesis at causal framework by using a linear logarithmic model is not valid in Turkish case. The overall results indicates that energy conservation policies, such as rationing energy consumption and controlling carbon dioxide emissions, are likely to have no adverse effect on the real output growth of Turkey.</p>

DOI

40
Panayotou T, 1997. Demystifying the environmental Kuznets curve turning a black box into a policy tool.Environment and Development Economics, 2(4): 465-484.The reduced-form approach to the incomeenvironment relationship and to explore its determinants as a step towards a better understanding of this relationship and its potential as a policy tool. The role of the rate of economic growth and population density is also explored. A main finding is that at least in the case of ambient SO2 levels, policies and institutions can significantly reduce environmental degradation at low income levels and speed up improvements at higher income levels, thereby flattening the EKC and reducing the environmental price of economic growth.

DOI

41
Qin Dahe, 2014. Climate change science and sustainable development.Progress in Geography, 33(7): 874-883. (in Chinese)Since the Fourth Assessment Report (AR4) was released by the Intergovernmental Panel on Climate Change (IPCC) in 2007, new observations have further proved that the warming of the global climate system is unequivocal. Each of the last three successive decades before 2012 has been successively warmer at global mean surface temperature than any preceding decade since 1850. 1983-2012 was likely the warmest 30-year period of the last 1400 years. From 1998 to 2012, the rate of warming of the global land surface slowed down, but it did not reflect the long-term trends in climate change. The ocean has warmed, and the upper 75 m of the ocean warmed by more than 0.11℃ per decade since 1970. Over the period of 1971 to 2010, 93% of the net energy increase in the Earth's climate system was stored in the oceans. The rate of global mean sea level rise has accelerated, which was up to 3.2 mm yr-1 between 1993 and 2010. Anthropogenic global ocean carbon stocks were likely to have increased and caused acidification of the ocean surface water. Since 1971, the glaciers and the Greenland and Antarctic ice sheets have been losing mass. Since 1979, the Arctic sea ice extent deceased at 3.5% to 4.1% per decade, and the Antarctic sea ice extent in the same period increased by 1.2% to 1.8% per decade. The extent of the Northern Hemisphere snow cover has decreased. Since the early 1980s, the permafrost temperatures have increased in most regions. Human influence has been detected in the warming of the atmosphere and the ocean, changes in the water cycle, reductions in snow and ice, global mean sea level rise, and changes in climate extremes. The largest contribution to the increase in the anthropogenic radiative forcing was by the increase in the atmospheric concentration of CO<sub>2</sub> since 1750. It led to more than half of global warming since the 1950s (with 95 % confidence). It is predicted using Coupled Model Intercomparison Project Phase 5 (CMIP5) and Representative Concentration Pathways (RCPs) that the global mean surface temperature will continue to rise for the end of this century, the frequency of extreme events such as heat waves and heavy precipitation will increase, and precipitation will present a trend of "the dry becomes drier, the wet becomes wetter". The temperature of the upper ocean will increase by 0.6 to 2.0℃ compared to the period of 1986 to 2005, heat will penetrate from the surface to the deep ocean which will affect ocean circulation, and sea level will rise by 0.26 to 0.82 m in 2100. Cryosphere will continue to warm. To control global warming, humans need to reduce the greenhouse gas emissions. If the increase in temperature is higher than 2℃ than before industrialization, the mean annual economic losses worldwide will reach 0.2% to 2.0% of income, and cause large-scale irreversible effects, including death, disease, food insecurity, inland flooding and water logging, and rural drinking water and irrigation difficulties that affect human security. If taking prompt actions, however, it is still possible to limit the increase in temperature within 2℃. To curb the gradually out-of-control global warming and achieve the goal of sustainable development of the human society, global efforts to reduce emissions are needed.

DOI

42
Qu Shenning, Guo Chaoxian, 2010. Forecast of China’s carbon emission based on STIRPAT model. China Population,Resources and Environment, 20(12): 10-15. (in Chinese)

43
Ramachandra T V, 2012. Decentralized carbon footprint analysis for opting climate change mitigation strategies in India.Renewable & Sustainable Energy Reviews, 16(8): 5820-5833.Carbon footprint (CF) refers to the total amount of carbon dioxide and its equivalents emitted due to various anthropogenic activities. Carbon emission and sequestration inventories have been reviewed sector-wise for all federal states in India to identify the sectors and regions responsible for carbon imbalances. This would help in implementing appropriate climate change mitigation and management strategies at disaggregated levels. Major sectors of carbon emissions in India are through electricity generation, transport, domestic energy consumption, industries and agriculture. A majority of carbon storage occurs in forest biomass and soil. This paper focuses on the statewise carbon emissions (CO2, CO and CH4), using region specific emission factors and statewise carbon sequestration capacity. The estimate shows that CO2, CO and CH4 emissions from India are 965.9, 22.5 and 16.9Tg per year, respectively. Electricity generation contributes 35.5% of total CO2 emission, which is followed by the contribution from transport. Vehicular transport exclusively contributes 25.5% of total emission. The analysis shows that Maharashtra emits higher CO2, followed by Andhra Pradesh, Uttar Pradesh, Gujarat, Tamil Nadu and West Bengal. The carbon status, which is the ratio of annual carbon storage against carbon emission, for each federal state is computed. This shows that small states and union territories (UT) like Arunachal Pradesh, Mizoram and Andaman and Nicobar Islands, where carbon sequestration is higher due to good vegetation cover, have carbon status >1. Annually, 7.35% of total carbon emissions get stored either in forest biomass or soil, out of which 34% is in Arunachal Pradesh, Madhya Pradesh, Chhattisgarh and Orissa.

DOI

44
Shen L, Gao T M, Zhao J Aet al., 2014. Factory-level measurements on CO2 emission factors of cement production in China.Renewable & Sustainable Energy Reviews, 34: 337-349.Cement is a primary component of concrete and is consumed extensively for construction and transportation infrastructures worldwide. Cement is largely produced and consumed locally but has global impact in terms of both energy consumption and greenhouse gas emissions. China is both the largest producer of cement and the biggest emitter of CO2 emissions in the world. It has been widely recognized that uncertainties of Chinas CO2 emissions were poorly quantified and clear discrepancies can be identified among different sources. These discrepancies arise from many uncertainties, including system boundary and statistical standards, availability of production data (especially for the clinker and cement outputs), and emission factors. We argue that the emission factors (EFs, either default values or adjusted ones) are the most important here and highlight the importance of clearly defining the CO2 accounting and reporting boundaries for determining the emission factors. We therefore developed a factory-level measurement for different types of clinker and cement production, primarily using onsite surveys and sampling, with the objective of distinguishing process-, combustion- and electricity-related emission factors on a factory level. It is a bottom-up CO2 emission inventory for China using the uniform formula and calculators and the first time factory-level sampling method (BFSM) based on three tiers of production lines, provincial and national integrations. Our results indicate that Chinas carbon emissions from cement production might be overestimated in the previous estimates because they overlooked the technology transition from the wet process to the dry process, differences in lime content and clinker-to-cement ratios, raw materials and fuels substitutions, and usages of blend additives.

DOI

45
Shen Lei, Liu Litao, Wang Limaoet al., 2015. 2050 energy consumption projection for China.Journal of Natural Resources, 30(3): 361-373. (in Chinese)

46
Shen Lei, Xue Jingjing, 2011. Development path choice and strategy framework of China’s energy security. China Population,Resources and Environment, 21(10): 49-54. (in Chinese)

47
Song Deyong, Lu Zhongbao, 2009. The factor decomposition and periodic fluctuations of carbon emission in China.China Population, Resources and Environment, 19(3): 18-24. (in Chinese)Adopting a two-stage LMDI model and 1990 to 2005 time series data of China,we divide the factors that influence the carbon dioxide emission coming from the energy consumption into four aspects,production scale,energy structure,carbon emission intensity,and energy intensity. Then we add production structure effect to the model and decompose the driving factor nergy intensity,which has a pivotal effect to reduce the carbon emission. According to the scale of production and the efficiency of energy using,which plays a key role to increase or reduce the carbon emission,we define the following four economic growth modes,i.e. the "high growth with high efficiency","low growth with low efficiency","low growth with high efficiency" ,and "high growth with low efficiency". Based on the result above,we analyze the periodic fluctuating characters of carbon emission in China. The result shows the difference of economic growth mode in the four stages has been the root cause to the fluctuation of carbon emission from the 1990s; especially,the "high input,high emission and low efficiency" economic growth mode between 2000 to 2004 has resulted in the rapid growth of the carbon emission. Thus we suggest that China should change the its economic growth mode to effectively control and reduce the carbon dioxide emission.

48
Song Dongfeng, 2010. Current situation of China’s low-carbon economy.Ecological Economy, (9): 85-87. (in Chinese)

49
Song Xiaohui, Zhang Yufen, Wang Yimeiet al., 2012. Analysis of impacts of demographic factors on carbon emission based on the IPAT model.Research of Environmental Sciences, 25(1): 109-115. (in Chinese)

50
Sun Jianwei, Zhao Rongxin, Huang Xianjinet al., 2010. Research on carbon emission estimation and factor decomposition of China from 1995-2005.Journal of Natural Resources, 25(8): 1284-1295. (in Chinese)Using statistic data from 1995 to 2005 of China, based on greenhouse gas inventory method of IPCC, this paper established the framework of carbon emission estimation system of China, estimated the carbon emission in China from 1995 to 2005, and analyzed the carbon emission, carbon emission intensity and their changing factors by using factor decomposition model. The main conclusions are as follows: 1) The amount of carbon emission of China firstly slowly decreased and then rapidly increased from 1995 to 2005. The total carbon emission in 2005 was 22.02&times;10<sup>8</sup> t, which increased 66% than that of 1995, and the carbon absorption in 2005 was 2.97&times;10<sup>8</sup> t. So the net carbon emission of China in 2005 was 19.05&times;10<sup>8</sup> t, which increased 79% than that of 1995. 2)Carbon emission from energy activity and industrial production were the main carbon source of China, which indicated that traditional energy use especially high energy consumption industry was the main reason caused the increasing of carbon emission since 1995. Therefore, adjusting energy structure, innovating energy technology and advocating clean energy were the key methods to decrease carbon emission intensity. 3) Generally, the changing amount of carbon emission intensity appears increasing trend. Carbon emission intensity before 2002 declined year by year, but the changing amount of carbon emission intensity became positive after 2002. Technological progress was the main factor driving the change of carbon emission intensity. Despite industrial structure adjustment was not the determinative factor, but it should become the leading factor that drives carbon emission reduction in the long run. 4) The main motive power driving the increase of total carbon emission was the increase of GDP, and the technological progress was the main factor caused the decrease of the total carbon emission. 5) Industrial sector basically determined the change of carbon emission intensity and total carbon emission amount, which means that the industrial sector was the key in fulfilling carbon emission reduction. So, adjusting industrial structure on macroscopic and internal industrial aspect is the important way to decrease the total carbon emission, which is also the key point in future low-carbon planning.

DOI

51
Tunç G I, Türüt-Aşık S, Akbostancı E, 2009. A decomposition analysis of CO2 emissions from energy use: Turkish case.Energy Policy, 37(11): 4689-4699.<h2 class="secHeading" id="section_abstract">Abstract</h2><p id="">Environmental problems, especially &ldquo;climate change&rdquo; due to significant increase in anthropogenic greenhouse gases, have been on the agenda since 1980s. Among the greenhouse gases, carbon dioxide (CO<sub>2</sub>) is the most important one and is responsible for more than 60% of the greenhouse effect. The objective of this study is to identify the factors that contribute to changes in CO<sub>2</sub> emissions for the Turkish economy by utilizing Log Mean Divisia Index (LMDI) method developed by Ang (2005) [Ang, B.W., 2005. The LMDI approach to decomposition analysis: a practical guide. Energy Policy 33, 867&ndash;871]. Turkish economy is divided into three aggregated sectors, namely agriculture, industry and services, and energy sources used by these sectors are aggregated into four groups: solid fuels, petroleum, natural gas and electricity. This study covers the period 1970&ndash;2006, which enables us to investigate the effects of different macroeconomic policies on carbon dioxide emissions through changes in shares of industries and use of different energy sources. Our analysis shows that the main component that determines the changes in CO<sub>2</sub> emissions of the Turkish economy is the economic activity. Even though important changes in the structure of the economy during 1970&ndash;2006 period are observed, structure effect is not a significant factor in changes in CO<sub>2</sub> emissions, however intensity effect is.</p>

DOI

52
Wang Qian, 2014. Research on the affecting factors of carbon emissions in Guangdong based on LMDI [D]. Guangzhou: Guangdong Academy of Social Sciences. (in Chinese)

53
Wang Saojian, Liu Yanyan, Fang Chuanglin, 2015. Review of energy-related CO2 emission in response to climate change.Progress in Geography, 34(2): 151-164. (in Chinese)Climate change has in recent years become an environmental issue globally. Through deepening research into and analysis of the phenomenon, most climate scientists now identify greenhouse gases, most notably CO<sub>2</sub> emissions, as constituting the main cause of global warming. Based on literature study and comparative analysis, this article discusses the progress of the research of CO<sub>2</sub> emissions from a multidisciplinary perspective and analyzes the calculation methods, intensity, performance, influencing factors, and forecasting methods of CO<sub>2 </sub>emissions. This article also discusses the remaining issues and future directions of the research on CO<sub>2</sub> emissions. Results indicate that the research of CO<sub>2</sub> emissions has gained fruitful achievements and has experienced rapid development in recent years. CO<sub>2</sub> emission is an integrated, complex, interdependent system engineering of numerous variables interplay between different factors. Under the framework of multidisciplinary integration, geographical and spatial factors have however received insufficient attention. Research scale has mainly focused on global and international levels, although recent studies have begun to highlight multi-scale research and pay attention to scale effect. Panel study of provincial and city scales is still scarce. Panel data are gradually receiving attention; however, dynamic analysis and comparative assessment still need improvement. Future research should focus on creating more detailed and comprehensive datasets, exploring multi-scale integrated research, and highlighting city scale analysis. Furthermore, future study should emphasize adapting theories to localized practices, employing systemic thinking and methods for differentiated trend research.

DOI

54
Wang Yuan, Zhao Lixia, Yu Xiaet al., 2015. Carbon emission change of energy consumption and its stress evaluation on local climate change in Shanghai. Journal of Fudan University (Natural Science), (4): 439-448. (in Chinese)

55
Wu Hong, Gu Shuzhong, Guang Xinglianget al., 2013. Analysis on relationship between carbon emission from fossil energy consumption and economic growth in China.Journal of Natural Resources, 28(3): 381-390. (in Chinese)<p>Climate change caused by excessive fossil energy consumption has drawn attention of the researchers around the world to focus on economic development pattern. Econometric method is used to study relationship between carbon emissions from fossil energy consumption and economic growth in China in the paper. First, we estimate carbon emissions from fossil energy consumption in 1953-2010 in China. Second, we establish an econometric model of relationship between carbon emissions and Gross Domestic Product(GDP). Finally, we analyze relationships between two variables through cointegration test, ECM model, impulse response function based on VAR model and Granger causality test. The results show that there is cointegration relation of long-term equilibrium and short-term dynamic adjustment mechanism between carbon emissions from fossil energy and GDP during 1953-2010 in China. Long-term equilibrium will automatically be achieved through short-term dynamic adjustment mechanism. Current GDP has a significant effect on carbon emissions. Every 1% increase of GDP leads to 0.719% increase of carbon emissions. Wide adjustment range of previous error to current carbon emissions attains -0.102. Impulse response function waveform chart between carbon emissions and economic growth depict influence and response in 20 stages, revealing complex dynamic short-term relationship. Unidirectional Granger causalities from carbon emissions to GDP are as follows. Carbon emissions are the Granger cause for economic growth but economic growth is not the Granger cause for carbon emissions. High carbon emissions have promoted economic growth while economic growth hasn&rsquo;t resulted in significant carbon emissions increase in the past 58 years. The results will provide basis and support for policy making on energy saving and emission reduction and carbon emissions reduction in China.</p>

DOI

56
Wu Hong, Gu Shuzhong, Zhou Honget al., 2011. Relationship between energy consumption, carbon emissions and economic growth in Hebei province.Resources Science, 33(10): 1897-1905. (in Chinese)Economic development is highly related to energy consumption and energy consumption results in much carbon emissions. Examining relationships among energy consumption, carbon emissions, and economic growth is important to implement policies regarding energy saving, emissions reduction, and low carbon economy. The international community has been progressively promoting carbon emissions reduction and making efforts to form new macro background. As a developing country, China is keeping rapid economic growth. Meanwhile, it is making substantial efforts to achieve carbon emissions reduction goals. China has entered a fast industrialization and urbanization development stage at which the energy demand intensity is high. Coordinated development among energy consumption, carbon emissions, and economic growth is necessary for harmonious society construction. Based on statistical data, the authors estimated the amount of energy-related carbon emissions and carbon emissions from different types of primary energy, including coal, oil, and natural gas in Hebei Province from 1980 to 2009. Then changes track for carbon emissions and comparative analysis were performed. Results show that the total carbon emissions and carbon emissions caused by coal, oil, and natural gas were increasing in Hebei Province from 1980 to 2009. Carbon emissions came mainly from coal consumption. Compared to Beijing and Tianjin, carbon emissions in Hebei showed a rapid increasing trend since 2000. The consistent relationship and decoupling relationship were subsequently examined among energy consumption, carbon emissions, and economic growth. The consistent relationships are as follows. First, change trends in energy consumption and carbon emissions were similar. Second, changes in energy intensity and carbon emissions intensity were similar. Decoupling relationships provided a quantitative expression based on the decoupling theory and decoupling elasticity index. During the period 1980-2009, the decoupling elasticity index between carbon emissions and economic growth was generally in accord with the decoupling elasticity index between energy consumption and economic growth in the same year. Weak decoupling was found in most years. The decoupling state is influenced by macroeconomic situations, policy regulation, economic development patterns, technological progress, industrial structure, energy structure and so on. The weak decoupling state would continue in the future. Results of this study would be helpful in formulating reasonable strategies and policies for carbon emissions reduction and energy development in Hebei Province.

57
Yan Qiongwei, Chen Hao, 2011. Research on the relationship between GDP and energy consumption. China Population, Resources and Environment, 21(7): 13-19. (in Chinese)Choosing the annual data of total energy consumption and GDP in China from 1985 to 2009 as the research sample,this paper tests the roots of unity,the cointegration and the Engle-Grange causality for the data of total GDP of time series and the energy consumption by using Eviews software.The result shows that the second order difference of GDP and the energy consumption remains steady when it is at 5% significance level.And there is a cointegration relationship for energy consumption and GDP when it is at 5% significance level.Moreover,the Engle-Grange causality test shows that the causality relationship from GDP to energy consumption isn't clear at 5% significance level,but there exists one-way causality relationship from the long-term energy consumption to the GDP.As to the research conclusion,the GDP growth causes energy needs and consumption endogenetic growth;energy consumption reduction does not affect the growth of output,employment and income.In order to solve many conflicts to keep a sustained economic growth in our country presently,first of all,we should solve the energy shortage problem by developing new energies,raising energy efficiency,adjusting energy strategy,implementing energy conservation and the energy saving policy in our country so as to provide a sufficient energy supply as a guarantee.Second,we must transform the way of economic growth,adjust the industrial structure,particularly the industry structure,speed up technological innovation,and develop high and new technology industry and the knowledge-intensive industry in order to get rid of the dependence on energy in our country in its economic development.

58
Yang Jian, Liu Huajun, 2012. Regional difference decomposition and influence factors of China’s carbon dioxide emissions. The Journal of Quantitative & Technical Economics,(5): 36-49, 148. (in Chinese)

59
Yang Wei, Wang Chengjin, Jin Fengjunet al., 2013. Decomposition of energy intensity change in industrial sub-sectors and its spatial-temporal variation in China.Journal of Natural Resources, 28(1): 81-91. (in Chinese)<p>Differing from previous studies primarily focusing on the change of the total energy consumption intensity of China, the paper analyzes aggregate industrial energy intensity changes in 25 selected industrial sub-sectors of 30 provinces in China (not including Tibet, Hong Kong, Macao and Taiwan due to no data), using the adaptive additive decomposition method. The changes of industrial energy consumption are decomposed into industrial structure effect, technological effect and economic scale effect. By employing adaptive additive decomposition analysis, it was found that the strength and direction of the three effects are different in different provinces and times intervals. Economic scale effect played a dominant role in increasing industrial energy intensity, and its difference is not significant in the two periods 1985-1995 and 1995-2004. But, it played two roles in increasing and reducing industrial energy intensity and its difference is significant in the period 2004-2008. Technical effect played a dominant role in reducing industrial energy intensity, and its difference is significant in different provinces in the two periods 1995-2004 and 2004-2008. And in the period 1985-1995, its strength and direction are both different. Overall, its role in reducing industrial energy intensity needs to be improved in some provinces, to reduce proactively industrial energy consumption. Structural effect played two roles in increasing and reducing industrial energy intensity and its difference is significant in different provinces all the time. Its strength was small in most provinces except Beijing, Shanghai and Guangdong. This indicated that its urgent need is to tap the potential of the structural effect in reducing industrial energy intensity. Thus, significant steps should be taken in effective structural adjustment to reduce industrial energy consumption in the future.</p>

DOI

60
Yang J, Chen B, 2014. Carbon footprint estimation of Chinese economic sectors based on a three-tier model.Renewable & Sustainable Energy Reviews, 29: 499-507.To respond to the call of greenhouse gas emissions mitigation, an efficient carbon accounting framework should be proposed. Traditional narrowly defined estimation protocols that consider the direct emissions from native energy consumption may generally lead to underestimates of the carbon emissions derived from providing products and services. To comprehensively evaluate the supply-chain carbon performance in all economic sectors of China, the Economic Input utput Life Cycle Assessment (EIO-LCA) based carbon footprint accounting framework should be employed. Because carbon emissions also occur in non-energy production processes, carbon emissions from the non-energy industrial process should also be incorporated into the accounting framework. This paper assessed 3 scopes of carbon emissions of Chinese economic sectors, including (1) direct emissions from energy consumption, and the industrial process, (2) emissions from purchased energy, (3) supply chain emissions combining both fuel combustion and industrial processes. The results shown that there is a huge underestimation of the carbon emission from various sectors using traditional carbon protocols compared with the tier 3 supply-chain CO 2 emission. The emissions from industrial processes also constitute a large proportion, which cannot be ignored. In addition, we find that embodied CO 2 emissions in exports concentrated on primary energy intensive sectors, indicating the importance of restructuring of export goods and services. It is proved that the three tier model provides a tool for decision makers to identify the national high carbon emission sectors and make effective carbon mitigation strategies.

DOI

61
Yue Chao, Wang Shaopeng, Zhu Jianglinget al., 2010. 2050 carbon emissions projection for China-carbon emission and social development.Acta Scientiarum Naturalium Universitatis Pekinensis, 46(4): 517-524. (in Chinese)Based on a brief review of existing carbon emission methods and models, the future carbon emissions for China was predicted up to 2050. The best probable emission range for China is 2.4-3.3 PgC/a in 2050, with per capita emissions of 1.7-2.3 ton C/cap. According to the upper limit of the best probable range,China's carbon emissions will peak in 2035, with the peak valueof 4.4PgC/a and per capita emissions of 3.0 ton C/cap. The best probable range of cumulativeemission for China for 2006-2050 is 102-156 Pg C. The cumulative per capita emission for 2006-2050 is 71-109 ton C/ cap, with the upper limit lower than that of America and comparable with developed countries. While for 1850-2005, cumulative per capita emissions for China were only 1/10 that of developed countries and 1/20 of America, which implies that in terms of cumulative per capita emissions, significant gap still exists between China and developed countries.

62
Zhang Li, Lei Jun, Zhang Xiaolei, 2012. Variations and influential factors of carbon emission of primary energy consumption in Xinjiang during the period 1952-2008.Resources Science, 34(1): 42-49. (in Chinese)The carbon cycle is a basic element cycle on the Earth; it plays a vital role in earth system evolution and sustainable development of human society. In the global research of carbon cycle, fossil-fuel energy consumption, cement production, and land use are considered three main sources of carbon emissions related to human economic activities, in which the fossil-fuel energy consumption is the largest anthropogenic source of carbon emissions and the primary cause of increases in greenhouse gases in the atmosphere. The annual consumption of fossil fuel emissions to the atmosphere is about 6~6.5 billion tons of carbon dioxide, accounting for 70% of the atmospheric carbon emissions. In this study, carbon emissions in Xinjiang during the period 1952-2008 were calculated according to the default value of the carbon emission calculation guidelines of IPCC. Changes in total carbon emission, carbon emission structure, as well as carbon emission intensity were systematically analyzed. The elements of carbon emissions were separated by the Logarithmic Mean Divisia Index, with the influential factors of carbon emissions being analyzed. Results show that 1) both total carbon emissions and carbon emissions per capita increased gradually from 1952 through 2008. The carbon emissions of primary energy consumption in Xinjiang increased from 128 × 10<sup>3</sup>t up to 43.6 × 10<sup>6</sup>t; 2) The level of carbon emissions per 10,000 Yuan of GDP increased first and then decreased, with the inflection point in 1978; 3) Coal consumption is still the major source of CO<sub>2</sub> emissions and CO<sub>2</sub> emissions from the secondary industry were the largest; 4) In general, the carbon emissions in Xinjiang has experienced five phases and it is now in the phase of rapid growth of economy and carbon emissions; 5) Influences of these factors varied greatly in each phase. On the whole, economy growth is the main contributor of increases in carbon emissions. Reductions/increases in energy consumption intensity are also the major factor responsible for increases/reductions in carbon emissions. The influence of the energy consumption structure was essentially slight because of its less change and that the impulse of population growth has gradually faded since the family planning policy was launched. The energy consumption structure is influenced by the structure of industries and energy intensity of different industries. The energy intensity of the secondary industry and the proportion of added value of the secondary industry are the major influential factors of energy consumption intensity.

63
Zhang Weiyang, Duan Xuejun, 2012. The research progress in the relationship among economic growth, industrial structure, and carbon emissions.Progress in Geography, 31(4): 442-450. (in Chinese)Against the background of global climate change, studies on the carbon emissions, economic growth and industrial structure interrelate and interact with each other as a whole. Scholars in the global climate change area have been paying more and more attention to the interaction and mechanism effects of the complex system. On the basis of reviews of studies at home and abroad, this paper clarifies the interactive and mutual restraint relationship between carbon emissions and the two factors mentions above. The article also reviews and summaries relevant research methods on this topic. According to the comprehensive reviewing, the main contents are as follows: economic analysis of the carbon emissions, the relationship study between industrial development and carbon emissions, the economic losses on the carbon emission reduction, and the research on the low-carbon economy, low-carbon development, urbanization and carbon emissions, and international carbon flow. The main research methods include: econometrics, mathematical statistics, scenario analysis, model simulation, input-output analysis, carbon footprint, and so on. The quantitative and qualitative investigations complement each other. As regards to the research progress, the contents shift from basic analysis to practical application; the theories shift from sustainable development and circulation economy to low carbon economy; research methods tends to be integrated; research perspective starts to involve the community, the family and the individual behavior at the micro-scale. In the future, the writers think that the research theoretical system on carbon emissions and economic- industrial system, methodological innovation and regional studies should be enhanced. Simultaneously, the research should explore our research models and frameworks that are suitable for China. Further work is expected to be the research scale to fill research gaps and offset weaknesses.

DOI

64
Zhang X P, Cheng X M, 2009. Energy consumption, carbon emissions, and economic growth in China.Ecological Economics, 68(10): 2706-2712.This paper investigates the existence and direction of Granger causality between economic growth, energy consumption, and carbon emissions in China, applying a multivariate model of economic growth, energy use, carbon emissions, capital and urban population. Empirical results for China over the period 1960-2007 suggest a unidirectional Granger causality running from GDP to energy consumption, and a unidirectional Granger causality running from energy consumption to carbon emissions in the long run. Evidence shows that neither carbon emissions nor energy consumption leads economic growth. Therefore, the government of China can purse conservative energy policy and carbon emissions reduction policy in the long run without impeding economic growth.

DOI

65
Zhang Xu, Qi Tianyu, Zhang Daet al., 2015. Research focus and trend of energy development and climate change.Renewable Energy Resources, (8): 1214-1218. (in Chinese)

66
Zhang Y J, Da Y B, 2015. The decomposition of energy-related carbon emission and its decoupling with economic growth in China.Renewable & Sustainable Energy Reviews, 41: 1255-1266.In order to find the efficient ways to reduce carbon emission intensity in China, we utilize the LMDI method to decompose the changes of China壮s carbon emissions and carbon emission intensity from 1996 to 2010, from the perspectives of energy sources and industrial structure respectively. Then we introduce the decoupling index to analyze the decoupling relationship between carbon emissions and economic growth in China. The results indicate that, on the one hand, economic growth appeared as the main driver of carbon emissions increase in the past decades, while the decrease of energy intensity and the cleaning of final energy consumption structure played significant roles in curbing carbon emissions; meanwhile, the secondary industry proved the principal source of carbon emissions reduction among the three industries and had relatively higher potential. On the other hand, when the decoupling relationship is considered, most years during the study period saw the relative decoupling effect between carbon emissions and economic growth, which indicated that the reduction effect of inhibiting factors of carbon emissions was less than the driving effect of economic growth, and the economy grew with increased carbon emissions; there appeared the absolute decoupling effect in 1997, 2000 and 2001, which implied that the economy grew while carbon emissions decreased; whereas no decoupling effect was identified in 2003 and 2004.

DOI

67
Zhang Z X, 2013. An analysis of China’s energy demand and supply policy framework. Wiley Interdisciplinary Reviews:Energy and Environment, 2(4): 422-440.

68
Zhao Aiwen, Li Dong, 2011. Co-integration and causal relationship between carbon emission and economic growth in China.Resources and Environment in the Yangtze Basin, 20(11): 1297-1303.<p>The relationship between carbon emissions and economic growth is becoming a hot issue in China. Studing the relationship between carbon emissions and economic growth can help to achieve the carbon reduction targets in 2020.Based on the data of carbon emissions in China and economic growth from 1953 to 2008,this paper used cointegration,error correction model and Granger causality to study the relationship between carbon emissions and economic growth.The results show that it exists longrun equilibrium relationship (cointegration relationship) between carbon emissions and economic growth in the longrun,economic growth increased by 1%,carbon emissions will increase by 036%,that is to say the longterm flexibility from carbon emissions to economic growth is 036.At the same time,it exists dynamic adjustment mechanism in the shortrun.The nonequilibrium error terms ensure the existence of longrun equilibrium relationship between carbon emissions and economic growth.Error correction coefficient is negative(-0669 4) and the direction of adjustment meets the error correction mechanism. The fitting result of this model is also ideal.Granger causality results show that it exists mutual causal relationship between carbon emissions and economic growth on the whole.To reduce energy consumption and carbon emissions, and decouple between carbon emissions and economic growth, the stratege of developing lowcarbon economy, improving energy efficiency, developing nonfossil energy was put forward.&nbsp;</p>

69
Zhao Jinwen, Fan Jitao, 2007. Empirical research on the inherent relationship between economy growth and energy consumption in China.Economic Research Journal, 8: 31-42. (in Chinese)In the world economic development, the energy issue has been risen for the strategic hot topic of countries. The research to the relationship between the economical growth and the energy consumption in academic circles continuously took the linear supposition as the premise, by no means to this supposition whether strictly carried on the econometric test reasonably up to now. This article takes the lead to study the intrinsic structure relations between the economical growth and the energy consumption which are profound and complex in China,employed the non-linear STR models which have been developed in recent years. We obtained the following main conclusions: (1) The influence of Chinese economic growth on the energy consumption has the typical non-linear characteristic, and, may express through the LSTR2 model. (2) The influence of Chinese economic growth on the energy consumption has the asymmetry. When the GDP growth appears drops absolutely, the energy consumption compared to GDP has the quicker rate of descent; When the GDP rate of increment does not surpass 18.04%, the influence will have the relative stability, and the elasticity of the energy consumption to the economic growth is 0.9592; When the GDP rate of increment surpasses 18.04%, the energy consumption compared to GDP will have the quicker rate of rise, thus, the economic growth will completely take the high energy consumption as the cost. Therefore, we should avoid the economic negative growth and the super-velocity growth as far as possible. (3) The influence of Chinese economic growth on the energy consumption has the obvious gradual characteristic. During 1956-1976 year, it presented the obvious non-linear characteristic; but during 1977-2005 year, it presented the obvious linear characteristic.

DOI

70
Zhao X T, Burnett J W, Fletcher J J, 2014. Spatial analysis of China province-level CO2 emission intensity.Renewable & Sustainable Energy Reviews, 33: 1-10.This study offers a unique contribution to the literature by investigating the influential factors of energy-related carbon dioxide emission intensity among a panel of 30 provinces in China covering the period 1991-2010. We use novel spatial panel data models to analyze the drivers of energy-related emission intensity, which we posit are characterized by spatial dependence. Our results suggest: (1) emission intensities are negatively affected by per-capita, provincial-level GDP and population density; (2) emission intensities are positively affected by energy consumption structure and transportation structure; and (3) energy price has no effect on the emission intensities.

DOI

71
Zhu Ling, Zhang Zhen, 2011. Decomposition analysis of carbon emission intensity in Shanghai city.Research of Environmental Sciences, 24(1): 20-26. (in Chinese)This paper presents carbon emission intensity analysis in Shanghai from 1995 to 2008 based on a complete decomposition approach the logarithmic mean divisia index(LMDI) method.The results show that the decrease of energy intensity in industry accounted for 67.6% of the total carbon emission intensity reduction.Further analysis shows that the decrease of energy intensity in Shanghai mostly resulted from secondary industry.However,in recent years,as energy efficiency improvement in the industrial sector has gradually approached its maximum potential and subsequently slowed,the contribution of this factor has become less prominent.The factors of energy restructuring and industry restructuring accounted for 18.2% and 14.2% respectively of the total carbon emission intensity reduction.Because there is still large potential for energy and industry restructuring,these two factors may make further contributions to the future reduction of carbon emission intensity.

Outlines

/