
Journal of Geographical Sciences >
Recent advances on reconstruction of climate and extreme events in China for the past 2000 years
Author: Ge Quansheng (1963-), Professor, specialized in climate change for the past 2000 years. E-mail: geqs@igsnrr. ac.cn
*Corresponding author: Zheng Jingyun, Professor, E-mail: zhengjy@igsnrr.ac.cn
Received date: 2016-02-22
Accepted date: 2016-03-15
Online published: 2016-07-25
Supported by
Basic Research Project of the Ministry of Science and Technology, No.2011FY120300
The “Strategic Priority Research Program” of the Chinese Academy of Sciences, No.XDA05080100
Research Project from NSFC, No.41430528
Copyright
China is distinguished by a prominent monsoonal climate in the east of the country, a continental arid climate in the northwest and a highland cold climate on the Qinghai-Tibet Plateau. Because of the long history of Chinese civilization, there are abundant and well-dated documentary records for climate variation over the whole of the country as well as many natural archives (e.g., tree-rings, ice cores, stalagmites, varved lake sediments and corals) that enable high-resolution paleoclimatic reconstruction. In this paper, we review recent advances in the reconstruction of climate and extreme events over the last 2000 years in China. In the last 10 years, many new reconstructions, based on multi-proxies with wide spatial coverage, have been published in China. These reconstructions enable us to understand the characteristics of climate change across the country as well as the uncertainties of regional reconstructions. Synthesized reconstructed temperature results show that warm intervals over the last 2000 years occurred in AD 1-200, AD 551-760, AD 951-1320, and after AD 1921, and also show that cold intervals were in AD 201-350, AD 441-530, AD 781-950, and AD 1321-1920. Extreme cold winters, seen between 1500 and 1900, were more frequent than those after 1950. The intensity of regional heat waves, in the context of recent global warming, may not in fact exceed natural climate variability seen over the last 2000 years. In the eastern monsoonal region of China, decadal, multi-decadal and centennial oscillations are seen in rainfall variability. While the ensemble mean for drought/flood spatial patterns across all cold periods shows a meridional distribution, there is a tri-pole pattern with respect to droughts south of 25°N, floods between 25° and 30°N, and droughts north of 30°N for all warm periods. Data show that extreme drought events were most frequent in the periods AD 301-400, AD 751-800, AD 1051-1150, AD 1501-1550, and AD 1601-1650, while extreme flood events were frequent in the periods AD 101-150, AD 251-300, AD 951-1000, AD 1701-1750, AD 1801-1850, and AD 1901-1950. Between AD 1551-1600, extreme droughts and flood events occurred frequently. In arid northwest China, climate was characterized by dry conditions in AD 1000-1350, wet conditions in AD 1500-1850, and has tended to be wet over recent decades. On the northeastern Qinghai-Tibet Plateau, centennial-scale oscillations in precipitation have occurred over the last 1000 years, interrupted by several multi- decadal-scale severe drought events. Of these, the most severe were in the 1480s and 1710s. In southwest China, extreme droughts as severe as those seen in Sichuan and Chongqing in 2006 are known to have occurred during historical times.
GE Quansheng , *ZHENG Jingyun , HAO Zhixin , LIU Yang , LI Mingqi . Recent advances on reconstruction of climate and extreme events in China for the past 2000 years[J]. Journal of Geographical Sciences, 2016 , 26(7) : 827 -854 . DOI: 10.1007/s11442-016-1301-4
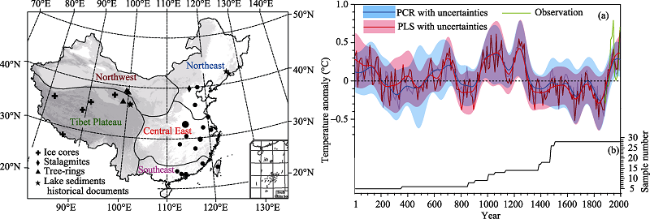
Figure 1 Locations and types of 28 temperature proxies (left panel), and temperature reconstructions for China (a in right panel; Ge et al., 2013) based on 28 temperature proxies with PLS (red lines) and PCR (blue lines) methods respectively at decadal (thin lines) and centennial timescales (solid lines; smoothed by a 5-point FFT filter), along with the 95% confidence level (shading). The reference value is the mean temperature from 1851 to 1950. The green line indicates the observed average air temperature. (b) Numbers of temperature proxies used. |
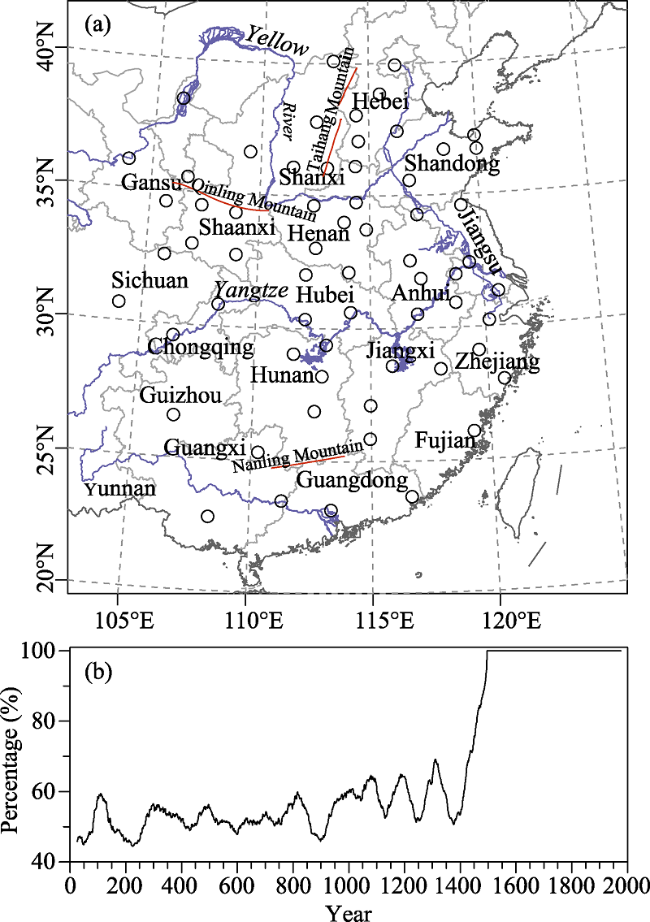
Figure 2 Locations of 63 sites in the dataset of yearly drought/flood grade derived from Chinese historical documents starting from 137 BC (a) and percentage of available data for each drought/flood grade, excluding grade 3 (b) |
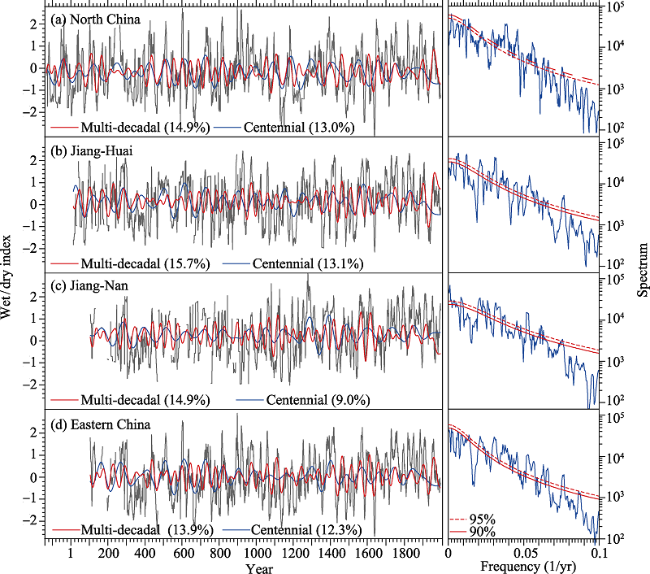
Figure 3 Regional dry/wet index series for the North China Plain (a), Jiang-Huai area (b), Jiang-Nan area (c), and central eastern China (d) for the past 2000 years derived from yearly drought/flood grade dataset after detrending the effect of data missing on the homogeneity (Ge et al., 2014). The blue and red lines show the variations of regional dry/wet index at multi-decadal (40-75 years) and centennial (80-150 years) scale respectively, with the value of explained variance in brackets. Right panel: Results of spectral estimation for the regional dry/wet index series using the Multi-Taper Method. |
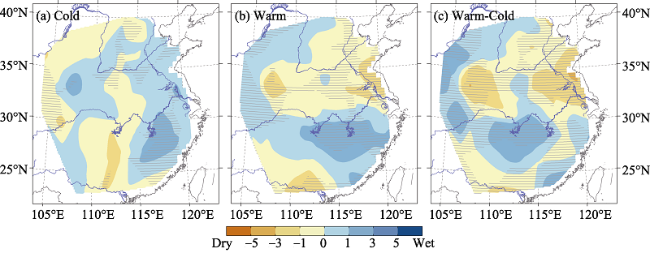
Figure 4 Spatial patterns of droughts and floods in eastern China in cold and warm periods over a centennial scale (Hao et al., 2016). (a) Ensemble mean for all five cold periods (AD 440-540, 780-920, 1390-1460, 1600-1700, 1800-1900). (b) Ensemble mean for all four warm periods (AD 650-750, 1000-1100, 1190-1290, 1900-2000). (c) Difference between warm and cold periods (warm minus cold). The shaded area is the 90% significance level based on a chi-square test. |
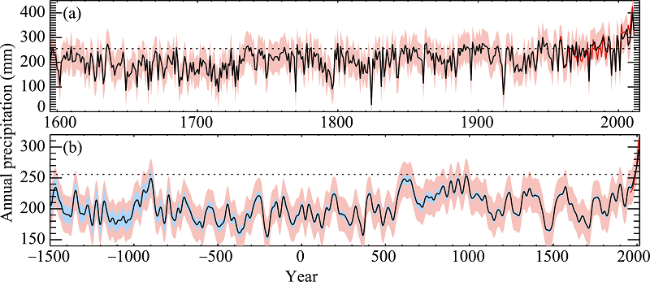
Figure 5 Tree ring based reconstruction for annual precipitation on the northeastern Tibetan Plateau (Yang et al., 2014a). (a) Annual precipitation from 1595 to 2011, together with total uncertainty (pale red), the part of this uncertainty that arises from chronology (pale blue), and the observed regional precipitation since 1957 (red). The horizontal dotted line indicates the mean precipitation over the calibration period (1957-2011). Note that the calibration residuals show that the estimated values somewhat exaggerate dryness in some dry years (e.g., 1978 and 1998), and this should be borne in mind when interpreting extremely dry years in the reconstruction. (b) As in (a), except that data are shown for the period since BC 1500 with 50a smoothing (smoothed values will be more uncertain near the end of the time series). |
Table 1 Historical extreme snowfall events (ESEs) comparable to 2008, including duration (period over which a high incidence of heavy snowfall occurred), days of snowfall, snow cover or icing, and snow depth (ranges given because of geographical variability between sites, “?” means no data available) (Hao et al., 2011). |
| Winter | Duration of heavy snowfall event (dd/mm) | Days in disaster area | Snow depth (cm) | Spatial pattern* | ||
|---|---|---|---|---|---|---|
| snowfall | snow cover/icing | mean | Max. record | |||
| 1578-79 | 29/11-01/02 | >20 | >30 | >30 | >100 | III |
| 1620-21 | 15/12-20/02 | 15-30 | >30 | 30-50 | >60 | III |
| 1654-55 | 21/12-05/02 | 15-40 | 20-40 | 40-50 | >60 | Ib |
| 1660-61 | 04/12-29/01 | ? | >30 | ? | ? | Ic |
| 1665-66 | 01/01-02/02 | ? | >30 | ? | ? | Ic |
| 1670-71 | 15/12-05/02 | >15 | >30 | 30-50 | >100 | Ia |
| 1676-77 | 10/12-01/02 | ? | >30 | >50 | >100 | Ic |
| 1683-84 | 28/12-12/02 | ? | >30 | 30-50 | >60 | Ia |
| 1689-90 | 28/12/-15/01 | ? | >30 | ? | >60 | Ic |
| 1690-91 | 21/12-15/02 | >15 | >30 | 30-60 | >100 | Ia |
| 1694-95 | 17/12-10/03 | ? | >30 | ? | ? | II |
| 1700-01 | 10/12-10/02 | ? | >20 | ? | >100 | Ia |
| 1714-15 | 06/01-03/02 | >15 | >30 | >30 | >50 | Ib |
| 1719-20 | 01/02-08/03 | ? | >20 | >30 | >60 | Ib |
| 1796-97 | 29/12-30/01 | 15-25 | 20-30 | 30-40 | >50 | III |
| 1830-31 | 10/01-23/02 | 15-25 | 15-40 | 30-40 | >50 | Ic |
| 1831-32 | 14/12-07/02 | 15-30 | 25-50 | 30-50 | >100 | Ia |
| 1832-33 | 19/01-20/02 | 15-20 | 20-35 | 30-50 | >90 | Ia |
| 1840-41 | 18/12-01/02 | 15-20 | 25-40 | 30-50 | >100 | Ic |
| 1841-42 | 09/12-10/01 | 15-30 | 25-50 | ≈50 | >100 | III |
| 1877-78 | 30/12-09/02 | ≈15 | 20-50 | >30 | >45 | Ia |
| 1887-88 | 13/01-13/02 | ≈15 | 20-35 | 30-40 | >90 | II |
| 1892-93 | 04-06/01,13-30/01, 25/01-02/02 | ≈15 | >25 | 30-50 | >90 | Ia |
| 1929-30 | 16/12-25/02 | >15 | >25 | 30-40 | >60 | II |
| 1930-31 | 20/12-20/02 | >15 | >25 | 30-40 | >60 | II |
| 2007-08 | 10-16/01,18-22/01, 25-29/01, 31/01-02/02 | 12-17 | 15-25 | 30-35 | 50 | III |
*Spatial patterns: pattern I, a snow front moving from the north to the south of China, including pattern Ia, continuous snowfall over most of eastern China; pattern Ib, an ESE approximately on the east coast of China; pattern Ic, heavy snow over scattered regions of eastern China, with cold dry conditions for the whole of this region; pattern II, continuous snowfall over southern China (from the Huaihe River to the southern border); pattern III, persistent snowfall in the region between the Yellow River and Nanling Mountain. |
Table 2 Temperature observations for each day in Beijing at 15:30 pm between the 20th and 26th of July 1743 by Father Gaubil using a Réaumur-scale thermometer (°R), their equivalents in Celsius (°C), and comparisons with the highest records from the 20th century (Zhang and Gaston, 2004). |
| Date | 1743-07-20 | 1743-07-21 | 1743-07-22 | 1743-07-23 | 1743-07-24 | 1743-07-25 | ||||
|---|---|---|---|---|---|---|---|---|---|---|
| Temperature (°R) | 33.25 | 33.25 | 34.00 | 34.00 | 34.25 | 35.25 | ||||
| Temperature (°C) | 41.6 | 41.6 | 42.5 | 42.5 | 43.1 | 44.4 | ||||
| Statistical features of the 1743 heat wave vs. highest recorded temperatures in the 20th century | ||||||||||
| Month heat wave occurred | July 1743 | June 1942 | July 1942 | July 1999 | ||||||
| Maximum temperature (°C) | >44.4* | 42.6 | 40.0 | 42.2 | ||||||
| Days of >40°C | 6 | 3 | 3 | 1 | ||||||
| Successive days of >38°C | 6 | 3 | 3 | 2 | ||||||
* Only the 15:30 pm observation is used. |
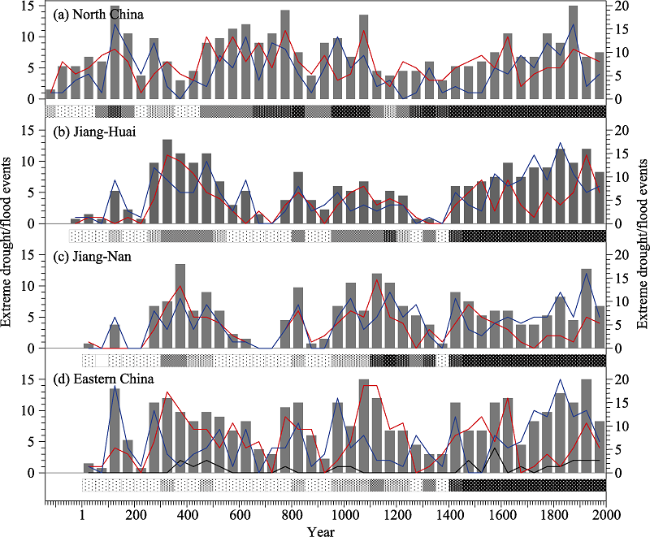
Figure 6 Changes in the frequency of extreme drought and flood events for each 50-year period in eastern China over the last 2000 years (Hao et al., 2010a). Red line: extreme drought; blue line: extreme flood; black line: coexisting drought and flood; grey bar: total of extreme drought and flood events. The cross bars below each plate indicate confidence levels of results for every 50 years, which marked with different levels of A (full confidence), B (very high confidence), C (high confidence), D (medium confidence), and E (low confidence), and the periods with scarce data were marked with blank. |
Supplement Table 1 Recent studies on temperature reconstruction more than 300 years derived from tree-ring |
 |
Supplement Table 2 Recent studies on precipitation reconstructions more than 300 years by tree-ring |
 |
The authors have declared that no competing interests exist.
| 1 |
|
| 2 |
|
| 3 |
|
| 4 |
CAMS (Chinese Academy of Meteorological Sciences), 1981. China Meteorological Administration. Yearly Charts of Dryness/Wetness in China for the Last 500-year Period. Beijing: SinoMaps Press. (in Chinese)
|
| 5 |
|
| 6 |
|
| 7 |
|
| 8 |
|
| 9 |
|
| 10 |
|
| 11 |
|
| 12 |
|
| 13 |
|
| 14 |
|
| 15 |
EC-SCNARCC, 2011. The Second National Assessment Report on Climate Change. Beijing: Science Press. (in Chinese)
|
| 16 |
|
| 17 |
|
| 18 |
|
| 19 |
|
| 20 |
|
| 21 |
|
| 22 |
|
| 23 |
|
| 24 |
|
| 25 |
|
| 26 |
|
| 27 |
|
| 28 |
|
| 29 |
|
| 30 |
|
| 31 |
|
| 32 |
|
| 33 |
|
| 34 |
|
| 35 |
|
| 36 |
|
| 37 |
|
| 38 |
|
| 39 |
|
| 40 |
|
| 41 |
|
| 42 |
IPCC, 2001. Climate Change 2001: The Scientific Basis. Contribution of Working Group I to the Third Assessment Report of the Intergovernmental Panel on Climate Change. Cambridge, UK and New York, USA: Cambridge University Press.
|
| 43 |
IPCC, 2007. Climate Change 2007: The Physical Science Basis. Contribution of Working Group I to the Fourth Assessment Report of the Intergovernmental Panel on Climate Change. Cambridge, UK and New York, USA: Cambridge University Press.
|
| 44 |
|
| 45 |
|
| 46 |
|
| 47 |
|
| 48 |
|
| 49 |
|
| 50 |
|
| 51 |
|
| 52 |
|
| 53 |
|
| 54 |
|
| 55 |
|
| 56 |
|
| 57 |
|
| 58 |
|
| 59 |
|
| 60 |
|
| 61 |
|
| 62 |
|
| 63 |
|
| 64 |
|
| 65 |
PAGES, 2009. Science Plan and Implementation Strategy. IGBP Report No.57. Stockholm: IGBP Secretariat.
|
| 66 |
|
| 67 |
|
| 68 |
|
| 69 |
|
| 70 |
|
| 71 |
|
| 72 |
|
| 73 |
|
| 74 |
|
| 75 |
|
| 76 |
|
| 77 |
|
| 78 |
|
| 79 |
|
| 80 |
|
| 81 |
|
| 82 |
|
| 83 |
|
| 84 |
|
| 85 |
|
| 86 |
|
| 87 |
|
| 88 |
|
| 89 |
|
| 90 |
|
| 91 |
|
| 92 |
|
| 93 |
|
| 94 |
|
| 95 |
|
| 96 |
|
| 97 |
|
| 98 |
|
| 99 |
|
| 100 |
|
| 101 |
|
| 102 |
|
| 103 |
|
| 104 |
|
| 105 |
|
| 106 |
|
| 107 |
|
| 108 |
|
| 109 |
|
| 110 |
|
| 111 |
|
| 112 |
|
| 113 |
|
| 114 |
|
| 115 |
|
| 116 |
|
| 117 |
|
| 118 |
|
| 119 |
|
| 120 |
|
| 121 |
|
| 122 |
|
| 123 |
|
| 124 |
|
| 125 |
|
| 126 |
|
| 127 |
|
| 128 |
|
| 129 |
|
| 130 |
|
| 131 |
|
| 132 |
|
| 133 |
|
| 134 |
|
| 135 |
|
| 136 |
|
| 137 |
|
| 138 |
|
| 139 |
|
| 140 |
|
| 141 |
|
| 142 |
|
| 143 |
|
| 144 |
|
| 145 |
|
| 146 |
|
| 147 |
|
| 148 |
|
| 149 |
|
| 150 |
|
| 151 |
|
| 152 |
|
| 153 |
|
| 154 |
|
| 155 |
|
| 156 |
|
| 157 |
|
| 158 |
|
| 159 |
|
| 160 |
|
| 161 |
|
| 162 |
|
| 163 |
|
| 164 |
|
| 165 |
|
| 166 |
|
| 167 |
|
| 168 |
|
| 169 |
|
| 170 |
|
| 171 |
|
| 172 |
|
| 173 |
|
| 174 |
|
| 175 |
|
| 176 |
|
| 177 |
|
| 178 |
|
| 179 |
|
/
| 〈 |
|
〉 |