Orginal Article

Construction and progress of Chinese terrestrial ecosystem carbon, nitrogen and water fluxes coordinated observation

  • YU Guirui , 1 ,
  • REN Wei 1, 2 ,
  • CHEN Zhi 1 ,
  • ZHANG Leiming 1 ,
  • WANG Qiufeng 1 ,
  • WEN Xuefa 1 ,
  • HE Nianpeng 1 ,
  • ZHANG Li 1 ,
  • FANG Huajun 1 ,
  • ZHU Xianjin 1 ,
  • GAO Yang 1 ,
  • SUN Xiaomin 1
Expand
  • 1. Key Laboratory of Ecosystem Network Observation and Modeling, Institute of Geographic Sciences and Natural Resources Research, CAS, Beijing 100101, China
  • 2. University of Chinese Academy of Sciences, Beijing 100049, China

Author: Yu Guirui, Professor, specialized in ecosystem ecology and global change science research. E-mail:

Received date: 2016-01-04

  Accepted date: 2016-03-15

  Online published: 2016-07-25

Supported by

Science and Technology Service Network Initiative of CAS, No.KFJ-SW-STS-169

National Natural Science Foundation of China, No.31420103917

Copyright

Journal of Geographical Sciences, All Rights Reserved

Abstract

Eddy Covariance technique (EC) achieves the direct measurement on ecosystem carbon, nitrogen and water fluxes, and it provides scientific data for accurately assessing ecosystem functions in mitigating global climate change. This paper briefly reviewed the construction and development of Chinese terrestrial ecosystem flux observation and research network (ChinaFLUX), and systematically introduced the design principle and technology of the terrestrial ecosystem carbon, nitrogen and water fluxes coordinated observation system of ChinaFLUX. In addition, this paper summarized the main progress of ChinaFLUX in the ecosystem carbon, nitrogen and water exchange and environmental controlling mechanisms, the spatial pattern of carbon, nitrogen and water fluxes and biogeographical mechanisms, and the regional terrestrial ecosystem carbon budget assessment. Finally, the prospects and emphases of the terrestrial ecosystem carbon, nitrogen and water fluxes coordinated observation of ChinaFLUX are put forward to provide theoretical references for the development of flux observation and research in China.

Cite this article

YU Guirui , REN Wei , CHEN Zhi , ZHANG Leiming , WANG Qiufeng , WEN Xuefa , HE Nianpeng , ZHANG Li , FANG Huajun , ZHU Xianjin , GAO Yang , SUN Xiaomin . Construction and progress of Chinese terrestrial ecosystem carbon, nitrogen and water fluxes coordinated observation[J]. Journal of Geographical Sciences, 2016 , 26(7) : 803 -826 . DOI: 10.1007/s11442-016-1300-5

1 Introduction

Accurately assessing the global, regional and national terrestrial ecosystem carbon budget and carbon exchange is an important theme in the global climate change researches. The assessment underlies the scientific basis to support the international joint actions to mitigate and adapt to climate change in the “United Nations Framework Convention on Climate Change (UNFCCC)” (Le Quéré et al., 2013). In recent decades, China's economy experiences rapid development. The amount and growth rate of greenhouse gas emissions of China already leaped to the first in the world (Liu et al., 2015). Therefore, China faces enormous challenges in reducing the greenhouse gas emission and effectively governing the atmospheric pollution.
Greenhouse gases in the atmosphere mainly consist of CO2, H2O, CH4, NO, NO2, N2O, NH3, HNO3 and other trace gases. The greenhouse gas exchange between the ecosystem and the atmosphere are all closely related to the ecosystem carbon, nitrogen and water cycles. Coordinated observation on carbon, nitrogen and water fluxes between ecosystem and the atmosphere is an important approach to evaluate the terrestrial ecosystem functions of greenhouse gas absorption and digestion (Yu et al., 2014a). Also, terrestrial ecosystem carbon, nitrogen and water cycle processes and their coupling relations are the core processes in the global-scale biogeochemical cycles to determine the ecosystem services. Therefore, studies on terrestrial ecosystem carbon, nitrogen and water cycle processes and their coupling relations are the scientific foundation for understanding the interactions between ecosystem and global climate change, and are the frontiers in current geographical and ecological researches (Yu et al., 2013a, 2014b).
The development and application of flux observation technology, represented by the greenhouse gas (CO2, H2O and CH4) eddy covariance techniques, could provide us the long-term continuous, high-frequency, multiple elements synchronous, and across sites networked ecosystem carbon, nitrogen and water fluxes and environmental elements data (Baldocchi, 2008, 2014; Yu et al., 2013a, 2014b). In the past two decades, the ecosystem CO2 and H2O flux observation have been carried out worldwide, and accumulated large amount of scientific data (Luysseart et al., 2007; Reichstein et al., 2014; Baldocchi et al., 2008, 2014; Yu et al., 2013b). Recently, continuous observation of CH4, NO, NO2, N2O, NH3, HNO3 and other carbon, nitrogen and water trace gas fluxes is gradually applied in the field (Baldocchi, 2014). These data lay the solid foundation for assessing the carbon, nitrogen and water and trace gas budget, exploring the controlling mechanism for carbon, nitrogen and water fluxes and their coupling relations, and predicting the responses and adaption of carbon, nitrogen and water cycle processes to global climate change (Yu et al., 2014b).
The Chinese terrestrial ecosystem flux observation and research network (ChinaFLUX) was established in 2001. Continuous measurement of CO2, H2O and energy fluxes, synchronous environmental elements, and ecosystem properties were started since 2002 (Yu et al., 2006a, b; Yu and Sun, 2006). ChinaFLUX has made great progress in the original data accumulation, mechanism of ecosystem carbon, water cycle process, the model system development, and the regional carbon, water budget quantitative evaluation (Yu et al., 2014a). It promotes the development of flux researches in China and bridges the gaps in global flux observation thus gains worldwide appreciation (Leuning and Yu, 2006; Doherty et al., 2009; Saigusa et al., 2013; Stoy et al., 2013). Recently, ChinaFLUX takes the lead to develop the terrestrial ecosystem carbon, nitrogen and water fluxes coordinated observation system, promote the observation and field control experiment network researches on ecosystem carbon, nitrogen and water coupling cycles and their responses to climate change, and expand the frontier research field in the terrestrial ecosystem and global change science (Yu et al., 2013a; Yu et al., 2014a, 2014b).
Based on the previous introduction of ChinaFLUX and its theoretic framework of terrestrial ecosystem carbon, nitrogen and water coupling cycle researches (Yu et al., 2006b, 2013a, 2014a, 2014b), this study briefly reviewed the construction and development history of ChinaFLUX, and mainly systematically summarized the main progress of ChinaFLUX in the key technology exploration and application of the carbon, nitrogen and water fluxes coordinated observation system, and progress in the studies on the ecosystem carbon, nitrogen and water exchange and environmental controlling mechanisms, the spatial pattern of carbon, nitrogen and water fluxes and biogeographical mechanisms, and regional terrestrial ecosystem carbon budget assessment. Finally, the future development strategies of ChinaFLUX coordinated observation system on terrestrial ecosystem carbon, nitrogen and water fluxes are proposed so as to provide theoretical references for the development of flux observation and research in China.

2 Construction of the ChinaFLUX coordinated observation on terrestrial ecosystem carbon, nitrogen and water fluxes

2.1 Establishment and development of ChinaFLUX

Supported by the Knowledge Innovation Program of the Chinese Academy of Sciences “Study on Carbon Budget in Terrestrial and Marginal Sea Ecosystems of China”, the Chinese Terrestrial Ecosystem Flux Observation and Research Network (ChinaFLUX) was launched in 2001. By one year’s well-design on the observation system, instrument selection and site investigation, the first 8 stations (4 forests, 3 grasslands and 1 cropland) and 1 integrated research center of ChinaFLUX were established in 2002. Since then, the long-term coordinated flux measurement is started formally in China (Yu et al., 2006a, 2006b; Yu and Sun, 2006).
ChinaFLUX was subsequently supported by a series of programs. Such projects promote the development of ChinaFLUX through the increase of flux sites, extension of spatial representativeness and improvement of observation capability. ChinaFLUX gradually become a unique scientific and technological platform for carbon cycle and global change in China (Yu et al., 2014a). ChinaFLUX also promotes its international development, with great achievement in prompting the recombination of Asian flux network (AsiaFlux). Currently, ChinaFLUX becomes not only a distinctive observation and research network in Chinese Ecosystem Research Network (CERN), but also an important component of the Asian and global flux network (FLUXNET).
The development of ChinaFLUX takes the lead in the construction of flux stations from forestry, agricultural, meteorological departments and some universities, and also provides the important basis for coordinated flux measurement and resources integration among different departments in China. In 2014, the Chinese Flux Observation and Research League (new ChinaFLUX) was formed through the combination between ChinaFLUX and other flux stations from different departments. Currently, there are 71 flux stations in ChinaFLUX, which includes 22 forests, 17 grasslands (deserts), 17 croplands, 13 wetlands, 1 urban and 1 lake sub-network. The sites cover tropical, temperate and boreal typical climate zones in China (Figure 1). The national scale ecosystem flux observation and research network has been preliminarily established.
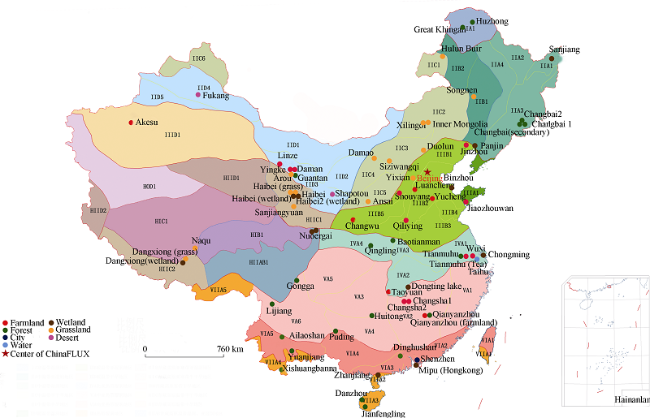
Figure 1 Site distribution of ChinaFLUX

2.2 Design of the coordinated observation on terrestrial ecosystem carbon, nitrogen and water fluxes of ChinaFLUX

The scientific targets of ChinaFLUX is designed to (1) establish the national ecosystem observation and research platform; (2) accumulate the long-term scientific data of carbon, nitrogen and water fluxes, meteorological, biotic and soil factors, and ecosystem elements; (3) organize the mechanism researches on carbon, nitrogen and water coupling cycle processes and environmental regulation across ecosystem, transect, regional and global scales; (4) provide scientific support for dealing with climate change and promoting the sustainable development of environment and society (Figure 2) (Yu et al., 2014a).
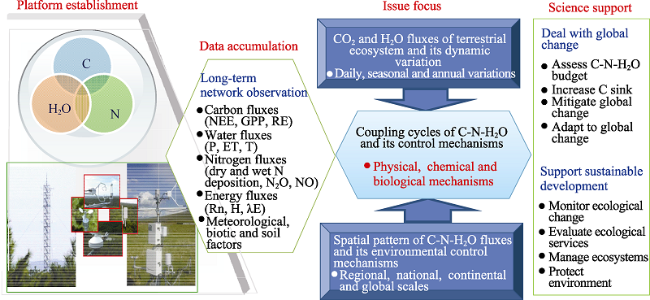
Figure 2 Scientific targets of ChinaFLUX
With over decadal development, the scientific researches of ChinaFLUX has been evolved from the traditional CO2, H2O fluxes and their dynamic (daily, seasonal, annual) and spatial (regional, national, continental, global) variations, to the coupling cycles of carbon, nitrogen, and water fluxes and controlling mechanisms (physical, chemical, biological) (Figure 2). The observation techniques of ChinaFLUX also developed from the traditional carbon and water flux eddy covariance technology, to the coordinated system of nitrogen deposition observation, carbon and water stable isotopic synchronous observation, CH4, N2O and other greenhouse gas observation and hydrological processes observations.
The observational technology development largely prompts the capability of ChinaFLUX in the typical terrestrial ecosystem carbon, nitrogen and water flux coordinated observation, national scale carbon and nitrogen flux network observation, and adaptation of ecosystem carbon, nitrogen and water cycle to global change field control experimental researches. ChinaFLUX proposed the development strategy to construct the coordinated observation on terrestrial ecosystem carbon, nitrogen and water fluxes in China.

2.3 Main scientific issues in the coordinated observation on ecosystem carbon, nitrogen and water fluxes of ChinaFLUX

Research on the ecosystem carbon, nitrogen and water cycles and their coupling relationships is the scientific requirement for regulating and managing ecosystem processes to mitigate global change. The key mission of ecosystem carbon, nitrogen, and water fluxes researches of ChinaFLUX is to cognize the ecosystem carbon, nitrogen and water cycle processes and its environmental controlling mechanism, multi-scale temporal variation of carbon, nitrogen, water fluxes and its dynamic mechanism, and ecosystem carbon, nitrogen, water coupling cycles response to global change and its adaptive mechanisms. Specifically, ChinaFLUX mainly focuses on four scientific issues (Figure 3): (1) the key processes and its biological controls of the ecosystem carbon, nitrogen and water coupling cycles; (2) the stoichiometric equilibrium and its environmental responses of ecosystem carbon, nitrogen and water fluxes; (3) the regulation mechanism of the ecosystem carbon, nitrogen and water coupling cycles on the spatio-temporal pattern of terrestrial ecosystem carbon sink/source; (4) the response and adaptation of the biological processes of ecosystem carbon, nitrogen and water coupling cycles to global change (Yu et al., 2014b).
Figure 3 Scientific issues of the coordinated observation on ecosystem carbon, nitrogen and water fluxes of ChinaFLUX

C: Carbon; N: Nitrogen; GPP: Gross primary production; Ra: Autotrophic respiration; Rh: Heterotrophic respiration; ET: Ecosystem evaportranspiration; Tr: Transpiration; E: Evaporation; LUCC: Land use cover change

3 Construction and key technology of the coordinated observation on ecosystem carbon, nitrogen and water fluxes of ChinaFLUX

3.1 Design of carbon, nitrogen and water multi-elements coordinated observation system in typical ecosystems

The systematic design of ChinaFLUX persists in combining long-term continuous instrumental observations and control experiments as guideline. It emphasizes the synthetic observation of multiple greenhouse gas fluxes, environmental elements and ecological proc- esses, as well as the coordinated observation of carbon-nitrogen-water fluxes and cycle processes. ChinaFLUX focuses on the development of the continuous and in situ carbon and water stable isotope fluxes observational techniques, soil CO2, CH4 and N2O fluxes coordinated observational technique, and the atmospheric deposition flux observation and N tracer technique. By systematically integration of ecological, meteorological and isotopic techniques, ChinaFLUX prospectively built the carbon, nitrogen and water multi-elements coordinated observation system in typical ecosystems (Figure 4) (Yu et al., 2014a).
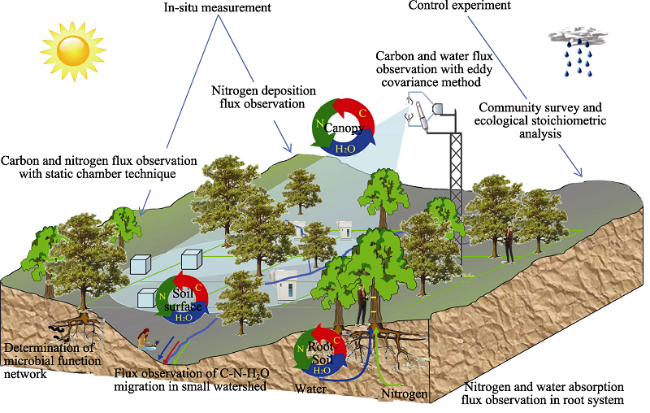
Figure 4 The carbon, nitrogen and water multi-elements coordinated observation system in typical ecosystems
The development of in situ ecosystem carbon and water stable isotope fluxes measurement technique overcame the problem of nonlinear response of instruments (Wen et al., 2008, 2012). It allowed in situ and continuous measurement of δ18O and δD of atmospheric water vapor (Wen et al., 2010; Zhang et al., 2011; Huang et al., 2014), and isotopic ratio and flux ratio of atmospheric CO2 δ13C (Pang et al., 2016). This technology broke through the bottleneck of coordinated observation of eddy covariance and stable isotopes. It achieves the coordinated observation of ecosystem carbon and water vapor flux and δ18O, δD and δ13C fluxes (Wen et al., 2012, 2015).
Based on the theory of close path non-steady state measurement, the “automatic multi-channels soil CO2, CH4 and N2O flux coordinated observation device” was developed. This device adopted parallel connection to optimize the pressure fluctuation and reduce the system leakage based on a composite technology of near infrared and mid-infrared laser. Meanwhile, the pressure balance and gas mixing efficiency were improved. It could measure CO2, CH4 and N2O fluxes simultaneously, and collect data in the field automatically. The device increased the spatio-temporal representativeness of observational data and is useful for the synthesis of synchronous CO2, CH4 and N2O fluxes.
Atmospheric nitrogen deposition observation and nitrogen stable isotope tracing technology are useful technologies for ecosystem nitrogen cycle researches. In the coordinated observation system of ChinaFLUX, the technical specifications for atmospheric wet nitrogen deposition observation were compiled (Sheng et al., 2010; Zhan et al., 2014; Zhu et al., 2015). These specifications provided a series of uniform operate procedures, including monitoring equipment setup, samples collection and data analysis. Now, these specifications have been used by many scientists in specific sites or regions (Sheng et al., 2010; Zhan et al., 2014; Zhu et al., 2015). It improves the normalization of atmospheric wet nitrogen deposition in China to a large extent (Jia et al., 2014; Zhu et al., 2015). The application of stable nitrogen isotopic tracer technology including the natural abundance of 15N and addition of 15N maker in the nitrogen cycle researches were also discussed (Sheng et al., 2012, 2014; Xu et al., 2014; Zhan et al., 2014, 2015; Zhu et al., 2015). Additionally, to improve the method of static chambers and gas chromatography for soil N2O emission measurement, scientists of ChinaFLUX conducted systematic comparative experiments in aspects of static chambers construction, sampling plots setup, sampling frequency, and instruments (Zheng et al., 2008). Nowadays, the findings have formed a series of operational procedure and been widely used by many scientists (Zheng et al., 2008; Fang et al., 2014a, 2014b; Wang et al., 2015).

3.2 Design of multi-scale carbon, nitrogen and water coordinated observation system

ChinaFLUX consistently emphasizes optimizing the spatial distribution of experiment sites. It follows the scientific principles of the geographic heterogeneity of ecosystem patterns, the diversity of ecosystem types at regional scale, and the representativeness in critical zones. By adopting the integrated and optimized approaches of the site-transect-region remote sensing observation, ChinaFLUX systematically designs the multi-scale carbon, nitrogen, water fluxes coordinated observation system. Along the transect, ChinaFLUX integrate science and technology resources of flux measurements, control experiments and transect researches to promote the build up and development of flux observation and experimental research network platform which underlies the foundation of super flux observational sites.

3.3 The development of ecosystem carbon, nitrogen and water models and model- data fusion system

Process-based ecosystem models and remote sensing models are important tools to estimate and predict dynamics variations and spatial patterns of ecosystem carbon, nitrogen, and water fluxes. ChinaFLUX community modified several process-based models and remote sensing models, such as CEVSA (Cao et al., 2005; Gu et al., 2010), In-TEC (Wang et al., 2007), EALCO (Mi et al., 2007; Mi et al., 2009), and BEPS (Wang et al., 2005; Ju et al., 2010), and VPM (Li et al., 2007; Wu et al., 2008). Meanwhile, many new models have been developed including AVIM2 (Ji et al., 2008; Huang et al., 2014), CEVSA2 (Gu et al., 2010; Gu et al., 2015), the evapo-transpiration model (Hu et al., 2013; Ren et al., 2005), a MODIS-based Photosynthetic Capacity Model (Gao et al., 2014), a remote sensing model for respiration ReRSM (Gao et al., 2015), and the statistical model GSM (Zheng et al., 2009; Yu et al., 2010; Zhu et al., 2014a).
In addition, a Model-Data Fusion System (MDFS) has been developed based on a series of algorithms including the Markov-Chain Monte Carlo method, the Monte Carlo Simulated Annealing method, and the sobol’ method (Zhang et al., 2009, 2010; Ren et al., 2012) to quantify and minimize the model uncertainty. This system has been used for the uncertainty estimation for eddy flux measurements (He et al., 2010; Liu et al., 2009), model parameter estimation and carbon fluxes simulation and uncertainty estimation at site (Zhang et al., 2010; Liu et al., 2012, 2015) and regional scales (He et al., 2014), which provides an effective solution for scaling from site to regional levels and a platform for assessing the carbon and water balances on the national scale.

4 Spatio-temporal patterns of terrestrial ecosystem carbon, nitrogen and water fluxes and environmental control mechanisms

By more than 10-year’s network observation, ChinaFLUX accumulates the valuable and unique data of ecosystem carbon, nitrogen and water fluxes in China. ChinaFLUX conducted a series of studies and gained great progress in the aspects of ecosystem carbon, nitrogen and water exchange dynamics and environmental controlling mechanisms, the spatial pattern of carbon, nitrogen and water fluxes and biogeographical mechanisms, and the regional terrestrial ecosystem carbon budget assessment.

4.1 Evaluation of ecosystem carbon sink/source based on flux measurement

The carbon sink/source of ecosystem in typical climate zones were investigated (Table 1). Forests were found to have a strong carbon sequestration capacity. The highest carbon sink appeared in central subtropical forests (550±258 g C m-2 yr-1), and followed by warm temperate forests (492±37 g C m-2 yr-1) and northern subtropical forests (343 g C m-2 yr-1).
Table 1 Statistics of carbon fluxes of ecosystems in typical climate zones of China (Mean ± Standard deviation)
Ecosystem types Climate zones NEP
(g C m-2
yr-1)
GPP
(g C m-2
yr-1)
RE
(g C m-2
yr-1)
Flux sites References
Forest Tropical 202±47 2156±263 1954±310 XSBN, JFL Zhang et al.,2010; Chen et al., 2010
Southern subtropical 250±206 1424±81 1174±287 DHS, DG Sun et al., 2012; Yu et al., 2013b; Chen et al., 2014
Central
subtropical
550±258 1801±167 1253±226 HT, AQ, YY, QYZ, ALS Yu et al., 2013; Chen et al., 2014; Tan et al., 2011; Zhang et al., 2010; Zhao et al., 2011; Han et al., 2008
Northern subtropical 343 1288 965 XP Geng et al., 2011
Warm temperate 492±37 1379±103 887±67 DX, XLD Huang et al., 2011; Zha et al., 2007; Fang et al., 2011
Temperate 302 1338 1036 CBS Yu et al., 2013b; Chen et al., 2014
Cool temperate 135±114 970±326 774±298 HZ, LS Wang et al., 2008; Cui et al., 2007; Qiu et al., 2011; Zhou et al., 2010
Grassland Temperate 24±83 282±108 260±95 DL, NM, CL, XLHT (1, 2, 3), KBQ, TY, LP, FK Yu et al., 2013b; Chen et al., 2014; FLUXNET, 2013; Du et al., 2012; Wang et al., 2008; Liu et al., 2011a, 2011b; Dong et al., 2011a, 2011b; Zhang et al., 2007
Alpine 45±59 470±193 424±146 DX, SJY,
HB
Yu et al., 2013b; Chen et al., 2014; Wu et al., 2010; Wang et al., 2012
Cropland Subtropical 675 1598 923 TY Zhu et al., 2005
Warm temperate 462±136 1792±64 1329±72 WS, YC Yu et al., 2013b; Chen et al., 2014; Lei et al., 2010a, 2010b
Temperate semi-arid 75 381 306 DL Zhang et al., 2007; FLUXNET, 2013
Wetland Subtropical 577±123 1553±155 977±133 DT(1,2,3) Guo et al., 2010; Yan et al., 2009; FLUXNET 2103
Warm temperate 65 1298 1233 PJ Zhou et al., 2009, 2010
Cool temperate 98±148 570±116 473±107 SJ (1,2,3) Song et al., 2007
alpine -79 489 568 HBSD Yu et al., 2013b; Chen et al., 2014
Cool temperate forests showed lower carbon sink compared to warm temperate and temperate forests. Studies of specific ecosystem suggest that mature forests in Northeast, Southeast, and Southwest (Zhang et al., 2006a; Yu et al., 2008, 2013; Liu et al., 2014a; Tan et al., 2010, 2012; Guan et al., 2006; Zhang et al., 2006b; Yan et al., 2012) and subtropical plantations (Liu et al., 2006; Wen et al., 2010) had strong carbon sequestration capacity.
The carbon sink magnitude of grasslands was obviously lower than that of forests. Temperate steppes and alpine meadows served as weak carbon sink (24±83, 45±59 g C m-2 yr-1). The grasslands in northern China probably served as a weak carbon source after disturbances, which differed substantially among ecosystems and years (Shi et al., 2006; Zhao et al., 2006; Li et al., 2006; Wang et al., 2011; Fu et al., 2006, 2009; Yu et al., 2013b).
The magnitude of carbon sink differed substantially in croplands and wetlands. Croplands in temperate semi-arid zones (75 g C m-2 yr-1) showed a much lower carbon sink than croplands in other climate zones (675, 462±136 g C m-2 yr-1). The subtropical coastal wetland had a high net carbon uptake capacity.

4.2 Dynamics and environmental controlling on ecosystem CO2 flux

4.2.1 Dynamics of ecosystem CO2 flux across zonal vegetation
Based on the long-term and continuous flux measurement, the diurnal, seasonal and interannual variations across different zonal vegetations were analyzed. (1) At daily scale, ecosystem CO2 flux was generally coherent with radiation and temperature which attained the peak at the middle of the day (Yu and Sun, 2006). (2) At seasonal scale, apparent unimodal variations of CO2 flux were presented for both mid- and high latitude and alpine vegetation in northern China and the Tibetan Plateau, while the differences among seasons were reduced in subtropical and tropical vegetation. Due to the limitation of soil moisture and low temperature, ecosystem CO2 flux of grassland in northern China and semi-arid region of the Tibetan Plateau presented high sensitivity to precipitation. For the cropland in northern China, bimodality pattern was appeared due to the crop rotation. (3) Due to the environmental changes, apparent interannual variability of CO2 flux was appeared in different ecosystems (Yan et al., 2013; Tan et al., 2012; Wen et al., 2010).
4.2.2 Environmental responses of ecosystem CO2 flux
From the synthesized analysis on ecosystem CO2 flux, the environmental responses of different terrestrial ecosystems in China were presented. For example, the effects of diffuse radiation (Fan et al., 2011; Zhang et al., 2009, 2010, 2011), water supply (Wen et al., 2006; Fu et al., 2006; Hao et al., 2010a; Wen et al., 2010; Wang et al., 2011), pulse rainfall (Hao et al., 2010b, 2011, 2013; Yan et al., 2011), and temporal distribution of precipitation (Yu et al., 2005; Yan et al., 2012, 2013) on ecosystem CO2 flux were elucidated. At the same time, a series of important ecological phenomena and their controling mechanism were illustrated. For example, the ‘light depress’ at ecosystem scale in temperate and alpine grasslands (Fu et al., 2006, 2009), the nonlinear response of ecosystem carbon flux to temperature variation (Yu and Sun, 2008), heterogeneous response of soil respiration to temperature (Tan et al., 2013; Jia et al., 2013; Song et al., 2013), the spatio-temporal variation of ecosystem light use efficiency (Yuan et al., 2010; Zhang et al., 2006c; Wu et al., 2008), and the ‘carbon pool’ in mountain area (Yao et al., 2012). Such studies enhance the understanding of the biotic and abiotic controlling mechanism of ecosystem CO2 flux across different temporal scales, and the response and adaptation of ecosystem flux to global change.

4.3 The spatial pattern of ecosystem carbon fluxes and the underlying biogeographical mechanisms

4.3.1 Global pattern of ecosystem carbon fluxes and biogeographical mechanisms
Terrestrial ecosystems play an important role in regulating the atmospheric CO2 concentration and mitigating the global warming. However, the carbon exchange between terrestrial ecosystems and the atmosphere varies substantially at the spatial scale. To reduce the uncertainty of terrestrial ecosystems in the global carbon budget, it is necessary to understand the spatial variability of carbon flux and its controlling mechanism. ChinaFLUX researchers based on the ecosystem carbon flux data, quantitatively evaluated the spatial variability of ecosystem carbon flux in China (Yu et al., 2013b). GPP, RE and NEP showed obvious latitudinal pattern and mean annual temperature and precipitation and their interaction explained more than 60% of the spatial variation of GPP, RE and NEP in China (Yu et al., 2013b). Analyses of Asian, Northern Hemispheric and global carbon flux data all showed that the spatial variation of GPP, RE and NEP were mainly influenced by the pattern of mean annual temperature and precipitation (Yu et al., 2013b; Chen et al., 2013; Chen et al., 2015a). In the Northern Hemisphere, the pattern of mean annual temperature, precipitation and vegetation index NDVI jointly explained large parts of the spatial variation of GPP and RE respectively (Chen et al., 2015a). Further analysis revealed that the pattern of mean annual temperature and precipitation, through shaping the pattern of vegetation properties, to influence the spatial pattern of carbon fluxes (Chen et al., 2015a). Series of results provide evidence to the theory of climate pattern shaping the spatial pattern of ecosystem carbon fluxes at the regional and global scales. It reveals the underlying biogeographical mechanisms for the spatial pattern of carbon fluxes, and puts forward new approach to analyze and evaluate the regional and global ecosystem carbon budget from the aspect of the geographical distribution of climate factors (Yu et al., 2013b; Chen et al., 2013; Chen et al., 2015a).
4.3.2 High carbon sinks and interrelations among carbon fluxes at spatial pattern
Global analysis of carbon fluxes indicated that East Asian monsoon subtropical forests between 20°N and 40°N have high strength of carbon uptake and it attributes to the combined effects of the young stand ages, high nitrogen deposition and sufficient and synchronous water and heat availability (Yu et al., 2014c). Integrative analysis of global carbon fluxes data showed that GPP and RE co-varied at the spatial pattern from regional to global scale (Yu et al., 2013b; Chen et al., 2013; Chen et al., 2015b). The spatial pattern of GPP determined 90% of the global spatial pattern of RE and its underlying physiological mechanism due to the fact that production GPP functions as the direct substrate provider for respiration RE (Chen et al., 2015b).

4.4 Dynamics of water vapor fluxes and water use efficiency and their environmental controlling mechanisms

4.4.1 The spatio-temporal variations of ecosystem evapotranspiration and their influencing factors in China
Evapotranspiration (ET) is an important component of water cycle and energy balance in terrestrial ecosystems (Wang and Dickinson, 2012). Investigating the spatio-temporal variations of ET and their influencing factors is of great significance for water resource management and assessment (Zheng et al., 2016). Eddy covariance technique can directly measure water vapor fluxes between atmosphere and biosphere (Yu et al., 2006; Baldocchi, 2008), which plays an important role in exploring ET spatio-temporal variations and their affecting factors. Based on eddy covariance measured water vapor fluxes, ChinaFLUX investigated the diurnal variation (Li et al., 2010; Zheng et al., 2014), the seasonal dynamics (Tang et al., 2014; Zhou et al., 2010), and the interannual variation (Zhou et al., 2010; Xu et al., 2014) of ET in typical ecosystems. The results revealed the hysteresis responses of ET to air temperature and vapor pressure deficit in its diurnal variation (Zheng et al., 2014). The role of soil water content (Li et al., 2010; Tang et al., 2014) and air condition (Li et al., 2010; Zhou et al., 2010) in the seasonal dynamics of ET and the relative contributions of ecological responses and climate variation in ET interannual varitions (Zhou et al., 2010; Xu et al., 2014) were also clarified. In addition, based on measured ET, ChinaFLUX also revised the Shuttleworth-Wallace model and applied it in forests and grasslands (Hu et al., 2009; Hu et al., 2013; Zhu et al., 2015). ET components were also separated with hydrogen and oxygen isotope from isotope online observations, which provides a critical tool to reveal the variations of ET components (Hu et al., 2014).
Based on the mechanism analysis of ET dynamics in typical ecosystems, ChinaFLUX also explored network observations to reveal the statistics of ET in typical regions and revealed the spatial variation of ET, especially the relationships between ET and climate and vegetation spatial patterns. The results indicated that annual net radiation, annual precipitation and annual mean temperature shaped the spatial pattern of ET, which provides a basis for assessing the spatial distribution of ET (Zheng et al., 2016). Network measured ET was also used to optimize the ET remote sensing model and to assess the spatial distribution of ET in China (Li et al., 2014).
4.4.2 The spatio-temporal variations of ecosystem water use efficiency and their environmental and biological controlling mechanisms
Water use efficiency (WUE) is an important parameter reflecting the interaction between carbon and water cycles. Analyzing the spatio-temporal variations of WUE, which would benefit for rational utilization of regional water resources, would improve our understanding on carbon and water cycles in terrestrial ecosystems (Zhu et al., 2015). Eddy covariance technique, which simultaneously measures carbon and water fluxes, laid an important data basis for analyzing the variations of WUE. Using eddy covariance measured GPP and ET, ChinaFLUX analyzed the dynamic of WUE in typical forests (Yu et al., 2008), grasslands (Hu et al., 2008) and cropland (Zhao et al., 2007) and found the “coupling and decoupling” phenomena in the dynamics of carbon and water fluxes. Then the biological and environmental mechanisms underlying the WUE dynamics (Yu et al., 2008, Hu et al., 2008) and their difference among regions were clarified (Zhu et al., 2014).
In addition, based on network eddy covariance measurements, the spatial variations of WUE among forests (Yu et al., 2008), grasslands (Hu et al., 2008), and ecosystems having different ecosystem types (Zhu et al., 2015) were investigated, which were found to be differed among ecosystem types. Annual mean air temperature and annual precipitation were found to be the dominant factors influencing the spatial variation of WUE among forests (Yu et al., 2008), but leaf area index (LAI) was found to determine the spatial variation of WUE among grasslands (Hu et al., 2008). Further analysis firstly illustrated the close relationship between WUE and altitude among different ecosystem types and found the spatial variation of WUE can be comprehensively reflected by elevation and LAI (Zhu et al., 2015). Then the spatial distribution of WUE was obtained to analyze the water cost of carbon sequestration and the reasonable regions in afforestation. The water cost of carbon sequestration threshold for afforestation was found to be near 400-500 mm rainfall, which made the region on the west of the threshold having huge water limit risk in afforestation (Gao et al., 2014).

4.5 Spatio-temporal patterns of atmospheric inorganic N deposition

4.5.1 Spatio-temporal patterns of atmospheric wet N deposition in China and the influencing factors
China has been considered as one of three regions with the highest atmospheric nitrogen (N) deposition in the world. Therefore, understanding the spatio-temporal patterns and factors of atmospheric N deposition is useful to evaluate its ecological effects on terrestrial ecosystems. Based on CERN and some other ecological observation sties, researchers established a national observation network to monitor atmospheric N deposition.
The network revealed the composition of the wet N deposition in China and highlighted the importance of total particular N (TPN) through precipitation event. It was estimated, on the basis of the measured data, that the atmospheric wet N deposition of total dissolved N (TDN), NH4+-N, and NO3--N were 13.69, 7.25, and 5.93 kg N ha-1 yr-1, respectively. The ratio of NH4+/NO3- was 1.22 on average at national scale. Furthermore, the deposition of TPN was about 4.33 kg N ha-1 yr-1, accounting for 24% of TN through precipitation event; these findings confirmed the ideas that atmospheric wet N deposition was underestimated without including TPN (Sheng et al., 2012; Zhan et al., 2014; Zhu et al., 2015). Meanwhile, through analyzing the published monitoring data during 1980-2000, researchers found that atmospheric dissolved inorganic N deposition (DIN, including NH4+-N and NO3--N) increased by 25% from the 1990s to 2000s in China (Jia et al., 2014). Atmospheric wet N deposition was the highest over southern China and exhibited a decreasing gradient from southern to western and northern China. Precipitation, N fertilizer use, and energy consumption were significantly correlated with atmospheric wet N deposition (Zhu et al., 2015).
4.5.2 Spatio-temporal patterns of atmospheric dry N deposition in China and influencing factors
Dry N deposition is an important component of total atmospheric N deposition. However, how to assess accurately atmospheric dry N deposition at regional and global scales is a big challenge for scientists, and the results have high uncertainty. Based on the chemical transformations between airborne reactive N, researchers developed new methods which can evaluate the spatial patterns and trends of dry deposition fluxes in 2005-2014 in China and globally from ground N concentrations and the Ozone Monitoring Instrument (OMI) NO2 columns. The results showed that the average of dry N deposition fluxes in China was about 7.78 kg N ha-1 yr-1, and the fluxes of NO2, HNO3, NH4+, NO3-, and NH3 were estimated to be 0.67, 1.15, 0.28, 0.07 and 5.61 kg N ha-1 yr-1, respectively (Jia et al., 2016). Furthermore, North China, East China, and Central China were subjected to higher dry deposition N fluxes in China, which accompanied with a significant increase at the rate of 1-2 kg N ha-1 yr-1 in the past decade (Jia et al., 2016). China was not only the country with high dry N deposition fluxes but also the country with the greatest increase in dry N deposition fluxes over the past decade, where was expected as the most hotspots of N deposition. Large NOx and NH3 emissions resulted in the ongoing high N deposition in this region (Jia et al., 2016).
4.5.3 Mechanisms responsible for effects of atmospheric N deposition on soil greenhouse gas fluxes in the forest and grasslands
Terrestrial soils are the source or sink of atmospheric CO2, CH4, and N2O, and are susceptible to exogenous nitrogen inputs such as atmospheric nitrogen deposition. This thereby influences the regional and global carbon budget in terrestrial ecosystems (Liu and Greaver, 2010). The responses of soil greenhouse gas fluxes to N addition depend on the initial status of terrestrial ecosystems as well as the type and dose of N addition (Fang et al., 2014a). Oxidized NO3- and reduced NH4+ inputs contrastingly affect soil greenhouse gas exchange fluxes. The promotion or inhibition on soil greenhouse gas fluxes are stronger from NH4+-N fertilizer addition than from NO3--N fertilizer addition (Jiang et al., 2010; Fang et al., 2012; Wang et al., 2014). Also, the responses of soil greenhouse gas fluxes to N addition dose exhibit a nonlinear curve. Low dose of N addition inhibits soil CO2 and N2O emissions, but promotes soil CH4 uptake, whereas high doses of N inputs have contrary effects. Overall, these contrasting responses depend on the different stage of N saturation in terrestrial ecosystems (Fang et al., 2012, 2014; Xu et al., 2014). Furthermore, the environmental mechanisms driving the responses of soil greenhouse gas fluxes in the northern and southern forests of China to N enrichment are contrasting. Southern forests are mainly regulated by soil NO3--N content, while northern forests are controlled by the combination of soil water and NO3--N contents (Li et al., 2015). As far as microbial mechanisms are concerned, soil microbial communities in the northern forests use mainly high energy soil substrates, but those of subtropical forests equivalently use various soil substrates. The difference in microbial resource utilization tactics dominates the spatial pattern of soil heterotrophic respiration (Rh), and the tradeoff between root autotrophic respiration (Ra) and Rh responded contrastingly to N addition determines the interannual variability of responses at the site scale (Fang et al., 2014b; Wang et al., 2015). In addition, N addition increases soil ammonia-oxidizing archaea (AOA) abundance, and does not change soil ammonia oxidizing bacteria (AOB) activity. The negative and positive relationships between soil AOA abundance and CH4 uptake and between soil AOA abundance and soil N2O emissions are often observed, suggesting changes in soil ammonia-oxidizing bacteria community structure can well explain the fluctuation between soil CH4 uptake and N2O emission (Wang et al., 2016).
4.5.4 Riverine carbon and nitrogen transport fluxes in Chinese terrestrial ecosystem and its impact on carbon cycle in coastal ecosystem
Rivers closely link carbon, nitrogen, water exchange between terrestrial and oceanic ecosystem, so riverine carbon, nitrogen, water exported flux monitor significantly impact on C and N biogeochemical process and associated couple at horizontal scale (Gao et al., 2013). The annual discharge of runoff and sediment from river systems to ocean bodies in China reaches up to 1.49×10¹² m3 and 1.72×10⁹ t, respectively, wherein the runoff discharged into the East China Sea is the highest, approximating to 1.2×10⁹ t (MWR, 2011a, b). Based on integration analysis on runoff and C transport in main Chinese rivers, the annual C transport from the river systems to coastal ecosystem bodies in China is 64.35 TgC, wherein the Yangtze River, Yellow River, and Pearl River in China contribute 76.9% of the total C transport in China. The Yellow River and the Yangtze River transport 21.71 TgC and 16.3 TgC annually, accounting for 33.7% and 25.3% of the total annual C transport in China, respectively (Gao et al., 2015; Zhu et al., 2012).
Although many research reports on the effect of N on C cycle in coastal ecosystem (Doney et al., 2007), there are few reports on C and N transport flux from river-ocean scale and elucidating its C and N coupling relationship. Based on C/N ratio in aquatic ecosystem, Gao et al. (2015) estimate the effect of N export on C cycle in aquatic ecosystem. The results showed that the main forms of N discharged into Chinese coastal waters was NO3- and annual net N export from Chinese rivers reaches 12-15×108 kg N. yr-1, which constitutes 80% of the total of nutrient discharged into Chinese coastal ecosystem. Further estimation demonstrated that N transport flux from Chinese terrestrial ecosystem may account for 11% of the inorganic C exchange in air-sea interface (Gao et al., 2015). In the future, as to carbon, nitrogen, water coupling cycle in Chinese terrestrial ecosystem, we should strengthen monitoring on carbon, nitrogen, water horizontal export flux and external N and P transport, which would be helpful to exactly estimate C budget in Chinese terrestrial ecosystem and elucidate the effect of river on carbon, nitrogen, water coupling cycle in terrestrial ecosystem.

4.6 Spatial pattern of carbon budget in China’s terrestrial ecosystems

4.6.1 Carbon budget in Chinese terrestrial ecosystems based on carbon cycle model
The approaches of carbon cycle model, as an important tool in C cycle research, play a vital role in regional C budget assessment. Using the carbon flux data measured by eddy covariance, the C models involving the optimized parameters have been developed to assess the spatio-temporal patterns of different components of C budget in China. Our findings showed that annual GPP ranged from 4.42 Pg C yr-1 to 6.03 Pg C yr-1 in China (Yu et al., 2013c), while the values of annual NPP were between 1.43 and 1.43 Pg C yr-1, with an average of 2.83 ± 0.83 Pg C yr-1 (Gao et al., 2012). Annual NEP resulting from the models was approximately 0.18 ± 0.18 Pg C yr-1, which ranged from 0.063 to 0.57 Pg C yr-1 (Yu et al., 2013c).
4.6.2 Carbon budget in Chinese terrestrial ecosystems based on the field investigated data
Field-investigated data are very important to evaluate the C budget in terrestrial ecosystems. In the past years, we integrated the multi-resource data, including long-term monitoring data and publicly published data to find that the stocks of soil organic carbon (SOC) and soil inorganic carbon (SIC) in 0-100 cm soil layer were 93.9 and 61.2 Pg C, respectively. It was estimated that vegetation C storage was about 14.9 Pg C, including 7.8 Pg C in forest vegetation, 2.1 Pg C in grassland vegetation, 3.4 Pg C in shrub vegetation, 0.95 Pg C in farmland vegetation, 0.49 Pg C in desert vegetation, and 0.25 Pg C in wetland vegetation. Furthermore, the carbon sink was estimated as 0.14-0.18 Pg C yr-1, with an average of 0.16 Pg C yr-1 (Yu et al., 2013c). With the development of forests, Chinese forests have a huge potential to sequestrate C from atmosphere (Liu et al., 2014), because most forests were young forest and forest age was averaged as 29 years. Under the scenarios of mature forests and with constant forest area, the C sequestration potential for vegetation and soil were 10.81 and 5.01 Pg C in Chinese forests, respectively (Wen et al., 2016).
4.6.3 Carbon budget in Chinese terrestrial ecosystem based on biogeographical statistics
Based on the understanding about the influences of annual mean air temperature and annual precipitation on the spatial variations of GPP, RE, NEP, and soil respiration (RS) (Yu et al., 2013b), researchers developed the approaches of biogeographical statistics on the C fluxes in China to quantify their magnitudes and spatial distributions (Yu et al., 2010; Zhu et al., 2014). The results showed that Chinese climate-potential GPP, NEP, RE, and RS in the 2000s were 7.78, 1.71, 6.05, and 3.96 Pg C yr-1, respectively, which accounted for 4.45%-7.04%, 8.14%-11.40%, 5.87%-6.30%, and 4.93% of the global corresponding fluxes (Yu et al., 2010; Zhu et al., 2014). Furthermore, the whole China was considered as a regional biome-society system to assess its C sink on the basis of multi-source data integration (Zhu et al., 2014; Wang et al., 2015). The results demonstrated that C sink in China was about 0.41 ± 0.12 Pg C yr-1 (Wang et al., 2015). It is necessary to say that the C emission resulting from human disturbance can consumed 42.65% NEP in China (Wang et al., 2015). Therefore, further study should emphasize the importance of reasonable ecosystem management, which may reduce the C emissions by human activities and lengthen the residence time for the fixed C in ecosystems (Wang et al., 2015).

5 Prospect and emphases of ChinaFLUX coordinated observation on terrestrial ecosystem carbon, nitrogen and water fluxes

Through ten years development, ChinaFLUX innovatively established the terrestrial ecosystem carbon, nitrogen and water fluxes coordinated observation system, and made important progress in flux observation technology development, ecosystem carbon, nitrogen, water exchange processes and environment control mechanism research, model simulation, and regional carbon, nitrogen and water budget assessment. As entering the new big science and big data era, ChinaFLUX will face more challenges from many aspects of science and technology.
The future major missions of terrestrial ecosystem carbon, nitrogen, water fluxes coordinated observation and research of ChinaFLUX include: (1) achieve CO2, H2O, CH4, CO2, NO, NO2, N2O, NH3 and HNO3 multiple types of carbon, nitrogen, water trace gas fluxes integrated observation, so as to improve and upgrade the technical level of multiple trace greenhouse gas fluxes observation; (2) effectively organize the network observation and improve the spatial representativeness of observational sites, so as to provide services for ecosystem and global change science research; (3) develop the ground-based and space-based integrated observation system, so as to better evaluate the ecosystem carbon source / sinks and environmental response; (4) meet the data requirements of the large-scale, quantitative, predictable and early warning ecological research in the new era. Future ecological research in China are expected to be based on ChinaFLUX, to realize the leap from the ecological factors observation to the whole ecosystem observation, to develop ecological observation satellites, to improve and optimize ecosystem model system, so as to provide better services to the quantitative assessment, scientific prediction, scenario forecast and ecological early warning for the global sustainable development.

The authors have declared that no competing interests exist.

1
Baldocchi D D, 2014. Measuring fluxes of trace gases and energy between ecosystems and the atmosphere: The state and future of the eddy covariance method.Global Change Biology, 20(12): 3600-3609.

2
Baldocchi D, 2008. Breathing of the terrestrial biosphere: Lessons learned from a global network of carbon dioxide flux measurement systems.Australian Journal of Botany, 56: 1-26.

3
Cao M K, Yu G R, Liu J Yet al., 2005. Multi-scale observation and cross-scale mechanistic modeling on terrestrial ecosystem carbon cycle.Science in China Series D, 48(S1): 17-32.To predict global climate change and to implement the Kyoto Protocol for stabilizing atmospheric greenhouse gases concentrations require quantifying spatio-temporal variations in the terrestrial carbon sink accurately. During the past decade multi-scale ecological experiment and observation networks have been established using various new technologies (e.g. controlled environmental facilities, eddy covariance techniques and quantitative remote sensing), and have obtained a large amount of data about terrestrial ecosystem carbon cycle. However, uncertainties in the magnitude and spatio-temporal variations of the terrestrial carbon sink and in understanding the underlying mechanisms have not been reduced significantly. One of the major reasons is that the observations and experiments were conducted at individual scales independently, but it is the interactions of factors and processes at different scales that determine the dynamics of the terrestrial carbon sink. Since experiments and observations are always conducted at specific scales, to understand cross-scale interactions requires mechanistic analysis that is best to be achieved by mechanistic modeling. However, mechanistic ecosystem models are mainly based on data from single-scale experiments and observations and hence have no capacity to simulate mechanistic cross-scale interconnection and interactions of ecosystem processes. New-generation mechanistic ecosystem models based on new ecological theoretical framework are needed to quantify the mechanisms from micro-level fast eco-physiological responses to macro-level slow acclimation in the pattern and structure in disturbed ecosystems. Multi-scale data-model fusion is a recently emerging approach to assimilate multi-scale observational data into mechanistic, dynamic modeling, in which the structure and parameters of mechanistic models for simulating cross-scale interactions are optimized using multi-scale observational data. The models are validated and evaluated at different spatial and temporal scales and real-time observational data are assimilated continuously into dynamic modeling for predicting and forecasting ecosystem changes realistically. in summary, a breakthrough in terrestrial carbon sink research requires using approaches of multi-scale observations and cross-scale modeling to understand and quantify interconnections and interactions among ecosystem processes at different scales and their controls over ecosystem carbon cycle.

DOI

4
Chen D X, 2010. Dynamics and controls of carbon exchange of a tropical montane rain forest at Jianfengling, China [D]. Beijing: Chinese Academy of Forestry. (in Chinese)

5
Chen Z, Yu G R, Ge J Pet al., 2013. Temperature and precipitation control of the spatial variation of terrestrial ecosystem carbon exchange in the Asian region.Agricultural and Forest Meteorology, 182: 266-276.Carbon exchange between terrestrial ecosystems and the atmosphere is one of the most important processes in the global carbon cycle. Understanding the spatial variation and controlling factors of carbon exchange fluxes is helpful for accurately predicting and evaluating the global carbon budget. In this study, we quantified the carbon exchange fluxes of different terrestrial ecosystems in the Asian region, and analyzed their spatial variation and controlling factors based on long-term observation data from ChinaFLUX (19 sites) and published data from AsiaFlux (37 sites) and 32 other sites in Asia. The results indicated that the majority of Asian terrestrial ecosystems are currently large carbon sinks. The average net ecosystem production (NEP) values were 325 ± 187, 274 ± 207, 236 ± 260, 89 ± 134 g C m

DOI

6
Chen Z, Yu G R, Ge J Pet al., 2015a. Roles of climate, vegetation and soil in regulating the spatial variability in ecosystem carbon dioxide fluxes in the Northern Hemisphere.PLoS One, 10(4): e0125265.

7
Chen Z, Yu G R, Zhu X Jet al., 2015b. Covariation between gross primary production and ecosystem respiration across space and the underlying mechanisms: A global synthesis.Agricultural and Forest Meteorology, 203: 180-190.

8
Cui S, 2007. Study on the CO2 flux of a larch plantation in NE China by the micrometeorological method [D]. Harbin: Northeast Forestry University. (in Chinese)

9
Doherty S, Bojinski S, Henderson-Sellers Aet al., 2009. Lessons learned from IPCC AR4: Scientific developments needed to understand, predict, and respond to climate change.Bulletin of the American Meteorological Society, 90(4): 497-513.The Fourth Assessment Report (AR4) of the Intergovernmental Panel on Climate Change (IPCC) concluded that global warming is "unequivocal" and that most of the observed increase since the mid-twentieth century is very likely due to the increase in anthropogenic greenhouse gas concentrations, with discernible human influences on ocean warming, continental-average temperatures, temperature extreme...

DOI

10
Doney S C, Mahowald N, Lima Iet al., 2007. Impact of anthropogenic atmospheric nitrogen and sulfur deposition on ocean acidification and the inorganic carbon system.Proceedings of the National Academy of Sciences of the United States of America, 104(37): 14580-14585.Fossil fuel combustion and agriculture result in atmospheric deposition of 0.8 Tmol/yr reactive sulfur and 2.7 Tmol/yr nitrogen to the coastal and open ocean near major source regions in North America, Europe, and South and East Asia. Atmospheric inputs of dissociation products of strong acids (HNO(3) and H2SO(4)) and bases (NH(3)) alter surface seawater alkalinity, pH, and inorganic carbon storage. We quantify the biogeochemical impacts by using atmosphere and ocean models. The direct acid/base flux to the ocean is predominately acidic (reducing total alkalinity) in the temperate Northern Hemisphere and alkaline in the tropics because of ammonia inputs. However, because most of the excess ammonia is nitrified to nitrate (NO(3)(-)) in the upper ocean, the effective net atmospheric input is acidic almost everywhere. The decrease in surface alkalinity drives a net air-sea efflux of CO(2), reducing surface dissolved inorganic carbon (DIC); the alkalinity and DIC changes mostly offset each other, and the decline in surface pH is small. Additional impacts arise from nitrogen fertilization, leading to elevated primary production and biological DIC drawdown that reverses in some places the sign of the surface pH and air-sea CO(2) flux perturbations. On a global scale, the alterations in surface water chemistry from anthropogenic nitrogen and sulfur deposition are a few percent of the acidification and DIC increases due to the oceanic uptake of anthropogenic CO(2). However, the impacts are more substantial in coastal waters, where the ecosystem responses to ocean acidification could have the most severe implications for mankind.

DOI PMID

11
Dong G, 2011b. Carbon and water fluxes and water use efficiency of the Songnen meadow steppe in Northeast China [D]. Changchun: Northeast Normal University. (in Chinese)

12
Dong G, Guo J, Chen Jet al., 2011a. Effects of spring drought on carbon sequestration, evapotranspiration and water use efficiency in the Songnen meadow steppe in Northeast China.Ecohydrology, 4(2): 211-224.Global climate change projections suggest an increasing frequency of droughts and extreme rain events in the steppes of the Eurasian region. Using the eddy covariance method, we measured carbon and water balances of a meadow steppe ecosystem in Northeast China during 2 years which had contrasting precipitation patterns in spring seasons in 2007 and 2008. The meadow steppe sequestrated only 64.2 gC m(-2) year(-1) in 2007 compared to 160.5 gC m(-2) year(-1) in 2008, due to a severe spring drought in 2007. The 2007 spring drought resulted in a dramatic reduction of leaf area index (LAI) and aboveground net primary productivity (ANPP). However, the meadow steppe still acted as a carbon sink in 2007. The strength of the sink was much greater than that in the typical steppes in Central Mongolia and Inner Mongolia. Spring drought also caused a reduction of plant transpiration (Tr) and total ecosystem evapotranspiration (ET). However, the suppression of ET in 2007 was relatively small in comparison to gross ecosystem productivity (GEP) reduction. Thus, ecosystem water use efficiency (WEU) (GEP/ET) in 2007 was reduced to 5.0 gCO(2) kg(-1) H2O or 75% of that of 2008. We concluded that spring drought detrimentally impacted meadow steppe ecosystem by reducing leaf areas, biomass, GEP, WUE and associated increases in soil evaporation (Es) that might aggravate soil salinization of the Songnen Plain. Copyright (C) 2011 John Wiley & Sons, Ltd.

DOI

13
Du Q, Liu H Z, Feng J Wet al., 2012. Carbon dioxide exchange processes over the grassland ecosystems in semiarid areas of China.Science in China Series D, 42(5): 711-722.Based on the carbon fluxes measured over the grassland ecosystems in Inner Mongolia(UG79 site),Loess Plateau(SACOL site),and Tongyu,Jilin Province(TY site) in the semiarid areas from 2007 to 2008 with the eddy covariance method,we have investigated the carbon exchange processes over semiarid grassland ecosystem and its main affecting environmental variables.The precipitations at UG79 and TY sites in 2007 were below the historical average,especially for TY site,which was 50% below the historical average annual precipitation.The precipitation in SACOL site was close to average in 2007 but below average in 2008.The variation of monthly diurnal average NEE showed that the diurnal mean NEE decreased in the order of TY site,UG79 site,and SACOL site.However,a longer net carbon uptake period was observed at SACOL site.The diurnal course of NEE at UG79 site was similar between 2007 and 2008.The diurnal average NEE remained large during July and August in growing season(May to September) at UG79 site,with maximum values approaching 0.08 mg C m-2 s-1 in August of 2008.The diurnal average NEE of 2007 was larger than 2008 at SACOL site,with maximum values of 0.07 mg C m-2 s-1 in September of 2007.A shorter carbon uptake period was recorded in 2007 at TY site,lasting from July to August.A larger diurnal average NEE occurred in 2008 at TY site,with maximum values of 0.12 mg C m-2 s-1.The ecosystem respirations of three sites were controlled by both soil temperature and soil volumetric water content(at a depth of 5 cm below the land surface).Both UG79 site and SACOL site acted as a carbon sink during the growing periods of 2007 and 2008.Annual NEE in the growing seasons of 2007 and 2008 ranged from-68 to-50 g C m-2 at UG79 site and from-109 to-55 g C m-2 at SACOL site.Alternation between carbon source and carbon sink was found at TY site,with respective values of annual NEE in the growing seasons of 0.32 g C m-2 and-73 g C m-2 in 2007 and 2008.The magnitude and duration of carbon uptake depended mainly on the amount and timing of precipitation and the timing of the first effective rainfall during the growing season in semiarid grassland ecosystems.

DOI

14
Fan Y Z, Zhang X Z, Wang J Set al., 2009. Effect of solar radiation on net ecosystem CO2 exchange of alpine meadow on the Tibetan Plateau.Journal of Geographical Sciences, 21(4): 666-676.On the Tibetan Plateau , the alpine meadow is the most widespread vegetation type. The alpine meadow has a low biological productivity and low vegetation coverage in the growing season. The daytime NEE between the atmosphere and the alpine meadow ecosystem was influenced by solar radiation. To analyze the characteristics of change in NEE and to calculate the parameters related to photosynthesis and respiration in different solar radiation environments, the NEE measurements were taken in Damxung from July to August in 2003, 2004, 2005 and 2006 using the eddy covariance technique. Solar radiation was grouped into three levels according to the net radiation, which was more than 155 W m 612 d 611 on clear days, 144±5 W m 612 d 611 on partly cloudy days and less than 134 W m 612 d 611 on cloudy days. The diurnal relationships between NEE and PAR varied with differences in solar radiation, which was a rectangular hyperbola form on clear days, two different concave curves on partly cloudy days and an irregular triangle form on cloudy days. The mean CO 2 absorption rate showed a decreasing trend with increasing solar radiation. The daytime absorption maximum occurred around 10:00 on clear days with an average of slightly less 610.2 mg m 612 d 611 , around 11:00 on partly cloudy days with an average of about 610.2 mg m 612 d 611 , and around 12:00 on cloudy days with an average of about 610.25 mg m 612 d 611 . As solar radiation increased, the A max and the Q 10 decreased. However, the R10 increased and the maximum of the α occurred on partly cloudy days. The optimum net solar radiation was about 134–155 W m 612 d 611 , which induced a PAR of about 1800–2000 μmol m 612 s 611 and soil temperature at a depth of 5 cm of about 14°C. Therefore, on the Tibetan Plateau , the alpine meadow ecosystem will have a higher carbon absorption potential while solar radiation decreases in the future.

DOI

15
Fang H J, Cheng S L, Yu G Ret al., 2012. Responses of CO2 efflux from an alpine meadow soil on the Qinghai-Tibetan Plateau to multi-form and low-level N addition.Plant and Soil, 351: 177-190.

16
Fang H J, Cheng S L, Yu G Ret al., 2014a. Low-level nitrogen deposition significantly inhibits methane uptake from an alpine meadow soil on the Qinghai-Tibetan Plateau.Geoderma, 213: 444-452.It is crucial to understand the effects of enhanced nitrogen (N) deposition on soil methane (CH 4 ) uptake to develop a better comprehension of carbon (C) dynamics in terrestrial ecosystems. A two-year field study was conducted to assess the effects of various forms of N (NH 4 + and NO 3 61 ) and associated N deposition rates (0, 10, 20 and 4002kg02N02ha 61021 02yr 61021 ) on alpine meadow soil CH 4 fluxes on the Qinghai–Tibetan Plateau, China. Soil CH 4 fluxes, soil temperature, and soil moisture were monitored weekly using the static chamber technique and gas chromatography. Soil inorganic N pools, soil pH and aboveground biomass were measured monthly to examine the key controlling factors of soil CH 4 flux. Our results showed that N addition significantly promoted plant growth and changed soil water-filled pore space (WFPS), but did not alter soil inorganic N storages over the short term. Low rates of N addition significantly decreased the seasonal amount of CH 4 uptake by 8.6% compared with the control. Soil CH 4 fluxes were mainly determined by soil WFPS, followed by inorganic N availability. N addition increased the contribution of soil WFPS, pH and soil NO 3 61 storage. The observed reduction in CH 4 uptake caused by N addition may be largely due to a decrease in physical diffusion, as the biochemical inhibition effects on methanotrophic bacteria are minor. These results suggest that soil inorganic N is a regulatory factor of soil CH 4 uptake, and its promotion or inhibition to soil CH 4 uptake depends on the N status in terrestrial ecosystems.

DOI

17
Fang H J, Cheng S L, Yu G Ret al., 2014b. Nitrogen deposition impacts on the amount and stability of soil organic matter in an alpine meadow ecosystem depend on the form and rate of applied nitrogen.European Journal of Soil Science, 65(4): 510-519.

18
Fang X R, 2011. Carbon exchange and its response to environmental factors in Poplar plantation ecosystem [D]. Beijing: Beijing Forestry University. (in Chinese)

19
FLUXNET Web Page.] from Oak Ridge National Laboratory Distributed Active Archive Center (ORNL DAAC), Oak Ridge, Tennessee, USA.

20
Fu Y L, Yu G R, Sun X Met al., 2006. Depression of net ecosystem CO2 exchange in semi-arid Leymus chinensis steppe and alpine shrub.Agricultural and Forest Meteorology, 137: 234-244.Uptake and release of carbon in grassland ecosystems is very critical to the global carbon balance and carbon storage. In this study, the dynamics of net ecosystem CO2 exchange (FNEE) of two grassland ecosystems were observed continuously using the eddy covariance technique during the growing season of 2003. One is the alpine shrub on the Tibet Plateau, and the other is the sem-arid Leymus chinensis steppe in Inner Mongolia of China. It was found that the FNEE of both ecosystems was significantly depressed under high solar radiation. Comprehensive analysis indicates that the depression of FNEE in the L. chinensis steppe was the results of decreased plant photosynthesis and increased ecosystem respiration (R-eco) under high temperature. Soil water stress in addition to the high atmospheric demand under the strong radiation was the primary factor limiting the stomatal conductance. In contrast, the depression of FNEE in the alpine shrub was closely related to the effects of temperature on both photosynthesis and ecosystem respiration, coupled with the reduction of plant photosynthesis due to partial stomatal closure under high temperature at mid-day. The R,c of the alpine shrub was sensitive to soil temperature during high turbulence (u* > 0.2 m s(-1)) but its FNEE decreased markedly when the temperature was higher than the optimal value of about 12 degrees C. Such low optimal temperature contrasted the optimal value (about 20 degrees C) for the steppe, and was likely due to the acclimation of most alpine plants to the long-term low temperature on the Tibet Plateau. We inferred that water stress was the primary factor causing depression of the FNEE in the semi-arid steppe ecosystem, while relative high temperature under strong solar radiation was the main reason for the decrease of FNEE in the alpine shrub. This study implies that different grassland ecosystems may respond differently to climate change in the future. (c) 2006 Elsevier B.V All rights reserved.

DOI

21
Fu Y L, Zheng Z M, Yu G Ret al., 2009. Environmental influences on carbon dioxide fluxes over three grassland ecosystems in China. Biogeosciences, 6: 2879-2893.This study compared carbon dioxide (CO2) fluxes over three grassland ecosystems in China, including a temperate semiarid steppe in Inner Mongolia (NMG), an alpine shrub-meadow in Qinghai (HB), and an alpine meadowsteppe in Tibet (DX). Measurements were made in 2004 and 2005 using the eddy covariance technique. Objectives were to document the seasonality of the net ecosystem exchange of CO2 (NEE) and its components, gross ecosystem photosynthesis (GEP), and ecosystem respiration (Reco), and to examine how environmental factors affect the CO2 exchange in these grassland ecosystems. The 2005 growing season (from May to September) was warmer than that of 2004 across the three sites, and precipitation in 2005 was less than that in 2004 at NMG and DX. The magnitude of CO2 fluxes (daily and annual sums) was largest at HB, which also showed the highest temperature sensitivity of Reco among the three sites. A stepwise multiple regression analysis showed that the seasonal variation of GEP, Reco, and NEE of the alpine shrubmeadow was mainly controlled by air temperature, whereas leaf area index can likely explain the seasonal variation in GEP, Reco, and NEE of the temperate steppe. The CO2 fluxes of the alpine meadow-steppe were jointly affected by soil moisture and air temperature. The alpine shrub-meadow acted as a net carbon sink over the two study years, whereas the temperate steppe and alpine meadow-steppe acted as net carbon sources. Both GEP and Reco were reduced by the summer and spring drought in 2005 at NMG and DX, respectively. The accumulated leaf area index during the growing season (LAIsum) played a key role in the interannual and intersite variation of annual GEP and Reco across the study sites and years, whereas soil moisture contributed most significantly to the variation in annual NEE. Because LAIsum was significantly correlated with soil moisture at a depth of 20 cm, we concluded that the available soil moisture other than annual precipitation was the most important factor controlling the variation in the CO2 budgets of different grassland ecosystems in China.

DOI

22
Gao Y N, Yu G R, Li S Get al., 2015. A remote sensing model to estimate ecosystem respiration in Northern China and the Tibetan Plateau.Ecological Modelling, 304: 34-43.Ecosystem respiration ( R e ) is rarely quantified from remote sensing data because satellite technique is incapable of observing the key processes associated with soil respiration. In this study, we develop a Remote Sensing Model for R e (ReRSM) by assuming that one part of R e is derived from current photosynthate with the respiratory rate coupling closely with gross primary production (GPP), and the other part of R e is derived from reserved ecosystem organic matter (including plant biomass, plant residues and soil organic matter) with the respiratory rate responding strongly to temperature change. The ReRSM is solely driven by the Enhanced Vegetation Index (EVI), the Land Surface Water Index (LSWI) and the Land Surface Temperature (LST) from MODIS data. Multi-year eddy CO 2 flux data of five vegetation types in Northern China and the Tibetan Plateau (including temperate mixed forest, temperate steppe, alpine shrubland, alpine marsh and alpine meadow-steppe) were used for model parameterization and validation. In most cases, the simulated R e agreed well with the observed R e in terms of seasonal and interannual variation irrespective of vegetation types. The ReRSM could explain approximately 93% of the variation in the observed R e across five vegetation types, with the root mean square error (RMSE) of 0.0402mol02C02m 612 02d 611 and the modeling efficiency (EF) of 0.93. Model comparison showed that the performance of the ReRSM was comparable with that of the RECO in the studied five vegetation types, while the former had much fewer parameters than the latter. The ReRSM parameters showed good linear relationships with the mean annual satellite indices. With these linear functions, the ReRSM could explain approximately 90% of the variation in the observed R e across five vegetation types, with the RMSE of 0.0502mol02C02m 612 02d 611 and the EF of 0.89. These analyses indicated that the ReRSM is a simple and alternative approach in R e estimation and has the potential of estimating spatial R e . However, the performance of ReRSM in other vegetation types or regions still needs a further study.

DOI

23
Gao Y N, Yu G R, Yan H Met al., 2014. A MODIS-based Photosynthetic Capacity Model to estimate gross primary production in northern China and the Tibetan Plateau.Remote Sensing of Environment, 148: 108-118.Accurate quantification of the spatio-temporal variation of gross primary production (GPP) for terrestrial ecosystems is significant for ecosystem management and the study of the global carbon cycle. In this study, we propose a MODIS-based Photosynthetic Capacity Model (PCM) to estimate GPP in Northern China and the Tibetan Plateau. The PCM follows the logic of the light use efficiency model and is only driven by the Enhanced Vegetation Index (EVI) and the Land Surface Water Index (LSWI). Multi-year eddy CO

DOI

24
Gao Y N, Yu G R, Zhang Let al., 2012. The changes of net primary productivity in Chinese terrestrial ecosystem: Based on process and parameter models.Progress in Geography, 31(1): 109-117. (in Chinese)Net primary productivity(NPP) is a basis of material and energy flows in terrestrial ecosystems,and it is also an important component in the research on carbon cycle and carbon budget.At present,studies on NPP on regional and global scales mainly depend on model simulation,among which process and remote sensing models are widely used.In this paper,we analyzed the published NPP for Chinese terrestrial ecosystem and its response to future climate change which were computed by process and remote sensing models.The results revealed that the averaged NPP in Chinese terrestrial ecosystem was(2.828卤0.827) PgC.a-1.Between 1982 and 1998,NPP tended to fluctuate but increased by 0.027 PgC.a-1 with an annual rate of 1.07%.Among different vegetation types,NPP per unit area was the maximum in evergreen broadleaf forests,which varied in a wide range among different researches;the values had a small discrepancy among deciduous needleleaf forests,evergreen needleleaf forests and deciduous broadleaf forests,and the value of croplands was lower than that of broadleaf forests,but higher than that of needleleaf forests;both grasslands and deserts had relatively low values,with the former having a significantly higher value than the latter.Furthermore,the total amount of NPP was the maximum in croplands followed by grasslands.The sum of both accounted for 58.34% of the gross.Except shrublands and evergreen needleleaf forests,all the other vegetation types had less than 10% of the gross.In the future climate scenarios,the NPP of Chinese terrestrial ecosystem might increase firstly,and then decrease.

DOI

25
Gao Y, He N P, Yu G Ret al., 2015. Impact of external nitrogen and phosphorus input between 2006 and 2010 on carbon cycle in China seas.Regional Environmental Change, 15: 631-641.It is widely accepted that excess nutrients change the dissolved inorganic carbon (DIC) system, which drives air-sea carbon dioxide (CO2) exchanges, so the changes in the DIC system will then affect the oceans' carbon (C) biogeochemistry cycle. This study explores the impact of external nutrient input from 2006 to 2011 on the DIC system and air-sea CO2 exchanges in four largest coastal seas in China. The result demonstrates that external nutrient input significantly facilitates the biological uptake of DIC and promotes air-sea CO2 fluxes in coastal waters. The C sink caused by nitrogen (N) and phosphorus (P) input for the Bohai Sea, the Yellow Sea, the East China Sea, and the South China Sea account for 46, 45, 11, and 59 % of the total C sink, respectively. The excess nutrient input significantly changes the DIC system and C biogeochemistry cycle process in China Ocean. Up to a certain point, these effects are positive in increasing DIC levels and enhancing air-sea CO2 exchanges. However, the DIC levels may decrease if the nutrient increase is greater than the capacity of the oceanic C system. In addition, the other impact factors, including sea level, winds, water, and air temperatures, and various human activities, such as agriculture, industry, and domestic discharge, also affect N and P transport, air-sea CO2 fluxes, and C biogeochemistry cycles.

DOI

26
Gao Y, Yu G R, He N P, 2013. Equilibration of the terrestrial water, nitrogen, and carbon cycles: Advocating a health threshold for carbon storage.Ecological Engineering, 57: 366-374.The world has long neglected the negative impacts that carbon (C) sequestration has on ecosystem health. Accordingly, the aims of this study were to advocate a conceptual C health threshold model devised for terrestrial ecosystems while proposing a method by which to qualify the C health threshold of ecosystems. Since coupling relationships between C, nitrogen (N), and water can shape the response of ecosystems to conditions of global climate change, this study concentrated on C sequestration, N input, and water erosion impacts on ecosystem health. If C storage exceeds the terrestrial ecosystem C health threshold, ecological degradation will either take place or ecosystems will fall into a sub-health state in accordance with the C health threshold model. Additionally, C sequestration engineering approaches, excess N inputs, and water erosion destroy the balance of C cycling processes and may consequently have an effect on the C health threshold. Therefore, analysis related to the interannual variability of C cycles and their potential future behavior must take into account mechanisms driven through the coupling of water, C, and N cycles. Defining ecosystem health will help familiarize and eventually lead to proficiency in understanding C health threshold awareness. This will aid in determining the appropriate ecological restoration measures to take when dealing with climate change impacts, leading to the preservation of biogeochemical C cycling native to terrestrial ecosystems. (C) 2013 Elsevier B. V. All rights reserved.

DOI

27
Gao Y, Zhu X J, Yu G Ret al., 2014. Water use efficiency threshold for terrestrial ecosystem carbon sequestration in China under afforestation.Agricultural and Forest Meteorology, 195/196: 32-37.Forests play a vital role in global carbon (C) cycling. Accordingly, afforestation engineering programs that promote increased terrestrial C stocks are an important means to help gradually decrease atmospheric CO 2 emissions. China, however, had increased its afforested area bordering hydroclimatic zones to 275.7102million02hm 2 between 1949 and 2010. Ecosystem water use efficiency (EWUE) and plant water use efficiency (PWUE) provide data on ecosystem sensitivity to water availability across rainfall regimes. The water consumption cost of C sequestration (WCCC) is also an important parameter that gauges the cost of C sequestration under afforestation. However, abrupt changes in EWUE and PWUE (threshold values of 1.5 and 3.602gC02kg 611 H 2 O, respectively) have been measured within the 400–50002mm precipitation climatic isoline boundary situated between semi-humid and arid zones. The threshold value of the corresponding WCCC was 1.002kg02H 2 O02gC 611 . Forest ecosystems in China typically generate high EWUE and PWUE values (2.8002±020.77 and 4.2502±021.0202gC02kg 611 02H 2 O, respectively) but low WCCC values (0.5202±020.4202kg02H 2 O02g 611 02C), providing proof that afforestation is the best choice in increasing terrestrial C stocks. However, China's major afforestation engineering programs have concentrated efforts toward low EWUE and PWUE and high WCCC in the western region of the 400–50002mm precipitation isoline boundary, belonging to the arid and semiarid zones, which introduced potential environmental risks. Therefore, policies related to large-scale C sequestration initiatives under afforestation must first fully consider the statuses of WCCC and WUE.

DOI

28
Geng S, 2011. Study on the carbon flux observation over poplar plantation ecosystem of Xiping city in Henan Province of China [D]. Beijing: Beijing Forestry University. (in Chinese)

29
Gu F X, Tao B, Wen X Fet al., 2010. Modeling long-term changes in carbon fluxes and storage in a subtropical coniferous plantation based on CEVSA2 model.Acta Ecologica Sinica, 30(23): 6598-6605. (in Chinese)With the increase of tree plantation areas,how to evaluate accurately their carbon storage and sequestration is significant for estimating global or regional carbon balance.Process-based ecosystem models provide a realistic approach to analyze and predict the dynamic of C storage and fluxes after afforestation.CEVSA2 is a new version of CEVSA with improvements on some key processes of carbon and water cycles.CEVSA2 model was validated and calibrated by eddy flux data in 2003 and 2004 at Qianyanzhou station.The study site is one of the'ChinaFlux network'and located in South China subtropical monsoon climatic zone.After the native vegetation,subtropical evergreen broad-leaved forest,was degraded after a long disturbance,the vegetation was dominated by grass and shrub after 1950s,and then the coniferous plantation has been established since 1983.Based on CEVSA2,we simulated simulated the change of carbon fluxes and storage in grass from 1951 to 1982,and then forest from 1983 to 2004.Based on the CEVSA2 model simulations,we analyzed the change of carbon fluxes and storage of coniferous plantation after afforestation in 1983.The results showed that vegetation C increased at a rate of 22% after afforestation.The soil C decreased in the first 7 to 8 year after planting,and then increased gradually.Soil carbon was equal to the initial value 15 year later.Ecosystem total carbon storage also decreased in the early period after afforestation,and then increased with the growth.Total carbon storage shifted from decreasing to increasing trend in the 4th year after planting,and exceeded the initial value in the 6th year after planting.Gross and net primary productivity increased with the growth.Total ecosystem respiration decreased firstly and then increased.Autotrophic respiration ratio of total respiration increased with growth,and heterotrophic respiration ratio was decreased inversely.All these results showed that the total carbon storage decreased,and ecosystem released carbon to atmosphere during the early period of afforestation.With the growth of forest,ecosystem became a carbon sink,and vegetation,soil and total carbon storage increased obviously.

DOI

30
Gu F X, Zhang Y, Huang Met al., 2015. Nitrogen deposition and its effect on carbon storage in Chinese forests during 1981-2010.Atmospheric Environment, 123: 171-179.Human activities have resulted in dramatically increased nitrogen (N) deposition worldwide, which is closely linked to the carbon (C)-cycle processes and is considered to facilitate terrestrial C sinks. In this study, we firstly estimated the spatial and temporal variations of N deposition during 1981-2010 based on a new algorithm; then we used a newly improved process-based ecosystem model, CEVSA2, to examine the effects of N deposition on C storage in Chinese forests. The results show that the rate of N deposition increased by 0.058 g N myrbetween 1981 and 2010. The N deposition rate in 2010 was 2.32 g N myr, representing a large spatial variation from 0 to 0.25 g N myron the northwestern Qinghai-Tibet Plateau to over 4.5 g N myrin the southeastern China. The model simulations suggest that N deposition induced a 4.78% increase in the total C storage in Chinese forests, most of which accumulated in vegetation. C storage increased together with the increase in N deposition, in both space and time. However, N use efficiency was highest when N deposition was 0.4-1.0 g N myr. We suggest conducting more manipulation experiments and observations in different vegetation types, which will be greatly helpful to incorporate additional processes and mechanisms into the ecosystem modeling. Further development of ecosystem models and identification of C-N interactions will be important for determining the effects of N input on C cycles on both regional and global scales.

DOI

31
Guan D X, Wu J B, Zhao X Set al., 2006. CO2 flux over an old, temperate mixed forest in Northeastern China.Agricultural and Forest Meteorology, 137: 138-149.

32
Guo H Q, 2010. Carbon fluxes over an estuarine wetland: In situ measurement and modeling [D]. Shanghai: Fudan University. (in Chinese)

33
Han S, 2008. Productivity estimation of the poplar plantations on the beaches in middle and low reaches of Yangtze River using eddy covariance measurement [D]. Beijing: Chinese Academy of Forestry. (in Chinese)

34
Hao Y B, Kang X M, Wu Xet al., 2013. Is frequency or amount of precipitation more important in controlling CO2 fluxes in the 30-year-old fenced and the moderately grazed temperate steppe? Agriculture, Ecosystems and Environment, 171(1): 63-71.

35
Hao Y B, Niu H S, Wang Y Fet al., 2011. Rainfall variability in ecosystem CO2 fluxes studies.Climate Research, 46: 77-83.The structure and function of ecosystems are strongly affected by rainfall variability in grasslands worldwide. We used a diversity index (Shannon index [I]) and 3 non-diversity indices (coefficient of variation [CV], standard deviation [SD], and dry days [U-d]) to analyze rainfall variability and the relationship of rainfall variability with 1982-2008 above-ground net primary productivity (ANPP) and 2003-2008 growing season (May-September) net ecosystem CO2 exchange (NEE). A series of bivariate regressions were performed with precipitation (P) and 1 measure of its temporal variability (CV, I, SD, or U-d) as an independent variable. The regression models were evaluated with regard to their ability to predict ANPP. Only the model with P and I as the predictors was statistically significant at p < 0.01, and had the highest coefficient of determination (R-2 = 0.50). ANPP increased with increasing I (r = 0.45, p = 0.05), but no consistent relationship with the total amount of annual rainfall was observed (r = -0.17, p = 0.46). Using all data from a 6 yr study period, the Shannon index explained 50% of the change in NEE. In general, the Shannon index had the best spread and sensitivity under different rainfall regimes and was the most appropriate index for carbon flux studies.

DOI

36
Hao Y B, Wang Y F, Cui X Y, 2010a. Drought stress reduces the carbon accumulation of the Leymus chinensis steppe in Inner Mongolia, China. Journal of Plant Ecology, 34: 898-906. (in Chinese)Aims Droughts are common in arid and semiarid regions and affect the capacity of carbon sequestration of grassland ecosystems by influencing the process of ecosystem carbon cycling. We analyzed the continuous measurements of ecosystem CO2 fluxes during three growing seasons (May-September) over a Leymus chinensis steppe in Inner Mongolia in order to examine the effect of drought stress on carbon accumulation of this grassland ecosystem. Methods We used the eddy covariance technique to measure CO2 fluxes during the 2004–2006 growing seasons. Only 126 and 215 mm precipitation fell during the 2005 and 2006 growing seasons,respectively,far less than normal (in 2004,364 mm); therefore,the steppe was in an extreme drought condition. Important findings Maxima for gross primary productivity (GPP) and ecosystem respiration (Re) were 4.89 and 1.99 g C.m–2.d–1,respectively,in the 2004 growing season (normal year). However,in drought years,GPP and Re were 1.53–3.01 and 1.38–1.77 g C.m–2.d–1,respectively. GPP and Re in the drought years decreased by 68% and 11%,respectively,compared with the normal year. Accumulated GPP and Re were 294 and 180 g C.m–2,respectively,during the growing season in 2004 and 102–123 and 132–158 g C.m–2,respectively,in drought years. Accumulated GPP and Re decreased 58%–65% and 12%–27%,respectively,in drought years compared with those of the normal year. The slope of the curve in the sensitivity for Re to Ts (Vant'Hoff type) reached its maximum at θ = 0.16–0.17 m3.m–3; below or above this value of θ,the sensitivity of Re to Ts decreases. GPP and Re decline under drought stress conditions,with GPP having a larger decline. Long-term and continuous drought reduced C-accumulation and resulted in the steppe ecosystem switching from a carbon sink in typical years to a carbon source in drought years.

37
Hao Y B, Wang Y F, Mei X Ret al., 2010b. The response of ecosystem CO2 exchange to small precipitation pulses over a temperate steppe.Plant Ecology, 209(2): 335-347.In water-limited grassland ecosystems, discrete and occasional precipitation events trigger brief but important episodes of biological activity. Differential responses of above- and below-ground biota to precipitation pulses may constrain biogeochemical transformations at the ecosystem scale. We examined the short-term dynamics of the whole ecosystem response to small precipitation events during 2003 and 2004 in a steppe on the Inner Mongolia Plateau. The results indicate that changes in soil moisture occur, with a 1&#8211;2&nbsp;day time lag, only when the amount of precipitation exceeds 3&nbsp;mm (from day of year [DOY] 120 to DOY 180) or 5&nbsp;mm (after DOY 180). The interception of the developing plant canopy is a primary reason for the different temporal precipitation threshold. The lower threshold of effective rain is different between Net Ecosystem Exchange (NEE, 3&nbsp;mm), Ecosystem Respiration (<i>R</i> <sub>e</sub> 3&nbsp;mm) and Gross Ecosystem Production (GEP, 5&nbsp;mm). The NEE reached a maximum 4&#8211;5&nbsp;days after the end of effective rain events and dropped to 60&#8211;70% of the original fluxes after 10&nbsp;days. However, the drop in GEP was greater than that of NEE and reached 30&#8211;50% of the original fluxes after 10&#8211;15&nbsp;days without &#8220;effective rainfall.&#8221; The characteristics of the response time can be attributed to the variation in soil water content and the time of readjusting for the ecological processes after the effective rainfall. In addition, the independent responses of photosynthesis, respiration and evapotranspiration to precipitation probably contributed to this time lag. The results support the hypothesis that the concept of an ecologically significant rainfall event can be developed for an ecosystem.

DOI

38
He H L, Liu M, Sun X Met al., 2010. Uncertainty analysis of eddy flux measurements in typical ecosystems of ChinaFLUX.Ecological Informatics, 5(6): 492-502.<h2 class="secHeading" id="section_abstract">Abstract</h2><p id="sp0080">Fluxes of CO<sub>2</sub> (FCO<sub>2</sub>) and energy (latent heat, LE; sensible heat, H) exchange between ecosystems and atmosphere, as measured by the eddy covariance technique, represent a fundamental data source for global-change research. However, little is known about the uncertainties of flux measurements at an ecosystem level in China. Here, we use data from six eddy covariance tower sites in ChinaFLUX, including two forested sites, three grassland sites, and one agricultural site, to conduct a cross-site analysis of random flux errors (RFEs) of FCO<sub>2</sub> LE, and H. By using the daily-differencing approach, paired observations are obtained to characterize the random error in these measurements. Our results show that: (1) The RFEs of FCO<sub>2</sub> LE, and H in different ecosystems of ChinaFLUX closely follow a double-exponential (Laplace) distribution, presumably due to a superposition of Gaussian distribution for high flux magnitude. (2) The RFEs of FCO<sub>2</sub> LE, and H are not homogeneous and appear to be a linear function of flux magnitude. (3) Except for H, the RFEs of FCO<sub>2</sub> and LE exhibit a distinct seasonal pattern. For FCO<sub>2</sub> the dependence of RFEs on wind speed varies somewhat according to vegetation type, whereas for LE and H, there is no such dependence. The effect of temperature on RFEs is not statistically significant (<em>P</em>&#xA0;&lt;&#xA0;0.05). Both the distribution and the relationship of RFEs with flux magnitude in ChinaFLUX are essentially in accord with those in AmeriFlux and CarboEurope.</p>

DOI

39
He H L, Liu M, Xiao X Met al., 2014. Large-scale estimation and uncertainty analysis of gross primary production in Tibetan alpine grasslands.Journal of Geophysical Research, 119(3): 466-486.An abstract is unavailable.

DOI

40
Hu Z M, Li S G, Yu G R, 2013. Modeling evapotranspiration by combining a two-source model, a leaf stomatal model, and a light-use efficiency model.Journal of Hydrology, 501: 186-192.

41
Hu Z M, Wen X F, Sun X Met al., 2014. Partitioning of evapotranspiration through oxygen isotopic measurements of water pools and fluxes in a temperate grassland. Journal of Geophysical Research: Biogeosciences, 119: 2013JG002367.Abstract Stable isotopic measurements of water provide a promising tool for partitioning of ecosystem evapotranspiration (ET). This approach, however, is still facing some challenges due to the uncertainties in estimating the isotopic compositions of ET and its components. In this study, a tunable diode laser analyzer was deployed for in situ measurements of the oxygen isotopic compositions of water vapor. Using these measurements together with samples of water in plant and soil pools, we partitioned ET via estimating the oxygen isotopic compositions of ET ( δ ET ) and that of its two components, i.e., plant transpiration ( δ T ) and soil water evaporation ( δ E ). A new δ T model was developed in this study, which illustrated consistent estimations with the traditional model. Most of the variables and parameters in the new model can be measured directly with high accuracy, making its potential to be used at other sites high. Our results indicate that the ratio of plant transpiration to evapotranspiration (T/ET) illustrates a “U” shape diurnal pattern. Mean T/ET at 0630–1830 during the sampling days was 83%. Soil depth of 15 cm is a reasonable depth for soil water sampling for estimating δ E at this site. We also investigated the uncertainties in estimating these three terms and their effects on partitioning. Overall, in terms of partitioning, the uncertainties are relatively small from δ T and δ E but quite large from δ ET . Quantifying and improving the precision of δ ET should be a priority in future endeavors of ET partitioning via the stable isotopic approach.

DOI

42
Hu Z M, Yu G R, Fu Y Let al., 2008. Effects of vegetation control on ecosystem water use efficiency within and among four grassland ecosystems in China.Global Change Biology, 14(7): 1609-1619.Abstract Through 2-3-year (2003-2005) continuous eddy covariance measurements of carbon dioxide and water vapor fluxes, we examined the seasonal, inter-annual, and inter-ecosystem variations in the ecosystem-level water use efficiency (WUE, defined as the ratio of gross primary production, GPP, to evapotranspiration, ET) at four Chinese grassland ecosystems in the Qinghai-Tibet Plateau and North China. Representing the most prevalent grassland types in China, the four ecosystems are an alpine swamp meadow ecosystem, an alpine shrub-meadow ecosystem, an alpine meadow-steppe ecosystem, and a temperate steppe ecosystem, which illustrate a water availability gradient and thus provide us an opportunity to quantify environmental and biological controls on ecosystem WUE at different spatiotemporal scales. Seasonally, WUE tracked closely with GPP at the four ecosystems, being low at the beginning and the end of the growing seasons and high during the active periods of plant growth. Such consistent correspondence between WUE and GPP suggested that photosynthetic processes were the dominant regulator of the seasonal variations in WUE. Further investigation indicated that the regulations were mainly due to the effect of leaf area index (LAI) on carbon assimilation and on the ratio of transpiration to ET ( T /ET). Besides, except for the swamp meadow, LAI also controlled the year-to-year and site-to-site variations in WUE in the same way, resulting in the years or sites with high productivity being accompanied by high WUE. The general good correlation between LAI and ecosystem WUE indicates that it may be possible to predict grassland ecosystem WUE simply with LAI. Our results also imply that climate change-induced shifts in vegetation structure, and consequently LAI may have a significant impact on the relationship between ecosystem carbon and water cycles in grasslands.

DOI

43
Hu Z M, Yu G R, Zhou Y Let al., 2009. Partitioning of evapotranspiration and its controls in four grassland ecosystems: Application of a two-source model.Agricultural and Forest Meteorology, 149: 1410-1420.Quantifying the partitioning of evapotranspiration (ET) and its controls are particularly important for accurate prediction of the climatic response of ecosystem carbon, water, and energy budgets. In this study, we employed the Shuttleworth-Wallace model to partition ET into soil water evaporation (E) and vegetation transpiration (T) at four grassland ecosystems in China. Two to three years (20...

DOI

44
Huang H, Zhang J S, Meng Pet al., 2011. Seasonal variation and meteorological control of CO2 flux in a hilly plantation in the mountain areas of North China.Acta Meteorologica Sinica, 25(2): 238-248. (in Chinese)The carbon cycle of terrestrial ecosystems is an important scientific issue in global climate change research. Plantation forest plays an important role in terrestrial carbon budget in China. In this study, eddy covariance flux data measured at Xiaolangdi forest ecosystem research station (XLD) in 2007 and 2008 are used to analyze the seasonal variation and meteorological control of CO2 flux in a 30-yr-old mixed plantation. The plantation forest mainly consists of Quercus variabilis, Platycladus orientalis, and Robinia pseudoacacia. The results show that the seasonal variations of net ecosystem exchange of CO2 (NEE), gross primary production (GPP), and ecosystem respiration (R (e)) display single-peak curves. The maximum of carbon sequestration appears during May and June each year. The relative contribution of carbon release from ecosystem respiration to GPP varied slightly between 2007 and 2008. The relationship between NEE and photosynthetic active radiation (Q (p)) accords with the rectangular hyperbola model on diurnal scale, and shows a good linear correlation on monthly scale. The ecosystem photosynthetic parameters: the maximum photosynthetic rate (P (max)), the ecosystem photosynthetic photonyield (alpha), and the daytime ecosystem respiration (R (d)) exhibit seasonal variations. P (max) reaches the maximum in August each year, with small interannual difference. The interannual differences of alpha and R (d) are obvious, which is attributed to the changes of meteorological factors, such as solar radiation, vapor pressure deficit (D), precipitation, etc. Parameters R (e), GPP, and NEP (net ecosystem production) have obvious exponential relations with temperature on monthly scale. There is a hysteresis in the response of GPP and NEP to temperature, i.e., the carbon sequestration is not the maximum when the temperature reaches the peak value. The Q (10) values were 1.37 and 1.45 in 2007 and 2008, respectively. On monthly scale, R (e), GPP, and NEE increase as D increases, but rise slowly and even decrease when D is higher than 1.5 kPa.

DOI

45
Huang L J, Wen X F, 2014. Temporal variations of atmospheric water vapor delta D and delta O-18 above an arid artificial oasis cropland in the Heihe River Basin.Journal of Geophysical Research-Atmospheres, 119: 11456-11476.

46
Huang M, Ji J J, Deng Fet al., 2014. Impacts of extreme precipitation on tree plantation carbon cycle.Theoretical and Applied Climatology, 115(3/4): 655-665.Extreme precipitation events are expected to increase in frequency and magnitude in future due to global warming, but relevant impacts on tree plantation ecosystem carbon cycle are unknown. In this study, we use an atmosphere–vegetation interaction model (AVIM2) to estimate the likely impacts of extreme precipitation events on carbon fluxes and carbon stocks of a tree plantation in south China. Our results indicate that shifting from moderate precipitation events to extreme precipitation events whilst keeping monthly precipitation unchanged could decrease the tree plantation carbon accumulation. Tree plantation net primary productivity, net ecosystem productivity, soil carbon stock and vegetation carbon stock could decrease by 4.2, 28, 4.3 and 1.402% during the studying period of 1962–2004, respectively. Though reductions in net primary productivity and net ecosystem productivity are relatively smaller than their annual variations, our sensitivity test shows that the tree plantation carbon stock could decrease by 3.302% if the assumed extreme precipitation regime lasts for 50002years. Observed and simulated gross primary productivity, ecosystem respiration and net ecosystem productivity have significant positive correlation with soil water content (SWC), especially the deep SWC. The mechanism for the extreme precipitation effect is that the increase in extreme precipitation events will cause SWC to decrease, consequently, reducing carbon fluxes and stocks.

DOI

47
Ji J J, Huang M, Li K R, 2008. Prediction of carbon exchanges between China terrestrial ecosystem and atmosphere in 21st century.Science in China Series D, 51(6): 885-898.The projected changes in carbon exchange between China terrestrial ecosystem and the atmosphere and vegetation and soil carbon storage during the 21st century were investigated using an atmosphere-vegetation interaction model (AVIM2). The results show that in the coming 100 a, for SRES B2 scenario and constant atmospheric CO(2) concentration, the net primary productivity (NPP) of terrestrial ecosystem in China will be decreased slowly, and vegetation and soil carbon storage as well as net ecosystem productivity (NEP) will also be decreased. The carbon sink for China terrestrial ecosystem in the beginning of the 20th century will become totally a carbon source by the year of 2020, while for B2 scenario and changing atmospheric CO(2) concentration, NPP for China will increase continuously from 2.94 GtC center dot a(-1) by the end of the 20th century to 3.99 GtC center dot a(-1) by the end of the 21st century, and vegetation and soil carbon storage will increase to 110.3 GtC. NEP in China will keep rising during the first and middle periods of the 21st century, and reach the peak around 2050s, then will decrease gradually and approach to zero by the end of the 21st century.

DOI

48
Jia B R, Zhou G S, Jiang Y Let al., 2013. Temporal-spatial characteristics of soil respiration in Chinese boreal forest ecosystem. Acta Ecologica Sinica, 33(23): 7516-7524. (in Chinese)利用Li-6400便携式CO2分析系统对寒温针叶林土壤呼吸作用观测数据分析表明,土壤呼吸作用日、季动态均呈单峰型变化,日最大值出现在16:00左右,与5 cm土壤温度日动态相似,滞后于气温日动态变化;月最大值出现在8月份,2006年和2007年分别为8.19 和6.89 μmol CO2 m-2 s-1。日、季土壤呼吸作用与土壤温度的相关性均好于气温。土壤呼吸作用存在较大的空间变异性,一天内3:00 am、7:00 am和11:00 am的土壤呼吸作用变异系数分别为35.5%、27.6%和23.0%,根系和凋落物与土壤呼吸作用表现出相似的空间变异性,其中细根与土壤呼吸作用的相关性最好。

DOI

49
Jia Y L, Yu G R, Gao Y Net al., 2016. Global inorganic nitrogen dry deposition inferred from ground- and space-based measurements.Scientific Reports, 6: 19810.Atmospheric nitrogen (N) dry deposition is an important component in total N deposition. However, uncertainty exists in the assessment of global dry deposition. Here, we develop empirical models for estimating ground N concentrations using NOsatellite measurements from the Ozone Monitoring Instrument (OMI) and ground measurements from 555 monitoring sites. Global patterns and trends in the fluxes of NO, HNO, NH, and NOwere assessed for 2005-2014. Moreover, we estimated global NHdry deposition directly using data from 267 monitoring sites. Our results showed that East Asia, the United States, and Europe were important regions of N deposition, and the total annual amount of global inorganic N deposition was 34.26 Tg N. The dry deposition fluxes were low in Africa and South America, but because of their large area, the total amounts in these regions were comparable to those in Europe and North America. In the past decade, the western United States and Eurasia, particularly eastern China, experienced the largest increases in dry deposition, whereas the eastern United States, Western Europe, and Japan experienced clear decreases through control of NOand NHemissions. These findings provide a scientific background for policy-makers and future research into global changes.

DOI

50
Jia Y L, Yu G R, He N Pet al., 2014. Spatial and decadal variations in inorganic nitrogen wet deposition in China induced by human activity.Scientific Reports, 4: 3763.Atmospheric nitrogen (N) deposition, an important component in the global N cycle, has increased sharply in recent decades in China. Here, we constructed national-scale inorganic N wet deposition (N-dep) patterns in China based on data from 280 observational sites and analysed the effects of anthropogenic sources and precipitation on N-dep. Our results showed that the mean N-dep over China increased approximately 25%, from 11.11 kg ha(-1) a(-1) in the 1990s to 13.87 in the 2000s. N-dep was highest over southern China and exhibited a decreasing gradient from southern to western and northern China. The decadal difference in N-dep between the 1990s and 2000s was primarily caused by increases in energy consumption and N fertiliser use. Our findings conformed that anthropogenic activities were the main reason for the N-dep increase and provide a scientific background for studies on ecological effects of N deposition in China.

DOI PMID

51
Jiang C M, Yu G R, Fang H Jet al., 2010. Short-term effect of increasing nitrogen deposition on CO2, CH4 and N2O fluxes in an alpine meadow on the Qinghai-Tibetan Plateau, China.Atmospheric Environment, 44: 2920-2926.

52
Ju W M, Wang S Q, Yu G Ret al., 2010. Modeling the impact of drought on canopy carbon and water fluxes for a subtropical evergreen coniferous plantation in southern China through parameter optimization using an ensemble Kalman filter.Biogeosciences, 7: 845-857.

53
Kato T, Tang Y H, Gu Set al., 2006. Temperature and biomass influences on interannual changes in CO2 exchange in an alpine meadow on the Qinghai-Tibetan Plateau.Global Change Biology, 12: 1285-1298.Abstract Three years of eddy covariance measurements were used to characterize the seasonal and interannual variability of the COfluxes above an alpine meadow (325065m65a.s.l.) on the Qinghai-Tibetan Plateau, China. This alpine meadow was a weak sink for atmospheric CO, with a net ecosystem production (NEP) of 78.5, 91.7, and 192.565g65C65m65yrin 2002, 2003, and 2004, respectively. The prominent, high NEP in 2004 resulted from the combination of high gross primary production (GPP) and low ecosystem respiration () during the growing season. The period of net absorption of COin 2004, 179 days, was 10 days longer than that in 2002 and 5 days longer than that in 2003. Moreover, the date on which the mean air temperature first exceeded 5.0°C was 10 days earlier in 2004 (DOY110) than in 2002 or 2003. This date agrees well with that on which the green aboveground biomass (Green AGB) started to increase. The relationship between light-use efficiency and Green AGB was similar among the three years. In 2002, however, earlier senescence possibly caused low autumn GPP, and thus the annual NEP, to be lower. The low summertime in 2004 was apparently caused by lower soil temperatures and the relatively lower temperature dependence of in comparison with the other years. These results suggest that (1) the Qinghai-Tibetan Plateau plays a potentially significant role in global carbon sequestration, because alpine meadow covers about one-third of this vast plateau, and (2) the annual NEP in the alpine meadow was comprehensively controlled by the temperature environment, including its effect on biomass growth.

DOI

54
Le Quéré C, Andres R J, Boden Tet al., 2013. The global carbon budget 1959-2011.Earth System Science Data, 5: 165-185.

55
Lei H M, Yang D W, 2010a. Seasonal and interannual variations in carbon dioxide exchange over a cropland in the North China Plain.Global Change Biology, 16(11): 2944-2957.Abstract In China, croplands account for a relatively large form of vegetation cover. Quantifying carbon dioxide exchange and understanding the environmental controls on carbon fluxes over croplands are critical in understanding regional carbon budgets and ecosystem behaviors. In this study, the net ecosystem exchange (NEE) at a winter wheat/summer maize rotation cropping site, representative of the main cropping system in the North China Plain, was continuously measured using the eddy covariance technique from 2005 to 2009. In order to interpret the abiotic factors regulating NEE, NEE was partitioned into gross primary production (GPP) and ecosystem respiration (). Daytime was extrapolated from the relationship between nighttime NEE and soil temperature under high turbulent conditions. GPP was then estimated by subtracting daytime NEE from the daytime estimates of . Results show that the seasonal patterns of the temperature responses of and light-response parameters are closely related to the crop phenology. Daily was highly dependent on both daily GPP and air temperature. Interannual variability showed that GPP and were mainly controlled by temperature. Water availability also exerted a limit on . The annual NEE was 61585 and 6153365g65C65mfor two seasons of 2006–2007 and 2007–2008, respectively, and the wheat field absorbed more carbon than the maize field. Thus, we concluded that this cropland was a strong carbon sink. However, when the grain harvest was taken into account, the wheat field was diminished into a weak carbon sink, whereas the maize field was converted into a weak carbon source. The observations showed that severe drought occurring during winter did not reduce wheat yield (or integrated NEE) when sufficient irrigation was carried out during spring.

DOI

56
Lei H M, Yang D W, 2010b. Interannual and seasonal variability in evapotranspiration and energy partitioning over an irrigated cropland in the North China Plain.Agricultural and Forest Meteorology, 150(4): 581-589.

57
Lei H, Yang D, 2010. Seasonal and interannual variations in carbon dioxide exchange over a cropland in the North China Plain.Global Change Biology, 16: 2944-2957.Abstract In China, croplands account for a relatively large form of vegetation cover. Quantifying carbon dioxide exchange and understanding the environmental controls on carbon fluxes over croplands are critical in understanding regional carbon budgets and ecosystem behaviors. In this study, the net ecosystem exchange (NEE) at a winter wheat/summer maize rotation cropping site, representative of the main cropping system in the North China Plain, was continuously measured using the eddy covariance technique from 2005 to 2009. In order to interpret the abiotic factors regulating NEE, NEE was partitioned into gross primary production (GPP) and ecosystem respiration (). Daytime was extrapolated from the relationship between nighttime NEE and soil temperature under high turbulent conditions. GPP was then estimated by subtracting daytime NEE from the daytime estimates of . Results show that the seasonal patterns of the temperature responses of and light-response parameters are closely related to the crop phenology. Daily was highly dependent on both daily GPP and air temperature. Interannual variability showed that GPP and were mainly controlled by temperature. Water availability also exerted a limit on . The annual NEE was 61585 and 6153365g65C65mfor two seasons of 2006–2007 and 2007–2008, respectively, and the wheat field absorbed more carbon than the maize field. Thus, we concluded that this cropland was a strong carbon sink. However, when the grain harvest was taken into account, the wheat field was diminished into a weak carbon sink, whereas the maize field was converted into a weak carbon source. The observations showed that severe drought occurring during winter did not reduce wheat yield (or integrated NEE) when sufficient irrigation was carried out during spring.

DOI

58
Leuning R, Yu G R, 2006. Carbon exchange research in ChinaFLUX.Agricultural and Forest Meteorology, 137: 123-124.中国科学院机构知识库(中国科学院机构知识库网格(CAS IR GRID))以发展机构知识能力和知识管理能力为目标,快速实现对本机构知识资产的收集、长期保存、合理传播利用,积极建设对知识内容进行捕获、转化、传播、利用和审计的能力,逐步建设包括知识内容分析、关系分析和能力审计在内的知识服务能力,开展综合知识管理。

DOI

59
Li X, Liang S, Yuan Wet al., 2014. Estimation of evapotranspiration over the terrestrial ecosystems in China.Ecohydrology, 7: 139-149.lt;p>Quantifying regional evapotranspiration (ET) and environmental constraints are particularly important for understanding water and carbon cycles of terrestrial ecosystems. However, a large uncertainty in the regional estimation of ET still remains for the terrestrial ecosystems in China. This study used ET measurements of 34 eddy covariance sites within China and adjacent regions to examine the performance of the revised Remote Sensing-Penman Monteith (RS-PM) model over various ecosystem types including forests, grasslands, wetlands and croplands. No significant systematic error was found in the revised RS-PM model predictions, which explained 61% of the ET variations at all of the validation sites. Regional patterns of ET at a spatial resolution of 10&thinsp;&times;&thinsp;10&thinsp;km were quantified using a meteorology dataset from 753 meteorological stations, Modern Era Retrospective-analysis for Research and Applications (MERRA) reanalysis products and satellite data such as the Advanced Very High Resolution Radiometer (AVHRR) leaf area index. ET decreased from the southeast of China toward the northwest. Relatively high ET values were found in the southern China such as Yunnan, Hainan, Fujian and Guangdong Provinces, whereas low ET values occurred in northwestern China such as in the Xinjiang autonomous region. On average, the annual ET presented an increasing trend during the 1982&ndash;2009, with relatively low ET in 1985, 1993, 1997, 2000 and 2009. We found that the mean annual ET was higher than world average, ranging spatially between 484 and 521&thinsp;mm&thinsp;yr<sup>&minus;1</sup> with a mean value of 500&thinsp;mm&thinsp;yr<sup>&minus;1</sup> which accounted for approximately 5&middot;6&ndash;8&middot;3% of the world's total land-surface ET. Copyright &copy; 2012 John Wiley &amp; Sons, Ltd.</p>

DOI

60
Li X, Sun R, Li Yet al., 2010. Carbon dioxide fluxes on green space in Haidian park, Beijing.Acta Ecologica Sinica, 30: 6715-6725. (in Chinese)As an important component of urban ecosystem,urban green space has many eco-functions such as releasing oxygen,sequestrating carbon,lowering temperature,increasing humidity,absorbing toxic gases,reducing the noise and so on.To evaluate the effect of urban green space on urban ecosystem,the CO2 flux and meteorological variables including air temperature and incident solar radiation were observed from May,2006 to March,2007 in Haidian Park,Beijing.The CO2 flux tower is located in the central of the park,and the vegetation in Haidian Park is mainly woodland.Abnormal data omission and data gap-filling based on the data quality assessment,and the seasonal and diurnal variability of CO2 fluxes were analyzed in this paper.Because the factors impacting CO2 fluxes are different,the CO2 flux data for the daytime and nighttime were processed separately.The data quality assessments for the nighttime measurements include elimination of rain-day data,data below zero,abnormal data determined by the threshold method,and data observed under low turbulence intensities using a threshold value of friction velocity determined by an average values test method.The gap-filling of the nighttime data were carried out by establishing the relationship between valid CO2 flux and air temperature.The invalid daytime CO2 flux data were filtered according to the precipitation observation data and CO2 flux threshold value.The gap-filling was conducted by the look-up table method using measurements of CO2 flux,air temperature,and incident solar radiation.An empirical relationship of daily CO2 flux versus daily averaged air temperature and daily incident solar radiation was established,and then applied to missing or invalid CO2 flux observations to produce daily CO2 flux data for the whole year.The results show that CO2 fluxes in Haidian Park vary with season,with a net absorption of atmosphere CO2 from March to October,while a net emission from November to February.The daily CO2 flux ranges from-15.0 gCO2/m2d to 10.0 gCO2/m2d,and the annual total CO2 flux is-8.7554 tCO2/hm2a,corresponding to an annual absorption of 8.7554 t/hm2 carbon dioxide in the study area.The diurnal change of the CO2 flux ranges from-1 mg/m2s to 1 mg/m2s,with negative values in the daytime and positive during the nighttime.The CO2 flux is lowest during the mid-day and highest at about 8 pm.The impact factors and the spatial representativeness of observed CO2 flux data were also analyzed.The results show CO2 fluxes decrease as increasing air temperature and incident solar radiation.The main source contribution area for the CO2 flux is located in the northeast and southwest direction of the CO2 flux tower.The woodland and grassland in the northeast area are the major source area in winter.However,the source is mainly from southwest and secondly from northeast in summer.

DOI

61
Li X Y, Cheng S L, Fang H Jet al., 2015. The contrasting effects of deposited NH4+ and NO3- on soil CO2, CH4 and N2O fluxes in a subtropical plantation, southern China.Ecological Engineering, 85: 317-327.

62
Li Y N, Sun X M, Zhao X Qet al., 2006. Seasonal variations and mechanism for environmental control of NEE of CO2 concerning the Potentilla Fruticosa in alpine shrub meadow of Qinghai-Tibet Plateau.Science in China Series D, 49(S2): 174-185.

63
Li Z, Zhang Y, Wang Set al., 2010. Evapotranspiration of a tropical rain forest in Xishuangbanna, Southwest China.Hydrological Processes, 24: 2405-2416.tropical rain forest; evapotranspiration; eddy covariance measurement; water balance

DOI

64
Li Z Q, Yu G R, Xiao X Met al., 2007. Modeling gross primary production of alpine ecosystems in the Tibetan Plateau using MODIS images and climate data.Remote Sensing of Environment, 107(3): 510-519.The eddy covariance technique provides measurements of net ecosystem exchange (NEE) Of CO2 between the atmosphere and terrestrial ecosystems, which is widely used to estimate ecosystem respiration and gross primary production (GPP) at a number Of CO2 eddy flux tower sites. In this paper, canopy-level maximum light use efficiency, a key parameter in the satellite-based Vegetation Photosynthesis Model (VPM), was estimated by using the observed CO2 flux data and photosynthetically active radiation (PAR) data from eddy flux tower sites in an alpine swamp ecosystem, an alpine shrub ecosystem and an alpine meadow ecosystem in Qinghai-Tibetan Plateau, China. The VPM model uses two improved vegetation indices (Enhanced Vegetation Index (EVI), Land Surface Water Index (LSWI)) derived from the Moderate Resolution Imaging Spectral radiometer (MODIS) data and climate data at the flux tower sites, and estimated the seasonal dynamics of GPP of the three alpine grassland ecosystems in Qinghai-Tibetan Plateau. The seasonal dynamics of GPP predicted by the VPM model agreed well with estimated GPP from eddy flux towers. These results demonstrated the potential of the satellite-driven VPM model for scaling-up GPP of alpine grassland ecosystems, a key component for the study of the carbon cycle at regional and global scales. (c) 2006 Elsevier Inc. All rights reserved.

DOI

65
Liu L L, Greaver T L, 2010. A global perspective on belowground carbon dynamics under nitrogen enrichment.Ecological Letters, 13(7): 819-828.Ecology Letters (2010) 13: 819–828 Abstract Nitrogen (N) effects on ecosystem carbon (C) budgets are critical to understand as C sequestration is considered as a mechanism to offset anthropogenic CO 2 emissions. Interactions between aboveground C and N cycling are more clearly characterized than belowground processes. Through synthesizing data from multiple terrestrial ecosystems, we quantified the responses of belowground C cycling under N addition. We found that N addition increased litter input from aboveground (+20%) but not from fine root. N addition inhibited microbial activity as indicated by a reduction in microbial respiration (618%) and microbial biomass carbon (6120%). Although soil respiration was not altered by N addition, dissolved organic carbon concentration was increased by 18%, suggesting C leaching loss may increase. N addition increased the C content of the organic layer (+17%) but not the mineral soil layer. Overall, our meta-analysis indicates that N addition will increase short term belowground C storage by increasing C content of organic layer. However, it is difficult to predict the response of long term C sequestration since there is no significant change in mineral soil C content.

DOI PMID

66
Liu M, He H L, Ren X Let al., 2015. The effects of constraining variables on parameter optimization in carbon and water flux modeling over different forest ecosystems.Ecological Modelling, 303: 30-41.

67
Liu M, He H L, Yu G Ret al., 2009. Uncertainty analysis of CO2 flux components in subtropical evergreen coniferous plantation.Science in China Series D, 52: 257-268.We present an uncertainty analysis of ecological process parameters and CO2 flux components (Reco, NEE and gross ecosystem exchange (GEE)) derived from 3 years’ continuous eddy covariance meas-urements of CO2 fluxes at subtropical evergreen coniferous plantation, Qianyanzhou of ChinaFlux. Daily-differencing approach was used to analyze the random error of CO2 fluxes measurements and bootstrapping method was used to quantify the uncertainties of three CO2 flux components. In addition, we evaluated different models and optimization methods in influencing estimation of key parameters and CO2 flux components. The results show that: (1) Random flux error more closely follows a dou-ble-exponential (Laplace), rather than a normal (Gaussian) distribution. (2) Different optimization meth-ods result in different estimates of model parameters. Uncertainties of parameters estimated by the maximum likelihood estimation (MLE) are lower than those derived from ordinary least square method (OLS). (3) The differences between simulated Reco, NEE and GEE derived from MLE and those derived from OLS are 12.18% (176 g C·m-2·a-1), 34.33% (79 g C·m-2·a-1) and 5.4% (92 g C·m-2·a-1). However, for a given parameter optimization method, a temperature-dependent model (T_model) and the models derived from a temperature and water-dependent model (TW_model) are 1.31% (17.8 g C·m-2·a-1), 2.1% (5.7 g C·m-2·a-1), and 0.26% (4.3 g C·m-2·a-1), respectively, which suggested that the optimization methods are more important than the ecological models in influencing uncertainty in estimated carbon fluxes. (4) The relative uncertainty of CO2 flux derived from OLS is higher than that from MLE, and the uncertainty is related to timescale, that is, the larger the timescale, the smaller the uncertainty. The relative uncertainties of Reco, NEE and GEE are 4%-8%, 7%-22% and 2%-4% respectively at annual timescale.

DOI

68
Liu M, He H L, Yu G Ret al., 2012. Uncertainty analysis in data processing on the estimation of net carbon exchanges at different forest ecosystems in China.Journal of Forest Research, 17(3): 312-322.Abstract<br/>Information about the uncertainties associated with eddy covariance observations of surface-atmosphere CO<sub class="a-plus-plus">2</sub> exchange is of importance for model-data fusion in carbon cycling studies and the accurate evaluation of ecosystem carbon budgeting. In this paper, a comprehensive analysis was conducted to investigate the influence of data processing procedures, focusing especially on the nocturnal data correction and three procedures in nonlinear regression method of gap filling [i.e., the selection of respiration model (REM), light-response model (LRM) and parameter optimization criteria (POC)], on the annual net ecosystem CO<sub class="a-plus-plus">2</sub> exchange estimation at three forest ecosystems in ChinaFLUX with three yearly datasets for each site. The results showed that uncertainties caused from four methodological uncertainties were between 61 and 108 g C m<sup class="a-plus-plus">−2</sup> year<sup class="a-plus-plus">−1</sup> with 61–93 g C m<sup class="a-plus-plus">−2</sup> year<sup class="a-plus-plus">−1</sup> (21–30%) in a temperate mixed forest, 80–107 g C m<sup class="a-plus-plus">−2</sup> year<sup class="a-plus-plus">−1</sup> (19–21%) in a subtropical evergreen coniferous plantation and 77–108 g C m<sup class="a-plus-plus">−2</sup> year<sup class="a-plus-plus">−1</sup> (16–19%) in a subtropical evergreen broad-leaved forest. Factorial analysis indicated that the largest uncertainty was associated with the choice of POC in the regression method across all sites in all years, while the influences of the choice of models (i.e., REM and LRM) varied with climate conditions at the measurement station. Furthermore, the uncertainty caused by data processing procedures was of approximately the same magnitude as the interannual variability in the three sites. This result stressed the importance to understand the uncertainty caused by data processing to avoid the introduction of artificial between-year and between-site variability that hampers comparative analysis.<br/>

DOI

69
Liu R, Li Y, Wang Q X, 2011b. Variations in water and CO2 fluxes over a saline desert in western China.Hydrological Processes, 26(4): 513-522.Abstract We studied the variations in water and carbon dioxide fluxes of a saline desert in western China using the eddy covariance technique. In addition, bare-soil evaporation was measured using the micro-lysimeter method. The following three inquiries were made: (1) the magnitude of evapotranspiration (ET) and net ecosystem carbon exchange (NEE) and how these components vary seasonally; (2) how NEE and ET vary following rain pulses of different magnitudes; and (3) how ET divides into evaporation and transpiration and its relationship to carbon dioxide exchange. The saline desert acted as a net C sink of 61 49 g C m 612 year 611 , with a gross ecosystem productivity (GEP) of 345 g C m 612 year 611 and an ecosystem respiration (R eco ) of 296 g C m 612 year 611 . Rainfall pulses exerted strong control over ecosystem-scale water and CO 2 fluxes. There was a 1 to 2 days lag in maximal ET despite the magnitude of rainfall pulses, while NEE took 4–5 days to reach its peak if the rainfall was large enough to increase the photosynthetic activity of vascular plants. Overall, the ratio of total transpiration to ET was 38%, but it was about 92% during the months when the vascular plants were active. The NEE was increasingly more negative as the growing season progressed, indicating a greater net uptake of CO 2 and a greater water use efficiency. Copyright 08 2011 John Wiley & Sons, Ltd.

DOI

70
Liu R, Li Y, Wang Q Xet al., 2011a. Seasonal and annual variations of carbon dioxide fluxes in desert ecosystem.Journal of Desert Research, 31(1): 108-114. (in Chinese)<FONT face=Verdana>Using eddy covariance technology, we measured the CO2 flux in a desert ecosystem during growing seasons of 2004—2006. The seasonal and annual variability of the CO2 flux(NEE) and gross primary production (GPP) and ecosystem respiration (Reco) were analyzed based on observation data. NEE, GPP, Reco had a similar seasonal variation trend, and their values follow a sequence of values in growth period&gt;in initial growth period&gt;in terminal growth period. Obvious difference can be seen in annual trends of GPP, NEE, and Reco. The peak NEE value was -4.66 g·m-2·d-1, -1.94 g·m-2·d-1 and -2.02 g·m-2·d-1 in 2004, 2005 and 2006 respectively. Carbon uptake occurred mainly in June, July and August of the growing season. Carbon uptake occurred in the three years, and the value was -236.18 g·m-2, -63.07 g·m-2, and -91.97 g·m-2 in order. The results indicate that, in contrast to previous research, desert ecosystem can be a significant carbon sink and an important component of the global carbon budget.</FONT>

71
Liu Y C, Yu G R, Wang Q Fet al., 2014. Carbon carry capacity and carbon sequestration potential in China based on an integrated analysis of mature forest biomass. Science China:Life Sciences, 57(12): 1218-1229.Abstract Forests play an important role in acting as a carbon sink of terrestrial ecosystem. Although global forests have huge carbon carrying capacity (CCC) and carbon sequestration potential (CSP), there were few quantification reports on Chinese forests. We collected and compiled a forest biomass dataset of China, a total of 5841 sites, based on forest inventory and literature search results. From the dataset we extracted 338 sites with forests aged over 80 years, a threshold for defining mature forest, to establish the mature forest biomass dataset. After analyzing the spatial pattern of the carbon density of Chinese mature forests and its controlling factors, we used carbon density of mature forests as the reference level, and conservatively estimated the CCC of the forests in China by interpolation methods of Regression Kriging, Inverse Distance Weighted and Partial Thin Plate Smoothing Spline. Combining with the sixth National Forest Resources Inventory, we also estimated the forest CSP. The results revealed positive relationships between carbon density of mature forests and temperature, precipitation and stand age, and the horizontal and elevational patterns of carbon density of mature forests can be well predicted by temperature and precipitation. The total CCC and CSP of the existing forests are 19.87 and 13.86 Pg C, respectively. Subtropical forests would have more CCC and CSP than other biomes. Consequently, relying on forests to uptake carbon by decreasing disturbance on forests would be an alternative approach for mitigating greenhouse gas concentration effects besides afforestation and reforestation.

DOI PMID

72
Liu Y F, Yu G R, Wen X Fet al., 2006. Seasonal dynamics of CO2 fluxes from subtropical plantation coniferous ecosystem.Science in China Series D, 49(S2): 99-109.As one component of ChinaFLUX, the measurement of CO2 flux using eddy covariance over subtropical planted coniferous ecosystem in Qianyanzhou was conducted for a long term. This paper discusses the seasonal dynamics of net ecosystem exchange (NEE), ecosystem respiration (RE) and gross ecosystem exc

DOI

73
Liu Z, Guan D B, Wei Wet al., 2015. Reduced carbon emission estimates from fossil fuel combustion and cement production in China. Nature, 524(7565): 335-338.Nearly three-quarters of the growth in global carbon emissions from the burning of fossil fuels and cement production between 2010 and 2012 occurred in China. Yet estimates of Chinese emissions remain subject to large uncertainty; inventories of China's total fossil fuel carbon emissions in 2008 differ by 0.3 gigatonnes of carbon, or 15 per cent. The primary sources of this uncertainty are conflicting estimates of energy consumption and emission factors, the latter being uncertain because of very few actual measurements representative of the mix of Chinese fuels. Here we re-evaluate China's carbon emissions using updated and harmonized energy consumption and clinker production data and two new and comprehensive sets of measured emission factors for Chinese coal. We find that total energy consumption in China was 10 per cent higher in 2000-2012 than the value reported by China's national statistics, that emission factors for Chinese coal are on average 40 per cent lower than the default values recommended by the Intergovernmental Panel on Climate Change, and that emissions from China's cement production are 45 per cent less than recent estimates. Altogether, our revised estimate of China's CO2 emissions from fossil fuel combustion and cement production is 2.49 gigatonnes of carbon (2 standard deviations = 卤7.3 per cent) in 2013, which is 14 per cent lower than the emissions reported by other prominent inventories. Over the full period 2000 to 2013, our revised estimates are 2.9 gigatonnes of carbon less than previous estimates of China's cumulative carbon emissions. Our findings suggest that overestimation of China's emissions in 2000-2013 may be larger than China's estimated total forest sink in 1990-2007 (2.66 gigatonnes of carbon) or China's land carbon sink in 2000-2009 (2.6 gigatonnes of carbon).

DOI PMID

74
Luyssaert S, Inglima I, Jung Met al., 2007. CO2 balance of boreal, temperate, and tropical forests derived from a global database.Global Change Biology, 13: 2509-2537.Terrestrial ecosystems sequester 2.1 Pg of atmospheric carbon annually. A large amount of the terrestrial sink is realized by forests. However, considerable uncertainties remain regarding the fate of this carbon over both short and long timescales. Relevant data to address these uncertainties are being collected at many sites around the world, but syntheses of these data are still sparse. To facilitate future synthesis activities, we have assembled a comprehensive global database for forest ecosystems, which includes carbon budget variables (fluxes and stocks), ecosystem traits (e.g. leaf area index, age), as well as ancillary site information such as management regime, climate, and soil characteristics. This publicly available database can be used to quantify global, regional or biome-specific carbon budgets; to re-examine established relationships; to test emerging hypotheses about ecosystem functioning [e.g. a constant net ecosystem production (NEP) to gross primary production (GPP) ratio]; and as benchmarks for model evaluations. In this paper, we present the first analysis of this database. We discuss the climatic influences on GPP, net primary production (NPP) and NEP and present the CO2 balances for boreal, temperate, and tropical forest biomes based on micrometeorological, ecophysiological, and biometric flux and inventory estimates. Globally, GPP of forests benefited from higher temperatures and precipitation whereas NPP saturated above either a threshold of 1500 mm precipitation or a mean annual temperature of 10 degrees C. The global pattern in NEP was insensitive to climate and is hypothesized to be mainly determined by nonclimatic conditions such as successional stage, management, site history, and site disturbance. In all biomes, closing the CO2 balance required the introduction of substantial biome-specific closure terms. Nonclosure was taken as an indication that respiratory processes, advection, and non-CO2 carbon fluxes are not presently being adeq

DOI

75
Mi N, Yu G R, Wang P Xet al., 2007. Modeling seasonal variation of CO2 flux in a subtropical coniferous forest using the EALCO model.Journal of Plant Ecology, 31(6): 1119-1131. (in Chinese)Aims Seasonal drought frequently occurs in the mid-subtropical region of China and commonly combines with high temperature.Our objectives were to test the sensitivity of carbon exchange to this seasonal drought and discuss the influence of seasonal drought on carbon assimilation.Methods We used flux measurements obtained from eddy covariance technology since October 2002 over a human-planted forest ecosystem at Qianyanzhou(QYZ)(26 44' N,115 03' E,110.8 m als.).The EALCO(ecological assimilation of land and climate observations)model is parameterized to simulate the ecosystem carbon exchange process in the human-planted evergreen forest.Simulation results were validated using half-hourly carbon fluxes and daily and annual GPP(gross primary production),NEP(net ecosystem production)and TER(total ecosystem respiration)estimated from eddy covariance measurements.Important findings In general,the model can effectively simulate the two years' carbon fluxes among soil-plant-atmosphere on hourly,daily and annual scales.Both simulations and observations showed strong impact of drought on GPP in 2003.Compared with 2004,the annual GPP in 2003 was 12.9% lower according to observations(1 610 vs.1 865 g C m-2)and 11.2% lower according to model results(1 637 vs.1 844 g C m-2).The diurnal variations of NEP from both observations and simulations during the period of soil water deficit showed asymmetric format,i.e.,the peak value of carbon exchange accrued at a certain time in the morning and then decreased with time.Modeling results indicated that water stress has more influence on photosynthesis than TER,which led to the decrease of NEP.Further analysis suggested that deep soil water content controls canopy photosynthesis in sunny days before noon during soil water stress.Afternoon,both high temperature and deep soil water content eliminate the GPP,and their elimination percents are equal.On cloudy days,radiation and deep soil water content primarily determine the photosynthesis,and temperature becomes a generally minor controlling factor.

DOI

76
Mi N, Yu G R, Wen X Fet al., 2009. Use of ecosystem flux data and a simulation model to examine seasonal drought effects on a subtropical coniferous forest.Asia-Pacific Journal of Atmospheric Sciences, 45(2): 207-220.National Natural Science Foundation of China (NSFC) [30670384, 30590381]

77
Pang J P, Wen X F, Sun X M, 2016. Mixing ratio and carbon isotopic composition investigation of atmospheric CO2 in Beijing, China.Science of the Total Environment, 539: 322-330.The stable isotope composition of atmospheric CO 2 can be used as a tracer in the study of urban carbon cycles, which are affected by anthropogenic and biogenic CO 2 components. Continuous measurements of the mixing ratio and δ 13 C of atmospheric CO 2 were conducted in Beijing from Nov. 15, 2012 to Mar. 8, 2014 including two heating seasons and a vegetative season. Both δ 13 C and the isotopic composition of source CO 2 (δ 13 C S ) were depleted in the heating seasons and enriched in the vegetative season. The diurnal variations in the CO 2 mixing ratio and δ 13 C contained two peaks in the heating season, which are due to the effects of morning rush hour traffic. Seasonal and diurnal patterns of the CO 2 mixing ratio and δ 13 C were affected by anthropogenic emissions and biogenic activity. Assuming that the primary CO 2 sources at night (22:00–04:00) were coal and natural gas combustion during heating seasons I and II, an isotopic mass balance analysis indicated that coal combustion had average contributions of 83.8302±0214.11% and 86.8402±0212.27% and that natural gas had average contributions of 16.1702±0214.11% and 13.1602±0212.27%, respectively. The δ 13 C of background CO 2 in air was the main error source in the isotopic mass balance model. Both the mixing ratio and δ 13 C of atmospheric CO 2 had significant linear relationships with the air quality index (AQI) and can be used to indicate local air pollution conditions. Energy structure optimization, for example, reducing coal consumption, will improve the local air conditions in Beijing.

DOI PMID

78
Qiu L, Zu Y G, Wang W Jet al., 2011. CO2 flux characteristics and their influence on the carbon budget of a larch plantation in Maoershan region of Northeast China.Chinese Journal of Applied Ecology, 22(1): 1-8. (in Chinese)<p>From January to December 2008, the CO<sub>2</sub> flux in a larch plantation (<em>Larix gmeilinii</em>) in Maoershan region of Shangzhi County, Heilongjiang Province was measured by eddy covariance method, and the diurnal changes of leaf photosynthetic rate were measured in growth season (from May to October). There existed differences in the net ecosystem exchange (NEE) of the plantation in different time periods under the effects of environmental factors. In the afternoon (12:00-24:00), the NEE changed more slowly with the variation of vapor pressure deficit (VPD) than in the morning (0:00-12:00); and in the morning, the light use efficiency was 0.6284 mol&middot;mol<sup>-1</sup> 14% more than that in afternoon. The NEE increased with increasing temperature, and the increment in the morning was 50% higher than that in the afternoon (air temperature &gt;15 ℃). These differences in responding to environmental changes led to 88% NEE implemented in the morning, and only 12% NEE implemented in the afternoon. The annual gross ecosystem productivity (GEP) in the morning took a percentage of 60%, and that in afternoon took 40%. These findings were supported by the observation at leaf level, <em>i.e</em>., on average of whole growth season, the leaf photosynthetic capacity in the morning was over 2-fold higher than that in afternoon. Generally, the annual NEE, ecosystem respiration (<em>R</em><sub>e</sub>), and GEP of the plantation in 2008 were 263-264 g C&middot;m<sup>-2</sup> 718-725 g C&middot;m<sup>-2</sup> and 981-989 g C&middot;m<sup>-2</sup> respectively.</p>

79
Reichstein M, Bahn M, Mahecha M Det al., 2014. Linking plant and ecosystem functional biogeography.Proceedings of the National Academy of Sciences of the United States of America, 111: 13697-13702.Classical biogeographical observations suggest that ecosystems are strongly shaped by climatic constraints in terms of their structure and function. On the other hand, vegetation function feeds back on the climate system via biosphere-atmosphere exchange of matter and energy. Ecosystem-level observations of this exchange reveal very large functional biogeographical variation of climate-relevant ecosystem functional properties related to carbon and water cycles. This variation is explained insufficiently by climate control and a classical plant functional type classification approach. For example, correlations between seasonal carbon-use efficiency and climate or environmental variables remain below 0.6, leaving almost 70% of variance unexplained. We suggest that a substantial part of this unexplained variation of ecosystem functional properties is related to variations in plant and microbial traits. Therefore, to progress with global functional biogeography, we should seek to understand the link between organismic traits and flux-derived ecosystem properties at ecosystem observation sites and the spatial variation of vegetation traits given geoecological covariates. This understanding can be fostered by synergistic use of both data-driven and theory-driven ecological as well as biophysical approaches.

DOI

80
Ren C Y, Yu G R, Wang Q Fet al., 2005. Photosynthesis-transpiration coupling model at canopy scale in terrestrial ecosystem. Science in China Series D, 48(S1): 160-171.At the hypothesis of big leaf, an ecosystem photosynthesis-transpiration coupling cycle model was established by the scaled SMPT-SB model from single leaf to canopy, and model parameterization methods were discussed. Through simulating the canopy light distribution, canopy internal conductance to CO2 can be scaled from single leaf to canopy by integrating to canopy using the relationship between single internal conductance and photosynthetic photon flux density. Using the data observed by eddy covariance method from the Changbai Mountains site of ChinaFLUX, the application of the model at the canopy scale was examined. Under no water stress, the simulated net ecosystem photosynthesis rate fitted with the observed data very well, the slope and R-2 of the line regression equation of the observed and simulated values were 0.7977 and 0.8892, respectively (n = 752), and average absolute error was 3.78 mu mol CO2 m(-2) s(-1); the slope, R-2 and average absolute error of transpiration rate were 0.7314, 0.4355 and 1.60 mmol H2O m(-2) s(-1), respectively (n = 752). The relationship between canopy photosynthesis, transpiration and external environmental conditions was discussed by treating the canopy as a whole and neglecting the comprehensive feedback mechanism within canopy, and it was noted that the precipitation course affected the transpiration rate simulation badly. Compared to the models based on eco-physiological processes, the SMPT-SB model was simple and easy to be used. And it can be used as a basic carbon and water coupling model of soil-plant-atmosphere continuum.

DOI

81
Ren X L, He H L, Liu Met al., 2012. Modeling of carbon and water fluxes of Qianyanzhou subtropical coniferous plantation using model-data fusion approach.Acta Ecologica Sinica, 32(23): 7313-7326. (in Chinese)As one of the most widespread forest types,China plantation plays an important role in global carbon balance.It is crucial to reduce the uncertainties in the estimation of carbon and water fluxes of plantation ecosystems,and model-data fusion technique provides an effective way.The purpose of this research is to improve the modeling accuracy of SIPNET model,the simplified Photosynthesis and Evapo-Transpiration(ET) model through two experiments,namely NEE alone and NEE ET multi-constraints.The model-data fusion method used here is a combination of Metropolis-Hastings algorithm and Simulated Annealing algorithm.Based on eddy fluxes and meteorological observation data of Qianyanzhou subtropical coniferous plantation during 2004-2009 in ChinaFLUX(Chinese Terrestrial Ecosystem Flux Research Network),we estimated the key parameters of SIPNET model and simulated the corresponding carbon and water fluxes.Comparisons between the measured and modeled net ecosystem exchange of carbon dioxide(NEE) showed that the SIPNET model had approximately equivalent fits to the observed NEE under two optimization procedures(R2 decreased from 0.934 to 0.929,and RMSE increased from 0.736 g C/m2 to 0.763 g C/m2).In the case of ET,the NEE and ET parameterization produced a markedly better fit to the observed ET than the NEE parameterization(R2 increased from 0.188 to 0.824,and RMSE decreased from 0.152 cm to 0.053 cm).As for transpiration,when optimized by observed NEE alone,SIPNET largely underestimated annual accumulated transpiration in 2004 compared with the measurements of sap flow technique.In comparison,while optimization based on NEE and ET,SIPNET led to a better fit of annual cumulative estimation of transpiration in 2004 to the sap flow measurement.These results indicated that the SIPNET model parameterized using NEE and ET observed fluxes could well reproduce the characteristics of carbon and water fluxes.In other words,more information can be extracted from simultaneous optimization,since there is additional process information in water flux observation data.Furthermore,we conducted a sensitivity test of precipitation on carbon fluxes through reduction of precipitation.We found that photosynthesis was more sensitive to precipitation reduction than respiration,and the model optimized using NEE and ET reproduced the response of NEE to precipitation reduction better than that optimized using NEE alone.In addition,we detected that the difference of NEE response to precipitation reduction in two optimizations of the SIPNET model was caused by gross ecosystem production rather than ecosystem respiration.Therefore,parameter estimation using NEE and ET altogether improved the performance of SIPNET model.And without optimization using both NEE and ET,the response of ecosystem carbon cycle to precipitation variation may be misrepresented.

DOI

82
Saigusa N, Li S G, Kwon Het al., 2013. Dataset of CarboEastAsia and uncertainties in the CO2 budget evaluation caused by different data processing.Journal of Forest Research, 18(1): 41-48.Abstract<br/><p class="a-plus-plus">The datasets of net ecosystem CO<sub class="a-plus-plus">2</sub> exchange (NEE) were acquired from 21 forests, 3 grasslands, and 3 croplands in the eastern part of Asia based on the eddy covariance measurements of the international joint program, CarboEastAsia. The program was conducted by three networks in Asia, ChinaFLUX, JapanFlux, and KoFlux, to quantify, synthesize, and understand the carbon budget of the eastern part of Asia. An intercomparison was conducted for NEE estimated by three gap-filling procedures adopted by ChinaFLUX, JapanFlux, and KoFlux to test the range of uncertainty in the estimation of NEE. The overall comparison indicated good agreement among the procedures in the seasonal patterns of NEE, although a bias was observed in dormant seasons depending on the different criteria of data screening. Based on the gap-filled datasets, the magnitude and seasonality of the carbon budget were compared among various biome types, phenology, and stress conditions throughout Asia. The annual values of gross primary production and ecosystem respiration were almost proportional to the annual air temperature. Forest management, including clear-cutting, plantation, and artificial drainage, was significant and obviously affected the annual carbon uptake within the forests. Agricultural management resulted in notable seasonal patterns in the crop sites. The dataset obtained from a variety of biome types would be an essential source of knowledge for ecosystem science as well as a valuable validation dataset for modeling and remote sensing to upscale the carbon budget estimations in Asia.</p><br/>

DOI

83
Sheng W P, Yu G R, Fang H Jet al., 2010. Observation methods for atmospheric nitrogen deposition.Chinese Journal o f Ecology, 29(8): 1671-1678. (in Chinese)Atmospheric nitrogen deposition has increased dramatically in recent years, due to the increasing discharge of nitrogenous compounds from industry and agriculture. Nitrogen deposition is an important nitrogen source of natural ecosystem, and its increase would disturb the ecosystem biogeochemical cycle. Because of the compositional complexity and large spatiotemporal variability of atmospheric nitrogen deposition as well as the disunity of measurement methods, it is difficult to compare the results from different nitrogen deposition studies. Aiming at the sources and composition of atmospheric nitrogen deposition, this paper summarized the past decades research progress at home and abroad in the observation and test methods of atmospheric nitrogen deposition, described in detail the principles and operations of the methods for measuring wet-and dry nitrogen deposition (traditional rain collection, automatic collection by instrument, ion exchange resin column collection, dust cylinder wet collection, and deposition velocity method), and compared the advantages and disadvantages of these methods. Meanwhile, based on the comparison of related studies at home and abroad, this paper also provided the regional quantitative information of nitrogen deposition flux. Presenting a brief review of representative techniques for nitrogen deposition observation, this paper preliminarily elucidated the theoretic bases and principles of atmospheric nitrogen deposition measurement, gave a qualitative reference for the contrastive analysis of different observation results, and provided theoretical bases for the reasonable choice of nitrogen deposition observation.

84
Sheng W P, Yu G R, Fang H Jet al., 2014. Regional pattern of 15N natural abundance in the forest ecosystems along a large transect in eastern China.Scientific Reports. DOI:

85
Sheng W P, Yu G R, Jiang C Met al., 2012. Monitoring nitrogen deposition in typical forest ecosystems along a large transect in China.Environmental Monitoring and Assessment, 185: 833-844.The nitrogen (N) deposition fluxes were investigated in eight typical forest ecosystems along the North―South Transect of Eastern China (NSTEC; based on the ChinaFLUX network) by ion-exchange resin (IER) columns from May 2008 to April 2009. Our results demonstrated that the method of IER columns was both labor cost saving and reliable for measuring dissolved inorganic nitrogen (DIN) deposition at the remote forest stations. The deposition of DIN in the throughfall ranged from 1.3 to 29.5 kg N ha

DOI PMID

86
Shi P L, Sun X M, Xu L Let al., 2006. Net ecosystem CO2 exchange and controlling factors in a steppe: Kobresia meadow on the Tibetan Plateau.Science in China Series D, 49(S2): 207-218.

87
Song Q H, Tan Z H, Zhang Y Pet al., 2013. Spatial heterogeneity of soil respiration in a seasonal rainforest with complex terrain.iForest - Biogeosciences and Forestry, 6: 65-72.amp;nbsp;Although numerous studies have been conducted to investigate ecosystem-scale soil respiration, our understanding of this process is still incomplete, especially with respect to the spatial variability and ecological factors that drive such variability in respiration. The present study was conducted to investigate the respiration, structural parameters and soil properties in a seasonal rainforest with complex topography. Specifically, we sampled a 20-ha plot in intervals of 20 m to measure the soil respiration. Based on the entire 20-ha plot, the spatial mean soil respiration rate was 4.09 &micro;mol m-2 s-1 and 2.71 &micro;mol m-2 s-1 during the rainy and dry season, respectively. Strong spatial heterogeneity was observed, with coefficients of variance of 42% and 38% being obtained for the rainy and dry season, respectively. The patch size of soil respiration was approximately 40 m, which was much smaller than that of the soil temperature and water content. Soil-respiration hot spots induced a right-skewed probability density function of soil respiration in space. However, termite mounds did not account for the respiration hot spots. The required number of sampling points in our studied forest was estimated to be 71 and 51 for the rainy and dry season, respectively.

DOI

88
Song T, 2007. Long term carbon dioxide flux measurements in Sanjiang Plain, Northeastern China [D]. Nanjing: Nanjing University of Information Science and Technology. (in Chinese)

89
Stoy P, Mauder M, Foken Tet al., 2013. A data-driven analysis of energy balance closure across FLUXNET research sites: The role of landscape scale heterogeneity.Agricultural and Forest Meteorology, 171: 137-152.The energy balance at most surface-atmosphere flux research sites remains unclosed. The mechanisms underlying the discrepancy between measured energy inputs and outputs across the global FLUXNET tower network are still under debate. Recent reviews have identified exchange processes and turbulent motions at large spatial and temporal scales in heterogeneous landscapes as the primary cause of the lack of energy balance closure at some intensively-researched sites, while unmeasured storage terms cannot be ruled out as a dominant contributor to the lack of energy balance closure at many other sites. We analyzed energy balance closure across 173 ecosystems in the FLUXNET database and explored the relationship between energy balance closure and landscape heterogeneity using MODIS products and GLOBEstat elevation data. Energy balance closure per research site ( C EB,s ) averaged 0.84 0.20, with best average closures in evergreen broadleaf forests and savannas (0.91-0.94) and worst average closures in crops, deciduous broadleaf forests, mixed forests and wetlands (0.70-0.78). Half-hourly or hourly energy balance closure on a percent basis increased with friction velocity ( u * ) and was highest on average under near-neutral atmospheric conditions. C EB,s was significantly related to mean precipitation, gross primary productivity and landscape-level enhanced vegetation index (EVI) from MODIS, and the variability in elevation, MODIS plant functional type, and MODIS EVI. A linear model including landscape-level variability in both EVI and elevation, mean precipitation, and an interaction term between EVI variability and precipitation had the lowest Akaike's information criterion value. C EB,s in landscapes with uniform plant functional type approached 0.9 and C EB,s in landscapes with uniform EVI approached 1. These results suggest that landscape-level heterogeneity in vegetation and topography cannot be ignored as a contributor to incomplete energy balance closure at the flux network level, although net radiation measurements, biological energy assimilation, unmeasured storage terms, and the importance of good practice including site selection when making flux measurements should not be discounted. Our results suggest that future research should focus on the quantitative mechanistic relationships between energy balance closure and landscape-scale heterogeneity, and the consequences of mesoscale circulations for surface-atmosphere exchange measurements.

DOI

90
Sun J T, 2012. Study of CO2 flux above urban green space in Perl River Delta [D]. Nanjing: Nanjing University of Information Science and Technology. (in Chinese)

91
Tan Z H, Zhang Y P, Liang N Set al., 2012. An observational study of the carbon-sink strength of East Asian subtropical evergreen forests.Environmental Research Letters, 7. doi: 10.1088/1748-9326/7/4/044017.Relatively little is known about the effects of regional warming on the carbon cycle of subtropical evergreen forest ecosystems, which are characterized by year-round growing season and cold winters. We investigated the carbon balance in three typical East Asia subtropical evergreen forests, using eddy flux, soil respiration and leaf-level measurements. Subtropical evergreen forests maintain continuous, high rates of photosynthetic activity, even during winter cold periods. Warm summers enhance photosynthetic rates in a limited way, because overall ecosystem productivity is primarily restrained by radiation levels during the warm period. Conversely, warm climates significantly enhance the respiratory carbon efflux. The finding of lower sensitivity of photosynthesis relative to that of respiration suggests that increased temperature will weaken the carbon-sink strength of East Asia subtropical evergreen forests.

DOI

92
Tan Z H, Zhang Y P, Liang N Set al., 2013. Soil respiration in an old-growth subtropical forest: Patterns, components, and controls.Journal of Geophysical Research-Atmospheres, 118(7): 2981-2990.The patterns, components, and controls of soil respiration in an old-growth subtropical forest were investigated using an automatic chamber system. We measured soil respiration in three treatments (control, trenching, litter removal) over 15 months. The annual total soil respiration (1248 gC m-2 yr-1) showed considerable spatial variation (coefficient of variation=27.8%) within the forest. Thirty samples were required to obtain results within 10% of the mean value at a 95% confidential level. A distinctive cosine-like diel pattern of soil respiration was observed; the time lag between gross primary production and soil respiration at this scale was calculated to be 4-5 h. Seasonality of soil respiration was strong (similar to 1 mu mol m-2 s-1 near the end of winter; similar to 6 mu mol m-2 s-1 in midsummer). No time lag was discerned between gross primary production and soil respiration at the seasonal scale. Soil temperature at 5 cm below surface can explain most (>91%) of the observed annual variation in soil respiration. The apparent respiration temperature sensitivity index (Q10) was 3.05. The lowest Q10 value was observed in winter, when soil moisture was low. Soil respiration was overestimated by a Q10 function during both dry and wet periods. The relative contributions of soil organic matter (RSOM), litterfall decomposition (RL), and root respiration (RR) to total soil respiration are 65.25%, 18.73%, and 16.01%, respectively; the temperature sensitivity of these components differ: RL (Q10=7.22)>RSOM (2.73)>RR (1.65). This relationship between Q10 values for litter respiration, soil organic matter decomposition, and root respiration still holds after minimizing the confounding effect of moisture. A relatively constant substrate supply and/or thermal acclimation could account for the observed low-temperature sensitivity in root respiration. Given the high carbon stocks and fluxes, the old-growth subtropical forests of China seem important in the global carbon budget and climate change.

DOI

93
Tan Z H, Zhang Y P, Schaefer Det al., 2011. An old-growth subtropical Asian evergreen forest as a large carbon sink.Atmospheric Environment, 45: 1548-1554.Old-growth forests are primarily found in mountain ranges that are less favorable or accessible for land use. Consequently, there are fewer scientific studies on old-growth forests. The eddy covariance method has been widely used as an alternative approach to studying an ecosystem's carbon balance, but only a few eddy flux sites are located in old-growth forest This fact will hinder our ability to test hypotheses such as whether or not old-growth forests are carbon neutral. The eddy covariance approach was used to examine the carbon balance of a 300-year-old subtropical evergreen broadleaved forest that is located in the center of the largest subtropical land area in the world. The post-QA/QC (quality assurance and control) eddy covariance based NEP was similar to 9 tC ha(-1) yr(-1), which suggested that this forest acts as a large carbon sink. The inventory data within the footprint of the eddy flux show that similar to 6 tC ha(-1) yr(-1) was contributed by biomass and necromass. The large-and-old trees sequestered carbon. Approximately 60% of the biomass increment is contributed by the growth of large trees (DBH > 60 cm). The high-altitude-induced low temperature and the high diffusion-irradiation ratio caused by cloudiness were suggested as two reasons for the large carbon sink in the forest we studied. To analyze the complex structure and terrain of this old-growth forest, this study suggested that biometric measurements carried out simultaneously with eddy flux measurements were necessary. (C) 2010 Elsevier Ltd. All rights reserved.

DOI

94
Tan Z H, Zhang Y P, Yu G Ret al., 2010. Carbon balance of a primary tropical seasonal rain forest. Journal of Geophysical Research, 115: D00H26.The role of primary tropical rain forests in the global carbon cycle is under active debate. By combining long-term forest inventory data with physiological measurement data in a 1 ha permanent ecological research plot beneath an eddy covariance flux tower in a primary tropical seasonal rain forest, the ecosystem carbon balance was investigated and a detailed site-specific carbon budget was established. The studied ecosystem was a carbon sink as determined by both eddy covariance (1.19 Mg C hayr) and biometric methods (3.59 Mg C hayr). Biometric- and eddy covariance-based net ecosystem production showed no convergence in our investigation period. The large biomass increment, caused by the rapid annual growth rate of large trees, primarily accounted for the large ecosystem carbon sink derived from the biometric method. High leaf respiration in relation to carbon allocation and low ecosystem carbon use efficiency (0.34) were observed at our site.

DOI

95
Tang Y K, Wen X F, Sun X Met al., 2014. The limiting effect of deep soil water on evapotranspiration of a subtropical coniferous plantation subjected to seasonal drought.Advances in Atmospheric Sciences, 31: 385-395.lt;p>Seasonal drought is a common occurrence in humid climates. The year 2003 was the driest year during the period 1985-2011 in southeastern China. The objective of this study was to elucidate the impact of the exceptional drought in 2003, compared with eddy flux measurements during 2004-11, on the dynamics of evapotranspiration (ET) and related factors, as well as their underlying mechanisms, in a subtropical coniferous plantation in southeastern China. It was found that daily ET decreased from 5.34 to 1.84 mm during the intensive drought period and recovered to 4.80 mm during the subsquent recovering drought period. Path analysis indicated that ET was mainly determined by canopy conductance and deep soil water content (50 cm) during the intensive drought and recovering drought periods, respectively. The canopy conductance offset the positive effect of air vapor pressure deficit on ET when suffering drought stress, while the canopy conductance enhanced the positive effect of air temperature on ET during the late growing season. Because the fine roots of this plantation are mainly distributed in shallow soil, and the soil water in the upper 40 cm did not satisfy the demand for ET, stomatal closure and defoliation were evident as physiological responses to drought stress.</p>

DOI

96
The Ministry of Water Resources of the People’s Republic of China (MWR), 2011a. Chinese River and Sediment Bulletin, 2000-2011. (in Chinese)

97
The Ministry of Water Resources of the People’s Republic of China (MWR), 2011b. Chinese Water Conservancy Yearbook. (in Chinese)

98
Tong X, Zhang J, Meng Pet al., 2010. Characteristics of net carbon exchange over a mixed plantation in a hilly area of the north China.Scientia Silvae Sinicae, 46: 37-43. (in Chinese)lt;p><font face="Verdana"><font face="Verdana">In recent years, forest areas in China increased largely thanks to afforestation. The plantation area accounts for 30% of the total forest areas of China. To understand the potential carbon sink of the plantation, CO<sub>2</sub> flux was measured continuously from 2006 and 2007 using the eddy covariance technique in a 30-year-old mixed plantation (<em>Quercus variabilis, Robinia pseudoacacia</em> and <em>Platycladus orientalis</em>) in a hilly area of the North China. The results showed inter-annual and seasonal variations of net ecosystem carbon exchange (NEE) were obvious. However, the diurnal variation was only remarkable in the growing seasons (from April to October). Daily NEE ranged from -27.1 to 8.1 g CO<sub>2</sub>&middot;m<sup>-2</sup>d<sup>-1</sup> in 2006, and from -24.4 to 9.8 g CO<sub>2</sub>&middot;m<sup>-2</sup>d<sup>-1</sup> in 2007. Monthly mean CO<sub>2</sub> uptake peaked in May in 2006 and in July in 2007. The magnitude of CO<sub>2</sub> uptake during the growing season accounted for about 96% of the whole year. Annual net carbon uptake in the plantation was 549.1 g C&middot;m<sup>-2</sup>a<sup>-1</sup> in 2006 and 445.4 g C&middot;m<sup>-2</sup>a<sup>-1</sup> in 2007. Carbon sink in the mixed plantation was notable and its inter-annual variation was significant. Drought in spring of 2007 was the main reason that led to a significant decrease in net carbon uptake in the mixed plantation.</font></font></p>

DOI

99
Wang B, Li J, Jiang W Wet al., 2012. Impacts of the rangeland degradation on CO2 flux and the underlying mechanisms in the Three-River Source Region on the Qinghai-Tibetan Plateau.China Environmental Science, 32(10): 1764-1771. (in Chinese)

100
Wang H M, Saigusa N, Zu Y Get al., 2008. Carbon fluxes and their response to environmental variables in a Dahurian larch forest ecosystem in Northeast China.Journal of Forestry Research, 19(1): 1-10.The Dahurian larch forest in northeast China is important due to its vastness and location within a transitional zone from boreal to temperate and at the southern distribution edge of the vast Siberian larch forest. The continuous carbon fluxes were measured from May 2004 to April 2005 in the Dahurian larch forest in Northeast China using an eddy covariance method. The results showed that the ecosystem released carbon in the dormant season from mid-October 2004 to April 2005, while it assimilated CO2 from the atmosphere in the growing season from May to September 2004. The net carbon sequestration reached its peak of 112 g·m-2·month-1 in June 2004 (simplified expression of g (carbon) ·m-2·month-1) and then gradually decreased. Annually, the larch forest was a carbon sink that sequestered carbon of 146 g·m-2·a-1 (simplified expression of g (carbon)·m-2·a-1) during the measurements. The photosynthetic process of the larch forest ecosystem was largely affected by the vapor pressure deficit (VPD) and temperature. Under humid conditions (VPD < 1.0 kPa), the gross ecosystem production (GEP) increased with increasing temperature. But the net ecosystem production (NEP) showed almost no change with increasing temperature because the increment of GEP was counterbalanced by that of the ecosystem respiration. Under a dry environment (VPD > 1.0 kPa), the GEP decreased with the increasing VPD at a rate of 3.0 μmol·m-2·s-1·kPa-1 and the ecosystem respiration was also enhanced simultaneously due to the increase of air temperature, which was linearly correlated with the VPD. As a result, the net ecosystem carbon sequestration rapidly decreased with the increasing VPD at a rate of 5.2 μmol·m-2·s-1·kPa-1. Under humid conditions (VPD < 1.0 kPa), both the GEP and NEP were obviously restricted by the low air temperature but were insensitive to the high temperature because the observed high temperature value comes within the category of the optimum range.

DOI

101
Wang K, Dickinson R E, 2012. A review of global terrestrial evapotranspiration: Observation, modeling, climatology, and climatic variability. Reviews of Geophysics, 50: RG2005.This review provides a survey of the basic theories, observational methods, satellite retrieval algorithms and land surface models of terrestrial evapotranspiration, E (or λE, latent heat flux), from a climatic variability perspective. We carefully examine the available observations, advancements in understanding the environmental and biological controls of λE, and their applications to evaluate satellite algorithms and land surface models. The two basic theories to estimate λE, Penman-Monteith equation and Monin-Obukhov similarity, are similar because the first is derived from the second under three assumptions that (1) surface energy is balanced, (2) the surface can be regard as a big leaf, and (3) atmospheric transfer coefficients for water and heat are equal. However, practical applications for these two theories differ substantially due to their sensitivity to errors of input data. There are six major methods that could provide continuous λE observations: (1) eddy covariance, (2) Bowen ratio, (3) weighable lysimeters, (4) scintillometer, (5) surface water budget, and (6) atmosphere water budget. The first two of these methods are widely accepted and deployed to provide high quality λE data. However, its measurements are of short duration and sparse spatial coverage, and therefore, cannot provide long-term regional or global estimates of λE. Existing evaluations of satellite remote sensing algorithms and land surface models focus on diurnal and seasonal variation. The capability of satellite algorithms and land surface models in estimating inter-annual or decadal variation of regional λE is still unknown. Furthermore, as a consequence of the lack of information on how to partition total E into soil evaporation, canopy evaporation and canopy transpiration, results from 10 widely accepted models give simulated ratios of global averaged vegetation transpiration to total E varying from 0.25 to 0.64 with an average of 0.42. This uncertainty therefore limits the capability of land surface models to provide the sensitivities of λE to precipitation deficit and land cover change. The λE from existing land surface models appears to be overly sensitive to precipitation deficits. A global average for E derived from surface water balance is about 1.3 mm per day (~38 Wm-2 for λE). The inter-annual or decadal variations of regional λE still have large uncertainties, whether derived from observations, satellites remote sensing or land surface models.

DOI

102
Wang Q F, Niu D, Yu G Ret al., 2005. Simulating the exchanges of carbon dioxide, water vapor and heat over Changbai Mountains temperate broad-leaved Korean pine mixed forest ecosystem.Science in China Series D, 48(S1): 148-159.

103
Wang Q F, Zheng H, Zhu X Jet al., 2015. Primary estimation of Chinese terrestrial carbon sequestration during 2001-2010.Science Bulletin, 60(6): 577-590.Quantifying the carbon budgets of terrestrial ecosystems is the foundation on which to understand the role of these ecosystems as carbon sinks and to mitigate global climate change. Through a re-examination of the conceptual framework of ecosystem productivity and the integration of multi-source data, we assumed that the entire terrestrial ecosystems in China to be a large-scale regional biome-society system. We approximated the carbon fluxes of key natural and anthropogenic processes at a regional scale, including fluxes of emissions from reactive carbon and creature ingestion, and fluxes of emissions from anthropogenic and natural disturbances. The gross primary productivity, ecosystem respiration and net ecosystem productivity(NEP) in China were 7.78, 5.89 and1.89 Pg C a-1, respectively, during the period from 2001 to2010. After accounting for the consumption of reactive carbon and creature ingestion(0.078 Pg C a-1), fires(0.002 Pg C a-1), water erosion(0.038 Pg C a-1) and agricultural and forestry utilization(0.806 Pg C a-1), the final carbon sink in China was about 0.966 Pg C a-1; this wasconsidered as the climate-based potential terrestrial ecosystem carbon sink for the current climate conditions in China. The carbon emissions caused by anthropogenic disturbances accounted for more than 42 % of the NEP,which indicated that humans can play an important role in increasing terrestrial carbon sequestration and mitigating global climate change. This role can be fulfilled by reducing the carbon emissions caused by human activities and by prolonging the residence time of fixed organic carbon in the large-scale regional biome-society system through the improvement of ecosystem management.

DOI

104
Wang S M, Hu J C, Wu G Xet al., 2011. Characteristic analysis of CO2 fluxes from a rice paddy ecosystem in a subtropical region.Acta Scientiae Circumstantiae, 31: 217-224. (in Chinese)In order to evaluate carbon source or sink strength,CO2 fluxes from a paddy ecosystem were continuously measured using the eddy covariance technique over the course of a year. During a cropping paddy season,the summation of CO2 fluxes from paddy ecosystem was negative and the paddy ecosystem was a carbon dioxide sink. Distinct CO2 fluxes characteristic of diurnal variation were observed. The net absorptive capacity of CO2 in the day was much more than CO2 release in the night. The absorbed efficiency of CO2 from rice elongating stage to milk stage was higher than other stages. The net carbon dioxide fixation from tillering stage to flowering stage was much more than other stages. During a non-cropping paddy season,i.e.,from late October(after the rice harvest) to the following year in April,the paddy ecosystem absorbed a small quantity of CO2 only in March,while in other months it released CO2,becoming a carbon source. The paddy ecosystem absorbed 14.35 t hm-2of CO2 from the atmosphere over a year,including 8.81 t hm-2 of CO2 absorbed by early season rice and11.71 t hm-2 by late season rice. Although the paddy ecosystem released 6.17 t hm-2 of CO2 during a non-cropping paddy season,it was an overall carbon dioxide sink for the atmosphere.

DOI

105
Wang S Q, Chen J M, Ju W Met al., 2007. Carbon sinks and sources in China's forests during 1901-2001.Journal of Environmental Management, 85(3): 524-537.<h2 class="secHeading" id="section_abstract">Abstract</h2><p id="">This paper reports the annual carbon (C) balance of China's forests during 1901&ndash;2001 estimated using the Integrated Terrestrial Ecosystem C-budget model (InTEC). Annual carbon source and sink distributions are simulated for the same period using various spatial datasets including land cover and leaf area index (LAI) obtained from remote sensing, soil texture, climate, forest age, and nitrogen deposition. During 1901&ndash;1949, China's forests were a source of 21.0&plusmn;7.8&#xA0;Tg&#xA0;C&#xA0;yr<sup>&minus;1</sup> due to disturbances (human activities). Its size increased to 122.3&plusmn;25.3&#xA0;Tg&#xA0;C&#xA0;yr<sup>&minus;1</sup> during 1950&ndash;1987 due to intensified human activities in the late 1950s, early 1960s, 1970s and early 1980s. The forests became large sinks of 176.7&plusmn;44.8&#xA0;Tg&#xA0;C&#xA0;yr<sup>&minus;1</sup> during 1988&ndash;2001, owing to large-scale plantation and forest regrowth in previously disturbed areas as well as growth stimulation by nondisturbance factors such as climatic warming, atmospheric CO<sub>2</sub> fertilization, and N deposition. From 1901 to 2001, China's forests were a small carbon source of 3.32&#xA0;Pg&#xA0;C, about 32.9&plusmn;22.3&#xA0;Tg&#xA0;C&#xA0;yr<sup>&minus;1</sup>. The overall C balance in biomass from InTEC generally agrees with previous results derived from forest inventories of China's forests. InTEC results also include C stock variation in soils and are therefore more comprehensive than previous results. The uncertainty in InTEC results is still large, but it can be reduced if a detailed forest age map becomes available.</p>

DOI

106
Wang Y F, Cui X Y, Hao Y Bet al., 2011. The fluxes of CO2 from grazed and fenced temperate steppe during two drought years.Science of the Total Environment, 410/411: 182-190.

107
Wang Y L, Zhou G S, Wang Y H, 2008b. Environmental effects on net ecosystem CO2 exchange at half-hour and month scales over Stipa krylovii steppe in northern China.Agricultural and Forest Meteorology, 148(5): 714-722.

108
Wang Y S, Cheng S L, Fang H Jet al., 2014. Simulated nitrogen deposition reduces CH4 uptake and increases N2O emission from a subtropical plantation forest soil in southern China. PloS One, 9(4): e93571.

109
Wang Y S, Cheng S L, Fang H Jet al., 2015. Contrasting effects of ammonium and nitrate inputs on soil CO2 emission in a subtropical coniferous plantation of southern China. Biology and Fertility of Soils, 51: 815-825.

110
Wang Y S, Cheng S L, Fang H Jet al., 2016. Significant regulations of ammonia-oxidizing communities to methane uptake and nitrous oxide emission from the subtropical plantation soil under nitrogen enrichment. European Journal of Soil Biology. (accepted)

111
Wang Y, Zhou G S, Jia B Ret al., 2010a. Comparisons of carbon flux and its controls between broad-leaved Korean pine forest and Dahurian larch forest in northeast China.Acta Ecologica Sinica, 30: 4376-4388. (in Chinese)Forest ecosystem in northern middle and high latitudes play an important role in global carbon cycle.Based on eddy covariance flux data and meteorological observations in the growing seasons of 2007 and 2008,the characteristics of CO2 flux and its controls were compared between broad-leaved Korean pine forest and Dahurian larch forest in northeast China.The results showed that both forest ecosystems acted as net sinks of CO2 during the study period,with a magnitude of 199 g C m-2( the average of 2007 and 2008 for broad-leaved Korean pine forest) and 49 g C m-2( the value of 2008 for Dahurian larch forest) respectively.The broad-leaved Korean pine forest ecosystem sequestered more carbon than the Dahurian larch forest ecosystem in most days of the growing season.Respirations of these two ecosystems showed exponential correlations well with the 10 cm soil temperatures on half-hour scale,and the temperature sensitivity index ( Q10 ) of respiration in the Dahurian larch forest ecosystem ( 3.44) was much larger than in the broad-leaved Korean pine forest ecosystem ( 1.90) .The critical transition temperature from carbon release to carbon uptake on daily scale was around 10 for these two ecosystems.Water-use efficiency was higher in the Dahurian larch forest ecosystem than in the broad-leaved Korean pine forest ecosystem.

DOI

112
Wang Z, Xiao X M, Yan X D, 2010b. Modeling gross primary production of maize cropland and degraded grassland in northeastern China.Agricultural and Forest Meteorology, 150: 1160-1167.Measurements from individual CO60 eddy flux sites provide valuable information on the seasonal dynamics of gross primary production (). In this study, we estimated seasonal dynamics of from 3 years (2004-2006) of the eddy covariance observations at cropland and degraded grassland in a semi-arid area of Tongyu county (44.5667°N, 122.8833°E), Northeast China. The biophysical performance of vegetation indices (, NDVI, and LSWI) derived from the 8-day Moderate Resolution Imaging Spectroradiometer (MODIS) surface reflectance product and their relations to dynamics were evaluated. The quantitative relationships between the vegetation indices and CO60 flux data clearly demonstrated the improvement of over NDVI, in terms of the phase and magnitude of . Canopy-level maximum light use efficiency, 07 68, was estimated for both and grassland by using the observed CO60 flux data and Photosynthetically Active Radiation (PAR) data from eddy flux tower sites. For cropland, the 07 68 value was 0.56gC/mol PAR, and for degraded grassland, the 07 68 value was 0.37gC/mol PAR. We conducted a simulation of the Vegetation Model (VPM) using the Enhanced Vegetation Index () and the Land Surface Index (LSWI) derived from the 8-day (MODIS) surface reflectance product, as well as site-specific climate data. The comparison between simulated and estimated from tower CO60 flux data showed good agreement in both cropland and degraded grassland. This study highlighted the biophysical performance of improved vegetation indices in relation to and demonstrated the potential of the satellite-driven VPM model for scaling-up of of cropland and grassland in semi-arid ecosystems.

DOI

113
Wen D, He N P, 2016. Spatial patterns and control mechanisms of carbon storage in forest ecosystem: Evidence from the north-south transect of eastern China.Ecological Indicator. doi: 10.1016/j.ecolind.2015.10.054.

114
Wen X F, Lee X H, Sun X Met al., 2012. Dew water isotopic ratios and their relationships to ecosystem water pools and fluxes in a cropland and a grassland in China.Oecologia, 168: 549-561.Abstract<br/>Dew formation has the potential to modulate the spatial and temporal variations of isotopic contents of atmospheric water vapor, oxygen and carbon dioxide. The goal of this paper is to improve our understanding of the isotopic interactions between dew water and ecosystem water pools and fluxes through two field experiments in a wheat/maize cropland and in a short steppe grassland in China. Measurements were made during 94 dew events of the D and <sup class="a-plus-plus">18</sup>O compositions of dew, atmospheric vapor, leaf, xylem and soil water, and the whole ecosystem water flux. Our results demonstrate that the equilibrium fractionation played a dominant role over the kinetic fractionation in controlling the dew water isotopic compositions. A significant correlation between the isotopic compositions of leaf water and dew water suggests a large role of top-down exchange with atmospheric vapor controlling the leaf water turnover at night. According to the isotopic labeling, dew water consisted of a downward flux of water vapor from above the canopy (98%) and upward fluxes originated from soil evaporation and transpiration of the leaves in the lower canopy (2%).<br/>

DOI PMID

115
Wen X F, Sun X M, Zhang S Cet al., 2008. Continuous measurement of water vapor D/H and 18O/16O isotope ratios in the atmosphere.Journal of Hydrology, 349: 489-500.

116
Wen X F, Yu G R, Sun X Met al., 2006. Soil moisture effects on the temperature dependence of ecosystem respiration in a subtropical Pinus plantation of southeastern China.Agricultural and Forest Meteorology, 137: 166-175.

117
Wen X F, Zhang S C, Sun X Met al., 2010. Water vapor and precipitation isotope ratios under the influence of the Asian monsoon climate.Journal of Geophysical Research-Atmospheres, 115. doi: 10.1029/2009JD012408.

118
Wu L, Gu S, Zhao Let al., 2010. Variation in net CO2 exchange, gross primary production and its affecting factors in the planted pasture ecosystem in Sanjiangyuan Region of the Qinghai-Tibetan Plateau of China.Acta Phytoecologica Sinica, 34: 770-780. (in Chinese)

119
Wu L B, Gu S, Zhao Let al., 2010. Variation in net CO2 exchange, gross primary production and its affecting factors in the planted pasture ecosystem in Sanjiangyuan Region of the Qinghai-Tibetan Plateau of China.Chinese Journal of Plant Ecology, 34(7): 770-780. (in Chinese)<FONT face=Verdana><EM>Aims</EM> Our objective was to understand seasonal and diurnal variations in CO<SUB>2</SUB> exchange of a grassland ecosystem by clarifying the carbon cycle and its affecting factors for a planted pasture ecosystem in the Sanjiangyuan Region of the Qinghai-Tibetan Plateau.<BR><EM>Methods</EM> We used the eddy covariance method to measure net ecosystem CO<SUB>2</SUB> exchange (<EM>NEE</EM>) and environmental factors in the planted pasture (<EM>Elymus nutans</EM>) ecosystem in 2006.<BR><EM>Important findings</EM> Daily maximum uptake and release of CO<SUB>2</SUB> were 6.56 and –4.87 g CO<SUB>2</SUB>·m<SUP>–2</SUP>·d<SUP>–1</SUP> respectively. Maximum rates of <EM>NEE</EM> uptake and release were –0.35 and 0.22 mg CO<SUB>2</SUB>·m<SUP>–2</SUP>·s<SUP>–1</SUP> respectively. Annual gross primary production (<EM>GPP</EM>) was 1 761 g CO<SUB>2</SUB>·m<SUP>–2</SUP>·a<SUP>–1</SUP> of which more than 90% was consumed by ecosystem respiration (<EM>R</EM><SUB>eco</SUB>). Annual <EM>NEE</EM> was –111 g CO<SUB>2</SUB>·m<SUP>–2</SUP>. In the growing season, maximum and minimum <EM>R</EM><SUB>eco</SUB>/<EM>GPP</EM> values<BR>were 90% in May and 79% in June, respectively. The <EM>Q</EM><SUB>10</SUB> was 4.81, which is higher than in other ecosystems. The <EM>NEE </EM>was mostly influenced by photosynthetic photon flux density (<EM>PPFD</EM>), temperature and vapor pressure deficit (<EM>VPD</EM>). The <EM>R</EM><SUB>eco</SUB> was mainly affected by soil temperature at 5 cm depth (<EM>T<SUB>s</SUB></EM>).</FONT>

DOI

120
Wu W X, Wang S Q, Xiao X Met al., 2008. Modeling gross primary production of a temperate grassland ecosystem in Inner Mongolia, China, using MODIS imagery and climate data.Science in China Series D, 51(10): 1501-1512.Carbon fluxes in temperate grassland ecosystems are characterized by large inter-annual variations due to fluctuations in precipitation and land water availability. Since an eddy flux tower has been in operation in the Xilin Gol grassland, which belongs to typical temperate grassland in North China, in this study, observed eddy covariance flux data were used to critically evaluate the biophysical per- formance of different remote sensing vegetation indices in relation to carbon fluxes. Furthermore, vegetation photosynthesis model (VPM) was introduced to estimate gross primary production (GPP) of the grassland ecosystem for assessing its dependability. As defined by the input variables of VPM, Moderate Resolution Imaging Spectroradimeter (MODIS) and standard data product MOD09A1 were downloaded for calculating enhanced vegetation index (EVI) and land surface water index (LSWI). Measured air temperature (Ta) and photosynthetically active radiation (PAR) data were also included for model simulating. Field CO2 flux data, during the period from May, 2003 to September, 2005, were used to estimate the "observed" GPP (GPPobs) for validation. The seasonal dynamics of GPP predicted from VPM (GPPVPM) was compared quite well (R2=0.903, N=111, p0.0001) with the observed GPP. The ag- gregate GPPVPM for the study period was 641.5 g Cm?2, representing a ~6% over-estimation, compared with GPPobs. Additionally, GPP predicted from other two typical production efficiency model (PEM) represents either higher overestimation or lower underestimation to GPPobs. Results of this study demonstrate that VPM has potential for estimating site-level or regional grassland GPP, and might be an effective tool for scaling-up carbon fluxes.

DOI

121
Xu M J, Wen X F, Wang H Met al., 2014. Effects of climatic factors and ecosystem responses on the inter-annual variability of evapotranspiration in a coniferous plantation in subtropical China. PLoS One, 9: e85593.

122
Xu X, Li Q, Wang Jet al., 2014. Inorganic and organic nitrogen acquisition by a fern dicranopteris dichotoma in a subtropical forest in South China.PLoS One, 9(5): e90075.The fern Dicranopteris dichotoma is an important pioneer species of the understory in Masson pine (Pinus massoniana) forests growing on acidic soils in the subtropical and tropical China. To improve our understanding of the role of D. dichotoma in nitrogen (N) uptake of these forests, a short-term N-15 experiment was conducted at mountain ridge (MR, with low N level) and mountain foot (MF, with high N level). We injected N-15 tracers as 15 NH4, (NO3)-N-15 or N-15-glycine into the soil surrounding each plant at both MR and MF sites. Three hours after tracer injection, the fern D. dichotoma took up (NH4+)-N-15 significantly faster at MF than at MR, but it showed significantly slower uptake of (NO3-)-N-15 at MF than at MR. Consequently, (NO3-)-N-15 made greater contribution to the total N uptake (50% to the total N uptake) at MR than at MF, but N-15-glycine only contributed around 11% at both sites. Twenty-four hours after tracer injection, D. dichotoma preferred (NH4+)-N-15 (63%) at MR, whereas it preferred (NO3-)-N-15 (47%) at MF. We concluded that the D. dichotoma responds distinctly in its uptake pattern for three available N species over temporal and spatial scales, but mainly relies on inorganic N species in the subtropical forest. This suggests that the fern employs different strategies to acquire available N which depends on N levels and time.

DOI PMID

123
Yan J H, Liu X Z, Tang X Let al., 2012. Substantial amounts of carbon are sequestered during dry periods in an old-growth subtropical forest in South China. Journal of Forest Research. doi: 10.1007/s10310-012-0363-0.A number of continuous eddy covariance measurements and long-term biomass inventories had proved that old-growth forests are carbon sinks worldwide. The present study estimated the net ecosystem productivity (NEP) for an old-growth subtropical forest at the Dinghushan Biosphere Reserve in South China to investigate the temporal pattern of carbon sequestration, both seasonally and annually. The measured NEP over 702years (from 2003 to 2009) showed that this forest was a net carbon sink, ranging from 230 (in 2008) to 48902g02C02m

DOI

124
Yan J H, Zhang Y P, Yu G Ret al., 2013. Seasonal and inter-annual variations in net ecosystem exchange of two old-growth forests in southern China.Agricultural and Forest Meteorology, 182(SI): 257-265.Old-growth forests can accumulate carbon. However, what controls the rate of net carbon accumulation in those old-growth forests is still poorly understood. Using eddy flux measurements from two old-growth evergreen broadleaf forests (subtropical forest and tropical forest) in southern China, we compared the seasonal and inter-annual variations in the carbon fluxes of those two forests and quantified the major drivers for these temporal variations. The measured flux data showed that the annual net carbon uptake of the subtropical forest was generally much larger than that for the tropical forest. The mean net ecosystem exchange (NEE) over 6 years was -397 +/- 94 g C m(-2) yr(-1) for the subtropical forest and -166 +/- 49 g Cm-2 yr(-1) for the tropical forest with different seasonal variations. The subtropical forest was a carbon sink for most months in a year, while the tropical forest was a carbon source in wet seasons (positive NEE) and a carbon sink in dry seasons (negative NEE). Both forests were stronger carbon sink in dry years, because of much larger reduction in ER than in wet years. At the seasonal scale, GPP in wet seasons was 37.1% higher than that for dry seasons in the subtropical forest, and was only 12.4% higher in the tropical forest. The amplitude of seasonal GPP variation in the tropical forest was much weaker than in the subtropical forest, but the amplitude of the seasonal variation in ER was much larger than in the subtropical forest. The seasonal variation in NEE was largely driven by the variation in monthly ER of the tropical forest, and by both seasonal variations in monthly GPP and ER of the subtropical forest. At inter-annual scale, annual NEE varied tightly with annual rainfall from year to year. Therefore annual rainfall was suggested a fundamental driver of annual carbon sequestration in the subtropical and tropical forests in southern China. (C) 2013 Elsevier B.V. All rights reserved.

DOI PMID

125
Yan L M, Chen S P, Huang Jet al., 2011b. Water regulated effects of photosynthetic substrate supply on soil respiration in a semiarid steppe.Global Change Biology, 17: 1990-2001.Soil respiration is an important part of the global carbon (C) cycle and the largest component of C flux from terrestrial ecosystems to the atmosphere. Here, we investigated possible effects of photosynthetic substrate supply on soil respiration in a semiarid ecosystem. A field experiment combining water addition and shading (low and high shading) treatments was conducted to manipulate photosynthetic substrate supply in a temperate semiarid steppe in two growing seasons. Our result showed that water addition and/or low shading significantly increased net primary productivity (ecosystem-level photosynthetic substrate supply) and soil respiration in both two growing seasons. However, the effects of high shading on net primary productivity and soil respiration depended on soil water condition, which were negative in wet year (2008) but positive in dry year (2009). On the diel timescale, soil respiration was out of phase with soil temperature and leaf net photosynthesis, but in phase with leaf sugar and starch contents (leaf-level photosynthetic substrate production). The results indicated that photosynthetic substrate supply was an important factor in regulating soil respiration on both daily and seasonal timescales. Moreover, its effect on soil respiration increased with increasing water availability in this region. The predominant role of C assimilate supply on soil respiration indicates that the predicted positive influence of rising temperature on soil respiration will be simultaneously mediated by substrate supply and water availability in semiarid steppe ecosystems.

DOI

126
Yan Y E, 2009. Carbon flux in an estuarine wetland estimated by remote model and ground-based observations [D]. Shanghai: Fudan University. (in Chinese)

127
Yang F L, Zhou G S, Hunt J Eet al., 2011. Biophysical regulation of net ecosystem carbon dioxide exchange over a temperate desert steppe in Inner Mongolia, China.Agriculture Ecosystems and Environment, 142: 318-328.Measurements of net ecosystem (CO2) exchange (NEE) were made, using eddy covariance, to investigate the biophysical regulation of a temperate desert steppe characterized drought in Inner Mongolia, China during 2008. The half-hourly maximum and minimum NEE were 613.07 and 0.85μmol CO2 m612s611 (negative values denoting net ). The maximum daily NEE was 616.0g CO2 m612day611. On an annual basis, integrated NEE was 617.2g C m612y611, indicating a weak sink. The light response curves of NEE showed a rather low apparent quantum yield (α) and saturation value of NEE (NEEsat). Moreover, α and NEEsat varied with canopy development, soil content (SWC), air temperature (Ta), and vapor pressure deficit (VPD). Piecewise regression results suggested that the optimal SWC, Ta, and VPD for half-hourly daytime NEE were 12.6%, 24.3°C, and 1.7kPa, respectively. The apparent temperature sensitivity of ecosystem respiration was 1.6 for the entire growing season, and it was significantly controlled by soil moisture. During the growing season, leaf area index explained about 26% of the variation in daily NEE. Overall, NEE was strongly suppressed by and this was the dominant biophysical regulator in the desert steppe.

DOI

128
Yao Y G, Zhang Y P, Liang N Set al., 2012. Pooling of CO2 within a small valley in a tropical seasonal rain forest.Journal of Forest Research, 17: 241-252.Abstract<br/>CO<sub class="a-plus-plus">2</sub> concentrations and related environmental factors were measured in an Asian tropical rainforest located in a small valley in Xishuangbanna, SW China, with the aim of investigating the CO<sub class="a-plus-plus">2</sub> pooling effect and its mechanism of formation. Pooling of CO<sub class="a-plus-plus">2</sub> was observed during the evening (1600–2200 hours local time); the accumulated CO<sub class="a-plus-plus">2</sub> subsequently flowed away after dusk. We consider that along-slope drainage flow, soil CO<sub class="a-plus-plus">2</sub> efflux, and temperature inversion contribute to the development of CO<sub class="a-plus-plus">2</sub> pooling. A new model is proposed to track the mechanism of the formation and dissipation of CO<sub class="a-plus-plus">2</sub> pooling (e.g., drainage flow, compensatory mechanisms). Given its influence on the storage term, we suggest that CO<sub class="a-plus-plus">2</sub> pooling and subsequent disappearance should be taken into account when calculating eddy covariance and other micrometeorological measurements of carbon flux for valley sites.<br/>

DOI

129
Yu C L, Liu D, 2011. Analysis on CO2 flux during growth season of natural broadleaved mixed forest in Xiaoxinganling Mountains.Chinese Journal of Agrometeorology, 32: 525-529. (in Chinese)The research on CO2 flux in forest system was one of the hot topics in global changes. The CO2&nbsp; flux during growth season of natural broadleaved mixed forest in Xiaoxinganling mountains was analyzed, based on observed data continuously in 2008 by using openpath eddy covariance system. The results showed that the CO2 flux changed from -0.46 to 0.42 mg&middot;m-2&middot;s-1during the whole growth season. The maximum uptake occurred at 9 o&rsquo;clock during June and the maximum efflux occurred at 5 o&rsquo;clock during July. During daytime, the carbon uptake increased with the temperature increasing when it was below 26.63℃. On the contrary, it decreased with temperature increasing when it was above 2663℃. During nighttime, the maximum efflux occurred 13.50℃. In all, it showed that carbon assimilation was 212.32 g&middot;m-2 during the whole growth season of natural broadleaved mixed forest in Xiaoxinganling mountains in 2008.

DOI

130
Yu G R, Chen Z, Piao S Let al., 2014c. High carbon dioxide uptake by subtropical forest ecosystems in the East Asian monsoon region.Proceedings of the National Academy of Sciences of the United States of America, 111: 4910-4915.Temperate- and high-latitude forests have been shown to contribute a carbon sink in the Northern Hemisphere, but fewer studies have addressed the carbon balance of the subtropical forests. In the present study, we integrated eddy covariance observations established in the 1990s and 2000s to show that East Asian monsoon subtropical forests between 20 °N and 40 °N represent an average net ecosystem productivity (NEP) of 362 ± 39 g C m(-2) yr(-1) (mean ± 1 SE). This average forest NEP value is higher than that of Asian tropical and temperate forests and is also higher than that of forests at the same latitudes in Europe-Africa and North America. East Asian monsoon subtropical forests have comparable NEP to that of subtropical forests of the southeastern United States and intensively managed Western European forests. The total NEP of East Asian monsoon subtropical forests was estimated to be 0.72 ± 0.08 Pg C yr(-1), which accounts for 8% of the global forest NEP. This result indicates that the role of subtropical forests in the current global carbon cycle cannot be ignored and that the regional distributions of the Northern Hemisphere's terrestrial carbon sinks are needed to be reevaluated. The young stand ages and high nitrogen deposition, coupled with sufficient and synchronous water and heat availability, may be the primary reasons for the high NEP of this region, and further studies are needed to quantify the contribution of each underlying factor.

DOI

131
Yu G R, Fu Y L, Sun X Met al., 2006a. Recent progress and future directions of ChinaFLUX.Science in China Series D, 36(S1): 1-21.

132
Yu G R, Gao Y, Wang Q Fet al., 2013a. Discussion on the key processes of carbon-nitrogen-water coupling cycles and biological regulation mechanisms in terrestrial ecosystem.Chinese Journal of Eco-Agriculture, 21(1): 1-13. (in Chinese)

133
Yu G R, He N P, Wang Q F, 2013c. Carbon Budget and Carbon Sink of Ecosystems in China: Theoretical Basis and Comprehensive Assessment. Beijing: Science Press. (in Chinese)

134
Yu G R, Song X, Wang Q Fet al., 2008. Water-use efficiency of forest ecosystems in eastern China and its relations to climatic variables.New Phytologist, 177(4): 927-937.Carbon (C) and water cycles of terrestrial ecosystems are two coupled ecological processes controlled partly by stomatal behavior. Water-use efficiency (WUE) reflects the coupling relationship to some extent. At stand and ecosystem levels, the variability of WUE results from the trade-off between water loss and C gain in the process of plant photosynthetic C assimilation. Continuous observations of C, water, and energy fluxes were made at three selected forest sites of ChinaFLUX with eddy covariance systems from 2003 to 2005. WUE at different temporal scales were defined and calculated with different C and water flux components. Variations in WUE were found among three sites. Average annual WUE was 9.43 mg CO(2) g(-1) H(2)O at Changbaishan temperate broad-leaved Korean pine mixed forest, 9.27 mg CO(2) g(-1) H(2)O at Qianyanzhou subtropical coniferous plantation, and 6.90 mg CO(2) g(-1) H(2)O at Dinghushan subtropical evergreen broad-leaved forest. It was also found that temperate and subtropical forest ecosystems had different relationships between gross primary productivity (GPP) and evapotranspiration (ET). Variations in WUE indicated the difference in the coupling between C and water cycles. The asynchronous response of GPP and ET to climatic variables determined the coupling and decoupling between C and water cycles for the two regional forest ecosystems.

DOI PMID

135
Yu G R, Sun X M, 2006. Principles of Flux Measurement in Terrestrial Ecosystems. Beijing: Higher Education Press: 1-508. (in Chinese)

136
Yu G R, Sun X M.2008. Flux Measurement and Research of Terrestrial Ecosystem in China. Beijing: Science Press: 1-676. (in Chinese)

137
Yu G R, Wang Q F, Fang H J, 2014b. Fundamental scientific issues, theoretical framework and relative research methods of carbon-nitrogen-water coupling cycles in terrestrial ecosystems.Quaternary Sciences, 34(4): 683-698. (in Chinese)The cycles of carbon nitrogen and water in terrestrial ecosystems are the three main substance cycles concerned by ecosystem ecology and global change science for a long time. They represent the energy flow nutrient and water cycles of global regional and typical ecosystems. However the cycles of carbon nitrogen and water in natural ecosystems are closely linked and coupled and are controlled and regulated by multiple biological physical and chemical processes. In this paper based on a comprehensive analysis of the theoretical and practical significances of carbon-nitrogen-water coupling cycles in terrestrial ecosystems we firstly explored the key processes of carbon-nitrogen-water coupling cycles in terrestrial ecosystems and raised the basic scientific issues in this research field. Second we mainly analyzed the biophysical processes of carbon nitrogen and water from vegetation-atmospheric soil-atmospheric and root-soil interfaces and clarified the biological and chemical processes of carbon nitrogen and water cycles in typical ecosystems. Third we pointed out the ecosystem ecological mechanisms constraining the carbon-nitrogen-water coupling cycles in terrestrial ecosystems as well as the biogeographical mechanisms constraining the spatial pattern of carbon-nitrogen-water coupling relationships. Finally on the basis of existing scientific studies we built up the logical framework for researching the carbon-nitrogen-water coupling cycles in terrestrial ecosystems and discussed the main technical approaches and methods for studying it.

DOI

138
Yu G R, Wen X F, Li Q Ket al., 2005. Seasonal patterns and environmental control of ecosystem respiration in subtropical and temperate forest in China.Science in China Series D, 48(S1): 93-105.Continuous measurement of carbon dioxide exchange using the eddy covariance (EC) technique was made at two ChinaFLUX forest sites including the young subtropical Pinus plantation (Qianyanzhou) and old temperate broad-leaved Korean pine mixed forest (Changbai Mountains) as part of the ChinaFLUX network. Seasonal patterns and environmental control of ecosystem respiration in the subtropical and temperate forests were evaluated by the often-used multiplicative model and Q10 model as a function of temperature and soil water content. The resuits suggested that ( i ) temperature was found to be a dominant factor in the ecosystem respiration, and most of the temporal variability of ecosystem respiration was explained by temperature. However, in the drought-stressed ecosystem, soil water content controlled the temporal variability of ecosystem respiration other than temperature effects, and soil water content became a dominat factor when severe drought affected the ecosystem respiration; (ii) the regression models analysis revealed that in the drier soil, ecosystem respiration was more sensitive to soil moisture than was expressed by the often-used multiplicative model. It was possible to accurately estimate the seasonal variation of ecosystem respiration based on the Q10 model; and (iii)annual ecosystem respiration derived from the often-used multiplicative model was 1209 g C m-2and 1303 g C m-2, and was consistently a little higher than the Q10 model estimates of 1197 g C m-2 and 1268 g C m-2 for Qianyanzhou and Changbai Mountains, respectively.

DOI

139
Yu G R, Wen X F, Sun X Met al., 2006b. Overview of ChinaFLUX and evaluation of its eddy covariance measurement.Agricultural and Forest Meteorology, 137: 125-137.The Chinese Terrestrial Ecosystem Flux Research Network (ChinaFLUX) is a long-term national network of micrometeorological flux measurement sites that measure the net exchange of carbon dioxide, water vapor, and energy between the biosphere and atmosphere. The ChinaFLUX network includes 8 observation sites (10 ecosystem types) and encompasses a large range of latitudes (21 degrees 57'N to 44 degrees 30'N), altitudes, climates and species. It relies on the existing Chinese Ecosystem Research Network (CERN), fills an important regional gap and increases the number of ecosystem types in FLUXNET. Data and site information are available online at the ChinaFLUX web sites (http://www.chinaflux.org/). Expanding the scope of the FLUXNET database, ChinaFLUX offers new opportunities to quantify and compare the magnitudes and dynamics of annual ecosystem carbon and water balance and to explore the biotic and abiotic effects on ecosystem processes of carbon dioxide and water vapor exchange that are unique to ecosystems in China, such as the vegetation communities on the Qinghai-Tibet plateau. Besides, ChinaFLUX also provides more insights to help define the current status and enable future prediction of the global biogeochemical cycles of carbon, water and trace gases. Recent findings from the ChinaFLUX network are summarized in both micrometeorological and ecological aspects. This paper also summarizes these results and makes recommendations for the research priorities in ChinaFLUX. (c) 2006 Elsevier B.V. All rights reserved.

DOI

140
Yu G R, Zhang L M, Sun X Met al., 2008. Environmental controls over carbon exchange of three forest ecosystems in eastern China.Global Change Biology, 14(11): 2555-2571.Net ecosystem productivity (NEP) was continuously measured using the eddy covariance (EC) technique from 2003 to 2005 at three forest sites of ChinaFLUX. The forests include Changbaishan temperate mixed forest (CBS), Qianyanzhou subtropical coniferous plantation (QYZ), and Dinghushan subtropical evergreen broad-leaved forest (DHS). They span wide ranges of temperature and precipitation and are influenced by the eastern Asian monsoon climate to varying extent. In this study, we estimated ecosystem respiration (RE) and gross ecosystem productivity (GEP). Comparison of ecosystem carbon exchange among the three forests shows that RE was mainly determined by temperature, with the forest at CBS exhibiting the highest temperature sensitivity among the three ecosystems. The RE was highly dependent on GEP across the three forests, and the ratio of RE to GEP decreased along the North-South Transect of Eastern China (NSTEC) (i.e. from the CBS to the DHS), with an average of 0.77 +/- 0.06. Daily GEP was mainly influenced by temperature at CBS, whereas photosynthetic photon flux density was the dominant factor affecting the daily GEP at both QYZ and DHS. Temperature mainly determined the pattern of the interannual variations of ecosystem carbon exchange at CBS. However, water availability primarily controlled the interannual variations of ecosystem carbon exchange at QYZ. At DHS, NEP attained the highest values at the beginning of the dry seasons (autumn) rather than the rainy seasons (summer), probably because insufficient radiation and frequent fog during the rainy seasons hindered canopy photosynthesis. All the three forest ecosystems acted as a carbon sink from 2003 to 2005. The annual average values of NEP at CBS, QYZ, and DHS were 259 +/- 19, 354 +/- 34, and 434 +/- 66 g C m(-2) yr(-1), respectively. The slope of NEP that decreased with increasing latitude along the NSTEC was markedly different from that observed on the forest transect in the European continent. Long-term flux measurements over more forest ecosystems along the NSTEC will further help verify such a difference between the European forest transect and the NSTEC and provide insights into the responses of ecosystem carbon exchange to climate change in China.

DOI

141
Yu G R, Zhang L M, Sun X M.2014a. Progresses and prospects of Chinese terrestrial ecosystem flux observation and research network (ChinaFLUX).Progress in Geography, 33(7): 903-917. (in Chinese)Eddy Covariance technique (EC) achieves the direct measurement of system functions and processes such as plant productivity, energy balance, and greenhouse gas exchange at ecosystem scale. Coordinated observation through the global flux observation network represents a breakthrough from the observation of ecological phenomena and factors to the measurement of changes in functions of the global ecosystem. This paper first reviews the foundation and development of the Chinese terrestrial ecosystem flux observation and research network (ChinaFLUX). It then systematically introduces the scientific objectives, design concept, measurement system, standardization of observed data, and long-term data accumulation of the network. The paper also assesses the main progresses in research of terrestrial carbon-water-nitrogen budgets, environmental responses of the coupled ecosystem carbon-nitrogen-water cycles, and the spatiotemporal patterns of ecosystem carbon fluxes and mechanisms. Based on an analysis of the trend of development and emerging missions of the global flux network, this paper proposes the directions, key scientific questions and emphases of research of ChinaFLUX to provide references for the development of flux observation and research in China.

DOI

142
Yu G R, Zheng Z M, Wang Q Fet al., 2010. Spatiotemporal pattern of soil respiration of terrestrial ecosystems in China: The development of a geostatistical model and its simulation.Environmental Science and Technology, 44: 6074-6080.

143
Yu G R, Zhu X J, Fu Y Let al., 2013b. Spatial patterns and climate drivers of carbon fluxes in terrestrial ecosystems of China.Global Change Biology, 19(3): 798-810.Understanding the dynamics and underlying mechanism of carbon exchange between terrestrial ecosystems and the atmosphere is one of the key issues in global change research. In this study, we quantified the carbon fluxes in different terrestrial ecosystems in China, and analyzed their spatial variation and environmental drivers based on the long-term observation data of ChinaFLUX sites and the published data from other flux sites in China. The results indicate that gross ecosystem productivity (GEP), ecosystem respiration (ER), and net ecosystem productivity (NEP) of terrestrial ecosystems in China showed a significantly latitudinal pattern, declining linearly with the increase of latitude. However, GEP, ER, and NEP did not present a clear longitudinal pattern. The carbon sink functional areas of terrestrial ecosystems in China were mainly located in the subtropical and temperate forests, coastal wetlands in eastern China, the temperate meadow steppe in the northeast China, and the alpine meadow in eastern edge of Qinghai-Tibetan Plateau. The forest ecosystems had stronger carbon sink than grassland ecosystems. The spatial patterns of GEP and ER in China were mainly determined by mean annual precipitation (MAP) and mean annual temperature (MAT), whereas the spatial variation in NEP was largely explained by MAT. The combined effects of MAT and MAP explained 79%, 62%, and 66% of the spatial variations in GEP, ER, and NEP, respectively. The GEP, ER, and NEP in different ecosystems in China exhibited positive coupling correlation in their spatial patterns. Both ER and NEP were significantly correlated with GEP, with 68% of the per-unit GEP contributed to ER and 29% to NEP. MAT and MAP affected the spatial patterns of ER and NEP mainly by their direct effects on the spatial pattern of GEP.

DOI

144
Yuan W P, Liu S G, Yu G R, 2010. Global estimates of evapotranspiration and gross primary production based on MODIS and global meteorology data.Remote Sensing of Environment, 114: 1416-1431.The simulation of gross primary production (GPP) at various spatial and temporal scales remains a major challenge for quantifying the global carbon cycle. We developed a light use efficiency model, called EC-LUE, driven by only four variables: normalized difference vegetation index (NDVI), photosynthetically active radiation (PAR), air temperature, and the Bowen ratio of sensible to latent heat flux. The EC-LUE model may have the most potential to adequately address the spatial and temporal dynamics of GPP because its parameters (i.e., the potential light use efficiency and optimal plant growth temperature) are invariant across the various land cover types. However, the application of the previous EC-LUE model was hampered by poor prediction of Bowen ratio at the large spatial scale. In this study, we substituted the Bowen ratio with the ratio of evapotranspiration (ET) to net radiation, and revised the RS-PM (Remote Sensing-Penman Monteith) model for quantifying ET. Fifty-four eddy covariance towers, including various ecosystem types, were selected to calibrate and validate the revised RS-PM and EC-LUE models. The revised RS-PM model explained 82% and 68% of the observed variations of ET for all the calibration and validation sites, respectively. Using estimated ET as input, the EC-LUE model performed well in calibration and validation sites, explaining 75% and 61% of the observed GPP variation for calibration and validation sites respectively. Global patterns of ET and GPP at a spatial resolution of 0.5 latitude by 0.6 longitude during the years 2000-2003 were determined using the global MERRA dataset (Modern Era Retrospective-Analysis for Research and Applications) and MODIS (Moderate Resolution Imaging Spectroradiometer). The global estimates of ET and GPP agreed well with the other global models from the literature, with the highest ET and GPP over tropical forests and the lowest values in dry and high latitude areas. However, comparisons with observed GPP at eddy flux towers showed significant underestimation of ET and GPP due to lower net radiation of MERRA dataset. Applying a procedure to correct the systematic errors of global meteorological data would improve global estimates of GPP and ET. The revised RS-PM and EC-LUE models will provide the alternative approaches making it possible to map ET and GPP over large areas because (1) the model parameters are invariant across various land cover types and (2) all driving forces of the models may be derived from remote sensing data or existing climate observation networks.

DOI

145
Zha T G, 2007. Carbon balance of a poplar plantation ecosystem in Daxing [D]. Beijing: Beijing Forestry University. (in Chinese)

146
Zhan X Y, Yu G R, He N Pet al., 2014. Nitrogen deposition and its spatial pattern in main forest ecosystems along north-south transect of eastern China.Chinese Geographical Science, 24(2): 137-146.A continuous three-year observation(from May 2008 to April 2011)was conducted to characterize the spatial variation of dissolved inorganic nitrogen(DIN)deposition at eight main forest ecosystems along the north-south transect of eastern China(NSTEC).The results show that both throughfall DIN deposition and bulk DIN deposition increase from north to south along the NSTEC.Throughfall DIN deposition varies greatly from 2.7 kg N/(ha·yr)to 33.0 kg N/(ha·yr),with an average of 10.6 kg N/(ha·yr),and bulk DIN deposition ranges from 4.1 kg N/(ha·yr)to 25.4 kg N/(ha·yr),with an average of 9.8 kg N/(ha·yr).NH4+-N is the dominant form of DIN deposition at most sampling sites.Additionally,the spatial variation of DIN deposition is controlled mainly by precipitation.Moreover,in the northern part of the NSTEC,bulk DIN deposition is 17%higher than throughfall DIN deposition,whereas the trend is opposite in the southern part of the NSTEC.The results demonstrate that DIN deposition would likely threaten the forest ecosystems along the NSTEC,compared with the critical loads(CL)of N deposition,and DIN deposition in this region is mostly controlled by agricultural activities rather than industrial activities or transportation.

DOI

147
Zhan X Y, Yu G R, He N Pet al., 2015. Inorganic nitrogen wet deposition: Evidence from the North-South Transect of Eastern China.Environmental Pollution, 204: 1-8.We examined the spatio-temporal variation of dissolved inorganic nitrogen (DIN) deposition in eight typical forest ecosystems of Eastern China for three consecutive years. DIN deposition exhibited an increasing gradient from north to south, with N NH4+ as the predominant contributor. DIN deposition in precipitation changed after interaction with the forest canopy, and serious ecological perturbations are expected in this region. DIN deposition presented seasonal fluctuations, which might be ascribed to agricultural activity, fossil-fuel combustion and environmental factors (i.e., wind direction, soil temperature). Notably, N fertilizer use (F-N), energy consumption (E), and precipitation (P) jointly explained 84.3% of the spatial variation in DIN deposition, of which FN (27.2%) was the most important, followed by E (24.8%), and finally P (9.3%). The findings demonstrate that DIN deposition is regulated by precipitation mainly via anthropogenic N emissions, and this analysis provides decision-makers a novel view for N pollution abatement. (C) 2015 Elsevier Ltd. All rights reserved.

DOI PMID

148
Zhang J H, Han S J, Yu G R, 2006a. Seasonal variation in carbon dioxide exchange over a 200-year-old Chinese broad-leaved Korean pine mixed forest.Agricultural and Forest Meteorology, 137: 150-165.There are uncertainties in estimate of annual carbon fluxes with eddy-covariance method. More work on advection and pressure fluxes is warranted.

DOI

149
Zhang L, Luo Y Q, Yu G Qet al., 2010. Estimated carbon residence times in three forest ecosystems of Eastern China: Applications of probabilistic inversion.Journal of Geophysical Research-Biogeosciences, 115: G01010.Carbon residence time is one critical parameter for predicting future land carbon sink dynamics but has not been well quantified for many plant and soil pools. This study applied a probabilistic inverse analysis of multiple observations to estimate mean residence times of carbon among three forest ecosystems in eastern China. Three assimilation experiments were conducted with either net ecosystem exchange data from eddy-flux measurements or six biometric and soil data (i.e., foliage biomass, fine root biomass, woody biomass, litterfall, soil organic carbon, and soil respiration) or all data to evaluate their relative effectiveness on estimation of carbon residence times of different pools in a terrestrial ecosystem model. Estimated mean residence times of carbon ranged from 2 to 10 months for metabolic litter and microbial biomass pools, from 1 to 3 years for foliage, fine root biomass, and structural litter pools, and from 17 to 1361 years for woody biomass, slow and passive soil organic matter pools at three forest sites. The residence times of carbon were longer for leaf, litter and microbes pools but shorter for fine root and wood pools in the young evergreen coniferous plantation at Qianyanzhou site than the two mature mixed forests at Changbaishan and Dinghushan sites. Carbon residence times were well constrained for three plant pools and slow soil organic matter by biometric and soil data, whereas residence times for metabolic and structural litter, and microbial biomass pools were constrained by daily net ecosystem exchange data. Overall, our study demonstrated that biometric, soil and net ecosystem exchange data are complementary in constraining mean residence times of an ecosystem model.

DOI

150
Zhang L M, Yu G R, Sun X Met al., 2006b. Seasonal variation of carbon exchange of typical forest ecosystems along the eastern forest transect in China.Science in China Series D, 49(S2): 47-62.The long-term and continuous carbon fluxes of Changbaishan temperate mixed forest (CBS), Qianyanzhou subtropical evergreen coniferous forest (QYZ), Dinghushan subtropical evergreen mixed forest (DHS) and Xishuangbana tropical rainforest (XSBN) have been measured with eddy covariance techniques. In 2003, different responses of carbon exchange to the environment appeared across the four ecosystems. At CBS, the carbon exchange was mainly determined by radiation and temperature. 0 degrees C and 10 degrees C were two important temperature thresholds; the former determined the length of the growing season and the latter affected the magnitude of carbon exchange. The maximum net ecosystem exchange (NEE) of CBS occurred in early summer because maximum ecosystem photosynthesis (G(PP)) occurred earlier than maximum ecosystem respiration (Re). During summer, QYZ experienced severe drought and NEE decreased significantly mainly as a result of the depression of GPP. At DHS and XSBN, NEE was higher in the drought season than the wet season, especially the conversion between carbon sink and source occurring during the transition season at XSBN. During the wet season, increased fog and humid weather resulted from the plentiful rainfall, the ecosystem G(PP) was dispressed. The Q(10) and annual respiration of XSBN were the highest among the four ecosystems, while the average daily respiration of CBS during the growing season was the highest. Annual NEE of CBS, QYZ, DHS and XSBN were 181.5, 360.9, 536.2 and -320.0 g(.)C(.)m(-2.)a(-1), respectively. From CBS to DHS, the temperature and precipitation increased with the decrease in latitude. The ratio of N-EE/R-e increased with latitude, while R-e/G(PP), ecosystem light use efficiency (L-UE), precipitation use efficiency and average daily GPP decreased gradually. However, XSBN usually escaped such latitude trend probably because of the influence of the south-west monsoon climate which does not affect the other ecosystems. Long-term measurement and more research were necessary to understand the adaptation of forest ecosystems to climate change and to evaluate the ecosystem carbon balance due to the complexity of structure and function of forest ecosystems.

DOI

151
Zhang L M, Yu G R, Sun X Met al., 2006c. Seasonal variations of ecosystem apparent quantum yield (α) and maximum photosynthesis rate (Pmax) of different forest ecosystems in China.Agricultural and Forest Meteorology, 137: 176-187.

152
Zhang L P, 2010. Characteristics of CO2 flux in a Chinese Fir plantations ecosystem in Huitong County, Human Province [D]. Changsha: Central South University of Forestry and Technology. (in Chinese)

153
Zhang L, Yu G R, Luo Y Qet al., 2009. Carbon cycle modeling of a broad-leaved Korean pine forest in Changbai Mountain of China using the model-data fusion approach.Chinese Journal of Plant Ecology, 33(6): 1044-1055. (in Chinese)<EM>Aims</EM> Our objective was to use multiple terrestrial carbon observations to improve existing terrestrial ecosystem models. <BR><EM>Methods</EM> We conducted a Bayesian probabilistic inversion to estimate the key parameter (i.e., carbon residence time) of a terrestrial ecosystem model (TECO) by using biometric and eddy covariance flux data measured at a temperate broad-leaved Korean pine forest in Changbai Mountain (CBS) of China from 2003 to 2005. We then estimated carbon stocks, carbon fluxes and uncertainties with posterior estimates of parameters. Biometric measurements consisted of foliage biomass, fine root biomass, woody biomass, litterfall, soil organic matter (<EM>SOM</EM>) and soil respiration. <BR><EM>Important findings</EM> Residence times of carbon for most pools can be constrained by eddy covariance flux and biometric measurements, except for the passive soil organic matter pool. Estimated residence times of C ranged from 2 to 6 months for litter and microbial biomass pools, 1 to 2 years for foliage and fine root biomass, 8 to 16 years for slow <EM>SOM</EM> pool and 77–109 and 409–1 879 years for woody biomass and passive <EM>SOM</EM> pools, respectively. Model results showed that the prediction uncertainties of carbon stocks and accumulated carbon fluxes increased with time. When air temperature increased 10% and 20%, annual gross primary productivity (<EM>GPP</EM>) increased 6.5% and 9.9%, but annual net ecosystem productivity (<EM>NEP</EM>) changed with soil temperature. If soil temperature is constant, annual <EM>NEP</EM> increased 11.4%–21.9% and 17.6%–33.1%, while if soil temperature increased 10% and 20%, annual <EM>NEP</EM> decreased to a level that was lower than that under ambient temperature. Given the same climate condition and seasonal variation for leaf area index during 2003–2005, annual <EM>NEP</EM> and soil respiration in 2020 would be 163±12 and 721±14 g C·m<SUP>–2</SUP>·a<SUP>–1</SUP>. Markov Chain Monte Carlo method is an effective way to estimate model parameters and to evaluate model prediction uncertainties. However, more studies are needed on a) estimation of residence time of C for passive soil organic matter, b) uncertainty analysis of input data and model structure and c) model-data fusion methods so as to improve the prediction accu-racy of terrestrial ecosystem models. <BR>

DOI

154
Zhang M, Yu G R, Zhang L Met al., 2010. Impact of cloudiness on net ecosystem exchange of carbon dioxide in different types of forest ecosystems in China.Biogeosciences, 7: 711-722.Clouds can significantly affect carbon uptake of forest ecosystems by affecting incoming solar radiation on the ground, temperature and other environmental factors. In this study, we analyzed the effects of cloudiness on the net ecosystem exchange of carbon dioxide (NEE) of a temperate broad-leaved Korean pine mixed forest at Changbaishan (CBS) and a subtropical evergreen broad-leaved forest at Dinghushan (DHS) of ChinaFLUX, based on the flux data obtained during June-August from 2003 to 2006. The results showed that the response of the NEE of forest ecosystem to photosynthetically active radiation (PAR) was different under clear sky and cloudy sky conditions, and this difference was not consistent between CBS and DHS. Compared with clear skies, light-saturated maximum photosynthetic rate (P) of CBS during mid-growing season (from June to August) was respectively enhanced by 34%, 25%, 4% and 11% on cloudy skies in 2003, 2004, 2005 and 2006; however, Pof DHS was higher under clear skies than under cloudy skies from 2004 to 2006. NEE of forests at CBS reached its maximum when the clearness index (k) was between 0.4 and 0.6, and the NEE decreased obviously when kexceeded 0.6. Compare with CBS, although NEE of forest at DHS tended to the maximum when kvaried between 0.4 and 0.6, the NEE did not decrease noticeably when kexceeded 0.6. The results indicated that cloudy sky conditions were more beneficial to carbon uptake for the temperate forest ecosystem rather than for the subtropical forest ecosystem. This is due to the fact that the non-saturating light conditions and increase of diffuse radiation were more beneficial to photosynthesis, and the reduced temperature was more conducive to decreasing the ecosystem respiration in temperate forest ecosystems under cloudy sky conditions. This phenomenon is important to evaluate carbon uptake of temperate forests under climate change conditions.

DOI

155
Zhang M, Yu G R, Zhang L Met al., 2009. Effects of solar radiation on net ecosystem exchange of broadleaved-Korean pine mixed forest in Changbai Mountain, China.Chinese Journal of Plant Ecology, 33(2): 270-282. (in Chinese)<EM>Aims</EM>Solar radiation can affect net ecosystem exchange (<EM>NEE</EM>) of carbon dioxide of forests, because cloud cover alters solar radiation, which in turn alters other environmental factors such as temperature and vapor pressure deficit. Our objective was to analyze the effects of these changes on <EM>NEE</EM> of broad-leaved-Korean pine (<EM>Pinus koraiensis</EM>) mixed forest in Changbai Mountain. <BR><EM>Methods</EM>Our analysis was based on 30-min flux data and routine meteorology data for mid-growing season (June to August) for 2003–2006. <BR><EM>Important findings</EM>Cloud cover significantly increased<EM> NEE</EM>. The light-saturated maximum photosynthetic rate was enhanced 34%, 25%, 4% and 11% on cloudy days compared with clear days in the four years of study. Relative irradiance and clearness index (<EM>k<SUB>t</SUB></EM>) were important in quantifying the effects of cloud cover, cloud shape and cloud thickness on solar radiation. When kt was about 0.5,<EM> NEE</EM> reached its maximum. When the relative irradiance was over the critical relative irradiance of 37%, <EM>NEE</EM> was enhanced; maximum <EM>NEE </EM>occurred at about 75%. Enhancement of <EM>NEE </EM>was ascribed to increased canopy assimilation and decreased above-ground respiration, which resulted from increased diffuse radiation and decreased air temperature and vapor pressure deficit with increased cloudiness. <BR>

DOI

156
Zhang M, Yu G R, Zhuang Jet al., 2011. Effects of cloudiness change on net ecosystem exchange, light use efficiency, and water use efficiency in typical ecosystems of China.Agricultural and Forest Meteorology, 151(7): 803-816.As a weather element, clouds can affect CO(2) exchange between terrestrial ecosystems and the atmosphere by altering environmental conditions, such as solar radiation received on the ground surface, temperature, and moisture. Based on the flux data measured at five typical ecosystems of China during mid-growing season (June-August) from 2003 to 2006, we analyzed the responses of net ecosystem exchange of carbon dioxide (NEE), light use efficiency (LUE, defined as Gross ecosystem photosynthesis (GEP)/Photosynthetically active radiation (PAR)), and water use efficiency (WUE, defined as GEP/Evapotranspiration (ET)) to the changes in cloudiness. The five ecological sites included Changbaishan temperate mixed forest (CBS), Dinghushan subtropical evergreen broad-leaved forest (DHS), Xishuangbanna tropical rainforest (XSBN), Inner Mongolia semi-arid Leymus chinensis steppe (NMG), and Haibei alpine frigid Potentilla fruticosa shrub (HB). Our analyses show that cloudy sky conditions with cloud index (k(t)) values between 0.4 and 0.6 increased NEE, LUE, and WUE of the ecosystems at CBS, DHS, NMG and HB from June to August. The LUE of tropical rainforest at XSBN was higher under cloudy than under clear sky conditions, but NEE and WUE did not decrease significantly under clear sky conditions from June to August. The increase in GEP with increasing diffuse radiation received by ecosystems under cloudy skies was the main reason that caused the increases in LUE and net carbon uptake in forest ecosystem at CBS, DHS, and alpine shrub ecosystem at HB, compared with clear skies. Moreover, for the ecosystem at CBS, DHS, and HB, when sky condition became from clear to cloudy, GEP increased and ET decreased with decreasing VPD, leading to the increase in WUE and NEE under cloudy sky conditions. The decrease in Re with decreasing temperature and increase in GEP with decreasing VPD under cloudy skies led to the increase in LUE. WUE, and net carbon uptake of semi-arid steppe at NMG, compared to clear skies. These different responses among the five ecosystems are attributable to the differences in canopy characteristics and water conditions. From June to August, the peaks of the k(t) frequency distribution in temperate ecosystems (e.g., CBS, NMG, and HB) were larger than 0.5, but they were smaller than 0.4 in subtropical/tropical forest ecosystems (e.g., DHS and XSBN). These results suggest that the pattern of cloudiness during the years from 2003 to 2006 in the five ecosystems was not the best condition for their net carbon uptake. This study highlights the importance of cloudiness factor in the prediction of net carbon absorption in the Asia monsoon region under climate change. (C) 2011 Elsevier B.V. All rights reserved.

DOI

157
Zhang S C, Sun X M, Wang J Let al., 2011. Short-term variations of vapor isotope ratios reveal the influence of atmospheric processes.Journal of Geographical Sciences, 21: 401-416.Stable isotopes of atmospheric water vapor reveal rich information on water movement and phase changes in the atmosphere. Here we presented two nearly continuous time-series of <i>&#948;</i>D and <i>&#948;</i> <sup>18</sup>O of atmospheric water vapor (<i>&#948;</i> <sub>v</sub>) measured at hourly intervals in surface air in Beijing and above a winter wheat canopy in Shijiazhuang using in-situ measurement technique. During the precipitation events, the <i>&#948;</i> <sub>v</sub> values in both Beijing and Shijiazhuang were in the state of equilibrium with precipitation water, revealing the influence of precipitation processes. However, the <i>&#948;</i> <sub>v</sub> departures from the equilibrium state were positively correlated with local relative humidity. Note that the <i>&#948;</i> <sub>v</sub> tended to enrich in Beijing, but deplete in Shijiazhuang during the precipitation events, which mainly resulted from the influence of transpiration processes that enriched the <i>&#948;</i> <sub>v</sub> in Shijiazhuang. On seasonal time-scale, the <i>&#948;</i> <sub>v</sub> values were log-linear functions of water vapor mixing ratios in both Beijing and Shijiazhuang. The water vapor mixing ratio was an excellent predictor of the <i>&#948;</i> <sub>v</sub> by the Rayleigh distillation mechanisms, indicating that air mass advection could also play an important role in determining the <i>&#948;</i> <sub>v</sub>. On a diurnal time-scale, the <i>&#948;</i> <sub>v</sub> reached the minimum in the early afternoon hours in Beijing which was closely related to the atmospheric processes of boundary layer entrainment. During the peak of growing season of winter wheat, however, the <i>&#948;</i> <sub>v</sub> reached the minimum in the early morning, and increased gradually through the daytime, and reached the maximum in the late afternoon, which was responsible by the interaction between boundary layer entrainment and the local atmospheric processes, such as transpiration and dew formation. This study has the implications for the important role of vegetation in determining the surface <i>&#948;</i> <sub>v</sub> and highlights the need to conduct <i>&#948;</i> <sub>v</sub> measurement on short-term (e.g. diurnal) time scales.

DOI

158
Zhang W L, 2007. Carbon fluxes of typical steppe and cropland ecosystems in the agri-pasture transition region of Inner Mongolia, China [D]. Beijing: Chinese Academy of Sciences. (in Chinese)

159
Zhang W L, Chen S P, Chen Jet al., 2007. Biophysical regulations of carbon fluxes of a steppe and a cultivated cropland in semiarid Inner Mongolia.Agricultural and Forest Meteorology, 146: 216-229.An increasing amount of grasslands in Inner Mongolia of Northern China has been converted to cropland. The conversions in this extensive semiarid region have produced adverse ecological consequences at local and regional scales (e.g., dust storms). An important research need is to understand the fundamental ecosystem processes, such as energy and material fluxes, associated with the land conversions. The carbon fluxes, including net ecosystem exchange (NEE), ecosystem respiration (RE), and gross primary production (GPP) in two contrasting land-use settings – a typical steppe and a crop field in Inner Mongolia – were measured in the growing season (May–September) of 2005 by deploying two eddy covariance flux towers. The diel amplitude of carbon fluxes varied substantially within the growing season, with the largest diel changes occurring in July. The daily maximum NEE of the two ecosystems occurred before noon, while maximum RE occurred around 16:00pm. There was no difference in RE between the cropland and the steppe at night. Daytime RE in the steppe was higher than that in the cropland in July and August, but slightly lower in other months. GPP was similar between the two ecosystems, in June, but much higher in the cropland than in the steppe in July. The steppe was converted from a weak carbon sink in May to a weak source or carbon neutral in June because of the relatively low soil volumetric water content (VWC) and the relatively high temperature. With higher GPP and lower RE, the cropland ecosystem acted as a stronger sink in July than the steppe. Temperature and soil water content were the main factors controlling NEE in this semiarid agriculture-pasture transition region.

DOI

160
Zhang Y P, Tan Z H, Song Q Het al., 2010. Respiration controls the unexpected seasonal pattern of carbon flux in an Asian tropical rain forest.Atmospheric Environment, 44: 3886-3893.lt;h2 class="secHeading" id="section_abstract">Abstract</h2><p id="">Tropical rain forests play important roles in the global carbon cycle. We report a six-year eddy covariance carbon flux campaign in a primary tropical seasonal rain forest in southwest China. An unexpected seasonal pattern of net ecosystem carbon exchange was detected, with carbon lost during the rainy season and stored in the dry season. Strong seasonality of ecosystem respiration was suggested to primarily account for this seasonal pattern. The annual net uptake of CO<sub>2</sub> by the forest varied from 0.98 to 2.35 metric tons of carbon per hectare between 2003 and 2008. 6-year averaged sink strength was 1.68 metric tons of carbon per hectare.</p>

DOI

161
Zhao F H, Yu G R, Li S Get al., 2007. Canopy water use efficiency of winter wheat in the North China Plain.Agricultural Water Management, 93(3): 99-108.Canopy water use efficiency ( W ), the ratio of crop productivity to evapotranspiration (ET), is critical in determining the production and water use for winter wheat ( Triticum aestivum L.) in the North China Plain, where winter wheat is a major crop and rainfall is scarce and variable. With the eddy covariance (EC) technique, we estimated canopy W of winter wheat at gross primary productivity ( W G ) and net ecosystem productivity ( W N ) levels from revival to maturing in three seasons of 2002/2003, 2003/2004 and 2004/2005 at Yucheng Agro-ecosystem Station. Meanwhile we also measured the biomass-based water use efficiency ( W B ). Our results indicate that W G , W N and W B showed the similar seasonal variation. Before jointing (revival-jointing), W G , W N and W B were obviously lower with the values of 2.09–3.5402g02C02kg 611 , 610.71 to 0.0602g02C02kg 611 and 1.37–4.0302g02kg 611 , respectively. After jointing (jointing-heading), the winter wheat began to grow vigorously, and W G , W N and W B significantly increased to 5.26–6.7802g02C02kg 611 , 1.47–1.8602g02C02kg 611 and 6.41–7.0302g02kg 611 , respectively. The maximums of W G , W N and W B occurred around the stage of heading. Thereafter, W G , W N and W B began to decrease. During the observed periods, three levels of productivity: GPP, NEP and aboveground biomass (AGB) all had fairly linear relationships with ET. The slopes of GPP–ET, NEP–ET and AGB–ET were 4.67–6.1202g02C02kg 611 , 1.50–2.0802g02C02kg 611 and 6.87–11.0202g02kg 611 , respectively. Generally, photosynthetically active radiation (PAR) and daytime vapor pressure deficit ( D ) had negative effects on W G , W N and W B except for on some cloudy days with low PAR and D . In many cases, W G , W N and W B showed the similar patterns. While there were still some obvious differences between them besides in magnitude, such as their significantly different responses to PAR and D on cloudy and moist days.

DOI

162
Zhao L, Li Y N, Xu S Xet al., 2006. Diurnal, seasonal and annual variation in net ecosystem CO2 exchange of an alpine shrubland on Qinghai-Tibetan Plateau.Global Change Biology, 12(10): 1940-1953.Abstract Thus far, grassland ecosystem research has mainly been focused on low-lying grassland areas, whereas research on high-altitude grassland areas, especially on the carbon budget of remote areas like the Qinghai-Tibetan plateau is insufficient. To address this issue, flux of COwere measured over an alpine shrubland ecosystem (37°36′N, 101°18′E; 325 above sea level [a. s. l.]) on the Qinghai-Tibetan Plateau, China, for 2 years (2003 and 2004) with the eddy covariance method. The vegetation is dominated by formation L. The soil is Mol–Cryic Cambisols. To interpret the biotic and abiotic factors that modulate COflux over the course of a year we decomposed net ecosystem COexchange (NEE) into its constituent components, and ecosystem respiration (). Results showed that seasonal trends of annual total biomass and NEE followed closely the change in leaf area index. Integrated NEE were 6158.5 and 6175.5 g C65m, respectively, for the 2003 and 2004 years. Carbon uptake was mainly attributed from June, July, August, and September of the growing season. In July, NEE reached seasonal peaks of similar magnitude (4–565g65C65m65day) each of the 2 years. Also, the integrated night-time NEE reached comparable peak values (1.5–265g65C65m65day) in the 2 years of study. Despite the large difference in time between carbon uptake and release (carbon uptake time < release time), the alpine shrubland was carbon sink. This is probably because the ecosystem respiration at our site was confined significantly by low temperature and small biomass and large day/night temperature difference and usually soil moisture was not limiting factor for carbon uptake. In general, was an exponential function of soil temperature, but with season-dependent values of . The temperature-dependent respiration model failed immediately after rain events, when large pulses of were observed. Thus, for this alpine shrubland in Qinghai-Tibetan plateau, the timing of rain events had more impact than the total amount of precipitation on ecosystem and NEE.

DOI

163
Zhao Z H, 2011. A study on carbon flux between Chinese fir planations and atmosphere in subtropical belts [D]. Changsha: Central South University of Forestry and Technology. (in Chinese)

164
Zheng H, Wang Q, Zhu Xet al., 2014. Hysteresis responses of evapotranspiration to meteorological factors at a diel timescale: Patterns and causes. PLoS One, 9: e98857.Evapotranspiration (ET) is an important component of the water cycle in terrestrial ecosystems. Understanding the ways in which ET changes with meteorological factors is central to a better understanding of ecological and hydrological processes. In this study, we used eddy covariance measurements of ET from a typical alpine shrubland meadow ecosystem in China to investigate the hysteresis response of ET to environmental variables including air temperature (Ta), vapor pressure deficit (VPD) and net radiation (Rn) at a diel timescale. Meanwhile, the simulated ET by Priestly-Taylor equation was used to interpret the measured ET under well-watered conditions. Pronounced hysteresis was observed in both Ta and VPD response curves of ET. At a similar Ta and VPD, ET was always significantly depressed in the afternoon compared with the morning. But the hysteresis response of ET to Rn was not evident. Similar hysteresis patterns were also observed in the Ta/VPD response curves of simulated ET. The magnitudes of the measured and simulated hysteresis loops showed similar seasonal variation, with relatively smaller values occurring from May to September, which agreed well with the lifetime of plants and the period of rainy season at this site. About 62% and 23% of changes in the strength of measured ET-Ta and ET-VPD loops could be explained by the changes in the strength of simulated loops, respectively. Thus, the time lag between Rn and Ta/VPD is the most important factor generating and modulating the ET-Ta/VPD hysteresis, but plants and water status also contribute to the hysteresis response of ET. Our research confirmed the different hysteresis in the responses of ET to meteorological factors and proved the vital role of Rn in driving the diel course of ET.

DOI PMID

165
Zheng H, Yu G, Wang Qet al., 2016. Spatial variation in annual actual evapotranspiration of terrestrial ecosystems in China: Results from eddy covariance measurements. Journal of Geographical Sciences. (Accepted)

166
Zheng X H, Mei B L, Wang Y Het al., 2008. Quantification of N2O fluxes from soil-plant systems may be biased by the applied gas chromatograph methodology.Plant and Soil, 311: 211-234.<a name="Abs1"></a>With regard to measuring nitrous oxide (N<sub>2</sub>O) emissions from biological sources, there are three most widely adopted methods that use gas chromatograph with an electron capture detector (GC&#8211;ECD). They use: (a) nitrogen (N<sub>2</sub>) as the carrier gas (DN); (b) ascarite as a carbon dioxide (CO<sub>2</sub>) trap with DN (DN-Ascarite); and (c) a mixture gas of argon and methane as the carrier (AM). Additional methods that use either a mixture of argon and methane (or of CO<sub>2</sub> and N<sub>2</sub>) as a make-up gas with the carrier nitrogen or soda lime (or ascarite) as a CO<sub>2</sub> trap with the carrier helium have also been adopted in a few studies. To test the hypothesis that the use of DN sometimes considerably biases measurements of N<sub>2</sub>O emissions from plants, soils or soil&#8211;plant systems, experiments were conducted involving DN, AM and DN-Ascarite. When using DN, a significant relationship appeared between CO<sub>2</sub> concentrations and the apparent N<sub>2</sub>O concentrations in air samples. The use of DN led to significantly overestimated N<sub>2</sub>O emissions from detached fresh plants in static chamber enclosures. Meanwhile, comparably lower emissions were found when using either the DN-Ascarite or AM methods. When an N<sub>2</sub>O flux (from a soil or a soil&#8211;plant system), measured by DN in combination with sampling from the enclosure of a static opaque chamber, was greater than 200&nbsp;&#956;g N m<sup>&#8722;2</sup> h<sup>&#8722;1</sup> no significant difference was found between DN and DN-Ascarite. When the DN-measured fluxes were within the ranges of &lt;&#8722;30, &#8722;30&#8211;0, 0&#8211;30, 30&#8211;100 and 100&#8211;200&nbsp;&#956;g N m<sup>&#8722;2</sup> h<sup>&#8722;1</sup> significant differences that amounted to &#8722;72, &#8722;22, 5, 38 and 64&nbsp;&#956;g N m<sup>&#8722;2</sup> h<sup>&#8722;1</sup> respectively, appeared in comparison to DN-Ascarite. As a result, the DN measurements in rice&#8211;wheat and vegetable fields overestimated both annual total N<sub>2</sub>O emissions (by 7&#8211;62%, <i>p</i>&#8201;&lt;&#8201;0.05) and direct emission factors for applied nitrogen (by 6&#8211;65%). These results suggest the necessity of reassessing the available data determined from DN measurements before they are applied to inventory estimation. Further studies are required to explore appropriate approaches for the necessary reassessment. Our results also imply that the DN method should not be adopted for measuring N<sub>2</sub>O emissions from weak sources (e.g., with intensities less than 200&nbsp;&#956;g N m<sup>&#8722;2</sup> h<sup>&#8722;1</sup>). In addition, we especially do not recommend the use of DN to simultaneously measure N<sub>2</sub>O and CO<sub>2</sub> with the same ECD.

DOI

167
Zheng Z M, Yu G R, Sun X Met al., 2010. Spatio-temporal variability of soil respiration of forest ecosystems in China: Influencing factors and evaluation model.Environment Management, 46(4): 633-642.Understanding the influencing factors of the spatio-temporal variability of soil respiration (R (s)) across different ecosystems as well as the evaluation model of R (s) is critical to the accurate prediction of future changes in carbon exchange between ecosystems and the atmosphere. R (s) data from 50 different forest ecosystems in China were summarized and the influences of environmental variables on the spatio-temporal variability of R (s) were analyzed. The results showed that both the mean annual air temperature and precipitation were weakly correlated with annual R (s), but strongly with soil carbon turnover rate. R (s) at a reference temperature of 0°C was only significantly and positively correlated with soil organic carbon (SOC) density at a depth of 20 cm. We tested a global-scale R (s) model which predicted monthly mean R (s) (R (s,monthly)) from air temperature and precipitation. Both the original model and the reparameterized model poorly explained the monthly variability of R (s) and failed to capture the inter-site variability of R (s). However, the residual of R (s,monthly) was strongly correlated with SOC density. Thus, a modified empirical model (TPS model) was proposed, which included SOC density as an additional predictor of R (s). The TPS model explained monthly and inter-site variability of R (s) for 56% and 25%, respectively. Moreover, the simulated annual R (s) of TPS model was significantly correlated with the measured value. The TPS model driven by three variables easy to be obtained provides a new tool for R (s) prediction, although a site-specific calibration is needed for using at a different region.

DOI PMID

168
Zhou G S, Wang Y, Zhou L, 2010. Seasonal Dynamics of Carbon Budget in Typical Maize and Paddy Ecosystem in the Liaohe River Delta of China. Beijing: China Agriculture Press. (in Chinese)

169
Zhou L Y, Jia B R, Zhou G Set al., 2010. Carbon exchange of Chinese boreal forest during its growth season and related regulation mechanisms.Chinese Journal of Applied Ecology, 21(10): 2449-2456. (in Chinese)<p>Based on the two-year continuous observation on the carbon exchange of Chinese boreal forest during its growth seasons in 2007 and 2008 by the method&nbsp;of open path eddy covariance, this paper analyzed the seasonal dynamics of the gross ecosystem productivity (<em>GEP</em>), ecosystem respiration (<em>R</em><sub>e</sub>), and net ecosystem carbon exchange (<em>NEE</em>) of the forest, with related regulation mechanisms approached. The <em>GEP</em> <em>R</em><sub>e</sub> and <em>NEE</em>of the forest reached to their maximum in the vigorous growth period from late June to mid August, but the dates of the maximum appeared differed. The mean daily <em>GEP</em> <em>R</em><sub>e</sub> and <em>NEE</em> were 19.45, 15.15, and -1.45 g CO<sub>2</sub>&middot;m<sup>-2</sup>&middot;d<sup>-1</sup> in 2007, and 17.67, 14.11, and -1.37 g CO<sub>2</sub>&middot;m<sup>-2</sup>&middot;d<sup>-1</sup>in 2008, respectively. The intensity of the carbon exchange during growth season was obviously&nbsp;stronger in 2007 than in 2008, possibly due to the higher mean air temperature (12.46 ℃ in 2007 vs. 11.04 ℃ in 2008) and the higher mean photosynthetically active radiation (<em>PAR</em>) (697 &mu;mol&middot;m<sup>-2</sup>&middot;s<sup>-1</sup> in 2007 vs. 639 &mu;mol&middot;m<sup>-2</sup>&middot;s<sup>-1</sup> in 2008). The <em>GEP</em> had close linear relationships with air temperature and <em>PAR</em> and the correlation coefficient of <em>GEP</em> and air temperature was around 0.55(<em>P</em>&lt;0.01). The <em>R</em><sub>e</sub> was mainly controlled by air temperature, with the correlation coefficient being 0.66-0.72 (<em>P</em>&lt;0.01), and the <em>NEE</em> was mainly controlled by <em>PAR</em> with the correlation coefficient being 0.59-0.63 (<em>P</em>&lt;0.01).</p>

170
Zhou L, Zhou G, Jia Q, 2009. Annual cycle of CO2 exchange over a reed (Phragmites australis) wetland in Northeast China.Aquatic Botany, 91(2): 91-98.Net ecosystem exchange of CO 2 (NEE) was measured during 2005 using the eddy covariance (EC) technique over a reed (Phragmites australis (Cav.) Trin. ex Steud.) wetland in Northeast China (121°54′E, 41°08′N). Diurnal NEE patterns varied markedly among months. Outside the growing season, NEE lacked a diurnal pattern and it fluctuated above zero with an average value of 0.07mgCO 2 m 612 s 611 resulting from soil microbial activity. During the growing season, NEE showed a distinct V-like diel course, and the mean daily NEE was 617.48±2.74gCO 2 m 612 day 611 , ranging from 6113.58gCO 2 m 612 day 611 (July) to 610.10gCO 2 m 612 day 611 (October). An annual cycle was also apparent, with CO 2 uptake increasing rapidly in May, peaking in July, and decreasing from August. Monthly cumulative NEE ranged... more Net ecosystem exchange of CO 2 (NEE) was measured during 2005 using the eddy covariance (EC) technique over a reed (Phragmites australis (Cav.) Trin. ex Steud.) wetland in Northeast China (121°54′E, 41°08′N). Diurnal NEE patterns varied markedly among months. Outside the growing season, NEE lacked a diurnal pattern and it fluctuated above zero with an average value of 0.07mgCO 2 m 612 s 611 resulting from soil microbial activity. During the growing season, NEE showed a distinct V-like diel course, and the mean daily NEE was 617.48±2.74gCO 2 m 612 day 611 , ranging from 6113.58gCO 2 m 612 day 611 (July) to 610.10gCO 2 m 612 day 611 (October). An annual cycle was also apparent, with CO 2 uptake increasing rapidly in May, peaking in July, and decreasing from August. Monthly cumulative NEE ranged from 61115±24gCm 612 month 611 (the reed wetland was a CO 2 sink) in July to 75±16gCm 612 month 611 (CO 2 source) in November. The annual CO 2 balance suggests a net uptake of 6165±14gCm 612 year 611 , mainly due to the gains in June and July. Cumulative CO 2 emission during the non-growing season was 327gCm 612 , much greater than the absolute value of the annual CO 2 balance, which proves the importance of the wintertime CO 2 efflux at the study site. The ratio of ecosystem respiration (R eco ) to gross primary productivity (GPP) for this reed ecosystem was 0.95, indicating that 95% of plant assimilation was consumed by the reed plant or supported the activities of heterotrophs in the soil. Daytime NEE values during the growing season were closely related to photosynthetically active radiation (PAR) (r 2 >0.63, p<0.01). Both maximum ecosystem photosynthesis rate (A max ) and apparent quantum yield (α) were season-dependent, and reached their peak values in July (1.28±0.11mgCO 2 m 612 s 611 , 0.098±0.027μmolCO 2 μmol 611 photon, respectively), corresponding to the observed maximum NEE in July. Ecosystem respiration (R eco ) relied on temperature and soil water content, and the mean value of Q 10 was about 2.4 with monthly variation ranging from 1.8 to 4.1 during 2005. Annual methane emission from this reed ecosystem was estimated to be about 3gCm 612 year 611 , and about 5% of the net carbon fixed by the reed wetland was released to the atmosphere as CH 4 . less

DOI

171
Zhou L, Zhou G, Liu Set al., 2010. Seasonal contribution and interannual variation of evapotranspiration over a reed marsh (Phragmites australis) in Northeast China from 3-year eddy covariance data.Hydrological Processes, 24(8): 1039-1047.

172
Zhu J X, He N P, Wang Q Fet al., 2015. The composition, spatial patterns, and influencing factors of atmospheric nitrogen deposition in Chinese terrestrial ecosystems.Sciences of Total Environment, 511: 777-785.

173
Zhu X J, Yu G R, Gao Y Net al., 2012. Fluxes of particulate carbon from rivers to the ocean and their changing tendency in China.Progress in Geography, 31(1): 118-122. (in Chinese)The river is the linkage of terrestrial and ocean carbon pools,the flux of which is a critical component of global carbon cycle.In this paper,The authors analyze the characteristics of the fluxes of particulate carbon from rivers to the ocean(FPC) in China and predicted their tendency based on the data obtained from Bulletin of Chinese River Sediment.The results indicate that,from 1965 to 2005,the annual mean FPC is 29.57TgC yr-1,36.02% of which is organic carbon,and the rest is inorganic carbon.FPC accounts for 42% of the river carbon fluxes.The quantity of particulate carbon flux from the Yangtze River,the Yellow River and the Pearl River accounts for 96.25% of the total amount in China.There is a decreasing tendency of FPC since 2003,while the ratio of organic part to the total shows an increasing tendency.The FPC of 2009 is only 6.59TgC.yr-1,which is only 22.3% of the annual mean FPC from 1965 to 2005.Therefore,it is necessary to lay emphasis on the fluxes of particulate carbon in terms of its significant role in river carbon fluxes and terrestrial carbon budget.

DOI

174
Zhu X J, Yu G R, He H Let al., 2014a. Geographical statistical assessments of carbon fluxes in terrestrial ecosystems of China: Results from upscaling network observations.Global and Planetary Change, 118: 52-61.

175
Zhu X J, Yu G R, Wang Q Fet al., 2014b. Seasonal dynamics of water use efficiency of typical forest and grassland ecosystems in China.Journal of Forest Research, 19(1): 70-76.We selected four sites of ChinaFLUX representing four major ecosystem types in China-Changbaishan temperate broad-leaved Korean pine mixed forest (CBS), Dinghushan subtropical evergreen broadleaved forest (DHS), Inner Mongolia temperate steppe (NM), and Haibei alpine shrub-meadow (HBGC)-to study the seasonal dynamics of ecosystem water use efficiency (WUE = GPP/ET, where GPP is gross primary productivity and ET is evapotranspiration) and factors affecting it. Our seasonal dynamics results indicated single-peak variation of WUE in CBS, NM, and HBGC, which were affected by air temperature (Ta) and leaf area index (LAI), through their effects on the partitioning of evapotranspiration (ET) into transpiration (T) (i.e., T/ET). In DHS, WUE was higher at the beginning and the end of the year, and minimum in summer. Ta and soil water content affected the seasonal dynamics of WUE through their effects on GPP/T. Our results indicate that seasonal dynamics of WUE were different because factors affecting the seasonal dynamics and their mechanism were different among the key ecosystems.

DOI

176
Zhu X J, Yu G R, Wang Q Fet al., 2015. Spatial variability of water use efficiency in China’s terrestrial ecosystems.Global and Planetary Change, 129: 37-44.

177
Zhu Y L, 2005. Carbon dioxide exchange between paddy ecosystem and the atmosphere in the subtropical region [D]. Beijing: Chinese Academy of Sciences and Ministry of Education. (in Chinese)

Outlines

/