Review Article

Agricultural drought monitoring:Progress, challenges, and prospects

  • LIU Xianfeng , 1, 2 ,
  • ZHU Xiufang 1, 2, * ,
  • PAN Yaozhong , 1, 2 ,
  • LI Shuangshuang 1, 3 ,
  • LIU Yanxu 4 ,
  • MA Yuqi 2
Expand
  • 1. State Key Laboratory of Earth Surface Processes and Resource Ecology, Beijing Normal University, Beijing 100875, China
  • 2. College of Resources Science & Technology, Beijing Normal University, Beijing 100875, China
  • 3. Academy of Disaster Reduction and Emergency Management, Beijing Normal University, Beijing 100875, China
  • 4. College of Urban and Environmental Sciences, Peking University, Beijing 100871, China

*Corresponding author: Pan Yaozhong (1965-), PhD and Professor, specialized in statistics and disaster remote sensing research. E-mail:

Author: Liu Xianfeng (1986-), PhD Candidate, specialized in resource and environmental remote sensing and disaster remote sensing. E-mail:

Received date: 2015-11-10

  Accepted date: 2015-12-15

  Online published: 2016-06-15

Supported by

Major Project of High-resolution Earth Observation System

Copyright

Journal of Geographical Sciences, All Rights Reserved

Abstract

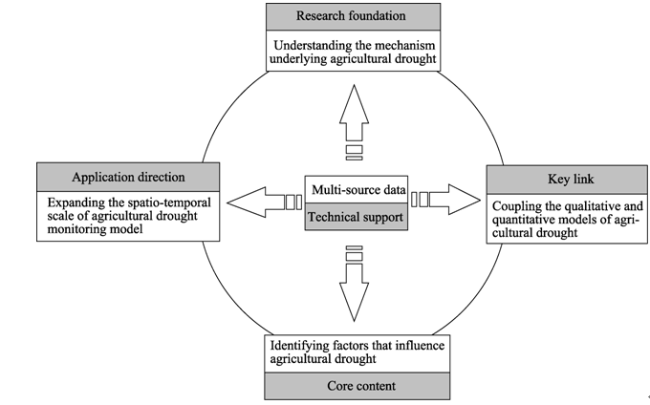
In this paper, we compared the concept of agricultural drought and its relationship with other types of droughts and reviewed the progress of research on agricultural drought monitoring indices on the basis of station data and remote sensing. Applicability and limitations of different drought monitoring indices were also compared. Meanwhile, development history and the latest progress in agricultural drought monitoring were evaluated through statistics and document comparison, suggesting a transformation in agricultural drought monitoring from traditional single meteorological monitoring indices to meteorology and remote sensing-integrated monitoring indices. Finally, an analysis of current challenges in agricultural drought monitoring revealed future research prospects for agricultural drought monitoring, such as investigating the mechanism underlying agricultural drought, identifying factors that influence agricultural drought, developing multi-spatiotemporal scales models for agricultural drought monitoring, coupling qualitative and quantitative agricultural drought evaluation models, and improving the application levels of remote sensing data in agricultural drought monitoring.

Cite this article

LIU Xianfeng , ZHU Xiufang , PAN Yaozhong , LI Shuangshuang , LIU Yanxu , MA Yuqi . Agricultural drought monitoring:Progress, challenges, and prospects[J]. Journal of Geographical Sciences, 2016 , 26(6) : 750 -767 . DOI: 10.1007/s11442-016-1297-9

1 Introduction

Global climate change, which is both the biggest problem and the most complicated challenge faced by human beings, has attracted the attention of the public and governments worldwide (Ye, 1992). The frequency and intensity of extreme climate events like drought have increased significantly since the 1970s. Since extreme climate events tend to be more abnormal, unexpected, unpredictable, and sensitive to climate change, they are considered the main source of terrestrial ecosystem instability and have a substantial impact on sustainable development of both ecosystems and human economy (Liu et al., 2015; Stocker et al., 2013). Moreover, according to the earth system model, the risk of global drought will further increase in the 21st century (Dai, 2011). Therefore, how to react to and reduce drought and its impact has become an urgent scientific issue. Among the various adverse effects of drought, its influence on agriculture is most significant and direct. According to statistics, economic loss due to global meteorological disasters accounts for 85% of that due to all natural disasters, and economic loss due to drought accounts for more than 50% of that due to all meteorological disasters. Agriculture, which is related to national food security and social stability, is severely constrained by the climate and weather (Dai, 2012). Therefore, research on agricultural drought has become the focus of governments and scholars worldwide.
Past experiences in dealing with major natural disasters have shown that risk aversion is more rewarding than disaster relief with respect to reducing hazard risks (Wu et al., 2015), and the 3rd UN World Conference on Disaster Reduction also emphasized the importance and urgency of disaster monitoring and loss preventing when establishing the goals and priorities of disaster reduction. Although agricultural drought monitoring is important for reducing disaster loss and impact, it is still poorly understood. Organizations and scholars worldwide have performed a series of fruitful research projects on the cause of drought and monitoring methods and influence of agricultural drought. For example, the Group on Earth Observations (GEO) has developed the Global Agricultural Monitoring (GLAM) initiative to evaluate agricultural drought monitoring (Fan et al., 2014). Some scholars have also summarized the concept of drought and its monitoring methods and developing trends systematically and comprehensively (AghaKouchak et al., 2015; Chen et al., 2009; Heim, 2002; Mishra et al., 2010; Wang et al., 2005; Zhang et al., 2011; Zhang et al., 2014). Since agricultural drought is associated with various subjects like agriculture, meteorology, hydrology, and plant physiology and it is an interaction field for natural systems and artificial systems, research on agricultural drought monitoring is faced with many difficulties both theoretically and technically (Li et al., 2012). Previous reports have mostly summarized agricultural drought studies with respect to drought indices, but a comprehensive understanding of agricultural drought monitoring field remained unclear. Therefore, it is necessary to sort out the monitoring methods and development history of agricultural drought.
Since agriculture provides the foundation of China’s economy and climate change will directly influence our food security and sustainable development (Zhao et al., 2010), breakthroughs are needed in the study of agricultural drought, both theoretically and technically, to help us deal with the negative influence of complicated climate change on agricultural production. In particular, summarizing the current status of agricultural drought monitoring is an important step for further theoretical studies and evaluation of novel methods. Therefore, the aim of this study was to summarize the concept, monitoring indices for agricultural drought, and review the development history and recent progress of agricultural drought monitoring through document statistical analysis and citation of important papers. Furthermore, challenges and weaknesses of previous studies and the future prospects have both been discussed to meet the practical need of the government to monitor agricultural drought.

2 Agricultural drought and monitoring methods

2.1 Concept of agricultural drought

Generally, drought is classified into meteorological drought, agricultural drought, hydrological drought, and socio-economic drought. Meteorological drought refers to the water deficit caused by an imbalance between precipitation and evaporation. Agricultural drought reflects the extent to which soil moisture is lower than the least requirement of plants by analyzing the characteristics of soil moisture and morphology of plants during growth. Hydrological drought occurs when river flow is lower than the normal value or when the water level of an aquifer decreases; and socio-economic drought is the phenomenon in which production and consumption are affected by the lack of water in both the natural system and human socio-economic system (Chen et al., 2009). Although the definitions of the four types of droughts are different, they are all water-deficit phenomena caused by the lack of precipitation, and they are all connected (Figure 1). When precipitation decreases, meteorological drought occurs first, followed by agricultural drought and hydrological drought, which gradually occur because of continuous water evaporation. Since agricultural drought is mainly concerned with water deficit in crops because of a reduction in water supply in the soil, loss of soil moisture caused by the decreases in precipitation is the earliest phenomenon. Because of transpiration, water in crops cannot meet the basic needs for physiological activities, and crop growth is suppressed, resulting in a reduction in crop yield or even failure. The influence of drought on different stages of plant growth is significantly different. Hydrological drought mainly causes a reduction in water resources in rivers and reservoirs and a decline in groundwater levels. Socio-economic drought is triggered when agricultural and hydrological droughts develop to a certain degree. Therefore, here is a simple understanding of the connection between all types of droughts: agricultural drought and hydrological drought refer to the influence of meteorological drought on agriculture and the hydrological system separately, and socio-economic drought refers to the influence of meteorological drought on the socio-economic system (Christopher et al., 2012; Zhang et al., 2014).
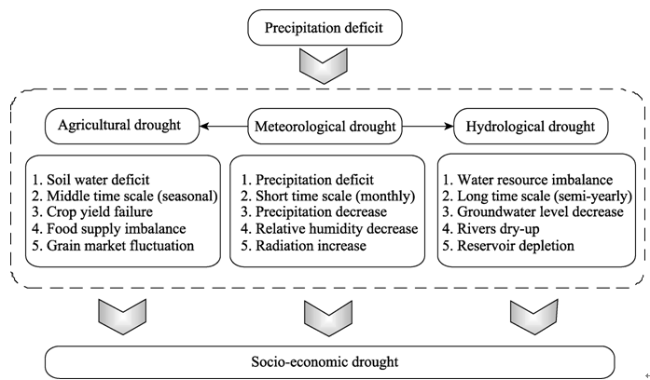
Figure 1 Drought transfer processes and interactions

2.2 Assessment methods for agricultural drought monitoring

Drought events are normally characterized by drought indices because the phenomenon is very complicated and the time, development process, and scope of influence are difficult to observe directly (Dai, 2011; Heim et al., 2002; Solomon et al., 2007). Currently, there are hundreds of indices to characterize drought, and they can be divided into site-based and remote sensing-based indices (Heim et al., 2002). Site-based indices include the standardized precipitation index (SPI), Palmer drought severity index (PDSI), and crop moisture index (CMI). Remote sensing-based indices are divided into indices based on bare surface (including thermal inertia and microwave moisture inversion) and indices based on vegetation cover. Vegetation-based drought monitoring indices can be further classified into crop morphological indices (like condition vegetation index and normalized vegetation index), crop physiological indices (like canopy temperature and canopy moisture content), and crop comprehensive indices (like vegetation supply water index and temperature-vegetation- drought index) (Figure 2 and Table 1).
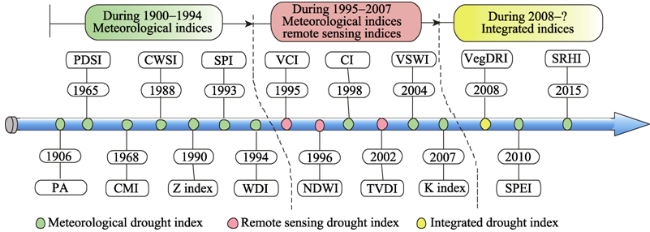
Figure 2 Development process of drought monitoring indices
2.2.1 Site-based drought monitoring
Research on drought monitoring initiated in the US in the early 20th century, and most early indices only took precipitation into consideration (Gibbs, 1967; Henry, 1906; Kincer, 1919; Marcovitch, 1930; McGuire et al., 1957; McQuigg, 1954; Munger, 1916; Van Rooy, 1965) until Palmer raised the concept of the current climate suitable precipitation (Palmer, 1965) and proposed PDSI in 1965. This index became a milestone for drought monitoring and was used both in America and other parts of the world and by governments and scholars as a drought monitoring tool. Palmer took the water demand of crops into consideration and developed CMI, which was broadly applied for agricultural drought monitoring (Palmer, 1968). Scholars gradually understood the limitations of PDSI (Alley, 1984; Heddinghaus et al., 1991), and Wells (2004) reported self-calibrated PDSI to overcome the limitations. The biggest advantage of this improved index is that it decides different calibration parameters according to the local climate characteristics and therefore improves the ability of PDSI to regions. However, PDSI still had limitations because of the fixed time scale. In terms of agricultural drought monitoring, Shafer (1982) and Jackson (1988) proposed the surface water supply index (SWSI) and crop water stress index (CWSI), respectively, after comprehensive consideration of surface water supply and crop water demand, and they both worked well. In 1993, McKee (1993) found that the observed precipitation has a skewed distribution rather than a normal distribution and proposed SPI; SPI has become one of the most popular indices because the calculation is simple and can achieve multi-scale monitoring for different types of drought. However, since it only considers precipitation and neglects the influence of evaporation on drought, the method was also incomplete. To integrate the effects of precipitation and evaporation on drought, Vicente-Serrano (2010) established the standardized precipitation and evaporation index (SPEI), which had the multi-scale advantage of SPI and the advantage of considering evaporation of PDSI. SPEI has become one of the ideal drought monitoring tools. Then, Vicente-Serrano (2012) compared the performances of SPI, SPEI, and PDSI with respect to global drought monitoring and found that SPI and SPEI were better than PDSI for hydrological and agricultural drought monitoring and that SPEI was excellent for monitoring summer drought. A recent study established the standardized relative humidity index (SRHI) by applying relative humidity data, and this index can detect the onset start of a drought earlier than SPI and is considered an ideal index for drought warning (Farahmand et al., 2015).
Table 1 Main meteorological and agricultural drought monitoring indices
Indices Proposed time Main author Indices description
PA 1906 Henry (1906) Drought occurs when precipitation during 21 days or a longer period is equal to or less than 30% of the normal precipitation.
PDSI 1965 Palmer (1965) Water deficit of actual water supply continues to be less than the local climate water supply in a period.
CMI 1968 Palmer (1968) Mainly used for agricultural drought monitoring and analyzing conditions of crop drought on the basis of a water balance model.
CWSI 1988 Jackson (1988) Determines crop water deficit by considering the relationship between soil moisture and farmland evapotranspiration on the basis of the water and energy balance principle.
Z 1990 Me (1990) Assumes that rainfall conforms to Person III distribution, and through precipitation normalization to determine drought index.
SPI 1993 McKee (1993) Reflects the probability of precipitation occurring during a certain period, which is suitable for monthly or even longer-scale drought monitoring.
WDI 1994 Moran (1994) This index is established by a combination of the differences between air and land surface temperature and vegetation index, considering the nearly linear relationship between vegetation cover and the most theoretical parameter in the crop water stress index.
VCI 1995 Kogan (1996) Overcomes the shortage of anomaly vegetation and normalized vegetation index, which can effectively monitor the spatiotemporal variation in drought.
NDWI 1996 Gao (1996) This index can effectively detect water content in vegetation canopy and respond promptly when vegetation undergoes water stress by introducing shortwave infrared bands.
CI 1998 Zhang (1998) Integrates the standardized precipitation index and relative humidity index, which is suitable for near real-time and historical meteorological drought.
TVDI 2002 Sandholt (2002) Characterizes crop water stress through the dry and wet equation determined by vegetation cover and surface temperature.
VSWI 2004 Haboudane This index, combined with the land surface temperature index and vegetation index, is used for agricultural drought monitoring.
SC-PDSI 2004 Wells (2004) This index is self-calibrated PDSI, which can determine model calibration parameters according to local climate characteristics.
K 2007 Wang(2007) This index, used for meteorological and agricultural droughts, is defined as the ratio of the relative variability in seasonal rainfall and relative variability in evaporation.
VegDRI 2008 Brown (2008) This is a synthesized drought index that includes information on vegetation, meteorology, and soil water capacity by using data mining.
SPEI 2010 Vicente-Serrano (2010) This index is a modified SPI, which introduces evapotranspiration data for calculating drought.
In China, scholars made considerable efforts to build drought monitoring indices continuously and have tried to integrate various meteorological indices to improve monitoring ability. Zhang (1998) proposed the comprehensive index (CI), which made weighted summation of the standardized precipitation index and relative humidity index, and this index is widely used for drought monitoring in meteorological departments of China. Wang (2007) proposed the K index, which is defined as the ratio of the relative variability in seasonal precipitation and the relative variability in evaporation; it is suitable for monitoring meteorological and agricultural droughts. In summary, the above review indicated that site-based drought monitoring indices have been developed over a long period, and it has become the main method for drought monitoring. In terms of data source, site-based indices mainly rely on the data records of meteorological stations. However, uncertainties still exist with respect to observed datasets, including uneven distribution in space and inconformity in time-series induced by site migration. Although a series of methods have been implemented to enhance observation station network density, such as addition of automatic weather stations, and develop data homogenization methods to correct abnormal sequences caused by non-climatic factors, there are few data records of new time series data and a shortage of stations in key ecological regions, especially in agricultural ecosystems.
2.2.2 Remote sensing-based drought monitoring
Since agricultural drought is closely connected to soil moisture and crop water deficit, remote sensing of water inversion in soil and vegetation is an effective way for large-scale agricultural monitoring. Data assimilation methods are generally used to estimate soil moisture (Kumar et al., 2014). Among these methods, thermal inertia models of different soil textures, established by Chen (1999), improved the accuracy of water inversion by introducing parameters of topography and wind field; however, the parameters are difficult to determine in practice. Then, Zhang (2001) integrated the thermal inertia model, heat balance model, and temperature difference model by using temperature differences of the soil and leaves facing the sun and away from the sun, developing a new method of soil moisture inversion on the basis of multi-angled remote sensing data. In addition, by applying the improved IEM model, Rajat Bindlish (2006) obtained an inversion result whose correlation with actual soil moisture was 0.95. Although microwave remote sensing can work continuously without being influenced by clouds, it is only capable of inverting the soil moisture of the surface (2-5 cm), while crop roots are usually 10-20 cm under the surface. Hence, water stress in crops cannot be examined accurately, and the result is highly uncertain (Chen et al., 2012). However, accurate estimation of soil moisture at different depths is very important, since it is a key parameter for agricultural drought monitoring. Therefore, despite the limitations of the applying remote sensing method to agricultural monitoring, further studies are still required; the microwave inversion results should be coupled with the terrestrial surface model, and field survey data should be collected to increase inversion accuracy and depth (AghaKouchak et al., 2015).
With respect to crop water deficit, CWSI was developed by analyzing the empirical relationship between air vapor and temperature differences of the canopy and air (Idso et al., 1981). Later, Moran (1994) developed the water deficit index (WDI) on the basis of the two-layer model of the energy balance model, while Gao (1996) proposed the normalized difference of water index (NDWI). To eliminate the influence of both Normalized Difference Vegetation Index (NDVI) spatial variation and other parameters of geography and ecosystem, Kogan (1995) proposed the vegetation condition index (VCI) for drought monitoring, and then Wang (2003) developed the vegetation temperature condition index (VTCI) in 2003. On basis of this, Kogan proposed the vegetation health index (VHI) by linear integration of TCI and VCI (Boken et al., 2004; Kogan et al., 2013), which was proven to be effective in reflecting the drought situation of crops (Mu et al., 2007). In 2004, Haboudane proposed the vegetation supply water index (VSWI), which is a relatively simple synthesis index for vegetation and temperature (Haboudane et al., 2004). Previous studies have shown that VSWI is appropriate for regions with high vegetation coverage, and it is widely applied in practice (Liu et al., 1998). Sandholt (2002) proposed the temperature vegetation drought index (TVDI) to estimate soil moisture on the basis of the relationship between land surface temperature (LST) and vegetation index (VI), which is an important method to reflect agricultural drought conditions through soil moisture monitoring. A hypothesis of TVDI is that NDVI is negatively correlated with LST (Karnieli et al., 2010). However, NDVI is negatively correlated with LST when water is the limitation factor of vegetation growth, whereas NDVI is positively correlated with LST when energy is the limiting factor of vegetation growth. Moreover, TVDI can well explain regions with drought episodes, but failure in performance of agricultural monitoring and earlier warning.
2.2.3 Comprehensive drought monitoring on the basis of both meteorological and remote sensing data
With the introduction of multi-source data, considerable efforts for drought monitoring were made to integrate meteorological and remote sensing data. By a review of recent studies on comprehensive drought monitoring indices, Hao (2015) pointed out that the US drought monitoring (USDM) model is a relatively successful model. However, application of USDM at a regional scale has many uncertainties because of its limited spatial resolution. Based on the classification and regression model, Brown (2008) proposed the vegetation drought response index (VegDRI) by combining meteorological drought indices (SPI and PDSI), the vegetation index, and DEM. The index can provide near real country-scale drought information and has become a model for comprehensive drought monitoring indices. Wu established an integrated drought monitoring model for different growth stage of crops in China (Wu et al., 2013; Wu et al., 2015). Du (2013) developed a synthesis drought index by using TRMM precipitation data, LST data, and VI data in Shandong Province, and it has achieved good results. By linear combination, Rhee (2010) proposed a drought monitoring index suitable for arid and humid regions by using a linear combination of LST, NDVI, and TRMM datasets, whereas Zhang (2013) established a meteorological drought index based on satellite-derived precipitation, AMSER-E soil moisture, and NDVI data. In addition, Mu (2013) developed a satellite-based near real drought severity index (DSI) by using land surface evapotranspiration and VI data, which could successfully detect the drought episode in Europe in 2003 and the Amazon drought in 2005 and 2010. Moreover, estimation by DSI is highly correlated with the results of PDSI at a site scale. By comparing different drought indices, Hao and AghaKouchak (2014) proposed the multi-variable drought index (MSDI), which combined precipitation and soil moisture data and is considered a valid drought monitoring index. In addition, AghaKouchak (2015) modified MSDI through introduced ensemble runoff prediction and carried out drought monitoring and early warning in East Africa. Deepthi (2015) proposed the multi-variable drought index (MDI), which comprehensively considers precipitation, runoff, evapotranspiration, and soil moisture and can simultaneously monitor meteorological, agricultural, and hydrological droughts. In addition, scholars recently attempted to assimilate historical data and real-time data to establish a data drive for near real drought monitoring indices (Shah and Mishra, 2015). On the basis of the aforementioned analysis, scholars have made considerable efforts to establish comprehensive drought monitoring indices and obtained valuable results. It should be noted that although several comprehensive drought indices have been proposed, the research is still in the infant stage. Moreover, multi-spatiotemporal scale drought monitoring indices are still required, and comprehensive drought monitoring indices have limitations. For example, although the linear combination method integrated multiple factors, it is difficult to explain the physical implication, whereas the copula function can obtain probability, facilitating risk analysis; however, it only considers the statistical characteristic of data and lacks a description of the physical process.

2.3 Review of previous studies on agricultural drought monitoring

To better understand the development stages of studies on agricultural drought monitoring, we searched for papers in the ISI Web of Science by using the terms “agricultural drought” and “drought monitor” on June 26, 2015. Statistics showed that both the number of papers and citations of them increased exponentially (Figure 3), and we also observed an increasing trend when we searched for “agricultural drought” and “drought monitor” in CNKI. The results showed that research on agricultural drought monitoring has become the focus of scholars worldwide, and the trend is significant after 2000.
Since drought is associated with various disciplines, scholars in different areas, such as geography, ecology, meteorology, and disaster have performed systematic studies on drought. To better analyze the studies, we searched the ISI Web of Science with the term “Drought” and obtained a total of 52376 papers (period: 1990-2014, search time: 6/26/2015).Through a literature review, we found large differences in the number of papers of different research orientations. The top three were botany, agronomy, and ecological environment, and they accounted for 25.97%, 22.68%, and 20.48%, respectively, of the total number of papers; and water resources and meteorology accounted for 7.98% and 7.72%, respectively; and geography only accounted for 6.82%.This distribution indicates that vegetation, agriculture, and ecological environment are most heavily and directly impacted by drought, and they have attracted worldwide attention (Figure 4).
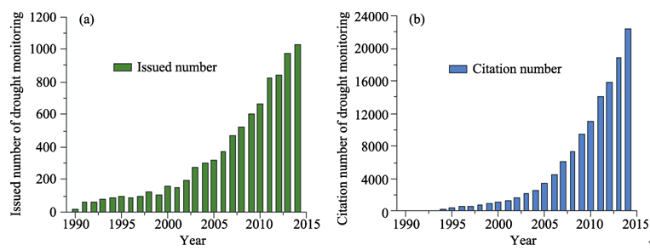
Figure 3 Statistics of issued and citation literatures in agricultural drought monitoring during 1990-2014
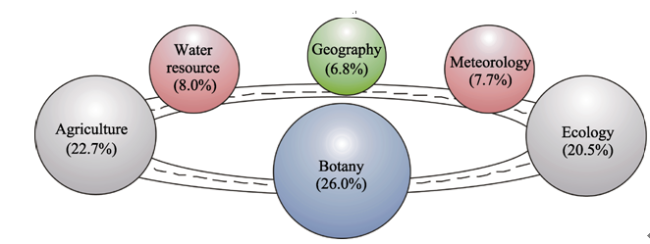
Figure 4 Statistics of issued literature relevant to drought in different subjects
We observed four main characteristics of the studies on agricultural drought monitoring on the basis of the paper review and citation. First, the distribution of research orientation for drought is diverse. Majority of the papers are about the influence of drought on the ecosystem, like on vegetation growth, production, and the fluctuation in carbon storage. In agriculture, previous studies mainly focused on assessing the impact of drought on crop growth and production. The IPCC report pointed out that the production of rice, maize, and wheat in Asia has decreased in the past decades because of increasing drought, mainly reflecting climate warming, frequent ENSO, and an increase in dry days (IPCC, 2007). Geographical and disaster studies focused on the spatial and temporal distribution, mechanism, and reduction of disasters. While papers on disaster spatiotemporal distribution are comparatively abundant and there are also profound studies on the cause of drought with respect to an analysis of the climate, there are few studies on drought monitoring, which is significant for disaster reduction (Du et al., 2013; Mishra and Desai, 2005; Mishra and Singh, 2009; Mishra et al., 2009). Second, the method suggested a transformation of agricultural drought monitoring from traditional single meteorological monitoring indices to meteorology and remote sensing-integrated monitoring indices, and new data mining methods, including classification and regression tree, linear weighting, copula, and Bayes network, were introduced. For example, Brown (2008) integrated VI, meteorological drought index, and auxiliary data to develop the vegetation drought response index, which is widely used in the US for drought assessment. Rhee (2010) and Zhang (2013) discussed the performance of drought monitoring from different linear combinations of precipitation, vegetation, and LST in meteorological and agricultural droughts. Anderson (2012) proposed a drought monitoring method by combining multiple soil moisture datasets through the triple collocation analysis method, while Hao (2013) established multi-variable drought monitoring indices by using precipitation and soil moisture data. Third, with respect to the data collection method, traditional ground-based observation cannot reflect spatial characteristics because of its uneven distribution. A combination of gauged data and remote sensing data has become popular in recent studies, especially for remote sensing-based drought monitoring, because of the increase in different types of sensors and enhancement in spatial and temporal resolution. However, relatively short data records have limitations. Thus, we should highlight the construction of long-term surface parameter products by assimilation of multi-source datasets. In addition, development of satellite-based drought monitoring models are needed to enhance our ability to forecast drought, for example, the microwave remote sensed drought model (Kongoli et al., 2012; Rott et al., 2010). Fourth, in terms of drought monitoring products, several global-scale products were widely used, including the PDSI product developed by Dai (2004), SPEI products with a 0.5°×0.5° resolution developed by Vicente-Serrano (2010), and remote sensed global terrestrial drought severity index products developed by Mu (2013). Recently, Hao et al. (2014) released the global integrated drought monitoring and prediction system (GIDMaPS), including the near real-time drought monitoring model and seasonal prediction model, and it can provide global-scale meteorological drought and agricultural drought products. Together, the aforementioned drought products provide data support for global drought monitoring and assessment.

3 Challenges and prospects of agricultural drought monitoring

Compared with indices for meteorological drought monitoring, simple indices for agricultural drought monitoring can hardly show the influence of drought on crops and provide a warning in advance by reflecting the drought mechanism. Recently, development of remote sensing has provided opportunities for agricultural drought monitoring. Some studies that tried to monitor drought by means of integrating vegetation index, land surface temperature, precipitation, and other auxiliary data achieved some progress (Du, 2013; Rhee et al., 2010). However, whether the conclusions of these studies on specific regions can be widely applied at different scales still needs to be considered, and we can hardly compare results that ignored the resistance and lag effect of crops to drought; the predicted trend varies with different indices (Christopher, 2012). Considerable bias may exist in the assessment of the results. While previous studies have achieved advance drought warning by using SRHI, results show that this index shows better performance for warning than most current indices (Farahmand et al., 2015). Nevertheless, analysis of this is still limited in qualitative or univariate studies because the extent to which crop production gets impacted and reduced cannot be represented, and research on the agricultural drought mechanism is still a big problem.
Therefore, considering the urgent demand for agricultural drought monitoring in risk management and the developing trend, breakthroughs are needed, both in theory and in practice. Specifically, the following five aspects of agricultural drought monitoring may be the main development directions for the future (Figure 5). In theory, we need to further understand the mechanism and process of agricultural drought and identify the influencing factors and feedback mechanism to integrate multiple influencing factors and establish a synthesized drought monitoring model. We also need to build drought monitoring and warning models at multi-spatiotemporal scales, couple the drought monitoring model and crop growth model to bridge the qualitative description to semi-quantitative and even quantitative description for agricultural drought monitoring, and establish a new drought index that can monitor drought as well as predict crop failure. In practice, we need to use multi-source remote sensing data to a greater extent to facilitate agricultural drought monitoring.
Figure 5 Key research directions of agricultural drought monitoring in the future

3.1 Understanding the mechanism underlying agricultural drought

Soil moisture, a key parameter that integrates the responses of climate, soil, and vegetation to water balance and the influence of water balance on vegetation dynamics, plays a very important role in the terrestrial water cycle. Agricultural drought reflects the extent to which soil moisture is lower than crop demand water, resulting in crop wilting and even failure. Since the tolerance to soil water deficit is different among crops and regions, time lags to precipitation shortage and soil moisture deficit also differ, and the difference varies with the growing stage as well. With an increase in water shortage, evaporation decreases and the surface temperature increases, forming a positive feedback process. The precipitation model that neglects the abovementioned process cannot explain agricultural drought monitoring with respect to crop water balance. Currently, the comprehensive response process of crops to precipitation and temperature is still unclear, and we should further understand the crop drought mechanism. We should also make better use of the time lag between water deficiency and crop drought stress for early warning of drought.
In addition, agronomic parameters are the basic parameters for describing crop growth, and they are, therefore, an important aspect of research on the agricultural drought mechanism. The crop reflectance spectrum is significantly influenced by agronomic parameters, and the red edge, which is closely related to chlorophyll content, is one of the most important parameters. When crops are under water stress, the parameters values will change and further result in the displacement of the red edge. Therefore, analyzing variations in the crop reflectance spectrum by hyperspectral remote sensing provides a new angle for research on the agricultural drought mechanism. Since monitoring models can hardly detect the start and end time of agricultural drought, studies on the mechanism may be a key to solving the problem. Upon understanding the agricultural drought mechanism, we can predict the onset of drought in time and establish an agricultural drought remote sensing model on the basis of crop physiological and ecological characteristics, facilitating prompt measures for reducing drought-related losses and influences.

3.2 Identify factors that influence agricultural drought

Agricultural drought is caused by an abnormal decrease in precipitation, and it is influenced comprehensively by land surface temperature, evapotranspiration, soil properties, and physiological or ecological characteristics of the crop. We should pay more attention to factors closely related to agricultural drought in the future, understand the interaction mechanism, screen the key influencing factors to cause variations in drought, and create agricultural drought monitoring models based on multiple geological factors. In practice, since satellite remote sensing can acquire precise spatial and temporal information on the land surface and at a large scale, it is widely used in agricultural drought monitoring. It is considered an ideal data source because it provides not only information on the land surface environment but also information on crop growth, like vegetation index, land surface temperature, and precipitation. By using remote sensing as a data source, we can integrate soil characteristics and topography features and add both environment and crop information in the agricultural monitoring model to achieve the integration of multiple geological factors for drought monitoring.
Currently, some countries have already developed agricultural drought monitoring systems at country or regional scales, and satellite data-driven comprehensive models are being established (Brown et al., 2008). However, integration of remote sensing data with meteorological data obtained by stations has not been achieved. It should be noted that even though remote sensing data can be an effective supplement for meteorological data, because they cover large regions at a high frequency, they cannot fully replace the latter. The reason is that although land surface observation stations are few and unevenly distributed, the data are precise with a long time series and the most important data source for remote sensing data validation. Therefore, it is important to build a bridge between remote sensing monitoring models and meteorological observation models, integrating the advantages of both model types. To achieve this goal, technologies and methods still need improvement. For example, we should build a more complete ground observation network, develop a perfect coupling method, and determine a uniform influencing factor framework.

3.3 Expansion of the spatiotemporal scale of agricultural drought monitoring models

The concept of scale, both temporal and spatial scales, is frequently mentioned. For agricultural drought monitoring, there are intrinsic differences among the results at different spatial and temporal scales. For example, the monitoring result of months may be different from the result of years, and at a different spatial scale, the result may also vary with the input data. Previous studies have tried to create agricultural drought monitoring models at different temporal and spatial scales and achieved some models with good validation results at a regional scale (Du et al., 2013; Rhee et al., 2010). However, most studies were limited to specific regions and time scales, and the scale of the models should be further expanded. Therefore, how to integrate the existing agricultural drought monitoring models and develop new multi-scale agricultural drought monitoring models will be a key question for establishing a drought monitoring platform with multi-spatiotemporal scales in the future.
Agricultural drought monitoring provides information on crop growth and production worldwide, and it facilitates crop production prediction as well. However, since there are differences in the developing stage, technology level, and disaster reduction ability among different countries, the request for agricultural drought monitoring information also varies. Therefore, building an agricultural drought monitoring platform at multi-spatiotemporal scales not only meets the demand of different countries but is also significant for reducing the influence of drought and improving the ability to cope it worldwide. More specifically, (1) at temporal scales, monitoring models should be able to manage early warning at 10 days, a month, a season, a year, and a decade in regular situations, whereas during emergencies, the models should be able to monitor near real-time early warning. (2) At spatial scales, the model should satisfy the needs of the world, different continents, different countries, and different regions. How to achieve a monitoring platform at multi-spatiotemporal scales is a key issue for future research on agricultural drought monitoring.

3.4 Coupling qualitative and quantitative models for agricultural drought monitoring

Qualitative description accounts for the most in the results of existing agricultural drought monitoring model, and the lack of quantitative monitoring and warning assessment limits the association between monitoring results and practical loss assessment. Although technological methods for drought monitoring are developing fast, attention to methods for qualitative assessment of the results is still lacking. With the rapid development of numerical simulations and further understanding of the drought mechanism of crops, the crop growth model has made great progress with respect to quantitative assessment of agro-meteorological hazards, and it is considered the core step to push agricultural drought monitoring into the stage for quantitative assessment. The advantage of the crop growth model in agro-meteorological hazard assessment is that the mechanism is clear and it can reflect the active relationship between the growing process; crop production; and temperature, precipitation, and soil moisture at every growth stage. Therefore, we should use functions of the crop growth model when creating agricultural drought monitoring models in the future.
In terms of technology, the spatial crop vulnerable model can be drawn from station-scale vulnerable models through the scale upscaling algorithm, which is a promising method for coupling an agricultural drought monitoring model at a large scale and the crop growth model; it will become the core and critical point of agricultural drought monitoring. On the basis of spatial information, especially the advantage of remote sensing technology, and by improving the integration of indices for crop physiology, morphology, and soil moisture, we can achieve the coupling of an agricultural drought monitoring model at a large scale and the crop growth model, and create a remote sensing-based agricultural drought monitoring platform with a clear physical mechanism, multiple factors, and progress and at multiple scales. This is an ideal way for realizing the goal of reducing agricultural hazard loss to the largest extent.

3.5 Improving the applications of remote sensing data

Remote sensing is a very important data source for agricultural drought monitoring, and with launching of satellites for different uses, abundant remote sensing data are acquired by scholars to analyze land surface processes. Compared with ground observation data, the biggest challenge for remote sensing data is the short time sequence, which can barely present the variation in drought at a long time scale. The diversified temporal and spatial scales of different data sources also limit the comprehensive use of the data. Although we have developed transforming technology for multi-scale remote sensing data, comprehensive applications have not been completely achieved, especially with respect to applications of microwave remote sensing data for the influence of drought on vegetation (Andela et al., 2013). In future, we should enhance the use of remote sensing in drought monitoring by exploring more land surface parameters and increasing the applications of remote sensing data (Rodell, 2012).Uncertainties of remote sensing data are a key problem with respect to their applications, like the difference in uniformity caused by the change in sensors. Therefore, to develop data assimilation technology, upgrading the comprehensive applications and quantitative estimation of the uncertainties of remote sensing data are important. Finally, successful launches of new types of satellites such as the Soil Moisture Active Passive is offering new opportunities for agricultural drought monitoring, hence increasing the importance of remote sensing data in agricultural drought monitoring (Figure 6).
Figure 6 Current and future satellite missions relevant to drought monitoring

The authors have declared that no competing interests exist.

1
AghaKouchak A, 2015a. A multivariate approach for persistence-based drought prediction: Application to the 2010-2011 East Africa drought.Journal of Hydrology, 526: 127-135.

2
AghaKouchak A, Farahmand A, Melton F S.et al., 2015. Remote sensing of drought: Progress, challenges and opportunities.Reviews of Geophysics, 53: 452-480.This review surveys current and emerging drought monitoring approaches using satellite remote sensing observations from climatological and ecosystem perspectives. We argue that satellite observations not currently used for operational drought monitoring, such as near-surface air relative humidity data from the Atmospheric Infrared Sounder mission, provide opportunities to improve early drought warning. Current and future satellite missions offer opportunities to develop composite and multi-indicator drought models. While there are immense opportunities, there are major challenges including data continuity, unquantified uncertainty, sensor changes, and community acceptability. One of the major limitations of many of the currently available satellite observations is their short length of record. A number of relevant satellite missions and sensors (e.g., the Gravity Recovery and Climate Experiment) provide only a decade of data, which may not be sufficient to study droughts from a climate perspective. However, they still provide valuable information about relevant hydrologic and ecological processes linked to this natural hazard. Therefore, there is a need for models and algorithms that combine multiple data sets and/or assimilate satellite observations into model simulations to generate long-term climate data records. Finally, the study identifies a major gap in indicators for describing drought impacts on the carbon and nitrogen cycle, which are fundamental to assessing drought impacts on ecosystems.

DOI

3
Alley W M, 1984. The Palmer drought severity index: Limitations and assumptions.Journal of climate and applied meteorology, 23(7): 1100-1109.

4
Andela N, Liu Y Y, van Dijk A.et al., 2013. Global changes in dryland vegetation dynamics (1988-2008) assessed by satellite remote sensing: Comparing a new passive microwave vegetation density record with reflective greenness data.Biogeosciences, 10(10): 6657.Drylands, covering nearly 30% of the global land surface, are characterized by high climate variability and sensitivity to land management. Here, two satellite-observed vegetation products were used to study the long-term (1988-2008) vegetation changes of global drylands: the widely used reflective-based Normalized Difference Vegetation Index (NDVI) and the recently developed passive-microwave-based Vegetation Optical Depth (VOD). The NDVI is sensitive to the chlorophyll concentrations in the canopy and the canopy cover fraction, while the VOD is sensitive to vegetation water content of both leafy and woody components. Therefore it can be expected that using both products helps to better characterize vegetation dynamics, particularly over regions with mixed herbaceous and woody vegetation. Linear regression analysis was performed between antecedent precipitation and observed NDVI and VOD independently to distinguish the contribution of climatic and non-climatic drivers in vegetation variations. Where possible, the contributions of fire, grazing, agriculture and CO2 level to vegetation trends were assessed. The results suggest that NDVI is more sensitive to fluctuations in herbaceous vegetation, which primarily uses shallow soil water, whereas VOD is more sensitive to woody vegetation, which additionally can exploit deeper water stores. Globally, evidence is found for woody encroachment over drylands. In the arid drylands, woody encroachment appears to be at the expense of herbaceous vegetation and a global driver is interpreted. Trends in semi-arid drylands vary widely between regions, suggesting that local rather than global drivers caused most of the vegetation response. In savannas, besides precipitation, fire regime plays an important role in shaping trends. Our results demonstrate that NDVI and VOD provide complementary information and allow new insights into dryland vegetation dynamics.

DOI

5
Anderson W B, Zaitchik B F, Hain C R.et al., 2012. Towards an integrated soil moisture drought monitor for East Africa.Hydrology and Earth System Sciences, 16(8): 2893-2913.Drought in East Africa is a recurring phenomenon with significant humanitarian impacts. Given the steep climatic gradients, topographic contrasts, general data scarcity, and, in places, political instability that characterize the region, there is a need for spatially distributed, remotely derived monitoring systems to inform national and international drought response. At the same time, the very diversity and data scarcity that necessitate remote monitoring also make it difficult to evaluate the reliability of these systems. Here we apply a suite of remote monitoring techniques to characterize the temporal and spatial evolution of the 2010鈥2011 Horn of Africa drought. Diverse satellite observations allow for evaluation of meteorological, agricultural, and hydrological aspects of drought, each of which is of interest to different stakeholders. Focusing on soil moisture, we apply triple collocation analysis (TCA) to three independent methods for estimating soil moisture anomalies to characterize relative error between products and to provide a basis for objective data merging. The three soil moisture methods evaluated include microwave remote sensing using the Advanced Microwave Scanning Radiometer 鈥 Earth Observing System (AMSR-E) sensor, thermal remote sensing using the Atmosphere-Land Exchange Inverse (ALEXI) surface energy balance algorithm, and physically-based land surface modeling using the Noah land surface model. It was found that the three soil moisture monitoring methods yield similar drought anomaly estimates in areas characterized by extremely low or by moderate vegetation cover, particularly during the below-average 2011 long rainy season. Systematic discrepancies were found, however, in regions of moderately low vegetation cover and high vegetation cover, especially during the failed 2010 short rains. The merged, TCA-weighted soil moisture composite product takes advantage of the relative strengths of each method, as judged by the consistency of anomaly estimates across independent methods. This approach holds potential as a remote soil moisture-based drought monitoring system that is robust across the diverse climatic and ecological zones of East Africa.

DOI

6
Bindlish R, Jackson T J, Gasiewski A J.et al., 2006. Soil moisture mapping and AMSR-E validation using the PSR in SMEX02.Remote Sensing of Environment, 103(2): 127-139.Field experiments (SMEX02) were conducted to evaluate the effects of dense agricultural crop conditions on soil moisture retrieval using passive microwave remote sensing. Aircraft observations were collected using a new version of the Polarimetric Scanning Radiometer (PSR) that provided four C band and four X band frequencies. Observations were also available from the Aqua satellite Advanced Microwave Scanning Radiometer (AMSR-E) at these same frequencies. SMEX02 was conducted over a three-week period during the summer near Ames, Iowa. Corn and soybeans dominate the region. During the study period the corn was approaching its peak water content state and the soybeans were at the mid point of the growth cycle. Aircraft observations are compared to ground observations. Subsequently models are developed to describe the effects of corn and soybeans on soil moisture retrieval. Multiple altitude aircraft brightness temperatures were compared to AMSR-E observations to understand brightness temperature scaling and provide validation. The X-band observations from the two sensors were in reasonable agreement. The AMSR-E C-band observations were contaminated with anthropogenic RFI, which made comparison to the PSR invalid. Aircraft data along with ancillary data were used in a retrieval algorithm to map soil moisture. The PSR estimated soil moisture retrievals on a field-by-field comparison had a standard error of estimate (SEE) of 5.5%. The error reduced when high altitude soil moisture estimates were aggregated to 25 km resolution (same as AMSR-E EASE grid product resolution) (SEE鈭2.85%). These soil moisture products provide a validation of the AMSR retrievals. PSR/CX soil moisture images show spatial and temporal patterns consistent with meteorological and soil conditions. The dynamic range of the PSR/CX observations indicates that reasonable soil moisture estimates can be obtained from AMSR, even in areas of high vegetation biomass content (鈭4鈥8 kg/m2).

DOI

7
Boken V K, Hoogenboom G, Kogan F N.et al., 2004. Potential of using NOAA-AVHRR data for estimating irrigated area to help solve an inter-state water dispute.International Journal of Remote Sensing, 25(12): 2277-2286.The states of Alabama, Florida and Georgia dispute the apportioning of water from rivers that originate in Georgia and flow through the other two states. Florida and Alabama often claim that Georgia uses more than its fair share of water. In order to address such a dispute, an estimation of the total amount of water used for irrigation by different crops is required. Current estimates of irrigated areas are subject to errors because they are based entirely on survey questionnaires. In this paper, the potential of Advanced Very High Resolution Radiometer (AVHRR) on-board the National Oceanic Space Administration (NOAA) satellites is examined for estimating irrigated area. Two indices, a widely used Normalized Difference Vegetation Index (NDVI) and a newer Vegetation Health Index (VHI), were regressed against irrigated area for 1986, 1989, 1992, 1995 and 2000 for selected regions in Georgia (Baker and Mitchell counties, and Seminole and Decatur counties). The average VHI during a period from the third week of February to the end of September was better related to irrigated area than the corresponding NDVI; R 2 was above 0.80 as opposed to 0.49. It is concluded that the VHI, derived from three-channel AVHRR data, can be used to estimate irrigated area. By multiplying irrigated area with the application rate, the volume of irrigation used in a state can be determined, which can contribute to the solution of the water dispute.

DOI

8
Brown J F, Wardlow B D, Tadesse T.et al., 2008. The Vegetation Drought Response Index (VegDRI): A new integrated approach for monitoring drought stress in vegetation.GIScience & Remote Sensing, 45(1): 16-46.The development of new tools that provide timely, detailed-spatial-resolution drought information is essential for improving drought preparedness and response. This paper presents a new method for monitoring drought-induced vegetation stress called the Vegetation Drought Response Index (VegDRI). VegDRI integrates traditional climate-based drought indicators and satellite-derived vegetation index metrics with other biophysical information to produce a 1 km map of drought conditions that can be produced in near-real time. The initial VegDRI map results for a 2002 case study conducted across seven states in the north-central United States illustrates the utility of VegDRI for improved large-area drought monitoring.

DOI

9
Chen Huailiang, Feng Dingyuan, 1999. Estimate the deep soil moisture methods and models by using remote sensing data.Journal of Applied Meteorology, 10(2): 232-237. (in Chinese)

10
Chen Huailiang, Zhang Hongwei, Liu Ronghua.et al., 2009. Agricultural drought monitoring, forecasting and loss assessment in China.Technology Review, (11): 82-92. (in Chinese)This paper reviews the researches on agricultural drought monitoring, forecasting and loss assessment as well as the applications in China. While discussing and comparing different soil moisture monitoring methods, the paper focuses on Gstar-1 which is an automatic soil moisture detector with our own independent property right, and CSMI a new remote sensing monitoring index for soil moisture based on MODIS data, and gives a comprehensive introduction to the loss assessment in China. Through the real-time monitoring, forecasting and assessment of drought occurrence and development, this paper discusses how to reduce the influence of drought on agricultural production to the largest extent. Finally, some future research directions are proposed.

DOI

11
Chen Shulin, Liu Yuanbo, Wen Zuomin, 2012. Satellite retrieved of soil moisture: An overview.Advances in Earth Science, (11): 1192-1203. (in Chinese)lt;p>Soil moisture is a key variable influencing a variety of land surface processes. Accurate estimation of spatio-temporally distributed soil moisture is one of the challenging issues in quantitative remote sensing. This paper briefly describes the major algorithms for retrieving soil moisture using optical, passive-microwave and active-microwave remote sensing, or their combinations. The optical algorithms have relatively low accuracy of retrieval, but good spatial and temporal resolutions. The typical algorithms include the Index-based approach and the soil thermal inertia-based approach. The passive-microwave algorithms have relative high accuracy but low spatial resolutions. It can be grouped into the retrieval approaches for soil moisture only and the approaches for relevant parameters in addition to soil moisture. The active-microwave algorithms have generally high accuracy with a high spatial resolution. The algorithms can be divided into three classes: empirical, physical and semi-empirical approaches. In addition, a number of algorithms have been proposed, which combines in particular optical, passivemicrowave, or active-microwave data. Because the algorithms often combine the advantages of the multi-sensors, they can achieve a high accuracy with a good spatial resolution. With the achievement of retrieval techniques, several global soil moisture data sets have been generated. The widely used data sets include the European Remote Sensing satellites/ Meteorological Operational satellite programme (ERS/MetOp) data sets, the Advanced Microwave Scanning Radiometer for EOS (AMSR-E) data sets, and the Soil Moisture and Ocean Salinity (SMOS) data sets. The ERS/MetOp data sets provides global soil moisture data with a spatial resolution of 25-km so far since July, 1991, retrieved from the TU-Wien approach using C-band microwave data. The AMSR-E data sets provides global soil moisture data with a spatial resolution of 25-km for the period from June, 2002 to September, 2011, retrieved from the Land Parameter Retrieval Model (LPRM) using C-band and X-band microwave data. The SMOS data sets provides global soil moisture data with a spatial resolution of 40-km so far since November, 2009, retrieved from the L-band Microwave Emission of the Biosphere model (LMEB) using L-band microwave data. To improve retrieval accuracy of soil moisture, the new satellite sensors are scheduled to be launched into space, for example, the Phased Array type L-band Synthetic Aperture Radar-2 (PALSAR2) in 2013 and the Soil Moisture Active Passive (SMAP) in 2014.</p>

12
Dai A, 2011. Drought under global warming: A review. Wiley Interdisciplinary Reviews: Climate Change, 2(1): 45-65.

13
Dai A, 2012. Increasing drought under global warming in observations and models.Nature Climate Change, 3(1): 52-58.Historical records of precipitation, streamflow and drought indices all show increased aridity since 1950 over many land areas. Analyses of model-simulated soil moisture, drought indices and precipitation-minus-evaporation suggest increased risk of drought in the twenty-first century. There are, however, large differences in the observed and model-simulated drying patterns. Reconciling these differences is necessary before the model predictions can be trusted. Previous studies show that changes in sea surface temperatures have large influences on land precipitation and the inability of the coupled models to reproduce many observed regional precipitation changes is linked to the lack of the observed, largely natural change patterns in sea surface temperatures in coupled model simulations. Here I show that the models reproduce not only the influence of El Ni帽o-Southern Oscillation on drought over land, but also the observed global mean aridity trend from 1923 to 2010. Regional differences in observed and model-simulated aridity changes result mainly from natural variations in tropical sea surface temperatures that are often not captured by the coupled models. The unforced natural variations vary among model runs owing to different initial conditions and thus are irreproducible. I conclude that the observed global aridity changes up to 2010 are consistent with model predictions, which suggest severe and widespread droughts in the next 30-90 years over many land areas resulting from either decreased precipitation and/or increased evaporation.

DOI

14
Dai A, Trenberth K E, Qian T, 2004. A global dataset of Palmer Drought Severity Index for 1870-2002: Relationship with soil moisture and effects of surface warming.Journal of Hydrometeorology, 5(6): 1117-1130.

15
Du Lingtong, 2013. Drought monitoring model based on multi-source spatial information and its application [D]. Nanjing: Nanjing University. (in Chinese)

16
Du Lingtong, Tian Qingjiu, Yu Tao.et al., 2013. A comprehensive drought monitoring method integrating MODIS and TRMM data.International Journal of Applied Earth Observation and Geoinformation, 23: 245-253.Drought is a complex hazard caused by the breaking of water balance and it has always an impact on agricultural, ecological and socio-economic spheres. Although the drought indices deriving from remote sensing data have been used to monitor meteorological or agricultural drought, there are no indices that can suitably reflect the comprehensive information of drought from meteorological to agricultural aspects. In this paper, the synthesized drought index (SDI) is defined as a principal component of vegetation condition index (VCI), temperature condition index (TCI) and precipitation condition index (PCI). SDI integrates multi-source remote sensing data from moderate resolution imaging spectroradiometer (MODIS) and tropical rainfall measuring mission (TRMM) and it synthesizes precipitation deficits, soil thermal stress and vegetation growth status in drought process. Therefore, this method is favorable to monitor the comprehensive drought. In our research, a heavy drought process was accurately explored using SDI in Shandong province, China from 2010 to 2011. Finally, a validation was implemented and its results show that SDI is not only strongly correlated with 3-month scales standardized precipitation index (SPI3), but also with variation of crop yield and drought-affected crop areas. It was proved that this index is a comprehensive drought monitoring indicator and it can contain not only the meteorological drought information but also it can reflect the drought influence on agriculture. (C) 2012 Elsevier B.V. All rights reserved.

DOI

17
Fan Jinlong, Zhang Mingwei, Cao Guangzhen.et al., 2014. Global drought monitoring initiative with satellite data.Advances in Meteorological Science and Technology, 5: 54-57. (in Chinese)

18
Farahmand A, AghaKouchak A, Teixeira J, 2015. A vantage from space can detect earlier drought onset: An approach using relative humidity.Scientific Reports, 5: 8553.Each year, droughts cause significant economic and agricultural losses across the world. The early warning and onset detection of drought is of particular importance for effective agriculture and water resource management. Previous studies show that the Standard Precipitation Index (), a measure of precipitation deficit, detects drought onset earlier than other indicators. Here we show that satellite-based near surface air relative humidity data can further improve drought onset detection and early warning. This paper introduces the Standardized Relative Humidity Index (SRHI) based on the NASA Atmospheric Infrared Sounder () observations. The results indicate that the SRHI typically detects the drought onset earlier than the . While the mission was not originally designed for drought monitoring, we show that its relative humidity data offers a new and unique avenue for drought monitoring and early warning. We conclude that the early warning aspects of SRHI may have merit for integration into current drought monitoring systems.

DOI PMID

19
Field C B, 2012. Managing the Risks of Extreme Events and Disasters to Advance Climate Change adaptation: Special Report of the Intergovernmental Panel on Climate Change. Cambridge: Cambridge University Press.

20
Gao B, 1996. NDWI: A normalized difference water index for remote sensing of vegetation liquid water from space.Remote Sensing of Environment, 58(3): 257-266.The normalized difference vegetation index (NDVI), which is equal to (NIR- RED)/(NIR+RED), has been widely used for remote sensing of vegetation for many years. One weakness of this index is that the reflectance of RED channel has no sensitivity to changes in lead area index changes when the leaf area index is equal to 1 or greater due to strong chlorophyll absorption near 0.67 micron. In this paper, another index, namely the normalized difference water index (NDWI), is proposed for remote sensing of vegetation liquid water from space. NDWI is equal to [R(0.86 micrometers ) - R(1.24 micrometers )]/[R(0.86 micrometers ) + R(1.24 micrometers )], where R represents the apparent reflectance. At 0.86 micrometers and 1.24 micrometers , vegetation canopies have similar scattering properties, but slightly different liquid water absorption. The scattering by vegetation canopies enhances the weak liquid water absorption at 1.24 micrometers . As a result, NDWI is sensitive to changes in liquid water content of vegetation canopies. Spectral imaging data acquired with Airborne Visible Infrared Imaging Spectrometer (AVIRIS) over Jasper Ridge, California and Holland, Maine are used to demostrate the usefulness of NDWI. Comparisons between NDWI and NDVI images are also given. Because aerosol scattering effects in the 0.86-1.24 micrometers region are weak, NDWI is less sensitive to atmospheric effects that NDVI.

DOI

21
Gibbs W J, Maher J V, 1967. Rainfall deciles as drought indicators. Australian: Bureau of Meteorology.

22
Haboudane D, Miller J R, Pattey E.et al., 2004. Hyperspectral vegetation indices and novel algorithms for predicting green LAI of crop canopies: Modeling and validation in the context of precision agriculture.Remote Sensing of Environment, 90(3): 337-352.<h2 class="secHeading" id="section_abstract">Abstract</h2><p id="">A growing number of studies have focused on evaluating spectral indices in terms of their sensitivity to vegetation biophysical parameters, as well as to external factors affecting canopy reflectance. In this context, leaf and canopy radiative transfer models are valuable for modeling and understanding the behavior of such indices. In the present work, PROSPECT and SAILH models have been used to simulate a wide range of crop canopy reflectances in an attempt to study the sensitivity of a set of vegetation indices to green leaf area index (LAI), and to modify some of them in order to enhance their responsivity to LAI variations. The aim of the paper was to present a method for minimizing the effect of leaf chlorophyll content on the prediction of green LAI, and to develop new algorithms that adequately predict the LAI of crop canopies. Analyses based on both simulated and real hyperspectral data were carried out to compare performances of existing vegetation indices (Normalized Difference Vegetation Index [NDVI], Renormalized Difference Vegetation Index [RDVI], Modified Simple Ratio [MSR], Soil-Adjusted Vegetation Index [SAVI], Soil and Atmospherically Resistant Vegetation Index [SARVI], MSAVI, Triangular Vegetation Index [TVI], and Modified Chlorophyll Absorption Ratio Index [MCARI]) and to design new ones (MTVI1, MCARI1, MTVI2, and MCARI2) that are both less sensitive to chlorophyll content variations and linearly related to green LAI. Thorough analyses showed that the above existing vegetation indices were either sensitive to chlorophyll concentration changes or affected by saturation at high LAI levels. Conversely, two of the spectral indices developed as a part of this study, a modified triangular vegetation index (MTVI2) and a modified chlorophyll absorption ratio index (MCARI2), proved to be the best predictors of green LAI. Related predictive algorithms were tested on CASI (Compact Airborne Spectrographic Imager) hyperspectral images and, then, validated using ground truth measurements. The latter were collected simultaneously with image acquisition for different crop types (soybean, corn, and wheat), at different growth stages, and under various fertilization treatments. Prediction power analysis of proposed algorithms based on MCARI2 and MTVI2 resulted in agreements between modeled and ground measurement of non-destructive LAI, with coefficients of determination (<em>r</em><sup>2</sup>) being 0.98 for soybean, 0.89 for corn, and 0.74 for wheat. The corresponding RMSE for LAI were estimated at 0.28, 0.46, and 0.85, respectively.</p>

DOI

23
Hao Z, AghaKouchak A, 2013. Multivariate Standardized Drought Index: A parametric multi-index model.Advances in Water Resources, 57: 12-18.Defining droughts based on a single variable/index (e.g., precipitation, soil moisture, or runoff) may not be sufficient for reliable risk assessment and decision-making. In this paper, a multivariate, multi-index drought-modeling approach is proposed using the concept of copulas. The proposed model, named Multivariate Standardized Drought Index (MSDI), probabilistically combines the Standardized Precipitation Index (SPI) and the Standardized Soil Moisture Index (SSI) for drought characterization. In other words, MSDI incorporates the meteorological and agricultural drought conditions for overall characterization of drought. In this study, the proposed MSDI is utilized to characterize the drought conditions over several Climate Divisions in California and North Carolina. The MSDI-based drought analyses are then compared with SPI and SSI. The results reveal that MSDI indicates the drought onset and termination based on the combination of SPI and SSI, with onset being dominated by SPI and drought persistence being more similar to SSI behavior. Overall, the proposed MSDI is shown to be a reasonable model for combining multiple indices probabilistically.

DOI

24
Hao Z, AghaKouchak A, 2014. A Nonparametric Multivariate Multi-Index Drought Monitoring Framework.Journal of Hydrometeorology, 15(1): 89-101.Abstract Accurate and reliable drought monitoring is essential to drought mitigation efforts and reduction of social vulnerability. A variety of indices, such as the standardized precipitation index (SPI), are used for drought monitoring based on different indicator variables. Because of the complexity of drought phenomena in their causation and impact, drought monitoring based on a single variable may be insufficient for detecting drought conditions in a prompt and reliable manner. This study outlines a multivariate, multi-index drought monitoring framework, namely, the multivariate standardized drought index (MSDI), for describing droughts based on the states of precipitation and soil moisture. In this study, the MSDI is evaluated against U.S. Drought Monitor (USDM) data as well as the commonly used standardized indices for drought monitoring, including detecting drought onset, persistence, and spatial extent across the continental United States. The results indicate that MSDI includes attractive properties, such as higher probability of drought detection, compared to individual precipitation and soil moisture鈥揵ased drought indices. This study shows that the MSDI leads to drought information generally consistent with the USDM and provides additional information and insights into drought monitoring.

DOI

25
Hao Z, AghaKouchak A, Nakhjiri N.et al., 2014. Global integrated drought monitoring and prediction system.Scientific Data, 1.Drought is by far the most costly natural disaster that can lead to widespread impacts, including water and food crises. Here we present data sets available from the Global Integrated Drought Monitoring and Prediction System (GIDMaPS), which provides drought information based on multiple drought indicators. The system provides meteorological and agricultural drought information based on multiple satellite-, and model-based precipitation and soil moisture data sets. GIDMaPS includes a near real-time monitoring component and a seasonal probabilistic prediction module. The data sets include historical drought severity data from the monitoring component, and probabilistic seasonal forecasts from the prediction module. The probabilistic forecasts provide essential information for early warning, taking preventive measures, and planning mitigation strategies. GIDMaPS data sets are a significant extension to current capabilities and data sets for global drought assessment and early warning. The presented data sets would be instrumental in reducing drought impacts especially in developing countries. Our results indicate that GIDMaPS data sets reliably captured several major droughts from across the globe.

DOI

26
Hao Z, Singh V P, 2015. Drought characterization from a multivariate perspective: A review.Journal of Hydrology, 527: 668-678.Drought is a recurring natural phenomenon that has plagued the civilization throughout its history. Due to the complex nature and widespread impacts of drought, there is a lack of universally accepted definition of drought, which also affects the development of drought indices to characterize drought conditions. Because an individual drought indicator is generally not sufficient for characterizing complex drought conditions and impacts, multiple drought-related variables and indices are required to capture different aspects of complicated drought conditions. To address this issue, a variety of multivariate drought indices have been developed recently to combine multiple drought-related variables and indices for integrated drought characterizations. This paper presents a comprehensive review of major multivariate drought indices developed recently. Different development methods of multivariate drought indices are introduced along with their strengths and limitations. This paper provides useful information for operational drought characterization with current multivariate drought indices and for the development of new multivariate drought indices.

DOI

27
Heddinghaus T R, Sabol P, 1991. A review of the Palmer Drought Severity Index and where do we go from here. In: Proceedings of the seventh conference on applied climatology. American Meteorological Society Boston, MA.

28
Heim R R, 2002. A review of twentieth-century drought indices used in the United States.Bulletin of the American Meteorological Society, 83(8): 1149.The monitoring and analysis of drought have long suffered from the lack of an adequate definition of the phenomenon. As a result, drought indices have slowly evolved during the last two centuries from simplistic approaches based on some measure of rainfall deficiency, to more complex problem-specific models. Indices developed in the late nineteenth and early twentieth century included such measures as percent of normal precipitation over some interval, consecutive days with rain below a given threshold, formulae involving a combination of temperature and precipitation, and models factoring in precipitation deficits over consecutive days. The incorporation of evapotranspiration as a measure of water demand by Thornthwaite led to the landmark development in 1965 by Palmer of a water budget-based drought index that is still widely used. Drought indices developed since the 1960s include the Surface Water Supply Index, which supplements the Palmer Index by integrating snowpack, reservoir storage, streamflow, and precipitation at high elevations; the Keetch-Byram Drought Index, which is used by fire control managers; the Standardized Precipitation Index; and the Vegetation Condition Index, which utilizes global satellite observations of vegetation condition. These models continue to evolve as new data sources become available. The twentieth century concluded with the development of the Drought Monitor tool, which incorporates Palmer's index and several other (post Palmer) indices to provide a universal assessment of drought conditions across the entire United States. By putting the development of these drought indices into a historical perspective, this paper provides a better understanding of the complex Palmer Index and of the nature of measuring drought in general.

DOI

29
Henry A J, 1906. The Climatology of the United States. Weather Bureau Bulletin Q, Washington D C, 51-58.

30
Idso S B, Jackson R D, Pinter P J.et al., 1981. Normalizing the stress-degree-day parameter for environmental variability.Agricultural Meteorology, 24: 45-55.Several experiments involving the measurement of foliage-air temperature differentials ( T F — T A ) and air vapor pressure deficits (VPD) were conducted on squash, alfalfa, and soybean crops at Tempe and Mesa, Arizona; Manhattan, Kansas; Lincoln, Nebraska; St. Paul, Minnesota; and Fargo, North Dakota. It is shown that throughout the greater portion of the daylight period, plots of T F — T A vs. VPD yield linear relationships for plants transpiring at the potential rate, irrespective of other environmental parameters except cloud cover. This fact is used to develop a crop water stress index that is reasonably independent of environmental variability. Examples of its application to stressed soybeans and alfalfa are provided.

DOI

31
IPCC, 2007. Climate Change 2007: The Physical Science Basis: Summary for Policymakers. Intergovernmental Panel on Climate Change Secretariat.

32
Jackson R D, Kustas W P, Choudhury B J, 1988. A reexamination of the crop water stress index.Irrigation Science, 9(4): 309-317.Hand-held infrared radiometers, developed during the past decade, have extended the measurement of plant canopy temperatures from individual leaves to entire plant canopies. Canopy temperatures are determined by the water status of the plants and by ambient meteorological conditions. The crop water stress index (CWSI) combines these factors and yields a measure of plant water stress. Two forms of the index have been proposed, an empirical approach as reported by Idso et al. (1981), and a theoretical approach reported by Jackson et al. (1981). Because it is simple and requires only three variables to be measured, the empirical approach has received much attention in the literature. It has, however received some criticism concerning its inability to account for temperature changes due to radiation and windspeed. The theoretical method is more complicated in that it requires these two additional variables to be measured, and the evaluation of an aerodynamic resistance, but it will account for differences in radiation and windspeed. This report reexamines the theoretical approach and proposes a method for estimating an aerodynamic resistance applicable to a plant canopy. A brief history of plant temperature measurements is given and the theoretical basis for the CWSI reviewed.

DOI

33
Karnieli A, Agam N, Pinker R T.et al., 2010. Use of NDVI and land surface temperature for drought assessment: Merits and limitations.Journal of Climate, 23(3): 618-633.Not Available

DOI

34
Kincer J B, 1919. The seasonal distribution of precipitation and its frequency and intensity in the United States.Monthly Weather Review, 47(9): 624-631.Not Available

DOI

35
Kogan F, Adamenko T, Guo W, 2013. Global and regional drought dynamics in the climate warming era.Remote Sensing Letters, 4(4): 364-372.This article investigates whether the highest global temperature during 2001-2012 triggered some changes in drought area, frequency, intensity and duration. New satellite-based vegetation health (VH) technology and regional in situ data were used for this analysis. The VH indices were used to investigate trends in global and regional drought area for several drought intensities (starting from moderate-to-exceptional (ME)) during the warmest decade, after 2000. Two of the most recent strongest droughts, 2010 in Russia and 2011 in the USA, are also discussed. During 2001-2012, droughts of ME, severe-to-exceptional (SE) and extreme-to-exceptional (EE) severity covered 17-35%, 7-15% and 2-6% of the total area of the world, respectively. No trends in drought areas for these levels of severity were found. Regional analysis was performed on Ukraine (from both satellite and in situ data). Annual mean temperature of the entire country follows global warming tendency, although the intensity is twice stronger, 1.45 degrees C over 50-year period. The droughts of SE and EE severity during the growing season normally affect 25-60% (up to 80% of the major crop area) and 5-10% (up to 20%) of the entire country, respectively, and the later leading up to 40% of losses in Ukrainian grain production.

DOI

36
Kogan F N, 1995. Droughts of the late 1980s in the United Statesas derived from NOAA polar-orbiting satellite data.Bulletin of the American Meteorological Society, 76(5): 655-668.

37
Kongoli C, Romanov P, Ferraro P J, 2012. Snow cover monitoring from remote sensing satellites. In: Remote Sensing of Drought: Innovative Monitoring Approaches. CRC Press, 359-386.

38
Kumar S V, Peters-Lidard C D, Mocko D.et al., 2014. Assimilation of remotely sensed soil moisture and snow depth retrievals for drought estimation.Journal of Hydrometeorology, 15(6): 2446-2469.Abstract The accurate knowledge of soil moisture and snow conditions is important for the skillful characterization of agricultural and hydrologic droughts, which are defined as deficits of soil moisture and streamflow, respectively. This article examines the influence of remotely sensed soil moisture and snow depth retrievals toward improving estimates of drought through data assimilation. Soil moisture and snow depth retrievals from a variety of sensors (primarily passive microwave based) are assimilated separately into the Noah land surface model for the period of 1979鈥2011 over the continental United States, in the North American Land Data Assimilation System (NLDAS) configuration. Overall, the assimilation of soil moisture and snow datasets was found to provide marginal improvements over the open-loop configuration. Though the improvements in soil moisture fields through soil moisture data assimilation were barely at the statistically significant levels, these small improvements were found to translate into subsequent small improvements in simulated streamflow. The assimilation of snow depth datasets were found to generally improve the snow fields, but these improvements did not always translate to corresponding improvements in streamflow, including some notable degradations observed in the western United States. A quantitative examination of the percentage drought area from root-zone soil moisture and streamflow percentiles was conducted against the U.S. Drought Monitor data. The results suggest that soil moisture assimilation provides improvements at short time scales, both in the magnitude and representation of the spatial patterns of drought estimates, whereas the impact of snow data assimilation was marginal and often disadvantageous.

DOI

39
Li Hailiang, Dai Shengpei, Luo Hongxia, 2012. Status and prospects of agricultural drought monitoring.China Rural Technology, 5: 46-48. (in Chinese)

40
Liu Li, Zhou Ying, 1998. Drought monitoring based on vegetation supply water index in Guizhou Province.Guizhou Meteorology, 22(6): 17-21. (in Chinese)

41
Liu Xianfeng, Zhu Xiufang, Pan Yaozhong.et al., 2015. Spatiotemporal changes of cold surges in Inner Mongolia between 1960 and 2012.Journal of Geographical Sciences, 25(3): 259-273.lt;p>In this study, we analyzed the spatiotemporal variation of cold surges in Inner Mongolia between 1960 and 2012 and their possible driving factors using daily minimum temperature data from 121 meteorological stations in Inner Mongolia and the surrounding areas. These data were analyzed utilizing a piecewise regression model, a Sen+Mann- Kendall model, and a correlation analysis. Results demonstrated that (1) the frequency of single-station cold surges decreased in Inner Mongolia during the study period, with a linear tendency of -0.5 times/10a (-2.4 to 1.2 times/10a). Prior to 1991, a significant decreasing trend of -1.1 times/10a (-3.3 to 2.5 times/10a) was detected, while an increasing trend of 0.45 times/10a (-4.4 to 4.2 times/10a) was found after 1991. On a seasonal scale, the trend in spring cold surges was consistent with annual values, and the most obvious change in cold surges occurred during spring. Monthly cold surge frequency displayed a bimodal structure, and November witnessed the highest incidence of cold surge. (2) Spatially, the high incidence of cold surge is mainly observed in the northern and central parts of Inner Mongolia, with a higher occurrence observed in the northern than in the central part. Inter-decadal characteristic also revealed that high frequency and low frequency regions presented decreasing and increasing trends, respectively, between 1960 and 1990. High frequency regions expanded after the 1990s, and regions exhibiting high cold surge frequency were mainly distributed in Tulihe, Xiao'ergou, and Xi Ujimqin Banner. (3) On an annual scale, the cold surge was dominated by AO, NAO, CA, APVII, and CQ. However, seasonal differences in the driving forces of cold surges were detected. Winter cold surges were significantly correlated with AO, NAO, SHI, CA, TPI, APVII, CW, and IZ, indicating they were caused by multiple factors. Autumn cold surges were mainly affected by CA and IM, while spring cold surges were significantly correlated with CA and APVII.</p>

DOI

42
Liu W T, Kogan F N, 1996. Monitoring regional drought using the vegetation condition index.International Journal of Remote Sensing, 17(14): 2761-2782.ABSTRACT NDVI (Normalized Difference Vegetation Index) images generated from NOAA AVHRR GVI data were recently used to monitor large scale drought patterns and their climatic impact on vegetation. The purpose of this study is to use the Vegetation Condition Index (VCI) to further separate regional NDVI variation from geographical contributions in order to assess regional drought impacts. Weekly NDVI data for the period of July 1985 to June 1992 were used to produce NDVI and VCI images for the South American continent. NDVI data were smoothed with a median filtering technique for each year. Drought areas were delineated with certain threshold values of the NDVI and VCI. Drought patterns delineated by the NDVI and VCI agreed quite well with rainfall anomalies observed from rainfall maps of Brazil. NDVI values reflected the different geographical conditions quite well. Seasonal and interannual comparisons of drought areas delineated by the VCI provided a useful tool to analyse temporal and spatial evolution of regional drought as well as to estimate crop production qualitatively. It is suggested that VCI data besides NDVI may be used to construct a large scale crop yield prediction model.

DOI

43
Marcovitch S, 1930. The measure of droughtiness.Monthly Weather Review, 58(3): 113-113.Not Available

DOI

44
McGuire J K, Palmer W C, 1957. The 1957 drought in the eastern United States.Monthly Weather Review, 85(9): 305-314.Not Available

DOI

45
McKee T B, Doesken N J, Kleist J, 1993. The relationship of drought frequency and duration to time scales. In: Proceedings of the 8th Conference on Applied Climatology. American Meteorological Society Boston, MA, 179-183.

46
McQuigg J, 1954. A simple index of drought conditions.Weatherwise, 7(3): 64-67.

DOI

47
Me Zhensheng, Ding Yuguo, 1990. Climate Statistics, 1963. Beijing: Science Press, 1990. (in Chinese)

48
Mishra A K, Desai V R, 2005. Spatial and temporal drought analysis in the Kansabati river basin, India.International Journal of River Basin Management, 3(1): 31-41.

49
Mishra A K, Singh V P, 2009. Analysis of drought severity-area-frequency curves using a general circulation model and scenario uncertainty. Journal of Geophysical Research: Atmospheres, 114(D6).

50
Mishra A K, Singh V P, 2010. A review of drought concepts.Journal of Hydrology, 391(1/2): 202-216.Owing to the rise in water demand and looming climate change, recent years have witnessed much focus on global drought scenarios. As a natural hazard, drought is best characterized by multiple climatological and hydrological parameters. An understanding of the relationships between these two sets of parameters is necessary to develop measures for mitigating the impacts of droughts. Beginning with a discussion of drought definitions, this paper attempts to provide a review of fundamental concepts of drought, classification of droughts, drought indices, historical droughts using paleoclimatic studies, and the relation between droughts and large scale climate indices. Conclusions are drawn where gaps exist and more research needs to be focussed.

DOI

51
Mishra A K, Singh V P, Desai V R, 2009. Drought characterization: A probabilistic approach.Stochastic Environmental Research and Risk Assessment, 23(1): 41-55.<a name="Abs1"></a>Using the alternative renewable process and run theory, this study investigates the distribution of drought interval time, mean drought interarrival time, joint probability density function and transition probabilities of drought events in the Kansabati River basin in India. The standardized precipitation index series is employed in the investigation. The time interval of SPI is found to have a significant effect of the probabilistic characteristics of drought.

DOI

52
Moran M S, Clarke T R, Inoue Y.et al., 1994. Estimating crop water deficit using the relation between surface-air temperature and spectral vegetation index.Remote Sensing of Environment, 49(3): 246-263.ABSTRACT The crop water stress index (CWSI), developed at the USDA-ARS U.S. Water Conservation Laboratory, Phoenix, Arizona, is a commonly used index for detection of plant stress based on the difference between foliage and air temperature. Application of CWSI at local and regional scales has been hampered by the difficulty of measuring foliage temperature of partially vegetated fields. Most hand-held, airborne, and satellite-based infrared sensors measure a composite of both the soil and plant temperatures. The concept proposed here, termed the vegetation index/temperature (VIT) trapezoid, is an attempt to combine spectral vegetation indices with composite surface temperature measurements to allow application of the CWSI theory to partially-vegetated fields without knowledge of foliage temperature. Based on this approach, a new index [water deficit index (WDI)] was introduced for evaluating evapotranspiration rates of both full-cover and partially vegetated sites. By definition, WDI is related to the ratio of actual and potential evapotranspiration; in practice, WDI can be computed using remotely sensed measurements of surface temperature and reflectance (red and near-infrared spectrum) with limited on-site meteorological data (net radiation, vapor pressure deficit, wind speed, and air temperature). Both the VIT trapezoid and WDI concepts were evaluated using 1) a simulation of a two-component (soil and vegetation) energy balance model and 2) existing data from an experiment in an alfalfa field in Phoenix, Arizona. Results from both studies showed that the WDI provided accurate estimates of field evapotranspiration rates and relative field water deficit for both full-cover and partially vegetated sites.

DOI

53
Mu L, Wu B, Yan N.et al., 2007. Validation of agricultural drought indices and their uncertainty analysis.Bulletin of Soil and Water Conservation, 27(2): 119-122.This study aimed to validate the agricultural drought indices derived from NOAA/AVHRR data and analyzed their uncertainties by taking Taigu County in Shanxi Province and Ji'ning County in Shandong Province for examples.The result from the analysis of relationships between drought indices and soil moisture in Taigu County shows that vegetation health index(H),temperature condition index(T)and vegetation condition index(V)have somewhat low relations with soil moisture(R2 is 0.51,0.50,and 0.56,respectively).H and T have the closer relationship than normalized difference water index(W)and V.Validation using the data in Ji'ning County shows that H,T and V have better relations with soil moisture(R2 is 0.97,0.93,and 0.66,respectively).W has a poor relation with soil moisture in the two cases.These suggest that the uncertainties in drought monitoring should be analyzed in terms of the crop planting pattern,monitoring time scale,vegetation condition and farming activity.

54
Mu Q, Zhao M, Kimball J S.et al., 2013. A remotely sensed global terrestrial drought severity index.Bulletin of the American Meteorological Society, 94(1): 83-98.

DOI

55
Munger T T, 1916. Graphic method of representing and comparing drought INTENSITIES. 1.Monthly Weather Review, 44(11): 642-643.Not Available

DOI

56
Palmer W C, 1965. Meteorological drought, 30. US Department of Commerce, Weather Bureau Washington, DC, USA.

57
Palmer W C, 1968. Keeping track of crop moisture conditions, nationwide: The new crop moisture index.Weatherwise, 21: 156-161.

58
Rajsekhar D, Singh V P, Mishra A K, 2015. Multivariate drought index: An information theory based approach for integrated drought assessment.Journal of Hydrology, 526: 164-182.Most of the existing drought indices are based on a single variable (e.g. precipitation) or a combination of two variables (e.g., precipitation and streamflow). This may not be sufficient for reliable quantification of the existing drought condition. It is possible that a region might be experiencing only a single type of drought at times, but multiple drought types affecting a region is quite common too. To have a comprehensive representation, it is better to consider all the variables that lead to different physical forms of drought, such as meteorological, hydrological, and agricultural droughts. Therefore, we propose to develop a multivariate drought index (MDI) that will utilize information from hydroclimatic variables, including precipitation, runoff, evapotranspiration and soil moisture as indicator variables, thus accounting for all the physical forms of drought. The entropy theory was utilized to develop this proposed index, that led to the smallest set of features maximally preserving the information of the input data set. MDI was then compared with the Palmer drought severity index (PDSI) for all climate regions within Texas for the time period 1950-2012, with particular attention to the two major drought occurrences in Texas, viz. the droughts which occurred in 1950-1957, and 2010-2011. The proposed MDI was found to represent drought conditions well, due to its multivariate, multi scalar, and nonlinear properties. To help the user choose the right time scale for further analysis, entropy maps of MDI at different time scales were used as a guideline. The MDI time scale that has the highest entropy value may be chosen, since a higher entropy indicates a higher information content.

DOI

59
Rhee J, Im J, Carbone G J, 2010. Monitoring agricultural drought for arid and humid regions using multi-sensor remote sensing data.Remote Sensing of Environment, 114(12): 2875-2887.While existing remote sensing-based drought indices have characterized drought conditions in arid regions successfully, their use in humid regions is limited. We propose a new remote sensing-based drought index, the Scaled Drought Condition Index (SDCI), for agricultural drought monitoring in both arid and humid regions using multi-sensor data. This index combines the land surface temperature (...

DOI

60
Rodell M, 2012. Satellite gravimetry applied to drought monitoring. In: Remote Sensing of Drought: Innovative Monitoring Approaches. CRC Press, 261-277.

61
Rott H, Yueh S H, Cline D W.et al., 2010. Cold regions hydrology high-resolution observatory for snow and cold land processes.Proceedings of the IEEE, 98(5): 752-765.Snow is a critical component of the global water cycle and climate system, and a major source of water supply in many parts of the world. There is a lack of spatially distributed information on the accumulation of snow on land surfaces, glaciers, lake ice, and sea ice. Satellite missions for systematic and global snow observations will be essential to improve the representation of the cryosphere in climate models and to advance the knowledge and prediction of the water cycle variability and changes that depend on snow and ice resources. This paper describes the scientific drivers and technical approach of the proposed Cold Regions Hydrology High-Resolution Observatory (CoReHO) satellite mission for snow and cold land processes. The sensor is a synthetic aperture radar operating at 17.2 and 9.6 GHz, VV and VH polarizations. The dual-frequency and dual-polarization design enables the decomposition of the scattering signal for retrieving snow mass and other physical properties of snow and ice.

DOI

62
Sandholt I, Rasmussen K, Andersen J, 2002. A simple interpretation of the surface temperature/vegetation index space for assessment of surface moisture status.Remote Sensing of Environment, 79(2): 213-224.A simplified land surface dryness index (Temperature-Vegetation Dryness Index, TVDI) based on an empirical parameterisation of the relationship between surface temperature (T) and vegetation index (NDVI) is suggested. The index is related to soil moisture and, in comparison to existing interpretations of the T/NDVI space, the index is conceptually and computationally straightforward. It is based on satellite derived information only, and the potential for operational application of the index is therefore large. The spatial pattern and temporal evolution in TVDI has been analysed using 37 NOAA-AVHRR images from 1990 covering part of the Ferlo region of northern, semiarid Senegal in West Africa. The spatial pattern in TVDI has been compared with simulations of soil moisture from a distributed hydrological model based on the MIKE SHE code. The spatial variation in TVDI reflects the variation in moisture on a finer scale than can be derived from the hydrological model in this case.

DOI

63
Shafer B A, Dezman L E, 1982. Development of a Surface Water Supply Index (SWSI) to assess the severity of drought conditions in snowpack runoff areas.Proceedings of the Western Snow Conference, 164-175.

64
Shah R D, Mishra V, 2015. Development of an experimental near-real-time drought monitor for India.Journal of Hydrometeorology, 16(1): 327-345.Persistent and wide spread droughts hamper water resources management and crop production. India has been facing drought frequently in the last few decades which had an enormous impacts on water resources, crop production, and gross domestic products. Despite the implications of droughts in India, the real-time monitoring systems at appropriate spatial and temporal resolutions have been lacking. Here we develop an experimental drought monitor at one-day lag (in near real time) for entire India. The drought monitor provides information for meteorological, hydrological, and agricultural droughts at various time scales and is updated on a daily basis. The real-time daily precipitation data is obtained from the Tropical Rainfall Measurement Mission (TRMM), while daily temperatures are obtained from the Global Forecast System Analysis (GFS). We reconstructed 0.25 degree precipitation using the bias corrected TRMM data and precipitation from the APHRODITE for the period of 1951 to present. The daily temperature data from the GFS were downscaled and bias corrected using the observed temperature records. We use standardized precipitation index (SPI), standardized runoff index (SRI), and soil moisture percentile to monitor meteorological, hydrological, and agricultural droughts, respectively. Soil moisture and runoff are simulated for entire India in near real time using the Variable Infiltration Capacity (VIC) model with the daily forcings obtained from the TRMM and GFS. We highlight some recent droughts to show the effectiveness of the experimental drought monitoring systems that can help in water resources management and decision making. We compare different drought indices at various time scales to evaluate the effectiveness of the drought indices in different regions across India. Keywords: SPI, SRI, Soil moisture, TRMM, GFS, drought, drought monitor

DOI

65
Solomon S.et al., 2007. The Physical Science Basis. Contribution of Working Group I to the Fourth Assessment Report of the Intergovernmental Panel on Climate Change: 235-337.

66
Stocker T F.et al., 2013. IPCC, 2013: Climate Change 2013: The Physical Science Basis. Contribution of Working Group I to the Fifth Assessment Report of the Intergovernmental Panel on Climate Change.

67
Van Rooy M P, 1965. A rainfall anomaly index independent of time and space.Notos, 14: 43-48.

68
Vicente-Serrano S M, Beguería S, Lorenzo-Lacruz J.et al., 2012. Performance of drought indices for ecological, agricultural, and hydrological applications.Earth Interactions, 16: 10.Abstract In this study, the authors provide a global assessment of the performance of different drought indices for monitoring drought impacts on several hydrological, agricultural, and ecological response variables. For this purpose, they compare the performance of several drought indices [the standardized precipitation index (SPI); four versions of the Palmer drought severity index (PDSI); and the standardized precipitation evapotranspiration index (SPEI)] to predict changes in streamflow, soil moisture, forest growth, and crop yield. The authors found a superior capability of the SPEI and the SPI drought indices, which are calculated on different time scales than the Palmer indices to capture the drought impacts on the aforementioned hydrological, agricultural, and ecological variables. They detected small differences in the comparative performance of the SPI and the SPEI indices, but the SPEI was the drought index that best captured the responses of the assessed variables to drought in summer, the season in which more drought-related impacts are recorded and in which drought monitoring is critical. Hence, the SPEI shows improved capability to identify drought impacts as compared with the SPI. In conclusion, it seems reasonable to recommend the use of the SPEI if the responses of the variables of interest to drought are not known a priori.

DOI

69
Vicente-Serrano S M, Beguería S, López-Moreno J I, 2010. A multiscalar drought index sensitive to global warming: The standardized precipitation evapotranspiration index.Journal of Climate, 23(7): 1696-1718.

70
Vicente-Serrano S M, Beguería S, López-Moreno J I.et al., 2010. A new global 0.5 gridded dataset (1901-2006) of a multiscalar drought index: comparison with current drought index datasets based on the Palmer Drought Severity Index.Journal of Hydrometeorology, 11(4): 1033-1043.

71
Wang Chunyi, Wang Shili, Huo Zhiguo.et al., 2005. Progresses in research of agro-meteorological disasters in China in recent decade.Acta Meteorologica Sinica, (5): 659-671. (in Chinese)Agro-meteorological disasters restrict the fast and healthy development of agricultural production due to their high frequency and severe intensity. Agro-meteorologists in China attached great importance to the research on agro-meteorological disasters. A lot of progress in research on agro meteorological disasters has been made in past decade supported by national key projects and other program. The emphasis of research on agro-meteorological disasters in China are improving monitoring system and forecast services and building the system of risk assessment and prevention system in recent decade. Based on 3s technology and surface observation, the dynamic monitoring system of agro-meteorological disasters was built to monitor the emergence and development of agro-meteorological disasters the year round. Satellite remote sensing monitoring system was built and improved. The dynamic monitoring of Agro-meteorological disasters, such as drought, flood and cold damage has been carried out. The high altitude temporal and spatial difference prediction system of disaster monitoring was developed step by step, in which RS, GIS and GPS were integrated. The study on agro-meteorological disasters prediction included the further development of mathematic statistical forecast method, the primary study on combining agro meteorological models with climate models, the application of advanced technology, such as GIS and internet as well as the development of provincial agro-meteorological disasters prediction system. The risk assessment of agro-meteorological disasters has experienced two stages. The first was studying the technical method of disasters risk analysis before 2001and the second was researching the quantitative technical method of risk assessment to build technical system of risk analysis, followed assessment, assessment after disasters and strategies. The main achievement included the study on risk analysis, risk assessment, risk regionalization of assessment agro-meteorological disasters and agricultural drought assessment based on remote sense monitoring information. In recent years, the prevention technique agrometeorological disasters was studied by combining active prevention techniques of using agro climate resource effectively and passive techniques of developing prevention medicines in China. The distinct achievement in study on agricultural drought and cold damage prevention techniques was build.

DOI

72
Wang Jinsong, Guo Jiangyong, Qing Jizu, 2007. Application of a kind of K drought index in the spring drought analysis in Northwest China.Journal of Natural Resources, 22(5): 709-717. (in Chinese)A kind of K drought index and its criterion are made by using spring precipitation and evaporation data of 140 stations in Northwest China from 1971-2000.At the same time,the comparison is done among the defined K drought index,improved Palmer drought index and precipitation anomaly percent. From 2001 to 2005,the verifications of K drought index have done with the independent precipitation and evaporation data,which were not involved in making the drought criterion at four representative stations,namely Urumqi,Yushu,Lanzhou and Xifeng,respectively.The results show that the heavy drought areas are located in south Xinjiang,west Gansu and west Qinghai,the moderate drought areas are located in southern part of north Xinjiang,north and east Gansu,north Ningxia,southeast Qinghai and north Shaanxi,and the light drought areas are located in west Xinjiang,south Gansu,west Qinghai and east Shaanxi.The K drought index has a better function of drought monitoring,and the improved Palmer drought severity index has better monitoring effect in arid area,but it has some limitations to monitor drought in plateau area,semi-arid and sub-humid areas.Precipitation anomaly percent has good monitoring effect for light and heavy drought,but it has bad monitoring effect for moderate drought.It is verified again from 2001 to 2005 that the improved Palmer drought severity index has some limitations to monitor drought in Northwest China,but the K drought index has better monitoring effect in Northwest China.

DOI

73
Wang Pengxin, Gong Jianya, Li Xiaowen.et al., 2003. Advances in drought monitoring by using remotely sensed normalized difference vegetation index and land surface temperature products.Advance in Earth Sciences, 18(4): 527-533. (in Chinese)

74
Wells N, Goddard S, Hayes M J, 2004. A self-calibrating Palmer drought severity index.Journal of Climate, 17(12): 2335-2351.

75
Wu, Jianjun, Zhou Lei, Liu Ming.et al., 2013. Establishing and assessing the Integrated Surface Drought Index (ISDI) for agricultural drought monitoring in mid-eastern China.International Journal of Applied Earth Observation and Geoinformation, 23: 397-410.Accurately monitoring the temporal, spatial distribution and severity of agricultural drought is an effective means to reduce the farmers' losses. Based on the concept of the new drought index called VegDRI, this paper established a new method, named the Integrated Surface Drought Index (ISDI). In this method, the Palmer Drought Severity Index (PDSI) was selected as the dependent variable; for the independent variables, 12 different combinations of 14 factors were examined, including the traditional climate-based drought indicators, satellite-derived vegetation indices, and other biophysical variables. The final model was established by fully describing drought properties with the smaller average error (relative error) and larger correlation coefficients. The ISDI can be used not only to monitor the main drought features, including precipitation anomalies and vegetation growth conditions but also to indicate the earth surface thermal and water content properties by incorporating temperature information. Then, the ISDI was used for drought monitoring from 2000 to 2009 in mid-eastern China. The results for 2006 (a typical dry year) demonstrate the effectiveness and capability of the ISDI for monitoring drought on both the large and the local scales. Additionally, the multiyear ISDI monitoring results were compared with the actual drought intensity using the agro-meteorological disaster data recorded at the agro-meteorological sites. The investigation results indicated that the ISDI confers advantages in the accuracy and spatial resolution for monitoring drought and has significant potential for drought identification in China. (C) 2012 Elsevier B.V. All rights reserved.

DOI

76
Wu Jianjun, Zhou Lei, Mo Xinyu.et al., 2015. Drought monitoring and analysis in China based on the Integrated Surface Drought Index (ISDI).International Journal of Applied Earth Observation and Geoinformation, 41: 23-33.Timely and accurate monitoring of the onset and evolution of drought in China are important to reduce losses from drought. The Integrated Surface Drought Index (ISDI) which originally established in mideast China shows a large potential for real-time regional drought monitoring. However, ISDI is still at the developmental stage, and the applicability of the index requires further examination especially for China with vast area, climatic conditions, complex topography, and land cover. Furthermore, ISDI model depends on the historical training data corresponding to the study area. ISDI application in China must be remodeled using the historical training data over China. In this paper, we remodeled ISDI over China based on previous work and evaluated its capability for near real-time drought monitoring. Using the Palmer Drought Severity Index (PDSI) as a dependent variable, ISDI integrates climate-based drought indices, satellite-based Vegetation Index (VI) and land surface temperature (LST) with other biophysical and elevation data to produce a 1-km regional drought condition map at 16-day intervals. Strong relationships were determined between the calculated ISDI and PDSI for spring, summer and autumn, and all of the correlation coefficients exceeded 0.8. The initial ISDI results demonstrated a good performance for monitoring droughts in southwestern China from 2009 to 2010, high temperatures and droughts in southern China in 2013, and floods in northeastern China in 2013. The higher spatial resolution and near real-time capability of ISDI can provide important inputs for drought management and mitigation in China.

DOI

77
Wu Shaohong, Zhao Yan, Tang Qiuhong.et al., 2015. Land surface pattern study under the framework of Future Earth.Progress in Geography, 34(1): 10-17. (in Chinese)Future Earth is a global platform for international scientific collaboration, which enables integrated research on grand challenges and transformations to sustainability, strengthens global partnerships between researchers, funders, and users of research, and communicates science to society and society to science. It combines IGBP, IHDP, WCRP, and DIVERSITAS. Its objectives are: to provide the knowledge required for societies in the world to face risks posed by global environmental change and to seize opportunities in a transition to global sustainability. It aims at scientific integration and co-production of knowledge. Analysis on characteristics of land surface pattern and its research progress shows that land surface is one of the main areas that Future Earth focuses on. Land surface pattern, formed by interaction of physical factors and different processes, may be taken as a fundamental regional frame for study of Future Earth. The prospective research of land surface pattern should make effort to improve the methodology to support progress of integrated research in physical geography.

DOI

78
Ye Duzheng, 1992. Prediction of Global Change in China. Beijing: China Meteorological Press, 1992. (in Chinese)

79
Zhang A, Jia G, 2013. Monitoring meteorological drought in semiarid regions using multi-sensor microwave remote sensing data.Remote Sensing of Environment, 134: 12-23.The existing remote sensing drought indices were mainly derived from optical and infrared bands, and have been widely used in monitoring agricultural drought; however, their application in monitoring meteorological drought was limited. This study proposes a new multi-sensor microwave remote sensing drought index, the Microwave Integrated Drought Index (MIDI), for monitoring short-term drought, especially the meteorological drought over semi-arid regions, by integrating three variables: Tropical Rainfall Measuring Mission (TRMM) derived precipitation, Advanced Microwave Scanning Radiometer for EOS (AMSR-E) derived soil moisture, and AMSR-E derived land surface temperature. Each variable was linearly scaled from 0 to 1 for each pixel based on absolute minimum and maximum values over time to relatively monitor drought. Pearson correlation analyses were performed between remote sensing drought indices and scale-dependent Standardized Precipitation Index (SPI) during the growing season (April to October) from 2003 to 2010 to assess the capability of remotely sensed drought indices over three bioclimate regions in northern China. The results showed that MIDI with proper weights of three components outperformed individual remote sensing drought indices and other combined microwave drought indices in monitoring drought. It nearly possessed the best correlations with different time scale SPI; meanwhile it showed the highest correlation with 1-month SPI, and then decreased as SPI time scale increased, suggesting that the MIDI was a very reliable index in monitoring meteorological drought. Furthermore, similar spatial patterns and temporal changes were found between MIDI and 1- or 3-month SPI in monitoring drought. Therefore, the MIDI was recommended to be the optimum drought index, in monitoring short-term drought, especially for meteorological drought over cropland and grassland across northern China or similar regions globally with the ability to work in all weather conditions. (c) 2013 Elsevier Inc. All rights reserved.

DOI

80
Zhang Qiang, Han Lanying, Zhang Liyang.et al., 2014. Analysis on the character and management strategy of drought disaster and risk under the climatic warming.Advances in Earth Sciences, 1: 80-91. (in Chinese)The drought is a most severe natural disaster worldwide,which leads to great risk in human being.The drought disaster and risk have more prominent because of obvious climatic warming in the last hundred years.At present,the understanding of the internal laws of the occurrence of drought and drought risk is not comprehensive,and the recognition of the characteristics of the drought and drought risk under climatic warming is obscure.In this paper,we summarized systematically the domestic and overseas research progress of the drought and drought disaster risk,introduced the principle of the drought disaster transfer process and the essential features of drought disaster,analyzed synthetically the main characteristics and interactions among the key factors of the drought disaster risk,discussed the effect of climatic warming on drought and drought disaster risk,and probed into the basic requirement of drought disaster risk management. Above all,we provide the main protective measurements of the drought disaster and the main strategy of drought disaster risk management.

DOI

81
Zhang Qiang, Ju Xiaosheng, Li Shuhua, 1998. Comparison of three drought indices to determine and the new index.Meteorological Science and Technology, 2: 49-53.

82
Zhang Qiang, Zhang Liang, Cui Xiancheng.et al., 2011. Progresses and challenges in drought assessment and monitoring.Advances in Earth Sciences, 7: 763-778.Due to the climate warming and enhancement of human impacts,the menaces of drought disaster in safety of food supplies,water resources and ecology become more remarkable,and the great challenges of ability for impact evaluation,disaster mitigation and emergency management are brought forward.Thus,the technological level of drought monitoring,warning,evaluation,mitigation and management need to be improved.In this paper,based on the summary of the advances in drought research,our understandings on arid climate,drought and drought disaster are put forward,the key characteristics of rid climate,drought and drought disaster are generalized,and the courses to develop drought indices,the main properties of different sorts of drought indices and their mutual relationships are analyzed.Finally,according to the future situation of science and technology development and the service demand of society,the scientific challenges and the ways to develop the technology on drought are preliminarily discussed.

DOI

83
Zhang Renhua, Sun Xiaomin, 2001. Regional differentiation of quantitative estimate crop transpiration and soil water use efficiency by using remote sensing. Science in China:Series D, 31(11): 959-968.

84
Zhao Junfang, Guo Jianping, Zhang Yanhong.et al., 2010. Advances in research of impacts of climate change on agriculture.Chinese Journal of Agrometeorology, 2: 200-205.In this paper we summarized a series of scientific achievements about the impacts of climate change on agriculture in recent decades,mainly about the impacts of climate change on crop growth,yield,quality,planting distribution,agriculture cost,and so on. Finally,based on the current researches,we pointed out the insufficiency which existed at present studies and some areas to be improved,and then put forward prospects in the future.

Outlines

/