Research Articles

Identifying sources and hazardous risks of heavy metals in topsoils of rapidly urbanizing East China

  • LIU Yang , 1 ,
  • MA Zongwei , 1, * ,
  • LV Jianshu 2, 3, * ,
  • BI Jun 1
Expand
  • 1. State Key Laboratory of Pollution Control and Resource Reuse, School of the Environment, Nanjing University, Nanjing 210023, China
  • 2. The Key Laboratory of Coast and Island Development of Ministry of Education, Nanjing University, Nanjing 210023, China
  • 3. College of Population, Resource and Environment, Shandong Normal University, Jinan 250014, China

*Corresponding author: Ma Zongwei, E-mail: njumazw@163.com; Lv Jianshu, E-mail:

Author: Liu Yang (1986-), PhD Candidate, specialized in environmental planning and management.E-mail:

Received date: 2015-07-20

  Accepted date: 2015-12-28

  Online published: 2016-06-15

Supported by

China State-Sponsored Postgraduate Study Abroad Program, No.201306190053

National Natural Science Foundation of China, No.41101079

The Program B for Outstanding PhD Candidate of Nanjing University, No.2014001B008

The Program for Graduate Student’s Research Innovation of Jiangsu Province, No.CXLX13-051

Copyright

Journal of Geographical Sciences, All Rights Reserved

Abstract

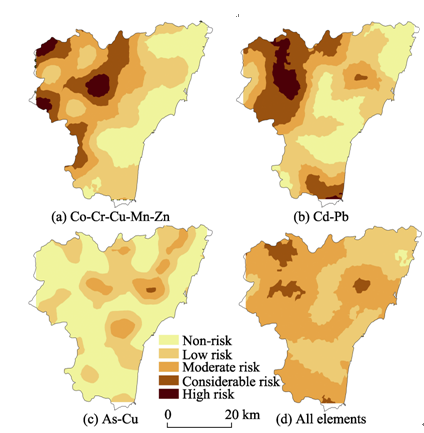
With rapid economic and social development, soil contamination arising from heavy metals has become a serious problem in many parts of China. We collected a total of 445 samples (0-20 cm) at the nodes of a 2 km×2 km grid in surface soils of Rizhao city, and analyzed sources and risk pattern of 10 heavy metals (As, Cd, Co, Cr, Cu, Hg, Mn, Ni, Pb and Zn). The combination of Multivariate statistics analysis and Geostatistical methods was applied to identify the sources and hazardous risk of heavy metals in soils. The result indicated that Cr, Ni, Co, Mn, Cu, and As were mainly controlled by parent materials and came from natural sources. Cd and Hg originated from anthropogenic sources. Pb and Zn, belonging to different groups in multivariate analysis, were associated with joint effect of parent materials and human inputs. Ordinary Kriging and Indicator Kriging suggested that single element and elements association from the same principal components had similar spatial distribution. Through comprehensive assessment on all elements, we also found the high risk areas were located in the populated urban areas and western study area, which could be attributed to the higher geological background in the western part and strong human interference in the eastern part.

Cite this article

LIU Yang , MA Zongwei , LV Jianshu , BI Jun . Identifying sources and hazardous risks of heavy metals in topsoils of rapidly urbanizing East China[J]. Journal of Geographical Sciences, 2016 , 26(6) : 735 -749 . DOI: 10.1007/s11442-016-1296-x

1 Introduction

With the rapid industrialization and urbanization, the heavy metals contamination in soils has become an important hazard to the ecosystem health (Alloway, 1995; Fu et al., 2012; Li et al., 2015). Heavy metals are the essential indicators to evaluate the environmental quality, which has been a hotspot in geographical, soil and environmental sciences. Soil properties are mainly influenced by natural factor and anthropogenic activities. In particular, human activities, including vehicle emissions, industrial waste, application of pesticide and fertilizer, atmospheric deposition resulting from dust and aerosol, are commonly the main driving forces of heavy metals pollution in soils (Alloway, 1995; Cai et al., 2012; Sebai et al., 2007). The raised heavy metals exceeding some thresholds could influence soil physical and chemical properties, restrain the micro-organism activity, and block nutrients supplies. Furthermore, heavy metals pose a risk to human health through food intake, direct ingestion and dermal contact. Heavy metals are not removed by natural degradation processes; they accumulated in soils over time. Therefore, sources identification and hazardous risk delineation of heavy metals contamination is essential because it can provide references for soil remediation and effective management recommendations.
Multivariate analysis and Geostatistical method have been widely used to the study on modeling spatial variability of soil properties and mapping the spatial distribution and hazardous risk (Lee et al., 2006; Facchinelli et al., 2001). Commonly, correlation analysis, principal component analysis and cluster analysis were applied to identify the anthropogenic and natural sources of elements. These methods could substitute the comprehensive indicator for the one variables association, and reflect the relationship of various variables. Furthermore, the results derived from these methods can verify each other (Yalcin and Ilhan, 2008). Recently, there were many examples of multivariate analysis in sources identification of heavy metals (Facchinelli et al., 2001; Inigo et al., 2011; Boruvka et al., 2005; Zhang, 2006; Imperato et al., 2003; Sajn et al., 2011).
Indicator Kriging (IK) is a non-parametric geostatistical method, which is commonly used to solve the highly skewed and soil pollution data. Indicator Kriging makes no assumptions about the underlying invariant distribution, and 0-1 indicator transformations of the data make the predictor robust to outliers (Goovaerts, 1997). The estimated value in the unsampling sites by Indicator Kriging indicates the probability that the values are more or less than a specified cut-off. Indicator Kriging has been used in soil science, which included the quality of soils (Smith et al., 1993; Halvorson et al., 1996; Oyedele et al.; 1996), soil degradation (Diodato and Ceccarelli, 2004; Eldeiry and Garcia, 2011), as well as environmental risk of heavy metals (Goovaerts, 1997; Van Meirvenne and Goovaerts, 2001; Chu et al., 2010). Furthermore, the application of IK also spread into hydrology and water resource science, ecology, including groundwater pollution risk, potentiality of water resources (Lee et al., 2008; Jang, 2013).
Since the 1980s, Rizhao experienced spreading economic and social development. The gross domestic product has reached 10.25 billion Yuan, and there are 1072 industrial enterprises and 0.61 billion vehicles. The rapid development poses strong pressure on the soil environment, and has resulted in the environmental pollution. In this paper, we started with a systematic sampling and chemical analysis of 445 topsoil samples from Rizhao city. The concentrations of 10 heavy metals (As, Cd, Co, Cr, Cu, Hg, Mn, Ni, Pb and Zn) were presented and compared with other regions. Multivariate statistical procedures were used to identify heavy metal sources, while Indicator Kriging was used to delineate the hazardous risk of heavy metals exceeding the background values of the study area.

2 Materials and methods

2.1 Study area

Rizhao city (119°0′43″E-119°39′22″E and 35°4′55″N-35°36′25″N) is located in the southeastern part of Shandong province, East China (Figure 1), and extends for about 1800 km2. The study area consists of an alluvial plain in the eastern part and mountainous area in the western part. The elevation presents a decreasing trend from southwest to northeast with a range of 1.3-656.9 m. Skeleton and brown soils are located in the western mountainous area, which are commonly originated from granite and metamorphic rocks. Alluviation and marine deposition are the main parent materials as the origin of moisture soil and cinnamon soil. The area has a temperate continental climate with a mean annual temperature of 13℃. The average annual precipitation in the area is 870 mm, and the annual average relative humidity is 83%. With the rapid urbanization and industrialization, currently the urban area has increased to 116 km2 from 13 km2 in the early 1980. The industry concentrates on the coastal area in the eastern part, while the agriculture is mainly located in the western part of the study area.
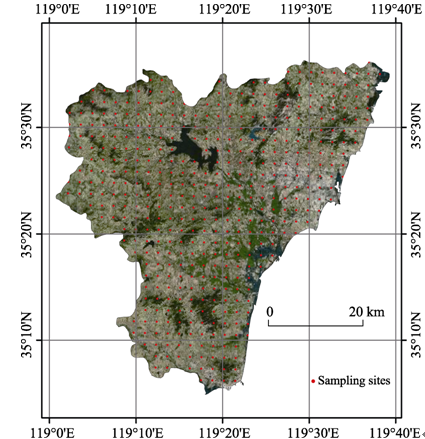
Figure 1 The location and sampling sites in Rizhao, East China

2.2 Soil samples collection and chemical analysis

The study area was divided into 2 km×2 km cells, and then the 445 sites are selected at the centre of each cell (without sites in the water body). At each sampling site, four to six subsamples of topsoil (0-20 cm) were taken and mixed thoroughly to obtain a composite sample. In the case of soil being unavailable at the centre of the cell (i.e. urban area, road, etc.), an alternative location is selected as close as possible to the centre of the cell to find the natural soils. Locations of sampling sites are shown in Figure 1.
Samples were air-dried at room temperature (25℃), and were conducted to remove stones, coarse materials, and other debris. The samples with 10g weight were ground to a fine 0.15 mm powder. The samples for analyzing Cd, Cr, Cu, Mn, Ni, Pb, and Zn were digested using H2SO4-HNO3-HF, the levels of Cr, Cu, Mn, Ni, Pb, and Zn concentrations in the samples were determined by flame atomic absorption spectrophotometer, while Cd was determined by graphite furnace atomic absorption spectrophotometer. The samples for Hg determination were digested by H2SO4-HNO3-KMnO4, and were determined with an atomic fluorescence spectrometer. The recovery of chemical measure was 10±100%, indicating that the accuracy was satisfactory for this study.

2.3 Descriptive and multivariate analysis

Descriptive statistical indicators including range, mean, median, standard deviation (SD), variation of coefficient (CV), skewness and kurtosis were computed to examine the data structures. Correlation analysis, principal component analysis (PCA), and cluster analysis (CA) were used to evaluate the data to acquire the sources of heavy metals, and were performed using SPSS 16.0 software.

2.4 Indicator Kriging

Indicator Kriging (IK) is a non-parametric geostatistical method for estimating the probability of exceeding a specific threshold value at a given location. IK includes Univariate Indicator Kriging and Multiple-variable Indicator Kriging.
In Univariate Indicator Kriging, the original value I(u; zk) was transformed into indicator variables (Lark and Ferguson, 2004; Lin et al., 2010), which is written as follows:
The following calculation step is concomitant with Ordinary Kriging.
A linear combination of indicator variables can be used to estimate the probability in unsampling location, according to The Indicator Kriging system can be solved using where I*(u0; zk) represents the values of the indicator variable at the measured locations; η is the Lagrange multiplier; γj is the variogram of the indicator variable at the respective lag distance, λi is a weighting factor in estimation.
Multiple-variable Indicator Kriging can combine indicator variables resulted from respective cut-off together into one integrative variable. Based on the results of various variables calculated in Eq. 1, the multiple-variables integration is obtained by Eq. 4, and the following calculation steps are the same to Univariate Indicator Kriging.
where the weights of various heavy metals Wk are determined by the contribution of respective toxic response factors (Hakanson 1980) according to Eq. 5. The toxic response factors of Hg, Cd, As, Pb, Co, Cu, Ni, Cr, Zn, and Mn are 40, 30, 10, 5, 5, 5, 5, 2, 1, and 1, respectively, which can be used to assess the comprehensive risk from the combination of elements.
where Wk represents the weight of each heavy metal, Rk is toxic response factors; m is the number of elements in the comprehensive evaluation on potential risk.
In this study, the potential hazardous risk derived from Indicator Kriging was conducted using Geostatistical analyst in ArcGIS software (Esri inc., USA).

3 Results and discussion

3.1 Descriptive statistics of heavy metals in soils

The descriptive statistics of 445 heavy metals samples are summarized in Table 1. The average contents of As, Cd, Co, Cr, Cu, Hg, Mn, Ni, Pb and Zn were 5.04, 0.20, 10.87, 54.09, 17.57, 0.043, 597.08, 23.52, 27.78 and 63.10 mg/kg, respectively. The mean concentrations of As, Co, Cr and Cu were lower than the background values of eastern Shandong province (Dai et al., 2011), but their maximum concentrations were much higher than background values. The mean concentrations of Pb, Zn, Hg, Cd, Ni and Mn exceeded background values; in particular, the mean contents of Hg and Cd almost reached twice time their responding background values. The coefficient of variation (CV) is an independent measure of relative dispersion, and it is a useful tool to demonstrate the degree of discrete distribution of different elements. Commonly, the lithogenic element has relatively low CV, while the CV of the elements affected by anthropogenic sources tends to be quite high. Based on CV classification, As, Co, Mn, Pb and Zn (26.5%, 32.2%, 21.7%, 21.8% and 31.8%) had moderate variability (15%<CVs<0.36%) , while Cd, Cr, Cu, Hg and Ni (196.9%, 50.6%, 50.6%, 385.0% and 54.6%) had high variability (CVs>36%). It could be suggested that the CVs of Hg and Cd were higher than other elements, and the two elements may be dominated by anthropogenic sources. The skewness values of heavy metal contents showed larger variability of heavy metal contents, with positively skewed frequency distribution. This is common for heavy metals as a result of its common presence of a point source contamination. The skewness of various elements followed a decreasing trend of Cd > Hg > Ni > Cu > Cr > Pb > Zn > Co > As> Mn, the skewness of Cd and Hg were quiet higher than others, indicating that the distribution of Cd and Hg in the study area was highly asymmetric.
Table 1 The descriptive statistics contents of heavy metals in Rizhao, East China (mg/kg)
Range Min Max Median Mean SD CV (%) Skewness Kurtosis Background values of eastern Shandong province (Dai et al., 2011)
As 9.90 1.90 11.80 4.90 5.04 1.335 26.5 0.755 1.323 6.30
Cd 4.78 0.026 4.81 0.095 0.20 0.227 196.9 19.922 413.056 0.108
Co 22.80 3.00 25.80 10.30 10.87 3.497 32.2 0.975 1.248 11.00
Cr 265.40 12.20 277.60 46.00 54.09 27.387 50.6 2.934 14.994 56.20
Cu 94.90 4.90 99.80 15.60 17.57 8.896 50.6 3.699 22.382 19.60
Hg 3.27 0.008 3.28 0.025 0.043 0.165 385.0 17.628 338.390 0.029
Mn 920.00 292.00 1212.00 595.50 597.08 129.84 21.7 0.542 1.383 552.00
Ni 159.20 7.10 166.30 20.20 23.52 12.829 54.6 4.346 37.054 23.50
Pb 54.10 18.20 72.30 26.30 27.78 6.045 21.8 2.340 9.511 25.40
Zn 152.30 18.30 170.60 60.30 63.10 20.087 31.8 1.077 2.633 56.10

3.2 Comparison of the contents between Rizhao and other regions

Table 2 illustrates the heavy metals levels in Rizhao compared with other regions in the world. The mean content of As in the study area was the lowest among various regions mentioned above. The average content of Cd was lower than Alicante, Ebro, Zagreb, Galicia, Kavadarci, Ireland, and Yangzhong, and higher than other regions. For Co, the mean content was lower than other regions expect for Alicante and Ireland. The mean content of Cr was close to Luhe, Zagreb and Galicia, and lower than Ju, Zhengding and Yangzhong. The level of Cu was relatively low, merely higher than Huizhou, Ebro, Ireland and Duero. The mean value of Hg contents sampled in Rizhao was close to Ebro and Juxian county, and lower than other regions. Mn showed the average content close to Juxian county and Zagreb. The mean content of Ni, similar to Galicia, was lower than Juxian county, Piemonte, Luhe, Zagreb, Zhengding, Kavadarci, and Yangzhong. The mean value of Pb contents, except lower than Juxian county, Huizhou, and Yangzhong, was higher than other regions. The average content of Zn in the study area was close to Piemonte and Ireland, but lower than Juxian county, Luhe, Zagreb, Galicia, Shunyi, Zhengding and Yangzhong. Overall, in the presented study, As, Cu and Hg exhibited relatively lower level compared with other regions, Cd, Co, Ni, Mn, and Zn showed moderate position in all the regions, while Cr and Pb have an upper position among various regions.
Table 2 The mean contents of Rizhao compared with typical regions in the world (mg/kg)
As Cd Co Cr Cu Hg Mn Ni Pb Zn References
Rizhao 5.04 0.20 10.87 54.09 17.57 0.04 597.08 23.52 27.78 63.10 This work
Juxian county - 0.13 13.26 68.28 22.97 0.037 598.65 29.36 28.4 65.81 (Lv et al., 2014)
Huizhou 10.19 0.1 - 27.61 16.74 0.22 - 14.89 44.66 57.21 (Cai et al., 2012)
Alicante - 0.34 7.1 26.5 22.5 - 295 20.9 22.8 52.8 (Mico et al., 2006)
Ebro - 0.415 - 20.27 17.33 0.0356 - 20.5 17.54 57.53 (Rodríguez Martín
et al., 2006)
Piemonte - - 19.001 46.157 58.309 - - 83.163 16.101 62.683 (Facchinelli et al., 2001)
Luhe - 0.046 - 55.01 23.94 0.07 - 29.37 27.37 65.12 (Zhao et al., 2010)
Zagreb - 0.4 10.9 54.6 56.1 - 579 35.2 23.2 77.9 (Sollitto et al., 2010)
Galicia - 0.31 14 54.1 20.5 - 659.9 23.5 11.7 98.7 (Franco-Uria et al., 2009)
Shunyi 7.85 0.136 - - 22.4 0.073 - - 20.4 69.8 (Lu et al., 2012)
Zhengding 6.16 0.15 - 57.77 21.22 0.08 - 25.04 18.8 69.96 (Yang et al., 2009)
Kavadarci 8.5 0.32 15 50 30 - 780 74 21 56 (Stafilov et al., 2013)
Ireland 10.2 0.326 6.2 42.6 16.2 0.086 462 17.5 24.8 62.6 (Zhang, 2006)
Yangzhong - 0.3 - 77.2 33.9 0.2 - 38.5 35.7 98.1 (Huang et al., 2007)
Duero - 0.159 - 20.53 11.01 0.0421 - - 15.08 42.42 (Nanos and Rodríguez
Martín, 2012)

“-” represents unavailable

3.3 Multivariate analysis of heavy metals in soils

3.3.1 Correlation analysis results
Correlation analysis can provide the interesting information on the relationship among various elements, and commonly high correlation between elements could indicate the common source. Pearson’s correlation coefficients of heavy metals in soils are summarized in Table 3. Correlation coefficients of Co-Cr, Mn-Co, Ni-Co, Mn-Cr, Ni-Cr and Ni-Mn were 0.739, 0.719, 0.700, 0.403, 0.947 and 0.367, respectively, and have passed the 0.01 level significance tests. The strongly positive correlation among Co, Cr, Mn and Ni commonly indicates their natural sources. As, Cd, Cu, Hg, Pb and Zn had little correlation with other elements (r<0.25), and these relationships among these heavy metals should be further assessed by multivariate analysis. The correlation analysis results suggested that there existed some original relationship between heavy metals, and indicated different possible sources of elements.
Table 3 Correlation coefficient matrix of heavy metals in soils
As Cd Co Cr Cu Hg Mn Ni Pb Zn
As 1 0.029 -0.009 -0.044 0.208** 0.031 0.044 -0.060 -0.066 -0.105*
Cd 0.029 1 0.036 0.020 0.084* 0.030 0.071 0.025 0.199** -0.047
Co -0.009 0.036 1 0.739** 0.367** 0.012 0.719** 0.700** 0.164** 0.115**
Cr -0.044 0.020 0.739** 1 0.256** -0.010 0.403** 0.947** 0.004 0.022
Cu 0.208** 0.084* 0.367** 0.256** 1 -0.016 0.284** 0.249** 0.142** -0.055
Hg 0.031 0.030 0.012 -0.010 -0.016 1 0.029 -0.020 -0.025 -0.016
Mn 0.044 0.071 0.719** 0.403** 0.284** 0.029 1 0.367** 0.251** 0.232**
Ni -0.060 0.025 0.700** 0.947** 0.249** -0.020 0.367** 1 0.030 -0.035
Pb -0.066 0.199** 0.164** 0.004 0.142** -0.025 0.251** 0.030 1 -0.066
Zn -0.105** -0.047 0.115** 0.022 -0.055 -0.016 0.232** -0.035 -0.066 1

** represents significant at the 0.01 level

* represents significant at the 0.05 level

3.3.2 PCA analysis results
Principal component analysis is a powerful tool to identify effective sources of heavy metals. The results of PCA in the topsoil are shown in Table 4 and Figure 2. Four principal components (PC1, PC2, PC3 and PC4) were obtained with an Eigen value higher than 1, together explaining 73.7% variance of the total data. The 36.1% variance was explained by PC1, showing elevated loadings of Co, Cr, Mn, Ni, Zn, and moderate loading of Cu and Pb. PC2 amounted on 15.4% variance of total data, and showed significant loadings of Cd (0.881) and Pb (0.726). PC3 with the 12.1% variance was dominated by the loading As and Cu. PC4 with a variance loading of 10.1% was merely dominated by Hg.
3.3.3 Cluster analysis results
Although CA is not notably different from PCA, this method is an alternative to confirm the results. The cluster analysis results for the heavy metal contents in the studied soils are illustrated in Figure 3. It can be seen that cluster analysis coincided with the PCA. The total data can be divided in to four clusters. Cluster 1 included Cr, Ni, Co, Mn and Zn, which was consistent with the PC1. Cluster 2 contained As and Cu, which were grouped in the PC 3. Pb, Cd and Hg were contained in the cluster 3, which could reflect the PC2 and PC4. It can be demonstrated that the relationship of heavy metals was consistent with PCA.
3.3.4 Sources identification of heavy metals in soils
Based on correlation analysis, PCA and CA results, four elements groups could be identified. As, Cr, Co, Cu, Ni, Mn, partially Pb and partially Zn associated with PC1 were mainly controlled by natural sources. Cd and partially Pb originated from human activities. Hg, as an isolated element, was dominated by human inputs.
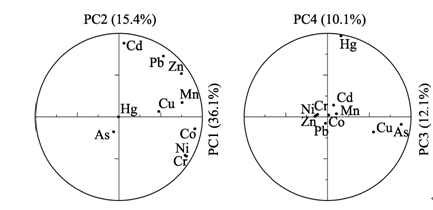
Figure 2 The loadings of the first four principal components
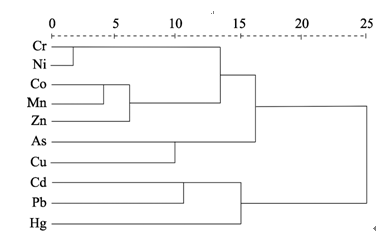
Figure 3 The result of cluster analysis
The heavy metals in Group 1, Cr, Ni, Co and Mn, with strongly positive correlations in the correlation analysis, had highly positive loading in PC1 and were classified together in CA. The mean contents of Co, Cr, Mn, Ni and Zn were close to or lower than the background value of eastern Shandong province. Sajn et al. (2011), Facchinelli et al. (2001), and Boruvka et al. (2005) suggested a lithogenic origin of Co, Cr, Mn, Ni and Zn in soils, and basic and ultrabasic rocks tend to present high contents than other parent materials. Therefore, it seemed reasonable to infer that PC1 represented the natural origin.
Pb and Cd are commonly influenced by human activity. Pb mainly resulted from the vehicle exhaust and coal combustion. Cd came from the application of fertilizers and pesticides; meanwhile waste water discharge from the electroplating and metallurgy also contribute to the Cd contents (Mico et al., 2006; Rodríguez Martín et al., 2006). Furthermore, the mean contents of Cd and Pb in the study area were much larger than the background values. Therefore, Cd and Pb were seemed to result from the anthropogenic sources.
As and Cu could also be considered lithogenic elements. The sources of As and Cu depend on the human activities in different areas (Sun et al., 2013). Some previous works found that As and Cu were affected by human inputs, such as coal combustion and the application of fertilizers. In the present study, the mean content of As and Cu were lower than background values, and they were negatively correlated with human elements. Therefore, based on the multivariate analysis of topsoil samples, we concluded that the natural sources dominated the As and Cu contents.
In this study, Hg is an isolated anthropogenic element in multivariate analysis, which also has been demonstrated in the works of Cai et al. (2012) and Davis et al. (2009). If an element has equivalent loads in two PCs, this element has the common properties of both PCs (Wang and Lu, 2011). Zn and Pb had the high load in both PC1 and PC2, and it could be concluded that the parent materials and human activities determined the contents of these elements. Cu with the loads in the two natural PCs could be considered as the natural sources.

3.4 Geostatistical analysis

Geostatistics were commonly employed to examine the spatial structure and variability of heavy metals. In the present study, Ordinary Kriging was applied to map the spatial patterns of four PCs derived from principal component analysis. The potential hazardous risk of elements is defined here as probability of exceeding the respective background value in eastern Shandong province (Dai et al., 2011), which could be delineated by Indicator Kriging.
3.4.1 Variograms fitting
The variogram could depict the variance of the sample values at various distances of separation, and provides the input parameters for the spatial interpolation of Kriging. The types of variograms mainly include Spherical, Exponential and Gaussian models, with parameters including nugget (Co), sill (Co+C), range values, coefficients of determination (R2). Nugget represents the experimental error and field variation within the minimum sampling spacing. The ratio of nugget to sill can be used to reflect the extent of spatial autocorrelations of the factors. If the ratio is less than 25%, the variable has strong spatial dependence; between 25% and 75%, the variable has moderate spatial dependence; and greater than 75%, the variable shows only weak spatial dependence. Strong spatial dependence of soil properties can be contributed to intrinsic factors (soil formation factors), and weak spatial dependence can be contributed to extrinsic factors. Coefficients of determination (R2) reflect the precision that elements are fitted by variogram.
The attributes of the variogram fitting are summarized in Table 5. The variograms of PC1, PC4, Cd, Co, Cr, Cu, Hg, Mn, Ni, Co-Cr-Mn-Ni-Zn, Cd-Pb, As-Cu and all elements integration variables were adjusted best to an exponential model and their ranges were between 1660m to 45900m. PC2, PC3, As and Pb variables could be fitted with spherical model, and Gaussian model was used to fit Zn variables. The values of R2 were greater than 0.553, showing that the variogram models gave good descriptions of spatial structure. The nugget/sill ratios of PC1, PC3, As, Co, Cr, Cu, Mn, Ni, Co-Cr-Mn-Ni-Zn and As-Cu were 0.192, 0.234, 0.197, 0.145, 0.191, 0.123, 0.125, 0.124, 0.212 and 0.125 respectively, indicating high spatial dependence due to the effects of natural factors such as parent materials and topography. The nugget/sill ratios of PC2, PC4, Cd, Hg, Pb, Zn, Cd-Pb and all elements integration ranged from 0.409 to 0.818, suggesting low spatial dependence related to anthropogenic factors.
Table 5 The variograms fitting of heavy metals in soils
Variable Model Co Co+C Co/Co+C R/m Rss R2
Ordinary Kriging PC1 Exponential 3.588 18.67 0.192 45900 7.42E-03 0.988
PC2 Spherical 1.297 2.195 0.591 13730 4.05E-03 0.964
PC3 Spherical 0.297 1.271 0.234 8240 1.45E-04 0.943
PC4 Exponential 0.137 0.167 0.818 3330 3.61E-03 0.553
Univariate
Indicator Kriging
As Spherical 0.046 0.233 0.197 8110 9.01E-04 0.875
Cd Exponential 0.108 0.235 0.460 28890 3.83E-04 0.975
Co Exponential 0.032 0.221 0.145 28680 3.55E-04 0.975
Cr Exponential 0.026 0.136 0.191 7770 4.67E-04 0.949
Cu Exponential 0.024 0.195 0.123 4620 3.51E-04 0.847
Hg Exponential 0.084 0.109 0.771 4500 8.50E-04 0.670
Mn Exponential 0.031 0.248 0.125 5760 2.86E-03 0.625
Ni Exponential 0.025 0.201 0.124 8460 3.70E-04 0.966
Pb Spherical 0.119 0.221 0.538 9480 9.46E-04 0.879
Zn Gaussian 0.130 0.318 0.409 32510 3.43E-04 0.994
Multiple
Variable
Indicator Kriging
Co-Cr-Mn-Ni-Zn Exponential 0.033 0.156 0.212 19530 1.54E-04 0.981
Cd-Pb Exponential 0.115 0.172 0.669 24540 1.48E-04 0.979
As-Cu Exponential 0.016 0.128 0.125 4740 2.04E-04 0.812
All elements Exponential 0.028 0.056 0.500 1660 7.49E-06 0.986
3.4.2 Spatial patterns of PCs
Figure 4 indicates the spatial patterns of various principal components. The spatial pattern of PC1 was characterized by high contents in western mountainous region and low content along the coastal areas, which was similar to the pattern of parent material. The soils from granite and metamorphic rock have higher geological background than alluviation and marine deposit along the coastal area. Therefore, the distribution of PC1 was controlled by the parent materials, which is consistent with the results of variogram analysis.
The high values of PC2 were located in western agricultural area and eastern urban area (Figure 4b). The developed economy and intensive industry resulted in the high values in eastern urban area. There is serious soil intrusion in the western part; however the soil fertility in the western part is higher than that in the eastern part, which could be attributed to the excessive application of chemical fertilizer in the western part. The application of chemical fertilizer in the western part is 2.39 times higher than the mean level in the whole study area (RMBS, 2012), which contributed to the high PC2 scores in the western part.
The higher region of PC3 is located in the coastal area (Figure 4c). The As content in urban area was higher than others, but it always was lower than the background value. The high geological background in alluviation and marine deposit was the dominating factor on the content of As, which is consistent with the tendency of the whole Shandong province (Dai et al., 2011). The spatial pattern of PC4 followed the decreasing trend from the eastern to the western part, and the high scores were consistent with the location of urban area, indicating its human source (Figure 4d).
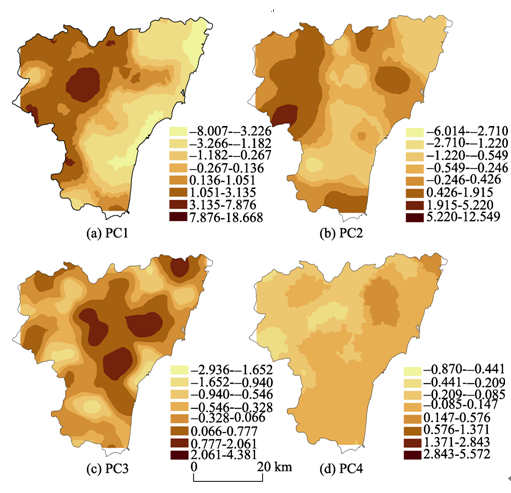
Figure 4 The spatial patterns of the principal components in Rizhao, East China
3.4.3 Delineating high risk areas by Indicator Kriging
Figures 5 and 6 illustrate the spatial distribution of hazardous risk of various elements and elements association in the topsoils. The kriged maps showed that the single element, elements association and their corresponding PCs had some similar features, indicating that it is reasonable to apply Indicator Kriging to delineate hazardous risk of heavy metals.
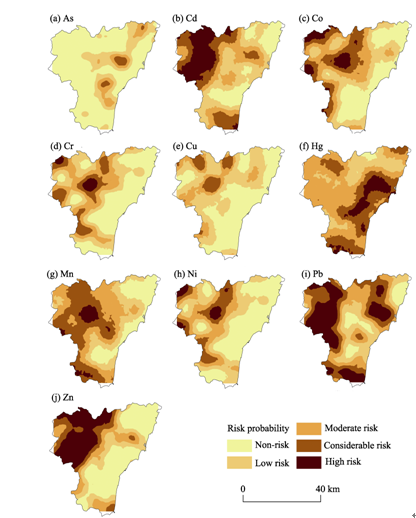
Figure 5 Risk probability maps of single heavy metals in Rizhao, East China
The spatial distributions of Co, Cr, Mn, Ni, Zn and Co-Cr-Mn-Ni-Zn were characterized by an overall tendency downward from western to eastern part, and the areas with high risk probabilities (Prob>0.8) were mainly located in the western part originated from granite and metamorphic rocks (Figures 5c, 5d, 5g, 5h 5j and 6a). For Cd-Pb, the high risk probability accounting for 5.5% of the total area was associated with the eastern urban part and the western study area (Figure 6b and Table 6). The map of As-Cu had the highest proportion of non-risk level and showed no area of high risk level (Figure 6c and Table 6). The probability map of Hg showed that high risk probability of Hg was evidenced in the eastern urban area, and covered 18503 hm2 of the total area (Figure 5f and Table 6).
For the comprehensive risk of all elements integration, no area was found to be in the highest risk level, and low and moderate risk level covered more than 90% of the study area (Table 6). The considerable risk was mainly located in western and eastern parts, which could be attributed to the high geological background in the western part and strong human activity in the eastern part.
Figure 6 Comprehensive risk probability of heavy metals in Rizhao, East China
Table 4 Results of factors matrix
Element PC1 PC2 PC3 PC4
As -0.065 -0.179 0.883 -0.091
Cd 0.160 0.881 0.173 0.140
Co 0.910 -0.144 0.014 0.023
Cr 0.810 -0.471 -0.118 0.029
Cu 0.477 0.065 0.551 -0.182
Hg -0.005 0.001 0.162 0.968
Mn 0.756 0.170 0.107 0.037
Ni 0.792 -0.460 -0.137 0.018
Pb 0.333 0.726 -0.025 -0.077
Zn 0.748 0.518 -0.151 0.004
Table 6 Results of environmental risk assessment of Rizhao, East China
Probability
range
Co-Cr-Mn-Ni-Zn Cd-Pb As-Cu Hg All elements
Area
(hm2)
Percentage (%) Area
(hm2)
Percent-
age( %)
Area
(hm2)
Percentage (%) Area
(hm2)
Percentage
(%)
Area
(hm2)
Percentage
(%)
Non-risk
(0-0.2)
55804 30.2 45431 24.6 106320 57.6 3165 1.7 2197 1.2
Low risk (0.2-0.4) 49423 26.8 58031 31.4 61429 33.3 32820 17.8 68712 37.2
Moderate (0.4-0.6) 42652 23. 32384 17.5 16397 8.9 79396 43.0 102097 55.3
Considerable risk (0.6-0.8) 28841 15.6 38734 21.0 573 0.3 50835 27.5 11713 6.3
High risk (0.8-1.0) 7999 4.3 10139 5.5 0 0 18503 10.0 0 0

4 Conclusions

Based on 445 samples of a 2 km × 2 km grid soil data, the sources and hazardous risk of heavy metals were identified. The contents of As, Co, Cr and Cu were lower than the background values of eastern Shandong province, while Cd, Hg, Mn, Ni, Pb and Zn were higher than the background values. Cd and Hg were dominated by anthropogenic inputs. As, Co, Cr, Cu, Mn and Ni were controlled by parent materials. Pb and Zn came from the combination of human inputs and natural sources.
The spatial distribution maps of heavy metal contents were created based on geostatistical technique. The single element, elements association and its corresponding PCs have some similar features, indicating that it is reasonable to apply Indicator Kriging in the delineating risk of heavy metals. The relatively high level of comprehensive risk was found to be located in the western and eastern parts, and furthermore more measures should be taken to prevent soil environmental deterioration in these areas.

The authors have declared that no competing interests exist.

1
Alloway B, 1995. Heavy Metals in Soils. London: Chapman and Hall.

2
Boruvka L, Vacek O, Jehlicka J, 2005. Principal component analysis as a tool to indicate the origin of potentially toxic elements in soils.Geoderma, 128: 289-300.ABSTRACT Distinguishing between different sources of potentially toxic elements in soils can be difficult. This paper describes an application of principal component analysis (PCA) to distinguish between geogenic enrichment and anthropogenic pollution with Be, Cd, Co, Cr, Cu, Hg, Ni, Pb, and Zn at 14 localities in Northern and North-eastern Czech Republic. Element speciation, profile distribution, and local geology were used to facilitate interpretation of the PCA results. Of the total element contents in the topsoil and subsoil, a group of non-polluting elements, comprising Co, Cr, Cu, Ni, and Zn, was identified by PCA. There were more non-polluting elements in the subsoil than in the topsoil. The silicate-bound fraction was the most abundant in their speciation. They are likely to be mainly of geogenic origin, therefore. Beryllium also probably originated mainly from parent rocks. However, it had a closer relationship with geogenic Hg and Pb. Cadmium, Pb, and Hg showed strong topsoil enrichment. In speciation, there were larger proportions of their mobile and mobilizable fractions. This implies a significant contribution of anthropogenic pollution to their soil content. In addition, sites with some geochemical anomaly and polluted sites were indicated by the PCA. The analysis provided a concise summary of the complex information on both the generally prevailing origin of potentially toxic elements and the origin of elements at individual sampling localities.

DOI

3
Cai L M, Xu Z C, Ren M Z.et al., 2012. Source identification of eight hazardous heavy metals in agricultural soils of Huizhou, Guangdong Province, China.Ecotoxicology and Environmental Safety, 78: 2-8.One hundred and four surface samples and 40 profiles samples in agricultural soils collected from Huizhou in south-east China were monitored for total contents of 8 heavy metals, and analyzed by multivariate statistical techniques and enrichment factor (EF), in order to investigate their origins. The results indicate that the concentrations of Cu, Zn, Ni, Cr, Pb, Cd, As and Hg in soils are 16.74, 57.21, 14.89, 27.61, 44.66, 0.10, 10.19 and 0.22 mg/kg, respectively. Compared to the soil background contents in Guangdong Province, the mean concentrations of Hg, Cd, Zn, Pb and As in soil of Huizhou are higher, especially Hg and Cd, which are 2.82 and 1.79 times the background values, respectively. Cr, Ni, Cu, partially, Zn and Pb mainly originate from a natural source. Cd, As, partially, Zn mainly come from agricultural practices. However, Hg, partially, Pb originate mainly from industry and traffic sources.

DOI PMID

4
Chu H J, Lin Y P, Jang C S.et al., 2010. Delineating the hazard zone of multiple soil pollutants by Multivariate Indicator Kriging and conditioned Latin hypercube sampling.Geoderma, 158: 242-251.

5
Dai J R, Pang X G, Yu C.et al., 2011. Geochemical baselines and background values and element enrichment characteristics in soils in eastern Shandong province.Geochimica, 40: 577-587. (in Chinese)Base on the agro-ecological geochemical survey of east Shandong Province,the differences of geochemical background values and baselines of 54 elements or indicators in soil between the study region and China were studied.Most of the elements or indicators of the surface soil were inherited from the parent material,with limited human influences.Meanwhile,obvious changes were found in the distributions of Zn,Pb,Cu,Se,Cd,S,P,Hg,N,OrgC,etc in surface soil,which may be attributed to the hypergenesis or human activities.The assessment and identification method on the enrichment of heavy metals in soil caused by human activities were discussed through the comparison of elements correlation relationship between surface and deep soil.Several heavy metals,Hg,Cd,Pb,As,Zn,Se,S,etc,were strongly enriched in surface soil in Laizhou-Zhaoyuan-Yantai and Muping-Rushan gold field and populated area in cities.The comparison study between soil elements distribution in typical vertical profile and geological background indicates that the enrichment of heavy metals in surface soil profile in some regions of eastern Shandong Province may be attributed to the geology background and human activities(gold mine,industrial activities,urban emissions,etc).

DOI

6
Davis H T, Aelion C M, McDermott S.et al., 2009. Identifying natural and anthropogenic sources of metals in urban and rural soils using GIS-based data, PCA, and spatial interpolation.Environmental Pollution, 157: 2378-2385.

7
Diodato N, Ceccarelli M, 2004. Multivariate Indicator Kriging approach using a GIS to classify soil degradation for Mediterranean agricultural lands.Ecological Indicators, 4: 177-187.<h2 class="secHeading" id="section_abstract">Abstract</h2><p id="">Land evaluation is sensitive to the effects of variability of ecologically complex phenomena. A probability map incorporating some of these phenomena is proposed to account for local uncertainty of areas affected by soil degradation in the Apennines of south Italy. To be useful, a method for assessing soil degradation should integrate several kinds of data. We present here an overview of the geostatistical approach to solving this problem: non-linear estimation. The following factors have been considered: the <em>soil erosion</em> by water (geomorphologic indicator), the <em>station aridity</em> (bioclimate indicator), and <em>top-soil depth</em> (pedologic indicator). We convert the continuous data values of each variable at each location using a binary variable indicator transform based on critical thresholds. The indicator transform values for individual variables are then integrated to form multiple variable indicator transform (MVIT) to evaluate the degree of soil degradation. Areas suited to soil degradation maps delineated by geographical information system (GIS), showed that the joint probabilities of meeting specific criteria indicator Kriging were influenced by the critical threshold values used to transform each individual variable and the method of integration. So, the understanding of soil vulnerability to degradation is increased to providing a way to classify degraded regions. On the basis of this information different land uses strategies could be identified to develop sustainable assessment models of soils. For example, many countries of these disadvantaged areas, should have agro-forestation programmes that increase the heterogeneity in vegetation cover contrasting hydrological properties, thus promoting a self-regulating system for runoff and erosional soil degradation control.</p>

DOI

8
Eldeiry A A, Garcia L A, 2011. Using Indicator Kriging technique for soil salinity and yield management.Journal of Irrigation and Drainage Engineering-ASCE, 137: 82-93.This paper presents a practical method to manage soil salinity and yield in order to obtain maximum economic benefits. The method was applied to a study area located in the southeastern part of the Arkansas River Basin in Colorado where soil salinity is a problem in some areas. The following were the objectives of this study: (1) generate classified maps and the corresponding zones of uncertainty of expected yield potential for the main crops grown in the study area; (2) compare the expected potential productivity of different crops based on the soil salinity conditions; and (3) assess the expected net revenue of multiple crops under different soil salinity conditions. Four crops were selected to represent the dominant crops grown in the study area: alfalfa, corn, sorghum, and wheat. Six fields were selected to represent the range of soil salinity levels in the area. Soil salinity data were collected in the fields using an EM-38 and the location of each soil salinity sample point was determined using a global position system unit. Different scenarios of crops and salinity levels were evaluated. Indicator variograms were constructed for each scenario to represent the different classes of percent yield potential based on soil salinity thresholds of each crop. Indicator kriging (IK) was applied to each scenario to generate maps that show the expected percent yield potential areas and the corresponding zones of uncertainty for each of the different classes. Expected crop net revenue for each scenario was calculated and all the results were compared to determine the best scenarios. The results of this study show that IK can be used to generate guidance maps that divide each field into areas of expected percent yield potential based on soil salinity thresholds for different crops. Zones of uncertainty can be quantified by IK and used for risk assessment of the percent yield potential. Wheat and sorghum show the highest expected yield potential based on the different soil salinity conditions that were evaluated. Expected net revenue for alfalfa and corn are the highest under the different soil salinity conditions that were evaluated.

DOI

9
Facchinelli A, Sacchi E, Mallen L, 2001. Multivariate statistical and GIS-based approach to identify heavy metal sources in soils.Environmental Pollution, 114: 313-324.The knowledge of the regional variability, the background values and the anthropic vs. natural origin for potentially harmful elements in soils is of critical importance to assess human impact and to fix guide values and quality standards. The present study was undertaken as a preliminary survey on soil contamination on a regional scale in Piemonte (NW Italy). The aims of the study were: (1) to determine average regional concentrations of some heavy metals (Cr, Co, Ni, Cu, Zn, Pb); (2) to find out their large-scale variability; (3) to define their natural or artificial origin; and (4) to identify possible non-point sources of contamination. Multivariate statistic approaches (Principal Component Analysis and Cluster Analysis) were adopted for data treatment, allowing the identification of three main factors controlling the heavy metal variability in cultivated soils. Geostatistics were used to construct regional distribution maps, to be compared with the geographical, geologic and land use regional database using GIS software. This approach, evidencing spatial relationships, proved very useful to the confirmation and refinement of geochemical interpretations of the statistical output. Cr, Co and Ni were associated with and controlled by parent rocks, whereas Cu together with Zn, and Pb alone were controlled by anthropic activities. The study indicates that background values and realistic mandatory guidelines are impossible to fix without an extensive data collection and without a correct geochemical interpretation of the data.

DOI PMID

10
Franco-Uria A, Lopez-Mateo C, Roca E.et al., 2009. Source identification of heavy metals in pastureland by multivariate analysis in NW Spain.Journal of Hazardous Materials, 165: 1008-1015.Arable layer of pastureland in Galicia (NW Spain) was monitored for total content of heavy metals, and analysed by multivariate statistical techniques, in order to investigate the different origin that metals may have in pasture soils. Principal component analysis (), cluster analysis (CA) and correlation matrix (CM) were applied to 65 samples in which the total concentrations of Mn, Fe, Zn, Cu, Cr, Co, Ni, Cd and Pb were measured. Four significant components were extracted by , explaining 78.830% of total variance. Mn, Co and Ni (and partially Cu), and Fe and Cr, were associated in two lithogenic components, respectively, while an anthropogenic origin was identified for Cd, Pb and Zn. Zn (and Cu) were mainly associated with soil fertilisation by slurry or with other activities regarding management. Although the origin of Cd and Pb was also attributed to slurry application, other sources like commercial fertilisers, vehicle exhaust or aerial deposition were not discarded as possible contributors. CA confirmed and completed the results obtained by , classifying the data in four groups representing different areas. Group 1 represented samples corresponding to areas were the application of manure was moderate, while Group 2 included samples of lithogenic origin. Highest contents of anthropogenic metals were included in Group 3, although soils in this cluster were not considered as polluted. The last cluster grouped the samples with the lowest content of all the metals analysed, representing areas correctly managed and not affected by other external sources. Finally, the results obtained by CM agreed with and CA, also helping in elucidating individual relationships between metals.

DOI PMID

11
Fu K, Sun B, He D.et al., 2012. Pollution assessment of heavy metals along the Mekong River and dam effects.Journal of Geograhical Sciences, 22(5): 874-884.

DOI

12
Goovaerts P, 1997. Geostatistics for Natural Resources Evaluation. New York: Oxford University Press.

13
Hakanson L, 1980. An ecological risk index for aquatic pollution-control: A sedimentological approach.Water Research, 14: 975-1001.The aim of this work has been to penetrate one of many possible avenues towards a potential ecological risk index to be used as a diagnostic tool for water pollution control purposes, i.e. to sort out which lakes/basins and substances should be given special attention. The work is based on the thesis that a sedimentological risk index for toxic substances in limnic systems should at least,account for the following four requirements.

DOI

14
Halvorson J J, Smith J L, Papendick R I, 1996. Integration of multiple soil parameters to evaluate soil quality: A field example.Biology and Fertility of Soils, 21: 207-214.Development of a method to assess and monitor soil quality is critical to soil resource management and policy formation. To be useful, a method for assessing soil quality must be able to integrate many different kinds of data, allow evaluation of soil quality based on alternative uses or definitions and estimate soil quality for unsampled locations. In the present study we used one such method, based on non-parametric geostatistics. We evaluated soil quality from the integration of six soil variables measured at 220 locations in an agricultural field in southeastern Washington State. We converted the continous data values for each soil variable at each location to a binary variable indicator transform based on thresholds. We then combined indicator transformed data for individual soil variables into a single integrative indicator of soil quality termed a multiple variable indicator transform (MVIT). We observed that soil chemical variables, pools of soil resources, populations of microorgansims, and soil enzymes covaried spatially across the landscape. These ensembles of soil variables were not randomly distributed, but rather were systematically patterned. Soil quality maps calculated by kriging showed that the joint probabilities of meeting specific MVIT selection were influenced by the critical threshold values used to transform each individual soil quality variable and the MVIT selection criteria. If MVIT criteria adequately reflect soil quality then the kriging can produce maps of the probabilty of a soil being of good or poor quality.

DOI

15
Huang S S, Liao, Q L, Hua M.et al., 2007. Survey of heavy metal pollution and assessment of agricultural soil in Yangzhong district, Jiangsu Province, China.Chemosphere, 67: 2148-2155.<h2 class="secHeading" id="section_abstract">Abstract</h2><p id="">We investigated concentrations of Hg, Cd, Pb, Zn, Cu, As, Ni, and Cr in samples of soil, cereal, and vegetables from Yangzhong district, China. Compared to subsoils, the sampled topsoils are enriched in Hg, Cd, Cu, Pb, Zn, and As. High levels of Cd and Hg are observed in most agricultural soils. Concentrations of Cr and Ni show little spatial variation, and high Cu, Pb, and Zn contents correspond well to areas of urban development. High As contents are primarily recorded at the two ends of the sampled alluvion. The contents of Cd, Hg, and total organic carbon (TOC) increase gradually to maximum values in the upper parts of soil profiles, while Cr and Ni occur in low concentrations within sampled profiles. As, Pb, Cu, and Zn show patterns of slight enrichment within the surface layer. Compared to data obtained in 1990, Cd and Hg show increased concentrations in 2005; this is attributed to the long-term use of agrochemicals. Cr and Ni contents remained steady over this interval because they are derived from the weathering of parent material and subsequent pedogenesis. The measured As, Cu, Pb, and Zn contents show slight increases over time due to atmospheric deposition of material sourced from urban anthropogenic activity. Low concentrations of heavy metals are recorded in vegetables and cereals because the subalkaline environment of the soil limits their mobility. Although the heavy metal concentrations measured in this study do not pose a serious health risk, they do affect the quality of agricultural products.</p>

DOI PMID

16
Imperato M, Adamo P, Naimo D.et al., 2003. Spatial distribution of heavy metals in urban soils of Naples city (Italy).Environmental Pollution, 124: 247-256.Concentrations of surface and sub-surface soil Cu, Cr, Pb and Zn in the Naples city urban area were measured in 1999. Contourmaps were constructed to describe the metals spatial distribution. In the most contaminated soil samples, metals were speciated by means of the European Commission sequential extraction procedure. At twelve sites, Cu, Pb and Zn levels in soil were compared with those from a 1974 sampling. Many surface soils from the urban area as well as from the eastern industrial district contained levels of Cu, Pb and Zn that largely exceeded the limits (120, 100 and 150 mg kg(-l) for Cu, Pb and Zn, respectively) set for soils of public, residential and private areas by the Italian Ministry of Environment. values were never above regulatory limits(120 mg kg(-1)). Copper apparently accumulates in soils contiguous to railway lines and tramway. Cu and Cr existed in soil mainly inorganic forms (-68%), whereas Pb occurs essentially as residual mineral phases (77%). The considerable presence of Zn in the soluble, exchangeable and bound fraction (23%) suggests this element has high potential bioavailability and leachability through the soil. Concentrations of Cu, Pb and Zn have greatly increased since the 1974 sampling, with higher accumulation in soils from roadside fields.

DOI PMID

17
Inigo V, Andrades M, Alonso-Martirena J I.et al., 2011. Multivariate statistical and GIS-based approach for the identification of Mn and Ni concentrations and spatial variability in soils of a humid Mediterranean environment: La Rioja, Spain.Water Air and Soil Pollution, 222: 271-284.The goal of the present work was to increase our knowledge on the behavior of manganese and nickel in soil within a Mediterranean environment. The study assessed the concentration levels of Mn and Ni (heavy metals selected for their essential role in the development of plants) in 250 soil horizon samples within 125 soil profiles of undisturbed soils in La Rioja (Spain). The study was undertaken to investigate and predict Mn and Ni concentrations on a regional scale. The analysis of spatial distribution of the elements was found to be affected by the nature of bedrock and, to a lesser extent, the anthropogenic origin. The variation of vertical distributions can be related, first, to natural sources-mainly the bed rocks-and, second, to soil processes. The geographical distribution of soil Mn is important to agriculture, nutrition, and health. Soil Mn and Ni maps of the area were elaborated, using geostatistics and geographic information systems. Mapping of geographical distributions will be useful in future research to determine regional patterns of Mn and Ni bioavailability, Mn and Ni deficiencies, and the possible consequences of land disposal of Mn- and Ni-laden wastes.

DOI

18
Jang C S, 2013. Use of Multivariate Indicator Kriging methods for assessing groundwater contamination extents for irrigation.Environmental Monitoring and Assessment, 185: 4049-4061.Multivariate geostatistical approaches have been applied extensively in characterizing risks and uncertainty of pollutant concentrations exceeding anthropogenic regulatory limits. Spatially delineating an extent of contamination potential is considerably critical for regional groundwater resources protection and utilization. This study used multivariate indicator kriging (MVIK) to determine spatial patterns of contamination extents in groundwater for irrigation and made a predicted comparison between two types of MVIK, including MVIK of multiplying indicator variables (MVIK-M) and of averaging indicator variables (MVIK-A). A cross-validation procedure was adopted to examine the performance of predicted errors, and various probability thresholds used to calculate ratios of declared pollution area to total area were explored for the two MVIK methods. The assessed results reveal that the northern and central aquifers have excellent groundwater quality for irrigation use. Results obtained through a cross-validation procedure indicate that MVIK-M is more robust than MVIK-A. Furthermore, a low ratio of declared pollution area to total area in MVIK-A may result in an unrealistic and unreliable probability used to determine extents of pollutants. Therefore, this study suggests using MVIK-M to probabilistically determine extents of pollutants in groundwater.

DOI PMID

19
Lark R M.,Ferguson, R B, 2004. Mapping risk of soil nutrient deficiency or excess by disjunctive and Indicator Kriging.Geoderma, 118: 39-53.The objective of this study was to compare DK and IK empirically. This was done using a large data set on available phosphorus in the topsoil of a field in Nebraska. A prediction subset of the data (247 points) was extracted and DK and IK were used to estimate, from these data, for each of the remaining (1622) validation data points, the conditional probabilities that available phosphorus was less than or equal to three threshold values. The two techniques were then compared by computing the proportion of the validation sites incorrectly classified, with respect to each threshold, by reference to the conditional probabilities. In fact IK and DK gave very similar results by this criterion. It was concluded that neither of the techniques could be generally recommended in preference to the other. There are practical considerations that could determine the best method to use in any given circumstance and these are summarized in a decision tree.

DOI

20
Lee C S, Li, X D, Shi W Z.et al., 2006. Metal contamination in urban, suburban, and country park soils of Hong Kong: A study based on GIS and multivariate statistics.Science of the Total Environment, 356: 45-61.

21
Lee J J, Liu C W, Jang C S.et al., 2008. Zonal management of multi-purpose use of water from arsenic-affected aquifers by using a Multi-variable Indicator Kriging approach.Journal of Hydrology, 359: 260-273.

22
Li K, Liang T, Wang L.et al., 2015. Contamination and health risk assessment of heavy metals in road dust in Bayan Obo Mining Region in Inner Mongolia, North China.Journal of Geographical Sciences, 25(12): 1439-1451.The objective of this study was to investigate the concentration and spatial distribution patterns of 9 potentially toxic heavy metal elements (As, Cd, Co, Cr, Pb, Cu, Zn, Mn, and Ni) in road dust in the Bayan Obo Mining Region in Inner Mongolia, China. Contamination levels were evaluated using the geoaccumulation index and the enrichment factor. Human health risks for each heavy metal element were assessed using a human exposure model. Results showed that the dust contained significantly elevated heavy metal elements concentrations compared with the background soil. The spatial distribution pattern of all tested metals except for As coincided with the locations of industrial areas while the spatial distribution of As was associated with domestic sources. The contamination evaluation indicated that Cd, Pb, and Mn in road dust mainly originated from anthropogenic sources with a rating of “heavily polluted” to “extremely polluted,” whereas the remaining metals originated from both natural and anthropogenic sources with a level of “moderately polluted”. The non-cancer health risk assessment showed that ingestion was the primary exposure route for all metals in the road dust and that Mn, Cr, Pb, and As were the main contributors to non-cancer risks in both children and adults. Higher HI values were calculated for children (HI=1.89), indicating that children will likely experience higher health risks compared with adults (HI=0.23). The cancer risk assessment showed that Cr was the main contributor, with cancer risks which were 2–3 orders of magnitude higher than those for other metals. Taken in concert, the non-cancer risks posed by all studied heavy metal elements and the cancer risks posed by As, Co, Cr, Cd, and Ni to both children and adults in Bayan Obo Mining Region fell within the acceptable range.

DOI

23
Lin Y P, Cheng, B Y, Shyu G S.et al., 2010. Combining a finite mixture distribution model with Indicator Kriging to delineate and map the spatial patterns of soil heavy metal pollution in Chunghua County, central Taiwan.Environmental Pollution, 158: 235-244.

24
Lu A X, Wang J H, Qin X Y.et al., 2012. Multivariate and geostatistical analyses of the spatial distribution and origin of heavy metals in the agricultural soils in Shunyi, Beijing, China.Science of the Total Environment, 425: 66-74.

25
Lv J, Zhang Z, Liu Y.et al., 2015. Identifying the origins and spatial distributions of heavy metals in soils of Ju county (Eastern China) using multivariate and geostatistical approach.Journal of Soils and Sediments, 15: 163-178.

26
Mico C, Recatala L, Peris A.et al., 2006. Assessing heavy metal sources in agricultural soils of an European Mediterranean area by multivariate analysis.Chemosphere, 65: 863-872.<h2 class="secHeading" id="section_abstract">Abstract</h2><p id="">According to the European Thematic Strategy for Soil Protection, the characterization of the content and source of heavy metals in soils are necessary to establish quality standards on a regional level that allow the detection of sampling sites affected by pollution. In relation to this, the surface horizons of 54 agricultural soils under vegetable crops in the Alicante province (Spain), a representative area of the European Mediterranean region, were sampled to determine the content of Cd, Co, Cr, Cu, Fe, Mn, Ni, Pb and Zn. Analytical determinations were performed by atomic absorption spectroscopy after microwave sample digestion in acid solution. Results indicated that heavy metal levels were similar to those reported by authors working on agricultural soils from other parts of the Mediterranean region, with the exception of Cu and Pb in some samples. Multivariate analysis (principal component analysis and cluster analysis) was performed to identify a common source for heavy metals. Moreover, soil properties were determined in order to characterize agricultural soils and to analyze relationships between heavy metal contents and soil properties. The content of Co, Cr, Fe, Mn, Ni and Zn were associated with parent rocks and corresponded to the first principal component called the lithogenic component. A significant correlation was found between lithogenic metals and some soil properties such as soil organic matter, clay content, and carbonates, indicating an important interaction among them. On the other hand, elements such as Cd, Cu and Pb were related to anthropic activities and comprised the second (Cu and Pb) and third principal components (Cd), designated the anthropogenic components. Generally, Cd, Cu and Pb showed a lower correlation with soil properties due to the fact that they remain in available forms in these agricultural soils. Taking into account these results and other achieved in other parts of the European Mediterranean region, it can be concluded that soil quality standards are highly needed to declare soils affected by human induced pollution. This is particularly relevant for anthropogenic metals (Cd, Cu and Pb, and in some areas also Zn). Further research in other agricultural areas of the region would improve the basis for proposing such soil quality standards.</p>

DOI PMID

27
Nanos N, Rodríguez Martín J A, 2012. Multiscale analysis of heavy metal contents in soils: Spatial variability in the Duero river basin (Spain).Geoderma, 189: 554-562.Source identification of heavy metals in soil is not straightforward since several inputs of either an anthropogenic or natural origin contribute to their total content. Here we explore the spatial variation and covariation of seven heavy metals (Cd, Cr, Ni, Pb, Zn, Cu and Hg) in the agricultural soils of the Duero river basin (one of the largest in Spain) where both anthropogenic activities (mainly agriculture and industry) and natural factors may be responsible for their total concentration. Factorial kriging and principal components analysis were used on a data set that comprised 721 soil samples. We found that the concentrations of heavy metals in the analysed samples do not exceed the limits set by Spanish legislation excepting mercury that presents high values in a limited number of samples (maximum 104102μg/kg). The linear model of coregionalization–the basic model for factorial kriging analysis–was composed of two structures (representing two scales of variation) with ranges of 2002km (local scale) and 13002km (regional scale). Six of seven elements (Cd, Cr, Ni, Pb, Zn and Cu) were found to be strongly correlated regardless of the spatial scale considered. In contrast, correlations of Hg with other elements were small at the local spatial scale but augmented substantially at the regional scale. We conclude that agricultural practices in the Duero basin have not altered yet the natural content for Cd, Cr, Ni, Pb, Zn and Cu. On the other hand, Hg inputs from human origin, most probably related to airborne emission and deposition from industrial plants, are observable at the local spatial scale. Finally, no human-induced correlations among heavy metals were detected at the regional spatial scale. Based on the results of this study and in accordance with the results obtained in the nearby Ebro river basin (Rodríguez et al., 2008) we conclude that anthropogenic heavy metals in soil are visible only at local spatial scales. In contrast, natural factors maximize their influence on the distribution of heavy metals when considering larger spatial scales.

DOI

28
Oyedele D J, Amusan A A, Obi A O, 1996. The use of Multiple-variable Indicator Kriging technique for the assessment of the suitability of an acid soil for maize.Tropical Agriculture, 73: 259-263.For adequate quantification of soil quality, specific indicators need to be measured spatially. The choice of indicators, however, depends on the use to which the quality assessment is to be put. The Multiple-Variable Indicator Kriging (MVIK) method provides a novel means of integrating these factors into a single index. The quality of virgin farmland for maize (Zea mays L.) farming was evaluated on a 250 m x 250 m plot. Soil samples were collected from 100-cm-deep auger holes dug on 30 m x 30 m grids in the field. Soil pH, cation exchange capacity, exchangeable Al++, organic C, and soil depth to plinthite were used as indicators for the assessment. The MVIK method was used to integrate these factors into a single index. Based on the variogram of the index, additional points were interpolated by kriging and a suitability probability contour map produced. Areas of low probability for meeting the criteria required for maize farming are indicated on the map. Soil conditions responsible for the failure to meet the criteria were identified, and ameliorative measures suggested. The usefulness of this technique for land evaluation for soil management and for environmental purposes was also discussed.

DOI

29
Rizhao Municipal Bureau of Statistics (RMBS), 2012. Rizhao Statistical Yearbook in 2012. Beijing: China Statistics Press. (in Chinese)

30
Rodríguez Martín J A, Arias M L, Corbi J M G, 2006. Heavy metals contents in agricultural topsoils in the Ebro basin (Spain). Application of the multivariate geoestatistical methods to study spatial variations.Environmental Pollution, 144: 1001-1012.

31
Sajn R, Halamic J, Peh Z.et al., 2011. Assessment of the natural and anthropogenic sources of chemical elements in alluvial soils from the Drava River using multivariate statistical methods.Journal of Geochemical Exploration, 110: 278-289.The objectives of this study are as follows: (a) an assessment of the geochemical background signature of the Drava Valley before the industrial revolution; (b) an evaluation of anthropogenic geochemical influences on the alluvial plains and river terraces in the valley; and (c) a determination of the spatial distribution of trace elements in the alluvial soils of the Drava River downstream of the Austrian-Slovenian border to the confluence of Mura and Drava Rivers.<br/>Samples of topsoil (depth of 0-5 cm) and subsoil (depth of 20-30 cm) were collected from 134 sampling sites on alluvial plains and river terraces. Analysis for 41 chemical elements was performed. Based on a comparison of statistical parameters, the spatial distribution of particular elements and the results of factor analysis, one anthropogenic and three natural geochemical associations were identified. The anthropogenic association (As-Ba-Cd-Mo-Pb-Sb-Zn) is mostly a result of historical zinc and lead mining and smelting in the Drava River watershed. The natural geochemical associations (Al-Fe-K-Co-Cr-Cu-Li-Ni-Rb-Sc-Th, Ti-Ce-La-Nb-Ta and Ca-Mg-Sr) were mainly influenced by lithology. The entire assessed area of about 130 km(2) is, according to Slovenian and Croatian legislation, critically polluted with trace elements, especially zinc. (C) 2011 Elsevier B.V. All rights reserved.

DOI

32
Sebai T, Lagacherie B, Soulas G.et al., 2007. Spatial variability of isoproturon mineralizing activity within an agricultural field: Geostatistical analysis of simple physicochemical and microbiological soil parameters.Environmental Pollution, 145: 680-690.

33
Smith J L, Halvorson J J, Papendick R I, 1993. Using Multiple-variable Indicator Kriging for evaluating soil quality.Soil Science Society of America Journal, 57: 743-749.Soil quality is the most important factor for sustaining the global biosphere. Soil quality may be defined in several different ways including productivity, sustainability, environmental quality, and effects on human nutrition. To quantify soil quality, specific soil indicators need to be measured spatially. These indicators are mainly soil properties whose values relate directly to soil quality but may also include policy, economic, or environmental considerations. Because assessing soil quality is complex, the individual soil quality indicators need to be integrated to form a soil quality index. This integration needs to be flexible enough to evaluate soil quality at spatial scales ranging from the farm to the regional level, be applicable to all types of agricultural land use, and be able to incorporate all types of soil quality information. We have developed a multiple-variable indicator ranging (MVIK) procedure that may provide a means to integrate soil quality parameters into an index to produce soil quality maps on a landscape basis. These maps would indicate the areas on a landscape that have a high probability of having good soil quality according to predetermined criteria. This procedure can provide probability maps based on any range of chosen criteria and thus is universally applicable. In addition, it allows the identification of the indicator parameter(s) responsible for zones of low soil quality, thus allowing specific management plans or land use policies to be developed.

DOI

34
Sollitto D, Romic M, Castrignano A.et al., 2010. Assessing heavy metal contamination in soils of the Zagreb region (Northwest Croatia) using multivariate geostatistics.Catena, 80: 182-194.<h2 class="secHeading" id="section_abstract">Abstract</h2><p id="">The assessment of soil contamination and location of pollution sources represent a crucial issue in soil remediation. Topsoil samples were collected in the Zagreb area (Northwest Croatia) and the total contents of trace and major elements were determined. A multivariate geostatistical analysis was used to estimate soil chemical composition variability. Factorial Kriging Analysis (FKA) was used to investigate the scale-dependent correlation structure of some variables by modelling co-regionalization of ten chemical variables, co-kriging specific factors and mapping them. The FKA provided two regionalized factors at different spatial scales of variability: the first factor at shorter range for Zn, Pb, Cd, Cu and Ni indicated different sources of anthropogenic contamination, whereas Ca (mainly loading on the longer range factor) was related to the lithology and parent material composition. The methodology used has proved to be a useful tool to separate geological and anthropogenic causes of variation in soil heavy metal content and to identify common pollution sources.</p>

DOI

35
Stafilov T, Sajn R, Alijagic J, 2013. Distribution of arsenic, antimony, and thallium in soil in Kavadarci and its surroundings, Republic of Macedonia.Soil & Sediment Contamination, 22: 105-118.

36
Sun C Y, Liu J S, Wang Y.et al., 2013. Multivariate and geostatistical analyses of the spatial distribution and sources of heavy metals in agricultural soil in Dehui, Northeast China.Chemosphere, 92: 517-523.The characterization of the content and source of heavy metals in soils are necessary to establish quality standards on a regional level and to assess the potential threat of metals to food safety and human health. The surface horizons of 114 agricultural soils in Dehui, a representative agricultural area in the black soil region, Northeast China, were collected and the concentrations of Cr, Ni, Cu, Zn, and Pb were analyzed. The mean values of the heavy metals were 49.7 +/- 7.04, 20.8 +/- 3.06, 18.9 +/- 8.51, 58.9 +/- 7.16, and 35.4 +/- 9.18 mg kg(-1) for Cr, Ni, Cu, Zn, and Pb, respectively. Anthropic activities caused an enrichment of Cu and Pb in soils. However, metal concentrations in all samples did not exceed the guideline values of Chinese Environmental Quality Standard for Soils. Multivariate and geostatistical analyses suggested that soil Cr, Ni, and Zn had a lithogenic origin. Whereas, the elevated Cu concentrations in the study area were associated with industrial and agronomic practices, and the main sources of Pb were industrial fume, coal burning exhausts, and domestic waste. Source identification of heavy metals in agricultural soil is a basis for undertaking appropriate action to reduce metal inputs. (C) 2013 Elsevier Ltd. All rights reserved.

DOI

37
Van Meirvenne M, Goovaerts P, 2001. Evaluating the probability of exceeding a site-specific soil cadmium contamination threshold.Geoderma, 102: 75-100.A non-parametric approach for assessing the probability that heavy metal concentrations in soil exceed a location-specific environmental threshold is presented. The methodology is illustrated for an airborne Cd-contaminated area in Belgium. Non-stationary simple indicator kriging, using a soft indicator coding to account for analytical uncertainty, was used in combination with declustering weights to construct the local conditional cumulative distribution function (ccdf) of Cd. The regulatory Cd contamination threshold (CT) depends on soil organic matter and clay content, which entails that its value is not constant across the study area and also is uncertain. Therefore, soft indicator kriging was used to construct the ccdfs of organic matter and clay. Latin hypercube sampling of the ccdfs of Cd, soil organic matter and clay yielded a map of the probability that Cd concentrations exceed the site-specific CT. Cross-validation showed that the ccdfs provide accurate models of the uncertainty about these variables. At a probability level of 80% we found that the CT was exceeded at 27.3% of the interpolated locations, covering 3192 ha of the study area, illustrating the extent of the pollution. Additionally, a new methodology is proposed to sample preferentially the locations where the uncertainty about the probability of exceeding the CT, instead of the uncertainty about the pollutant itself, is at a maximum. This methodology was applied in a two-stage sampling campaign to identify locations where additional Cd samples should be collected in order to improve the classification into safe and contaminated locations.

DOI

38
Wang H Y, Lu, S G, 2011. Spatial distribution, source identification and affecting factors of heavy metals contamination in urban-suburban soils of Lishui city, China.Environmental Earth Sciences, 64: 1921-1929.An investigation on spatial distribution, possible pollution sources, and affecting factors of heavy metals in the urban-suburban soils of Lishui city (China) was conducted using geographic information system (GIS) technique and multivariate statistics. The results indicated that the topsoils in urban and suburban areas were enriched with metals, such as Cd, Cu, Pb, and Zn. Spatial distribution maps of heavy metal contents, based on geostatistical analysis and GIS mapping, indicated that Cd, Cr, Cu, Mn, Ni, Pb, and Zn had similar patterns of spatial distribution. Their hot-spot areas were mainly concentrated in the densely populated old urban area of the city. Multivariate statistical analysis (correlation analysis, principal component analysis, and clustering analysis) showed distinctly different associations among the studied metals, suggesting that Cr, Cu, Ni, Pb, Cd, and Zn had anthropogenic sources, whereas Co and V were associated with parent materials and therefore had natural sources. The Cd, Cr, Ni, Pb, and Zn contents were positively correlated with soil organic matter, pH, and sand content (p < 0.01). It is concluded that GIS and multivariate statistical methods can be used to identify hot-spot areas and potential sources of heavy metals, and assess soil environment quality in urban-suburban areas.

DOI

39
Yalcin M G, Ilhan S, 2008. Multivariate analyses to determine the origin of potentially harmful heavy metals in beach and dune sediments from KizKalesi Coast (Mersin), Turkey.Bulletin of Environmental Contamination and Toxicology, 81: 57-68.<a name="Abs1"></a>The aim of this study was to investigate variations in heavy metal concentrations and natural and artificial sources of heavy minerals in beach and dune sediments along Kizkalesi (Mersin) coast in Turkey. To this aim, sand sediment samples were collected from 20 locations throughout Kizkalesi coast and concentrations of Zn, Ni, Cu, Co, V, Mo, Ag, Sb, Sn, Cd, W, Hg, Pb, As, Si, Al, Fe, Ca, Mg, S, K, Na, Cl, Ti, Mn and Cr were determined. Simple analyses (frequency histogram), multivariate analyses (Coefficient correlation, Cluster Analysis), Principal Component Analysis, Model Summary and ANOVA were used to analyze the concentration values. Al, Fe, Mg, Cl, Ti, Mn, Cr and Ni were dominant heavy metals. Principal Component Analysis revealed six principal components. It was confirmed by Cluster Analysis. Based on the Hierarchical Cluster analyses, three different general groups were formed at a 50% arbitrary similarity of Q-type level. The frequency histogram indicated that W, Ag, Co, V, Cu, As, Sn, Ni, Zn, Pb, Cr, Cl and Mg concentrations originated from the nearby area, while Mn, Ti, Al and Fe Mg concentrations came from either the nearby area or moderately remote sources. Data from the study area showed that the Model Summary (based on <i>R</i> <sup>2</sup>&nbsp;=&nbsp;100%) was sufficient for the statistical data and that the Model ANOVA (variations of Pb) had a high explanatory power. The region lying on Miocene carbonate rocks of the Tauride belt were affected by the contaminants of anthropogenic origin that included coastal deposits, coastal erosion, the Kizkalesi settlement area, urban wastes, Mersin-Antalya road extending parallel to the shoreline and disposal sites of hotels.

DOI

40
Yang P G, Mao R Z, Shao H B.et al., 2009. An investigation on the distribution of eight hazardous heavy metals in the suburban farmland of China.Journal of Hazardous Materials, 167: 1246-1251.Understanding spatial variability of hazardous soil heavy metals is an important precondition for suitably monitoring and evaluating eco-environment quality in the primary agricultural production zone. One hundred topsoils were sampled from the urban-rural transition zone in Taihang Piedmont Plain, China. The contents of eight heavy metals Cu, Zn, Cr, Ni, Pb, Cd, Hg and As were tested for each soil sample, and their spatial patterns were analyzed by the semivariogram approach of geostatistics and geographical information system (GIS) technology. Results showed that Cd concentration exceeded its background level. The local pollution from Cd attributed to the anthropogenic influence. The concentrations of eight hazardous heavy metals are relatively lower than the critical values of the national soil quality standard. The correlation distance of soil heavy metals ranged from 3.28 to 11.63 km, with the eight heavy metals having moderate spatial dependence. Cu, Cr, Ni, Pb and As are associated with and controlled by parent material. The results are helpful for improving agricultural and forest ecosystem in the and and semiarid region. (C) 2009 Elsevier B.V. All rights reserved.

DOI PMID

41
Zhang C S, 2006. Using multivariate analyses and GIS to identify pollutants and their spatial patterns in urban soils in Galway, Ireland.Environmental Pollution, 142: 501-511.Galway is a small but rapidly growing tourism city in western Ireland. To evaluate its environmental quality, a total of 166 surface soil samples (0-10 cm depth) were collected from parks and grasslands at the density of 1 sample per 0.25 km2 at the end of 2004. All samples were analysed using ICP-AES for the near-total concentrations of 26 chemical elements. Multivariate statistics and GIS techniques were applied to classify the elements and to identify elements influenced by human activities. Cluster analysis (CA) and principal component analysis (PCA) classified the elements into two groups: the first group predominantly derived from natural sources, the second being influenced by human activities. GIS mapping is a powerful tool in identifying the possible sources of pollutants. Relatively high concentrations of Cu, Pb and Zn were found in the city centre, old residential areas, and along major traffic routes, showing significant effects of traffic pollution. The element As is enriched in soils of the old built-up areas, which can be attributed to coal and peat combustion for home heating. Such significant spatial patterns of pollutants displayed by urban soils may imply potential health threat to residents of the contaminated areas of the city.

DOI PMID

42
Zhao Y, Wang Z G, Sun W X.et al., 2010. Spatial interrelations and multi-scale sources of soil heavy metal variability in a typical urban-rural transition area in Yangtze River Delta region of China.Geoderma, 156: 216-227.

Outlines

/