Research Articles

Calculation method for sediment load in flood and non-flood seasons in the Inner Mongolia reach of the Yellow River

  • WANG Yanjun , 1 ,
  • WU Baosheng , 1, * ,
  • ZHONG Deyu 1 ,
  • WANG Yongqiang 2
Expand
  • 1. State Key Laboratory of Hydroscience and Engineering, Tsinghua University, Beijing 100084, China
  • 2. Yangtze River Scientific Research Institute, Wuhan 430010, China

*Corresponding author: Wu Baosheng, PhD and Professor, specialized in hydraulics and river dynamics. E-mail:

Author: Wang Yanjun, PhD Candidate, specialized in geomorphology and fluvial process. E-mail:

Received date: 2016-01-01

  Accepted date: 2016-01-30

  Online published: 2016-06-15

Supported by

National Key Basic Research and Development Program of China, No.2011CB403304

National Science and Technology Supporting Plan of the Twelfth Five-year Plan, No.2012BAB02B02

Copyright

Journal of Geographical Sciences, All Rights Reserved

Abstract

Based on an empirical sediment transport equation that reflects the characteristics of “more input, more output” for sediment-laden flow in rivers, a general sediment transport expression was developed, which can take into account the effects of upstream sediment input, previous cumulative sediment deposition, critical runoff for sediment initiation, and the differences in sediment particle sizes between the mainstream and tributaries. Then, sediment load equations for non-flood and flood seasons for the sub-reaches from Bayangaole to Sanhuhekou and from Sanhuhekou to Toudaoguai, as well as the whole Inner Mongolia reach from Bayangaole to Toudaoguai, were formulated based on data collected between 1952 and 2010. The corresponding sediment deposition and the cumulative values at each river reach were calculated using the proposed sediment transport equations for the period 1952 to 2010 according to the principle of sediment conservation. Comparisons between the calculated and measured values using the proposed sediment load equations for the sub-reaches and the entire reach showed that the calculated sediment load and sediment deposition and the corresponding cumulative values in the flood and non-flood seasons were in good agreement with the measured values. These results indicated that the proposed methods can be applied to calculate the sediment load and the associated sediment deposition in the flood and non-flood seasons for long-term trend analysis of sediment deposition in the Inner Mongolia reach of the Yellow River.

Cite this article

WANG Yanjun , WU Baosheng , ZHONG Deyu , WANG Yongqiang . Calculation method for sediment load in flood and non-flood seasons in the Inner Mongolia reach of the Yellow River[J]. Journal of Geographical Sciences, 2016 , 26(6) : 707 -721 . DOI: 10.1007/s11442-016-1294-z

1 Introduction

Sediment transport and the associated sediment deposition in alluvial rivers are complex processes because they are affected by many factors, including the water and sediment input from the upstream, the conditions of the channel bed boundary, and the riverbed material composition. Numerous theoretical and empirical sediment transport equations have been proposed by various investigators (Einstein, 1950; Bagnold, 1966; Engelund and Hansen, 1967; Ackers and White, 1973; Yang, 1979) based on both experimental and field data. Those equations developed in fairly clear water are not suitable for the high rate of the suspended load in the Yellow River. The sediment transport rate in the Yellow River is related not only to the flow discharge input but also to the upstream sediment input because the sediment transport is often in a state of non-equilibrium conditions. This phenomenon is traditionally referred to as having the characteristics of “more input, more output” in the study of the Yellow River (Qian et al., 1981, 1987; Wu and Zhang, 2007).
To account for the characteristics of “more input, more output”, numerous studies of sediment transport in and channel morphologies of the Yellow River have been carried out (Zhang, 1959; Yang et al., 1996; Han, 2003; Wu et al., 2008). Some of them focused on the Inner Mongolia reach, a typical alluvial river reach of the upper Yellow River (Hou et al., 2007; Shen et al., 2007; Ran et al., 2009; Wu et al., 2010; Qin et al., 2011; Ta et al., 2015). For example, Zhang et al. (2008) established a sediment load equation based on the empirical sediment transport equation of “more input, more output” for the Inner Mongolia reach of the upper Yellow River. Unfortunately, due to use of a constant sediment transport coefficient, the agreement between the calculated and measured values was not good enough for any practical applications. Recently, Wu et al. (2015) developed an annual sediment load equation based on the same concept of “more input, more output” for the Inner Mongolia reach. In this new equation, the effect of previous cumulative sediment deposition, the upstream sediment input, the incoming water volume, and the differences in sediment particle sizes between the mainstream and tributaries were all taken into account. According to the principle of sediment conservation, the corresponding sediment deposition was calculated using the proposed sediment transport equation, and the calculated values were in good agreement with the measured values.
The runoff and sediment load in the Inner Mongolia reach have experienced significant changes since the 1950s, mainly due to the effects of human activities, including the construction of the reservoirs, canals for irrigation and water diversion. The proportion of runoff in the flood season accounting for the annual runoff decreased dramatically, while that in the non-flood season increased. The decreased runoff and peak discharge in the flood season has caused severe aggradation and shrinkage of the main channel, resulting in a decreased capacity for sediment transport and the raising water stage at the same discharge (Shang et al., 2008; Feng et al., 2009; Liu et al., 2009; Wang et al., 2012). Consequently, this has resulted in an increased pressure to control summer flood and ice flood which now threaten the local communities and their economic development.
Though many important factors were considered in the new sediment load equation proposed by Wu et al. (2015), it failed to consider the effect of the obvious inter-annual variation in flow and sediment load. In reality, the significant inter-annual differences in runoff and sediment load input may have a strong influence on sediment transport capacity and the accompanying sediment deposition processes. Therefore, this paper is intended to develop a method for the calculation of sediment load and the associated deposition volume in non-flood and flood seasons for the Inner Mongolia reach. The results may provide a scientific basis for the understanding of the sediment transport processes and the sediment deposition pattern in association with significant inter-annual differences in the runoff and sediment load input.

2 Study area

Located in the northernmost part of the Yellow River Basin in China (106°10′-112°50′E, 37°35′-41°50′N), the Inner Mongolia reach of the Yellow River begins at Shizuishan and ends in the Mazhai region, with a channel length of about 823 km (Figure 1). The reach from Bayangaole (Bayan Gol) to Toudaoguai is a typical alluvial channel and has a length of about 520 km and a longitudinal gradient in the range 0.11‰ to 0.14‰. This reach flows across the eastern border of the Ulan Buh Desert and the northern border of the Kubq Desert. As the main sediment supplier of the Inner Mongolia reach, ten tributaries (including Maobulang, Xiliugou, and Hantaichuan) flow through the Kubq Desert and into the main channel from the right bank of the Yellow River and supply about 20 million tons of sediment to the main channel annually (Zhao et al., 2008; Lin et al., 2014). The Kundulun and Wudanggou rivers join the Yellow River as the main tributaries from the left bank.
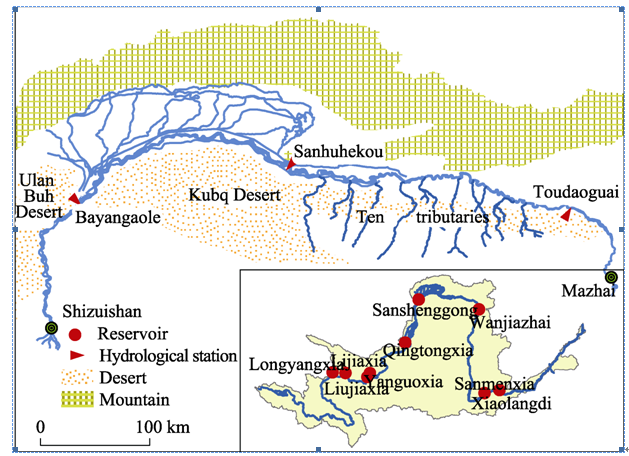
Figure 1 Sketch of the Inner Mongolia reach of the Yellow River
Since 1961, a series of water control projects in the upper Yellow River have been put into operation, including the Sanshenggong project (0.2×10⁸ m3) and the Yanguoxia reservoir (2.2×10⁸ m3) in 1961, the Qingtongxia reservoir (5.7×10⁸ m3) in 1967, the Liujiaxia reservoir (57×108 m3) in 1968, and the Longyangxia reservoir (247×108 m3) in 1986. Joint regulation of the cascade reservoirs has had a significant impact on the downstream channels. Severe sediment deposition occurred in the reach from Bayangaole to Toudaoguai before 1960, during this time period flow conditions were in a natural state without human activity. The channel bed was roughly in an equilibrium state during the period 1961-1986 because sediment load was significantly reduced by water projects in the upstream reaches. Though continuous sediment deposition occurred again in the period 1987-2010, it was slower than that before 1960 (Wu et al., 2015).

3 Data and methods

Data for runoff and sediment load in both flood and non-flood seasons between 1952 and 2010 were collected at the Bayangaole, Sanhuhekou, and Toudaoguai hydrological stations. The runoff and sediment load data were also collected for tributaries and water canals for diversion, in addition to aeolian sands entering the river reach. These data were retrieved mainly from the Hydrological Yearbooks (YRCC, 1952-2010) and partly from the River Sediment Bulletin of China published by the Ministry of Water Resources. Based on these collected data, methods for calculating the sediment load and the associated deposition volume in both flood and non-flood seasons were developed.
According to the empirical sediment transport equation of “more input, more output”, the sediment load along the stream can be expressed as follows (Wu and Zhang, 2007):
where Ws is the sediment load output at the reach outlet in the study, Wsu is the upstream sediment load input at the reach inlet, W is the runoff at the reach outlet (108 m3), a and b are exponents, related to the slope and the regime coefficient, respectively, reflecting the spatial change of sediment transport capacity with the boundary condition, and K is the sediment transport coefficient, related to the cumulative deposition volume, reflecting the temporal change of sediment transport capacity with the river boundary adjustment. Considering the large variability in sediment transport capacity in the Inner Mongolia reach, the difficulty in distinguishing the wash load and bed-material load, and the small proportion (about 3%) of the bedload in the total sediment load, the sediment loads used in this study are all the measured, suspended sediment load, including the wash load (Long and Zhang, 2002).
Based on Eq. (1), and taking into account the effect of cumulative deposition on the sediment transport coefficient, the critical runoff for the sediment initiation, and the upstream sediment input, Wu et al. (2015) obtained a general sediment transport expression as follows:
where 
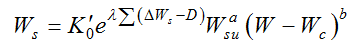
is the basis value of the sediment transport coefficient, reflecting the sediment transport capacity in equilibrium, λ is a coefficient, is a parameter of previous cumulative deposition (108 m3), is the erosion and deposition during the calculated period, D is the parameter of the average erosion and deposition (108 t), and Wc is the critical runoff for sediment initiation (108 m3), reflecting the flow energy for the critical sediment initiation. The sediment transport coefficient K in Eq. (1) can now be expressed as follows:
In the application of Eq. (2), when there are tributaries joined to the main channel, a simple method is to add the flow and sediment (including tributaries and canals for water diversion or drainage) into the beginning cross-section of the reach as water and sediment inflows. This treatment is feasible only when a relatively small amount of tributary sediment flows into the mainstream along the studied reach. But when a large amount of sediment is added to the mainstream, such a treatment may not be able to accurately reflect the different effects of sediment from the upstream channel and sediment from tributaries on the sediment transport processes and the associated channel morphology. By introducing the ratio of the representative particle sizes of the mainstream to the tributaries (called the correction parameter of particle sizes, η< 1), Eq. (2) can be rewritten as follows (Wu et al., 2015):
Eq. (4) is a general expression for sediment load calculation for high sediment-laden rivers, which takes into account the effects of upstream sediment input, previous cumulative sediment deposition, critical runoff for sediment initiation, and the differences in particle sizes between the mainstream and the tributaries (Wu et al., 2015).
We denote the average sediment deposition values in flood and non-flood seasons by DF and DNF, respectively. If we define the initial time as the end of a flood season, then the previous cumulative sediment deposition becomes zero. According to Eq. (4), the sediment load in the first non-flood season can be expressed as follows:
where WsNF1 is the calculated sediment load in the first non-flood season, K0NF is the basis value of the sediment transport coefficient in non-flood seasons, WsuNF1 is the upstream sediment input in the first non-flood season, WNF1 is the runoff in the first non-flood season, and WcNF is the critical runoff for sediment initiation in non-flood seasons.
At the end of the first non-flood season, the previous cumulative sediment deposition is Then the sediment load in the first flood season can be expressed as follows:
where WsF1 is the sediment load in the first flood season, K0F is the basis value of the sediment transport coefficient in flood seasons, is the upstream sediment input in the first flood season, WF1 is the runoff in the first flood season, and WcF is the critical runoff for sediment initiation in flood seasons.
At the end of the first flood season, the previous cumulative sediment deposition is Then, the sediment load in the second non-flood season can be expressed as follows:
At the beginning of the second flood season, the previous cumulative sediment deposition is Then, the sediment load expression in the second flood season can be expressed as follows:
Following the same procedure, we can derive the sediment load expression in the ith non-flood and flood seasons as follows:
It should be noted that the previous cumulative sediment deposition in Eqs. (5)-(10) does not include the sediment deposition in the current period because this parameter represents the effect of the previous cumulative sediment deposition on the sediment transport capacity in the current time period. In the application of Eqs. (5)-(10), if there are tributaries joining the main channel and the particle sizes of the tributaries and the mainstream are different, Wsu should be replaced by

4 Results

4.1 Sediment deposition in flood and non-flood seasons in the Inner Mongolia reach

Based on the measured flow and sediment data of the mainstream and tributaries, the values of sediment deposition at different sections in non-flood and flood seasons were calculated according to the principle of sediment conservation. The temporal variation of sediment deposition from Bayangaole to Sanhuhekou (B-S), from Sanhuhekou to Toudaoguai (S-T), and from Bayangaole to Toudaoguai (B-T) are shown in Figure 2. Table 1 presents the mean values of sediment deposition at different sections in non-flood and flood seasons during different time periods.
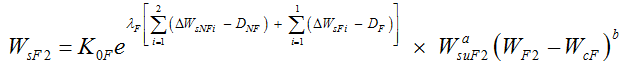
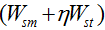
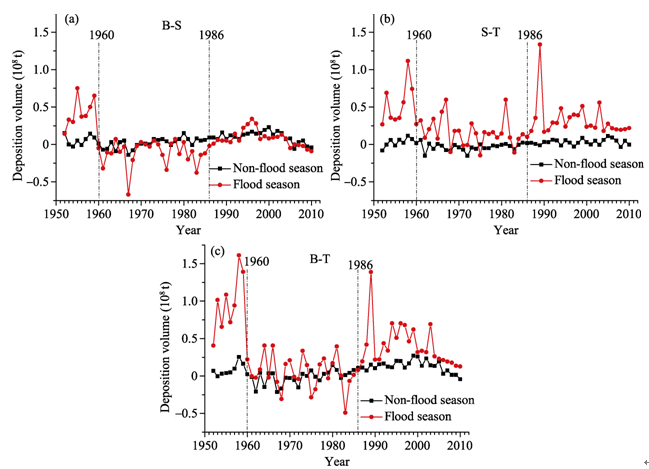
Figure 2 Annual variations in sediment deposition in non-flood and flood seasons in different sections of the Inner Mongolia reach
Table 1 Average sediment deposition in different sections of the Inner Mongolia reach
Year Period Annual sediment deposition (108 t)
Bayangaole-
Toudaoguai
Bayangaole-
Sanhuhekou
Sanhuhekou-
Toudaoguai
1952-1960 Non-flood season 0.079 0.052 0.028
Flood season 0.894 0.374 0.520
1961-1986 Non-flood season 0.014 0.020 -0.034
Flood season 0.048 -0.112 0.160
1987-2010 Non-flood season 0.130 0.100 0.030
Flood season 0.412 0.080 0.331
1952-2010 Non-flood season 0.059 0.057 0.002
Flood season 0.325 0.040 0.285
For the sub-reach from Bayangaole to Sanhuhekou, the annual sediment deposition was small, ranging from -0.14×10⁸ t to 0.23×10⁸ t. The average annual sediment deposition during 1952-2010 was only 0.097×10⁸ t. The maximum values in flood seasons were -0.67×10⁸ t in 1967 for erosion and 0.75×10⁸ t in 1955 for deposition. For the sub-reach from Sanhuhekou to Toudaoguai, the annual sediment deposition in the non-flood seasons was in the range -0.15×10⁸ t to 0.12×10⁸ t. The sediment deposition in the reach was generally in a state of balance between erosion and sedimentation during 1952-2010. Sediment deposition occurred in the flood seasons in most years; the maximum values were 1.33×10⁸ t in 1989 for deposition and -0.15×10⁸ t in 1975 for erosion.
For the whole reach from Bayangaole to Toudaoguai, the annual sediment deposition varied over a small range in non-flood seasons but over a relatively large range in flood seasons. The maximum values were 1.61×10⁸ t in 1958 for deposition and -0.49×10⁸ t in 1983 for erosion. The whole time period can be divided into three phases according to the status of erosion and sedimentation: a rapid deposition phase (before 1960), a moderate sediment deposition phase (1961-1986), and a slow deposition phase (1987-2010).
From the above analysis, we see that the range of variation of sediment deposition in flood seasons was large, while that in non-flood seasons was small. Sediment deposition in the sub-reach from Bayangaole to Sanhuhekou was larger than that in the sub-reach from Sanhuhekou to Toudaoguai in non-flood seasons, while sediment deposition in the sub-reach from Bayangaole to Sanhuhekou was smaller than that in the sub-reach from Sanhuhekou to Toudaoguai in flood seasons. Overall, the variation in sediment deposition for the whole reach from Bayangaole to Toudaoguai was consistent with that of the sub-reach from Bayangaole to Sanhuhekou in non-flood seasons, whereas the variation in sediment deposition for the whole reach from Bayangaole to Toudaoguai was consistent with that of the sub-reach from Sanhuhekou to Toudaoguai in flood seasons. It is clear then that the characteristics of sediment deposition in non-flood seasons were very different from those in flood seasons. Therefore it is desirable to have different calculation methods for sediment deposition in non-flood and flood seasons.

4.2 Equations for sediment load in non-flood and flood seasons

4.2.1 Equation for the sub-reach from Bayangaole to Sanhuhekou
By adding the interval input of flow and sediment in the sub-reach from Bayangaole to Sanhuhekou (including tributaries, canals for water diversion or drainage, and aeolian sand) into the inlet station of Bayangaole, we can obtain the total runoff and sediment load at the Sanhuhekou station. Based on these data and other measured flow and sediment data at the Bayangaole and Sanhuhekou stations during the period 1952-2010, the equations of sediment load at the Sanhuhekou station in non-flood and flood seasons, respectively, can be expressed, based on Eqs. (9) and (10), as follows:
where Ws(s) is the calculated sediment load at the Sanhuhekou station, Ws(b+i) is the upstream sediment input at the Bayangaole station together with those from the Bayangaole to Sanhuhekou section, W(s) is the measured runoff at the Sanhuhekou station, ΔWs(bs) is the measured sediment deposition in the sub-reach from Bayangaole to Sanhuhekou, n is the number of time steps, i denotes the ith time step counted from the initial time interval, and the subscripts NF and F denote the non-flood and flood seasons, respectively. Substituting the parameters in Eqs. (11) and (12) into Eq. (3), we can obtain values of the sediment transport coefficient K, which is in the range 0.007 to 0.019 with an average value of 0.011 for non-flood seasons and in the range 0.054 to 0.075 with an average value of 0.062 for flood seasons.
4.2.2 Equation for the sub-reach from Sanhuhekou to Toudaoguai
For the sub-reach from Sanhuhekou to Toudaoguai, the Kundulun and Wudangou rivers enter the main channel on the left bank and ten tributaries flow into the main channel on the right bank. Because the sediment diameter from the ten tributaries is much larger than that from upstream of the main channel, and the short-duration, hyper-concentrated flow with high peak discharges and high sediment load from the ten tributaries during the rainstorm seasons often causes severe deposition and blocks the main channel, it may not be appropriate to simply add the sediment load of the ten tributaries in flood seasons to the inlet of the reach. Instead, the sediment load from the ten tributaries in flood seasons should be separated from the sediment load at the Sanhuhehou station. Because there is barely any sediment produced in the ten tributaries in non-flood seasons, there is no need to separate the sediment load from the ten tributaries from the sediment load at the Sanhuhehou station.
Based on the measured flow and sediment data at the Sanhuhekou and Toudaoguai stations during the period 1952-2010, the equations for sediment load at the Toudaoguai station in non-flood and flood seasons, respectively, can be expressed, based on Eqs. (9) and (10), as follows:
where Ws(t) is the calculated sediment load at the Toudaoguai station, Ws(s+i)NF is the upstream sediment input including the Sanhuhekou station and the section from Sanhuhekou to Toudaoguai in non-flood seasons, Ws(s+i)F is the incoming sediment load except for that of the ten tributaries in flood seasons, Ws(tt)F is the incoming sediment load of the ten tributaries in flood seasons, W(t) is the measured water volume at the Toudaoguai station, and 
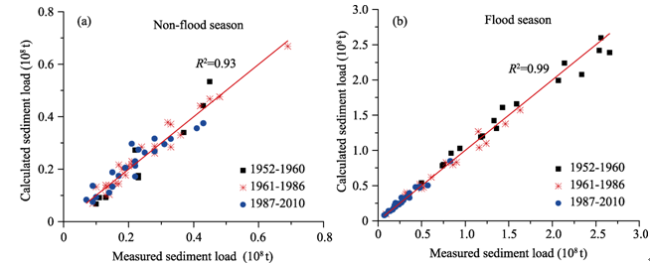
Ws(st) is the measured sediment deposition of the section from Sanhuhekou to Toudaoguai. Substituting the parameters in Eqs. (13) and (14) into Eq. (3), we can obtain values for the sediment transport coefficient K, which is in the range 0.014 to 0.022 with an average value of 0.017 for non-flood seasons and in the range 0.062 to 0.081 with an average value of 0.070 for flood seasons.
4.2.3 Equation for the whole reach from Bayangaole to Toudaoguai
On the basis of the flow and sediment data at the Bayangaole and Toudaoguai stations and the corresponding interval input between Bayangaole and Toudaoguai, we can use the Bayangaole station as the inlet to obtain the sediment load at the Toudaoguai station in order to investigate the sediment transport and sediment deposition process of the whole Inner Mongolia reach of the Yellow River. Based on the corresponding measured data at the Bayangaole and Toudaoguai stations during the period 1952-2010, the equations for sediment load for the Toudaoguai station in non-flood and flood seasons, respectively, can be expressed as follows:
where Ws(b+i)NF is the upstream sediment input at the Bayangaole station and from the corresponding interval between Bayangaole and Toudaoguai in non-flood seasons, Ws(b+i)F is the incoming sediment load excluding that of the ten tributaries in flood seasons, and ΔWs(bt) is the sediment deposition between Bayangaole and Toudaoguai. Substituting the parameters in Eqs. (15) and (16) into Eq. (3), we can obtain values of the sediment transport coefficient K, which was in the range 0.005 to 0.012 with an average value of 0.007 for non-flood seasons and in the range 0.022 to 0.032 with an average value of 0.026 for flood seasons.
4.2.4 Comparison of sediment load between calculated and measured values
Figure 3 shows the correlation between calculated and measured sediment load at the Sanhuhekou station in non-flood and flood seasons using Eqs. (11) and (12), for which the correlation coefficient R2 was as high as 0.93 for non-flood seasons and 0.99 for flood seasons. The correlation between calculated and measured sediment load at the Toudaoguai station in non-flood and flood seasons using Eqs. (13) and (14) is shown in Figure 4, for which the correlation coefficient R2 was as high as 0.94 for non-flood seasons and 0.97 for flood seasons. The correlation between calculated and measured sediment load at the Toudaoguai station in non-flood and flood seasons using Eqs. (15) and (16) is shown in Figure 5, for which the correlation coefficient R2 was as high as 0.92 for non-flood seasons and 0.96 for flood seasons. The above results indicate that accurate predictions can be obtained using the proposed sediment load equations for different sections of the Inner Mongolia reach of the Yellow River based on Eqs. (9) and (10).
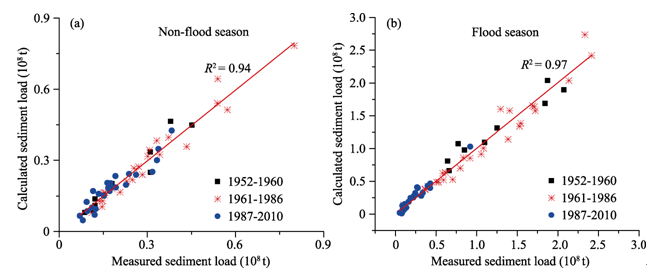
Figure 3 Comparison between calculated and measured sediment loads at Sanhuhekou station based on Eqs. (11) and (12)
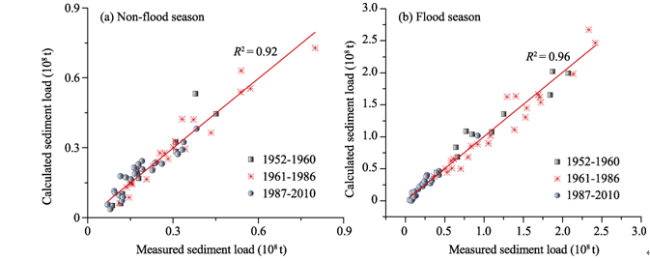
Figure 4 Comparison between calculated and measured sediment loads at Toudaoguai station based on Eqs. (13) and (14)
Figure 5 Comparison between calculated and measured sediment loads at Toudaoguai station based on Eqs. (15) and (16)

4.3 Calculation of sediment deposition for different sections

Once the sediment loads are calculated for different reaches using the proposed equations, the sediment deposition in non-flood and flood seasons can be computed according to the principle of sediment conservation, as follows:
where ΔWs is sediment deposition in the reach, Wsi is the incoming sediment load at the reach inlet, Wst is the incoming sediment load of tributaries, Wsd is the sediment load output of the drainage ditch; Wsw is the incoming aeolian sand (ignored in the 1950s); Wso is the sediment load output at the reach outlet, and subscripts c and m denote the calculated and measured values, respectively.
Substituting the sediment loads computed by Eqs. (11)-(16) into the corresponding Eqs. (17) or (18), the values for sediment deposition in the sub-reaches from Bayangaole to Sanhuhekou and from Sanhuhekou to Toudaoguai and the whole Inner Mongolia reach from Bayangaole to Toudaoguai can be obtained. Then the corresponding cumulative sediment deposition for different reaches can be easily arrived at.
The correlations between computed and measured values of sediment deposition from Bayangaole to Sanhuhekou are shown in Figure 6, for which the correlation coefficient R2 was as high as 0.85 for non-flood seasons and 0.90 for flood seasons. For cumulative sediment deposition the correlation coefficient R2 was as high as 0.99 for non-flood seasons and 0.97 for flood seasons. Figure 7 shows the correlation between computed and measured values of sediment deposition from Sanhuhekou to Toudaoguai, for which the correlation coefficient R2 was 0.61 for non-flood seasons and 0.72 for flood seasons. For cumulative sediment deposition, the correlation coefficient R2 was 0.94 for non- flood seasons and 0.96 for flood seasons. The correlations between computed and measured values of sediment deposition in the whole Inner Mongolia reach from Bayangaole to Toudaoguai are shown in Figure 8, for which the correlation coefficient R2 was as high as 0.85 for non-flood seasons and 0.91 for flood seasons. For cumulative sediment deposition the correlation coefficient R2 was 0.99 for both flood and non-flood seasons. Overall, the correlations for sediment deposition in flood seasons were higher than those in non-flood seasons for different reaches. The correlation for cumulative sediment deposition was higher than that for annual sediment deposition for all of the different reaches.
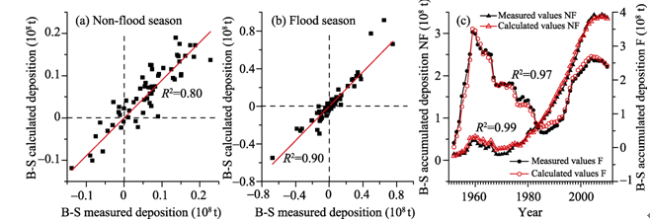
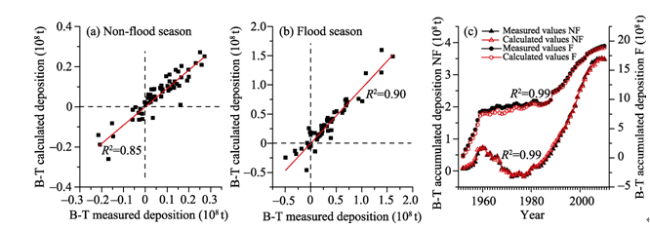
Figure 6 Comparison between calculated and measured amounts of sediment deposition in the river section from Bayangaole to Sanhuhekou (NF: in non-flood season; F: in flood season)
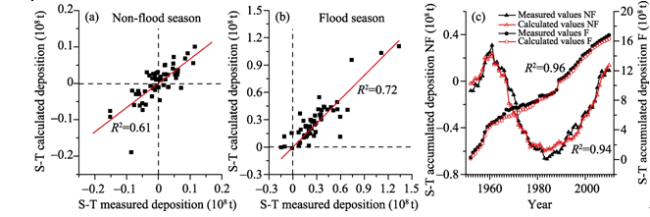
Figure 7 Comparison between calculated and measured amounts of sediment deposition in the river section from Sanhuhekou to Toudaoguai
Figure 8 Comparison between calculated and measured amounts of sediment deposition in the river section from Bayangaole to Toudaoguai

5 Discussion

Satisfactory results were achieved using the sediment load equations proposed for non-flood and flood seasons in the Inner Mongolia reach of the Yellow River. These equations can take into consideration the effects of upstream sediment input, previous cumulative sediment deposition, critical runoff for sediment initiation, and the differences in particle sizes between the mainstream and tributaries. However, the accuracy of the results in the non-flood seasons was sometimes lower than that in the flood seasons. Due to the characteristics of climate and topography in the Inner Mongolia reach, the non-flood season can be further divided into a freezing period and a flowing period. During the period from December to the following March, the flow experiences ice flow, frozen-up, and break-up, and therefore the sediment transport capacity in the ice-flood season is low (Wu et al., 2010; Song et al., 2015). This may affect the accuracy of the proposed sediment load expression in the non-flood season.
The correlation coefficient between calculated and measured values of sediment deposition was about 0.9 for flood seasons and 0.8 for non-flood seasons, which are both lower than those of the corresponding results for the sediment load calculations. This is mainly because the magnitude of the sediment deposition in flood and non-flood seasons is much smaller than the sediment load, especially the sediment deposition ranging from -0.3×10⁸ t to 0.3×10⁸ t and the corresponding sediment load ranging from 0 to 0.9×10⁸ t in non-flood seasons. In addition, the uncertainties in the measurement of sediment load for the tributaries, canals for water diversion or drainage, and aeolian sand may lead to a low accuracy in terms of sediment deposition during short time periods. However, the uncertainty in annual sediment deposition may be minimized in cumulative sediment deposition, and therefore the accuracy of cumulative sediment deposition is high for different reaches in both flood and non-flood seasons. This indicates that the proposed method for computing sediment load in this study can be applied to simulate the development of cumulative sediment deposition for long timescales, especially to predict long-term trends.
Comparing the fitting parameters in the sediment load expressions for different reaches, we found that the sediment transport coefficient K and the exponent value b for non-flood seasons were smaller than those for flood seasons, while the critical runoff Wc for sediment initiation in non-flood seasons was greater than that in flood seasons. The critical runoff for sediment initiation and the value of the exponent a were inversely proportional to the value of the exponent b. All of the values of the fitting parameters were in agreement with previous studies (Shen et al., 2007; Qin et al., 2011), indicating the reliability of the proposed method in this study.
We found that the agreement between calculated and measured values from Sanhuhekou to Toudaoguai was lower than that in other reaches, which was due to the impact of inflow of the ten tributaries in this reach. The flow and sediment regime of the ten tributaries is mainly affected by extreme precipitation, but there is considerable uncertainty as to the extent of this. When the short-duration, hyper-concentrated inflow joins the main river, it results in great variability in sediment deposition in the mainstream (Luo et al., 2011; Wang et al., 2013). However, the current method did not take into consideration the short-term variation in flow and sediment in the mainstream and tributaries, which needs to be further investigated in future studies.
Sediment transport and channel morphology are complex processes, and their behaviors are quite different in flood and non-flood seasons due to many factors, such as the effects of tributaries, aeolian sand, and upstream reservoir regulation. Because the effects of upstream sediment input, previous cumulative sediment deposition, critical runoff for sediment initiation, and the differences in particle sizes between the mainstream and tributaries were all accounted for in the proposed sediment transport equations, the calculated results for flood and non-flood seasons were in good agreement with the measured values. This indicates that the proposed methods can be applied to predict the long-term trend of variation in sediment deposition in the Inner Mongolia reach of the Yellow River.

6 Conclusions

The results obtained in this study lead to the following three conclusions:
(1) Based on an empirical sediment transport equation for sediment-laden flow of rivers, general sediment transport equations for non-flood and flood seasons were proposed, which can take into account the effects of upstream sediment input, previous cumulative sediment deposition, critical runoff for sediment initiation, and the differences in particle sizes between the mainstream and tributaries. Then, sediment loads were calculated using the proposed methods for non-flood and flood seasons for the Sanhuhekou and Toudaoguai stations in the Inner Mongolia reach of the Yellow River based on measured data from the period 1952 to 2010. Comparisons between the computed and measured values of sediment load for the sub-reaches from Bayangaole to Sanhuhekou and from Sanhuhekou to Toudaoguai and the entire reach from Bayangaole to Toudaoguai showed that the sediment loads computed using the proposed equations were in good agreement with the corresponding measurements in both flood and non-flood seasons. Overall, the agreement for flood seasons was higher than that for non-flood seasons.
(2) According to the principle of sediment conservancy, annual sediment deposition and the corresponding cumulative values for different reaches in flood and non-flood seasons were obtained using the proposed sediment load equations. Comparisons showed that the computed values of sediment deposition were in good agreement with the corresponding measured values in flood and non-flood seasons, and the agreement for flood seasons was higher than that for non-flood seasons. Moreover, the calculated cumulative sediment deposition was very consistent with the corresponding measurements, which indicated that the proposed method in this study can be applied to predict the long-term trend of sediment deposition in the Inner Mongolia reach of the Yellow River.
(3) The proposed equations for calculation of sediment load in flood and non-flood seasons did not take into account the effects of short-term variations in flow and sediment and the distance of the tributary confluences to the outlet of the studied reach, which needs to be further investigated in future studies.

The authors have declared that no competing interests exist.

1
Ackers P, White W R, 1973. Sediment transport: New approach and analysis.Journal of the Hydraulics Division, 99(hy11): 2041-2060.The relationship of sediment transport to fluid flow is considered. Physical reasoning leads to dimensionless groupings of the variables which are different for coarse sediment and for fine sediment, because of dissimilar modes of transport. This concept provides a basis for a new analysis of data from flume experiments, and a method for dealing with transitional sizes of sediment is suggested. The analysis of experimental data supports the theory put forward and predictive equations are derived which relate total sediment flux to measurable properties of flow. A preliminary comparison is made with observations from other sources, including natural rivers.

DOI

2
Bagnold R A, 1966. An approach to the sediment transport problem. General Physics Geological Survey, Prof. Paper.

3
Einstein H A, 1950. The bed-load function for sediment transportation in open channel flows. US Department of Agriculture.

4
Engelund F, Hansen E, 1967. A Monograph on Sediment Transport in Alluvial Streams. Copenhagen: Danish Technical (Teknisk Forlag).

5
Feng G H, Zhaolun B G, Gao R Z.et al., 2009. Research on ice flood control strategy for the Inner Mongolia reach of the Yellow River.Journal of China Hydrology, 29(1): 47-49. (in Chinese)

6
Han Q W, 2003. Reservoir Sedimentation. Beijing: Science Press. (in Chinese)

7
Hou S Z, Wang P, Chang W H.et al., 2007. Evaluation of the volume of scour and fill of the Inner Mongolia section of the Yellow River.Yellow River, 29(4): 21-22, 80. (in Chinese)The paper calculates the volume of scour and fill of the Inner Mongolia section of the Yellow River respectively through the observed data of cross sections,coming sediment and variations of water level with same discharge and the results are basically the same.The comprehensive analysis shows that the annual mean fill of 61.6 million tons occurred in Sanshenggong Toudaoguai Section in Inner Mongolia during 1986~2004 period is basically reliable and the main channel fill makes up more than 80% of the whole section.Viewing the overall condition,this numerical value can reflect the fill condition of Inner Mongolia section since the Longyangxia Reservoir putting into operation in 1986.

8
Lin X Z, Guo Y, Hou S Z, 2014. Estimation of sediment discharge of ten tributaries of the Yellow River in Inner Mongolia.Journal of Sediment Research, (2): 15-20. (in Chinese)

9
Liu X Y, Hou S Z, Chang W H, 2009. Causes of main channel shrinkage occurring in the Inner Mongolia reaches of the Yellow River.Journal of Hydraulic Engineering, 40(9): 1048-1054. (in Chinese)

10
Long Y Q, Zhang Y F, 2002. Study of the Yellow River sediment from the viewpoint of total sediment.Yellow River, 24(8): 28-29, 39. (in Chinese)

11
Luo Q S, Zhou L Y, Zhang H J.et al., 2011. Influence of incoming flow and sediment from tributaries on the scour and fill of the Ning-Mong reach of the Yellow River.Yellow River, 33(11): 29-31, 34. (in Chinese)

12
Qian N, Zhang R, Li J F.et al., 1981. A preliminary study on the mechanism of self-regulation of sediment transport capacity in the lower Yellow River.Acta Geographica Sinica, 36(2): 143-156. (in Chinese)

13
Qian N, Zhang R, Zhou Z D, 1987. Fluvial Processes. Beijing: Science Press. (in Chinese)

14
Qin Y, Zhang X F, Wang F L.et al., 2011. Scour and silting evolution and its influencing factors in the Inner Mongolian reach of the Yellow River.Journal of Geographical Sciences, 21(6): 1037-1046.lt;p>Rivers with fluvial equilibrium are characterized by bed deformation adjustment. The erosion-deposition area in cross-section reflects this characteristic, which is a base of researching the river scour and deposition evolution by time series analysis. With an erosion- deposition area indicator method proposed in this paper, the time series of erosion- deposition area quantity at Bygl and Shhk stations were obtained with the series duration of 31 years from 1976 to 2006. After analysis of its trend and mutation, three different tendencies about the evolution were observed in general from the quasi-equilibrium phase through a rapid shrinkage to the final new quasi-equilibrium. It is also found that the trend of erosion-deposition area series will change once a big flood occurred in some of the tributaries, and its ever greater influence is due to the decrease of deluge with the completion of upstream reservoirs. Almost all the turning points were coincident with the time when hyper- concentrated sediment flood occurred in some tributaries. With the time series of clear mutations since the late 1990s, the Inner Mongolian Reach has been in a new equilibrium phase. This can be concluded in two aspects. 1. The absence of big floods and sediment transportation from tributaries result in the river shrinkage, and to regain the channel flow-carrying capacity in Inner Mongolian Reach a large flood is needed both of high peak discharge and of lengthy interval to destroy the new equilibrium. 2. The proposed method of erosion-deposition area indicator is of great help to channel scour-deposition evolution analysis because it can demonstrate real time deformation of cross section in quantity.</p>

DOI

15
Ran L S, Wang S J, Fan X L.et al., 2009. River channel change at Toudaoguai section and its response to water and sediment supply of the upper Yellow River.Acta Geographica Sinica, 64(5): 531-540. (in Chinese)<p>The application of dams built upstream will change the input conditions, including water and sediment of downstream channel system, and destroy former dynamic equilibrium, so necessary adjustments are demanded for the downstream channel to adapt to the new water and sediment supply, which will lead to the downstream channel to restore its former equilibrium or reach a new equilibrium. Using about 50 years of hydrological, sediment and cross-sectional data, spatial response process of Toudaoguai cross-section to the application of dams built upstream was analyzed. The results showed that the Toudaoguai cross-section change was influenced strongly by the application of upstream dams and armoring happened and extended to the channel down the Sanhuhekou cross-section. Median diameter of sediment particle experienced a three-stage changing trend which was characterized by an increase at first, then decrease and increase again finally, since the joint application of Longyangxia, Qingtongxia and Liujiaxia reservoirs in 1986, the three-stage changing trend has become less obvious than the time period between 1969 and 1986 when only Qingtongxia and Liujiaxia reservoirs were put into operation.</p>

16
Shang H X, Zheng Y S, Zhang X H, 2008. Influence of reservoir operation on the silt discharge condition of the Ning-Meng section of the Yellow River.Yellow River, 30(12): 28-30, 121. (in Chinese)

17
Shen G Q, Zhang Y F, Hou S Z.et al., 2007. Impact of water and sediment regulation by reservoirs in the upper Yellow River on Inner-Mongolia reaches.Journal of Sediment Research, (1): 67-75. (in Chinese)

18
Song B H, Li C Y, Li C.et al., 2015. Sediment transport under ice-covered flow in the Inner Mongolia reach of the Yellow River.Journal of Sediment Research, (1): 36-41. (in Chinese)

19
Ta W Q, Wang H B, Jia X P, 2015. Suspended sediment transport response to upstream wash-load supply in the sand-bed reach of the Upper Yellow River, China.Journal of Hydrology, 528: 562-570.Wash load is a major component of suspended sediment transport in the sand-bed reach of the Upper Yellow River, China. This wash load sediment originates from the Loess region, with the high runoff mainly originating from the rock mountains of its upstream basin. These characteristics result in a mismatch between water and sediment sources and a low probability of high runoffs meeting high suspended sediment concentration (SSC) flows. As a result, higher runoff with lower SSC levels (HR-LS) and lower runoff with higher SSC values (HS) occur, whose SSCs do not follow the typical power form for flow discharges, C i 02=02 αQ β , where C i and Q are SSC and flow discharge, respectively. Here, we modify the traditional power form with an upstream wash-load supply function C 161 β to satisfy the relation between the water and wash load sediment concentrations in water–sediment mismatched cases, C i 02=02 αQ β C 161 β , where C is an input flow’s SSC. Using the daily flow discharges and SSCs of nine typical HR-LS flows and 18 HS flows in our study reach from 1960 to 2012, we find that β changes in response to input flow conditions and downstream transport distances. When the downstream transport distance is between 360 and 663.502km, β varies between 0.3 and 0.6 in a HS input flow condition, while in the HR-LS input flow case, β tends to be greater than 0.6 (between 0.74 and 0.65). The entrainment rate of an HR-LS flow and the deposition rate of an HS flow appear to be asymmetrically balanced, establishing a primary mechanism for channel aggradation and upward fining of floodplains in our study reach.

DOI

20
Wang P, Hou S Z, Zhang Y F.et al., 2013. Scouring and silting characteristics of hyper-concentrated floods of ten tributaries of the upper Yellow River.Journal of Sediment Research, (1): 67-73. (in Chinese)

21
Wang S J, Yan Y X, Li Y K, 2012. Spatial and temporal variations of suspended sediment deposition in the alluvial reach of the upper Yellow River from 1952 to 2007.Catena, 92: 30-37.The suspended sediment deposition (SSD) in the alluvial reach between the Qingtongxia station and the Toudaoguai station of the upper Yellow River has shown a dramatic variation since 1952. However, its spatial and temporal changing pattern and driving factors are still not clear. This paper examines the detailed spatial and temporal variations of the SSD based on the annual suspended sediment load at five gaging stations located in this alluvial reach in 1952–2007. The mean annual SSDs in four sub-reaches (Qingtongxia–Shizuishan, Shizuishan–Bayangaole, Bayangaole–Sanhuhekou, and Sanhuhekou–Toudaoguai) were calculated and analyzed for different periods. The mean annual kilometric SSDs in 1952–2007 were 610.2286510 5 , 0.976510 5 , 0.1656510 5 and 0.0066510 5 ta 611 km 611 in the four sub-reaches, respectively, with the highest SSD occurred in the Shizuishan–Bayangaole sub-reach. Results also suggested that SSD was mainly accumulated in 1952–1959 before major reservoirs were constructed and in 1986–2007 after three major reservoirs (Qingtongxia, Liujiaxia and Longyangxia) were constructed in the main stream. During 1960–1985, all sub-reaches except the Shizuishan–Bayangaole sub-reach experienced channel erosion. Although climate change may play some roles, the changes in SSD were mainly influenced by human activities. In particular, the water and soil conservation actions, such as the construction of check dams from 1958 in upper stream tributaries, intercepted significant amount of suspended sediment and cause the net erosion of the main channel in the 1960s. The operation of the Qingtongxia reservoir reduced the SSD in this downstream reach in the 1970s and 1980s because upper stream suspended sediment was trapped by the reservoir and reservoir-released relative clear water scoured the downstream channel. Although the Liujiaxia and Longyangxia reservoirs trapped relatively small amount of suspended sediment, they stored a large amount of water during the flood season, reducing the discharge and the erosion capability of the downstream flow. Therefore, this operation mode may increase the SSD in this river reach. In addition, with the gradual loss of the Qingtongxia reservoir's capacity in sediment storage, more suspended sediment was released to the downstream channel, causing strong SSD in this reach after 1990.

DOI

22
Wu B S, Liu K J, Shen H B.et al., 2015. Calculation methods for sediment load and the amount of sedimentation in the Inner Mongolia reach of the Yellow River.Advances in Water Science, 26(3): 311-321. (in Chinese)

23
Wu, B S, Van Maren D S, Li L Y, 2008. Predictability of sediment transport in the Yellow River using selected transport formulations.International Journal of Sediment Research, 23(4): 283-298.<h2 class="secHeading" id="section_abstract">Abstract</h2><p id="">This paper evaluates the applicability of the sediment transport methods developed by Engelund and Hansen, Ackers and White, Yang et al., and van Rijn, together with the Wuhan methods developed in China, to the Yellow River, which has highly concentrated and fine-grained sediment. The sediment data includes over 1000 observations from the Yellow River, 32 sets of data from a canal, and 266 sets of data from laboratory flumes. The best predictions were obtained by the Yang 1996 method, the Wuhan method, and the modified Wuhan method by Wu and Long, while reasonably good predictions were also provided by the van Rijn 2004 method. The Engelund and Hansen, the Ackers and White, and the van Rijn 1984 methods in their original forms are not applicable to the Yellow River. The predicted results for total load concentrations were as good as for bed-material concentrations, even though the total load includes a large portion of wash load.</p>

DOI

24
Wu B S, Zhang Y F, 2007. Analysis of sediment transport in the lower Yellow River.Journal of Sediment Research, (1): 30-35. (in Chinese)

25
Wu B S, Zhang Y F, Shen G Q et al., 2010. Study of the Water and Sediment Condition for Maintaining the Stable Main Channel of the Yellow River. Zhengzhou: Yellow River Conservancy Press. (in Chinese)

26
Yang C T, 1979. Unit stream power equations for total load.Journal of Hydrology, 40(1): 123-138.A dimensionless unit stream power equation for the computation and prediction of total sediment concentration is obtained without using any criterion for incipient motion. This equation is compared with a similar dimensionless unit stream power equation proposed by the author in 1973 with the inclusion of criteria for incipient motion. Comparisons between the measured results from laboratory flumes and natural rivers and the computed results from these two unit stream power equations indicate that they are equally accurate in predicting the total sediment concentration in the sand size range. For the 1259 sets of data compared, the average computed result from these equations is only 3% higher than the measured result.

DOI

27
Yang C T, Molinas A, Wu B S, 1996. Sediment transport in the Yellow River. Journal of Hydraulic Engineering,ASCE, 122(5): 237-244.

28
Yellow River Conservancy Commission. (YRCC). Hydrometric Data in the Yellow River Basin. Vols 1-2.1952-2010. Zhengzhou: Yellow River Conservancy Commission. (in Chinese)

29
Zhang R, 1959. A study of the sediment transport capacity of the middle and lower Yangtze River.Journal of Sediment Research, (2): 54-73. (in Chinese)

30
Zhang X H, Shang H X, Zheng Y S et al., 2008. River Bed Reforming at Upstream and Downstream Reaches of Large Scale Reservoirs after Their Construction. Zhengzhou: The Yellow River Water Conservancy Press. (in Chinese)

31
Zhao Y A, Zeng M L, Xiong G S.et al., 2008. Research on the Key Technology of Water and Sediment Regulation and the Operation Modes of the Long-Liu Reservoirs in the Yellow River. Zhengzhou: Yellow River Institute of Hydraulic Research. (in Chinese)

Outlines

/