Research Articles

Degrading river network due to urbanization in Yangtze River Delta

  • HAN Longfei , 1 ,
  • LEI Chaogui 1, * ,
  • YANG Liu 1 ,
  • DENG Xiaojun 1 ,
  • HU Chunsheng 1, 2 ,
  • XU Guanglai , 2
Expand
  • 1. School of Geographic and Oceanographic Sciences, Nanjing University, Nanjing 210023, China
  • 2. College of Territorial Resources and Tourism, Anhui Normal University, Wuhu 241000, Anhui, China

*Corresponding author: Xu Youpeng, Professor, E-mail:

Author: Han Longfei (1988-), PhD Candidate, specialized in urban hydrology. E-mail:

Received date: 2015-11-12

  Accepted date: 2015-12-15

  Online published: 2016-06-15

Supported by

National Natural Science Foundation of China, No.41371046

The Commonwealth and Specialized Program for Scientific Research, Ministry of Water Resources of China, No.201201072, No.201301075

Natural Science Foundation of Jiangsu Province, No.BK20131278

Copyright

Journal of Geographical Sciences, All Rights Reserved

Abstract

Evolution of river systems under the background of human activities has been a heated topic among geographers and hydrologists. Spatial and temporal variations of river systems during the 1960s-2010s in the Yangtze River Delta (YRD) were investigated based on streams derived from the topographic maps in the 1960s, 1980s and 2010s. A list of indices, drainage density (Dd), water surface ratio (WSR), ratio of area to length of main streams (R), evolution coefficient of tributaries (K) and box dimension (D), were classified into three types (quantitative, structural, and complex indices) and used to quantify the variations of stream structure. Results showed that: (1) quantitative indices (Dd, WSR) presented decreasing trend in the past 50 years, and Dd in Wuchengxiyu, Hangjiahu and Yindongnan have decreased most, about 20%. Structurally, the Qinhuai River basin was characterized by significant upward R, and K value in Hangjiahu went down dramatically by 46.8% during the 1960s-2010s. Decreasing tendency in D was found dominating across the YRD, and decreasing magnitude in Wuchengxiyu and Hangjiahu peaks for 7.8% and 6.5%, respectively in the YRD. (2) Urbanization affected the spatial pattern of river system, and areas with high level of urbanization exhibited least Dd (2.18 km/km2), WSR (6.52%), K (2.64) and D (1.42), compared to moderate and low levels of urbanization. (3) Urbanization also affected the evolution of stream system. In the past 50 years, areas with high level of urbanization showed compelling decreasing tendency in quantitative (27.2% and 19.3%) and complex indices (4.9%) and trend of enlarging of main rivers (4.5% and 7.9% in periods of the 1960s-1980s and the 1980s-2010s). In the recent 30 years, areas with low level of urbanization were detected with significant downward trend in Dd and K. (4) Expanding of urban land, construction of hydraulic engineering and irrigation and water conservancy activities were the main means which degraded the river system in the YRD.

Cite this article

HAN Longfei , LEI Chaogui , YANG Liu , DENG Xiaojun , HU Chunsheng , XU Guanglai . Degrading river network due to urbanization in Yangtze River Delta[J]. Journal of Geographical Sciences, 2016 , 26(6) : 694 -706 . DOI: 10.1007/s11442-016-1293-0

1 Introduction

River network is one of the most important ecosystems on earth (Ni and Liu, 2006), and carrier for the formation and evolution of water resource, supporting the development of human society essentially (Li et al., 2011). River evolution in East China is influenced by a combination of natural factors and human activities in the long history, but streams have been marked by strong human interference in recent 50 years. Both quantity and morphology were altered by the human activities, especially urbanization which was denoted by highly-intense, large-covering and long-lasting alteration. Then, the function of regulating and storing pollutants that rivers should have has changed, causing the increasing flood hazards and serious water environmental issues which put restrictions on the sustainability of the human society (Xu, 2012).
As early as in 1865, Marsh (1865) had found that human activities could change the evolution of rivers. Horton (1945) proposed a stream order system and found the two famous stream laws - the laws of stream numbers and length. The stream order system was then revised by Strahler (1957) and widely used in the research of stream structure. The study on the relationship between urbanization and rivers started in the 1960s, and early researches showed enlarged channel width and cross-section (Gregory et al., 1992; Hammer, 1972) and increased drainage density (Graf, 1977) in the urbanized areas. Vanacker et al.’s research (2005) on the Andes Mountains showed that stream channels narrowed by over 45% and riverbed deepened by over 1 meter as a result of LUCC (land use and cover change). But the process known as headstream burial where streams are paved over and altered into roads, buildings or other impervious areas is probably the most extreme impact of urbanization on streams. Recent investigations have shown that stream burial is occurring at high rate all around the world. In Baltimore City, USA, 66% of the streams have been buried (Elmore and Kaushal, 2008) and drainage density in the Rock Creek watershed in Maryland has been reduced by 58% due to urbanization (Meyer et al., 2001). The headwater streams can provide the urbanizing watershed with an ability to hold and store water, and effectively retain the sediments and transform and retain nutrients and contaminations, thereby providing water-quality benefits downstream (Dunne and Leopold, 1978). Therefore, disappearing headwater streams not only increases risk of vulnerability to flood, but also affects the fluvial ecosystem on a great deal.
China has stepped into the period of high-speed urbanization since the 1980s, thus, investigations of impact of urbanization on rivers lag behind those in the world. Past researches in China were mainly done in highly developed area, such as the Yangtze River Delta (Chen et al., 2002; Han et al., 2013; Han et al., 2015; Ji et al., 2014; Xu et al., 2013; Yang et al., 2004; Yuan et al., 2005; Yuan et al., 2007) and the Pearl River Delta (Huang et al., 2008; Zhou et al., 2008). Han and Mao (1997) concluded that channels around Taihu Lake had declined from over 300 in the early 20th century to 125 in 1993. Chen et al. (2002) analyzed the river network evolution in the process of urbanization in Shanghai, and results showed that stream numbers decreased a lot, thus influencing the natural drainage ability of rivers. Yang et al. (2004) revealed that urbanization was an important factor altering the structure of tidal river system. Zhou et al. (2006) showed in the investigation on the Beijing-Tianjin reach of the Yongding River that stream length and number in these areas had decreased by 20.5% and 36.4% in recent 40 years, respectively, and stream structure was simplified. Besides, urbanization in China has been running deep in recent years, and discrepancy of tradeoff between city expanding and river network has become increasingly salient, in the wake of which, a serial of flood and fluvial environmental issues arrived. Therefore, impacts that urbanization has on the river networks have currently drawn more attention among government, scholars and the public.
Yangtze River Delta is one of the most developed and densely populated areas in China. Fierce human activities dramatically have damaged the river network system in the past 30 years, inducing decreasing stream density and water surface. There have been some investigations of stream response to human activities, and they were mainly restricted to regional case study, generally taking a city as an example. However, there is a lack of comparative investigation on the whole Yangtze River Delta. Therefore, this paper choose five water conversation districts, Yangchengdianmao (YCDM), Wuchengxiyu (WCXY), Hangjiahu (HJH), Qinhuai River (QHH) and Yongcaopu (YCP), as the study area since they cover most of the developed areas in the Yangtze River Delta. Based on extracted river network of three periods (1960s, 1980s, and 2010s), indices system of river geomorphology were established and used for analysis on the temporal and spatial characteristics of the river network across the Yangtze River Delta in the past 50 years. By investigating the variation of river network of areas with different degrees of urbanization, we try to seek the process of evolution of stream networks influenced by the urbanization.

2 Methods

2.1 Study area

The Yangtze River Delta (YRD), located in East China (29°12'N-33°19'N, 118°19'E- 122°19'E, Figure 1), covers an area of 9.54 × 10⁴ km2 (Figure 1). The region is mostly controlled by the typical subtropical East Asian monsoon with four distinct seasons which is characterized by mild and wet climate. The average annual precipitation is over 1000 mm, ranging from 729.7 to 1526.2 mm. The precipitation is mainly concentrated in May to September, dominated by the pulm rains and typhoon. The YRD is featured by alluvial plains and hills, 85.3% of which is below 200 m with an average elevation of 83.3 m, so this area is prone to flood. Mountains and hills are mainly located in the south and southeast of the YRD with the highest elevation of 1635 m while alluvial plains are mainly located in the north and east of the YRD with mean elevation lower than 50 m. Large rivers run across the YRD, e.g., the Huaihe River, Yangtze River and Qiantang River from north to south, respectively. River networks develop well and are densely distributed in this region, with a drainage density of over 3.0 km/km2, and there are also many lakes in the YRD, the largest one is Taihu Lake with an area of 2427.8 km2.
The YRD is divided into 17 water conservation districts based on stream channels variation, topographical elevation deviations and flood characteristics. The Taihu Lake basin is the largest watershed over the YRD, and its catchment area is 36,900 km2, accounting for 38.7% of the YRD. River networks in this basin are divided into two parts by the lake: upstream network and downstream network. Downstream part is characterized by plain river network, including Huangpu river system in the east (where Shanghai is located), streams networks along the Yangtze River in the north and Hangzhou Bay river system in the south. There are 7 water conservation districts in the Taihu basin, and the selected ones in this paper are among the downstream part, i.e. Wuchengxiyu, Yangchengdianmao and Hangjiahu. Qinhuai River basin is mainly located in the city of Nanjing, and its main stream flows directly into the Yangtze River at Sanchakou. Streams run crisscross in the middle and lower reaches of the basin, typical of plain river network. Yindongnan (YDN) plain of YCP river basin, located in coastal areas southeast of the YRD, is also featured by plain river network.
We select five water conservation districts, Wangchengxiyu (A), Yangchendianmao (B), Hangjiahu (C), Qinhuai River basin (D) and Yindongnan (E). The boundary line between regions A and B is Wangyu River, one of most important discharging conduits in the Taihu basin. Taipu River, another one, separates regions B and C, and Qiantang River divides regions C and D. Wuchengxiyu (region A) leads the stream density, and region B shares the highest water surface ratio. Previous work in the YRD megalopolitan region using remote sensing techniques has shown a 75.8% increase (about 1.37×10⁵ hm2) in urban area from 1990- 2005 (Tian et al., 2011), with the highest urban expansion intensity from 2000-2010 (Xiao et al., 2014). The districts selected for this study includes 8 cities, i.e. Suzhou, Wuxi, Changzhou, Hangzhou, Jiaxing, Huzhou, Nanjing and Ningbo, which are among the most developed areas across the YRD. River networks system in the YRD weakened a lot during the past half century, and are, therefore, likely to be typical of urbanizing regions in the developing countries worldwide.

2.2 Data and processing

River networks were extracted using three periods of topographic maps in the 1960s, 1980s and 2010s. The topographic maps display all streams in four regions (A, B, C and D) at a scale of 1:50,000. These were first produced by the Chinese military administration of surveying and mapping in the 1960s, with the final version released by the national administration of surveying, mapping and geoinformation in 2009. The ones in the 1960s and 1980s were in the paper form, and all the streams were delineated manually in ArcMap 9.3. The final version in 2009 was GIS layer displaying all the streams, and these streams were updated and checked by a combination of field and space photography (2 m resolution) provided by the Google Map in 2014. Steam data in region E were based on the digital topographic maps at a scale of 1:10,000 in 1999, 2003 and 2010. Having considering Strahler’s (1957) stream order system and complexity of plain river network, the streams orders were so chosen that large streams with a width over 20 m are of the 1st order and defined as main streams; tributaries are those with channel width below 20 m, and streams with a width between 10 and 20 m are of the 2nd order; 3rd order streams are those with a width less than 10 m. Main steams are important conduits of flood discharging, while tributaries play key roles in regulating and storing water.
Extracting streams in the paper form includes scanning of the topographic maps and georeferencing in ArcGis 9.3. According to the stream order system described above, we delineated the streams of the three orders of the 1960s and 1980s, and obtained two-period stream through mosaic and clip operation and topology test of delineated lines. The GIS layer streams in the 2010s were extracted directly in ArcGis without manual delineation. Then, we calculated the indices of streams of the three periods in ArcGis. Additionally, Landsat images (30-m resolution) in 2010 provided by US Geological Survey (USGS) were used, and decision-tree classification was applied to the interpretation of urban land in Envi4.7 to acquire the urbanization degree in selected cities.
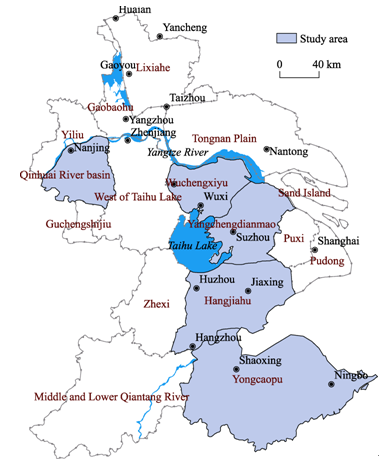
Figure 1 Location of the Yangtze River Delta

2.3 Indices of stream structure

Five indices were selected in this paper to describe the geomorphic characteristics of the river networks, including drainage density (Dd), water surface ratio (WSR), development coefficient of tributaries (K), ratio of area to length of main streams (R) and box dimension (D), as listed in Table 1.
Table 1 Definitions of stream structure indices in this study
Indices Definitions Formulas Units Explanations
Dd Drainage
density
Dd=L/A, L is total stream length in the basin, A is area of the basin km/km2 Dd was firstly introduced by Horton (1945) to indicate the drainage ability
WSR Water surface ratio WSR=(Aw/A)×100%, Aw is total water area, including the water area of streams, ponds and lakes % WSR denotes the regulating and storing ability
K Development coefficient of tributaries K=Lb/Lm, Lb is length of tributaries, Lm is length of main streams No
dimension
K refers to developing degree of tributaries
R Ratio of area to length of main streams R=Am/Lm, Am is area of the main streams, Lm is length of main streams km2/km R is the average width of main streams, indicating developing degree of main stream
D Box dimension Intersecting the river networks with square boxes with side length r, count the number N(r) of boxes with stream segments. N(r) increases with decreasing r of the box, and we can get a serial of r-N(r). No
dimension
Fractal theory was first introduced to geography, and it denotes the complexity of the pattern of river network (Zhang et al., 2015).

3 Results

3.1 Component characteristic of river system

Having calculated the number and length of streams of 3 orders, we get the structure of the river network as shown in Figure 2. Both number and length of main streams contribute small proportion to whole river network, and tributaries contribute large proportion, especially stream of 3rd order, contributing the most, which is typical in region A and B. But the difference of contribution between main streams and tributaries is not quite much in region C and D, indicating that development degrees of tributaries in these two areas are not as high as abdomen part of Taihu basin (region A and B). In region E, stream length of 1st and 3rd orders is not in accordance with stream number, and average length of 1st order stream (4.63 km) is far higher than 3rd order indicating that tributaries are highly fragmented in this area.
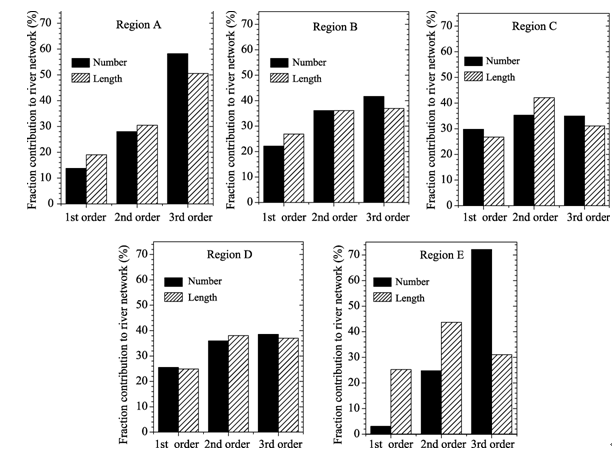
Figure 2 Fraction contributions of different streams orders to river network in number and length

3.2 Variation of quantity of river system

Drainage density (Dd) and water surface ratio (WSR) are used to describe the quantitative characteristic of river network. Dd in regions A, B and C, from Figure 3, were the highest in the study area and reached more than 3.5 km/km2 in Dd. Dd in Shanghai approximated this value in 2000, as shown by Yang et al. (2004). YDN (region E) followed these regions in Dd, while QHH (region D) shared the lowest Dd, only 1.1 in the 2010s. The differences among these areas is contributed by the topology of them that region A, B, C and Shanghai are located in the lower Taihu basin, while region D is featured by hills. River network has high degree of development in the lower Taihu basin which is characterized by plain and many human-made rivers were constructed in the historic period for irrigation and transportation. But it is quite low in the degree of river development in hills. Compared with the YRD, the Pearl River Delta, second largest delta in China, has far lower Dd (Table 2) which is caused by scale of the extracted topographic maps. Extraction of steams in the Pearl River Delta is based on the maps of 1:100,000 scale, while it is 1:50,000 in my research on the YRD. Overall, Dd in the YRD exhibited a decreasing tendency during the 1960s-2010s that regions A, C and E decreased significantly (about 20%) while decreasing magnitude of regions B and D were much smaller, 3.8% and 9.1%, respectively.
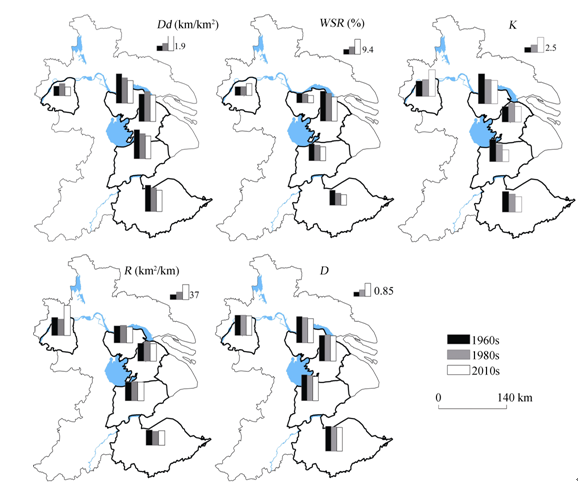
Figure 3 Characteristics of stream structure in the Yangtze River Delta in the past 50 years
YCDM (region B) enjoyed the highest WSR for its densely-dotted lakes, 18.9% in the 1960s (Figure 3 and Table 2), then followed by region C (8.6%-10.6%) for its adjacency to region B in the north. But WSR in regions A, B and Shanghai was low, about 5.0%-7.5%. All the regions except QHH showed a large downward magnitude in WSR. Decreasing magnitude in WSR peaked for region E (29.5%), followed by regions A, B and C, being 23.5%, 19.4% and 17.5%, respectively (Table 2). During the 1960s-1980s, the decreasing magnitude for A, B and C is 8.3%, 7.4% and 7.1%, respectively, while they were 16.55%, 13.05% and 11.3%, respectively, during the 1980s-2010s, indicating a intense downward trend. But WSR in QHH increased in the past 50 years, and it was quite obvious during the 1980s-2010s (34.2%), which is caused by the greatly increasing ponds (Han et al., 2013; Ji et al., 2014).
Table 2 Change of streams structure in different regions in the past 50 years
Indices Period Study area Other areas
A B C D E* Shanghai*
(Yang et al., 2004;
Yuan et al., 2005
)
Pearl River
Delta* (Zhou
et al., 2008
)
Area (km2) - 3841.0 4914.0 7621.0 497.1 476.1 4962.5 1991.8
Dd 1960s 3.80 3.54 3.75 1.25 3.40 3.45 0.86
1980s 3.27 3.87 3.24 1.58 3.06 0.84
2010s 2.93 3.41 2.93 1.14 2.75 0.65
WSR 1960s 6.10 18.86 10.63 5.53 9.50 5.62
1980s 5.59 17.47 9.88 5.60 7.60
2010s 4.66 15.20 8.76 7.52 6.70
K 1960s 4.93 2.54 3.65 2.52 3.39 3.39 4.42
1980s 4.00 3.07 2.83 2.74 2.96 3.04
2010s 3.83 2.56 1.94 4.37 2.53 3.50
R 1960s 41.53 43.75 45.54 44.11 37.40
1980s 42.83 48.22 47.03 39.96 34.10
2010s 38.85 42.94 45.66 73.23 35.60
D 1960s 1.71 1.68 1.69 1.32 1.62 1.40
1980s 1.65 1.71 1.64 1.32 1.58
2010s 1.58 1.65 1.58 1.27 1.54

Note: *The three periods of region D is 1990, 2003 and 2010, respectively, and there is merely one period (2010) in Shanghai, three periods (1980, 1985 and 2005) in Pearl River Delta; the tributaries development coefficient in Shanghai and Pearl River Delta were calculated with the data provided in their papers; Calculation of WSR in Shanghai does not include lake areas, and its fractal value is computed based on Horton law.

3.3 Variation of structure of river network

Ratio of area to length of main stream (R) and development coefficient of tributaries (K) are applied to describe stream structure. R values, i.e. average width of main stream, did not vary that much in the subdistricts of the study area (Figure 3). Main streams have the priority of protection for its key function of discharging, and construction of new main streams and human-made dredging and widening of existing large rivers are steps that department of water resources has taken to alleviate the severe situation of flood caused by fast urbanization. Obvious change was detected in Qinhuai River basin that R value increased from 40.0 in the 1980s to 73.2 in the 2010s. This is due to the newly-built New Qinhuai River, one of two most important conduit of discharging flood, and its mean width is as high as 112 m. But variation of R value in other regions in the past 50 years was not large, with regions A, B and E decreasing slightly and region C increasing a little.
But K values were quite different among the study regions (Figure 3 and Table 2). Region A shared the highest K, averaging 4.3 in the three periods, as seen in Table 2, while regions B and D exhibited relatively low values. It was 3.39 in Shanghai, and averaged 3.65 from 1980 to 2005 in the Pearl River Delta. In the past 50 years, there has seen decreasing K in regions A, C and E, especially in C, in which K value decreased by 46.8% during the 1960s-2010s, facing serious problems in stability of river structure. However, it is surprising that K in the Qinhuai River basin increased by 73.0%, and it is, further investigation shows, due to great decrease of the main stream’s length. In the 1960s, the main stream’s length comprised 28.4% of the total, but in the 2010s, this figure dropped to 18.6%. Considering downward trend of both main streams and tributaries, the fact that decreasing magnitude of the main streams was higher than the tributaries accounted for the increasing trend of K. In region B, K did not have fluctuations in recent 50 years.

3.4 Variation of river network complexity

Fractal dimension (D) was positively related to drainage density (Dd), and it had apparently varying spatial distribution. The lower Taihu basin exhibited the largest Dd as well as D, while QHH shared the lowest D with the smallest Dd. In the past 50 years, all the regions showed decreasing tendency of D, with values of 1.32-1.71 in the 1960s and 1980s and 1.27-1.65 in the 2010s. Among these, regions A and C featured by dense Dd showed larger decreasing magnitude (7.8% and 6.5%), while it was just 2.0% in region B characterized by densely-dotted lakes.

4 Discussions

4.1 Influence of urbanization on river network

Stream structure has being changing as disturbed by intense human activities. Variation of the stream structure in the YRD, one of the most developed areas in China, is mainly caused by the human intervention. In order to investigate the impact of urbanization on river structure, we classified administrative divisions in the YRD into three types based on the urbanization degree, high, medium and low levels of urbanization (Table 3).
Table 3 Administrative divisions with different levels of urbanization in the Yangtze River Delta
Administrative division Urbanization degree (%)*
High level of urbanization Municipal district of Changzhou 58.15
Municipal district of Suzhou 57.76
Municipal district of Wuxi 49.94
Municipal district of Hangzhou 46.79
Medium level of urbanization Kunshan County 39.68
Zhangjiagang County 38.38
Taicang County 35.62
Changsu County 34.64
Wuxian County 31.93
Wujiang County 30.18
Low level of urbanization Haining County 29.82
Haiyan County 22.20
Qingpu County 22.05

Note: *Urbanization level is calculated by dividing construction area by its total area, and construction area was acquired by remote sensing interpretation.

Urbanization is characterized by increasing imperviousness in short time, thus accountable for the decreasing quantity of streams. In Shanghai, China, highly urbanized area shared the lowest WSR (Yuan et al., 2005). In Baltimore, USA, drainage density in urban area decreased by 66% (Elmore and Kaushal, 2008), the value dropped to 18% in suburbs. But the variation of Dd in the city of Shenzhen, Pearl River Delta, was not significantly related to the degree of urbanization spatially (Huang et al., 2008). In our study, areas with high level of urbanization shared the lowest Dd, averaging 2.18 km/km2 in three periods (Table 4), while it is far higher in medium and low levels of urbanization, averaging 3.83 and 3.63, respectively. During the 1960s-1980s, Dd showed a decreasing tendency except in medium urbanization degree. Increasing Dd in this area was caused by agricultural activities during this period which was confirmed by in situ investigation in the year of 2014. Channels and canals were constructed in the 1980s to meet the increasing need for irrigation during agricultural activities, and they were identified as streams in the extract of river networks in this study. So Dd during this period in Kunshan, Taicang, Changshu, Wuxian and Wujiang has increased by 4.6%, 13.1%, 11.5%, 12.1% and 8.0%, respectively, which is not shown in Table 4. However, during the 1980s-2010s all the areas showed decreasing trend, and high level of urbanization led in the decreasing magnitude (23.1%), followed by medium and low levels, 10.0% and 14.6%, respectively, which is consistent with the result in Baltimore City(Elmore and Kaushal, 2008).
Similar spatial distribution was found for the distribution of WSR to Dd (Table 4). Areas with high level urbanization exhibited the lowest WSR, averaging 6.5%, followed by 13.35% of medium level urbanization area, and WSR in low level of urbanization was maximum, which was similar to conclusions in Shanghai. During the 1960s-2010s, WSR in the both highly and moderately urbanized areas decreased by approximately 20%, while it was 11.20% in lowly urbanized area.
Two ways of human activities, headwater burial and dredging of main streams alter the characteristic of stream structure (Xu et al., 2013). Inferred from Table 4, K value in highly urbanized area is the smallest, averaging 2.64 in the three periods, followed by 4.71 of moderately urbanized area, and values peak (6.07) for lowly urbanized area. In the past 50 years, tributaries decreased a great deal in high and low degree of urbanization, with decreasing rate of 28.45% and 68.34%, respectively, while the downward magnitude in medium degree of urbanization is rather low. Moreover, the downward tendency of K in these two areas have intensified in the past 50 years, since the decreasing rates during the 1960s-1980s were 1.27% and 32.15%, respectively, and increased to 27.53% and 53.33% during the 1980s-2010s. It is noted that headwater in lowly urbanized areas were also faced with severe disappearing as urbanization deepened in recent 30 years, for example, K value in this area was just 2.89 in the 2010s, a little higher than in highly urbanized area.
Most dominant impact of urbanization on main streams can be detected in highly urbanized area. R value peaks in this area, averaging 43.27 in the three periods, followed by 43.16 in medium level of urbanization, and low urbanized area shared the lowest R value. And widening tendency of main streams has intensified in highly urbanized area since R value had climbed from 40.91 in the 1960s to 42.76 in the 1980s by 4.53% and increasing rate during the 1980s-2010s rose to 7.89%. But this tendency was not apparent in medium and low degrees of urbanization, and changing rates in these two areas were 2.36% and -0.97%, respectively.
Table 4 Characteristics of stream structure in administrative divisions with different levels of urbanization in the Yangtze River Delta
Indices Periods Areas of different urbanization degree
High level Medium level Low level
Dd 1960s 2.45 3.80 4.47
1980s 2.32 4.04 3.46
2010s 1.78 3.64 2.96
WSR 1960s 6.88 14.69 17.23
1980s 7.14 13.51 16.25
2010s 5.55 11.85 15.30
K 1960s 2.93 4.90 9.12
1980s 2.90 4.65 6.19
2010s 2.10 4.57 2.89
R 1960s 40.91 41.39 41.08
1980s 42.76 45.72 44.39
2010s 46.14 42.37 40.68
D 1960s 1.45 1.67 1.69
1980s 1.43 1.69 1.61
2010s 1.38 1.66 1.61
From the two paragraphs above, both quantity and structure of the streams were deeply degraded by urbanization, correspondingly, the spatial complexity of river network was also weakened. D in highly urbanized area was the lowest, averaging 1.42 in the three periods, while the values were 1.67 and 1.64 in moderately and lowly urbanized areas. During the 1960s-2010s, highly urbanized area shared the largest decreasing rate (4.91%), followed by 4.73% and 0.42% in low and medium degrees of urbanization, respectively. Therefore, the pattern of river network weakened from spatially complex to simple, as urban areas expanded, and this tendency was dominant in highly urbanized area, where human activity was intensified.

4.2 River evolution influenced by urbanization

Natural river system has its own mechanism of evolution without disturbance of human activities, however, urbanization destroyed the stream in the form of invading and burying headwaters. Great disappearing tributaries caused impaired regulating and storing ability of the watershed, thus bringing about higher occurrence of flood disasters. To address this issue, human widened and dredged main streams to increase the discharging ability downstream. Therefore, this feedback control was found between river system and human activities, and stream structure changed with urbanization and restricted it in return, reaching final equilibrium through adjustment processes. This view is consistent with Chin’s view that stream morphology would adjust to changed hydrologic conditions induced by urbanization and reach new stability regimes (2006). The river networks have been weakened a lot after new equilibrium. However, this equilibrium in this study was reached in view of the flood prevention of watershed, and the weakening pattern of river network will make potential fatal impact on the aquatic ecosystem, such as biological diversity and water quality in rivers, which are often ignored by the government. Once the river systems are degraded over threshold, the ability of auto-adjustment of river system is destroyed, thus causing catastrophic results.
In the past 50 years, quantity, structure and spatial complexity of river network in the YRD all exhibited downward tendency, and some indices would even have intensification of decreasing trend, such as water surface ratio. Therefore, the relationship between river system and human has not reached equilibrium, and more weakening river network in the YRD are expected as with urbanization development.

5 Conclusions

In this study, variations of stream structure in the past 50 years in the Yangtze River Delta were investigated, and evolution mechanisms of streams in the background of urbanization were discussed through analyzing stream characteristics in areas with different levels of urbanization. Some conclusions are given below.
(1) Tributaries contribute a majority to river system, but headwater has disappeared by a great deal in Hangjiahu intervened by fierce human activities, facing serious problems in stability of river structure.
(2) Quantitatively, drainage density (Dd) in the YRD showed overall downward tendency, with regions Wuchengxiyu, Hangjiahu and Yindongnan significantly decreasing by 20%, and decreasing trend of water surface ratio (WSR) has intensified. Structurally, average width of main stream (R) in Qinhuai River basin dramatically increased from 44.1 in the 1960s to 73.2 in the 2010s, and development coefficient (K) of tributaries in Hangjiahu has decreased most, by 46.8% in the past 50 years. Besides, there exhibited a declining tendency in morphological complexity (D) in the whole study area.
(3) The impact of urbanization on river network involves two aspects. On the one hand, urbanization affected the spatial pattern of stream. Highly urbanized area had minimum values of Dd, WSR, K and D, and highest R, indicating that human activities during urbanization weakened the river system by burying the headwater resulted declining spatial complexity. On the other hand, urbanization altered the process of river evolution. In highly urbanized areas, the main streams were preferentially protected, widened and dredged for alleviating flood risk, and main streams have been becoming dominant of river network. But in areas of medium level of urbanization, agricultural activities during the 1960s-1980s temporarily had increased the drainage density. In lowly urbanized areas, as the process of urbanization speeded up after the 1980s, headwaters were buried on a great deal, resulting in a sharp decrease of Dd and K during the 1980s-2010s.

The authors have declared that no competing interests exist.

1
Chen Dechao, Li Xiangping, Yang Jishan.et al., 2002. Development of water system in the progress of urbanization of Shanghai and its influences to the city drainage.Urban Problems, (5): 31-35. (in Chinese)

2
Chin A, 2006. Urban transformation of river landscapes in a global context.Geomorphology, 79(3/4): 460-487.Over the past 50years considerable progress has been made in understanding the impacts of urban development on river processes and forms. Such advances have occurred as urban population growth has accelerated around the world. Using a compilation of research results from more than 100 studies conducted in a range of areas (58 addressing morphological change), this paper describes how urbanization has transformed river landscapes across Earth鈥檚 surface, emphasizing the distribution of impacts in a global comparative context. Urban development induces an initial phase of sediment mobilization, characterized by increased sediment production (on the order of 2鈥10 times) and deposition within channels, followed by eventual decline that couples with erosion from increased runoff to enlarge channels. Data from humid and temperate environments around the world indicate that channels generally enlarge to 2鈥3 times and as much as 15 times the original size. Although research has emphasized temperate environments, recent studies of tropical areas indicate a tendency for channel reduction resulting from strong sediment erosion and deposition responses because of intense precipitation and highly weathered soils. Embryonic research in arid environments further suggests variable river responses to urbanization that are characterized by rapid morphological change over short distances. Regardless of location, the persistence of the sediment production phase varies from months to several years, whereas several decades are likely needed for enlarging channels to stabilize and potentially reach a new equilibrium. Urbanizing streams pose particular challenges for management given an inherent changing nature. Successful management requires a clear understanding of the temporal and spatial variations in adjustment processes.

DOI

3
Dunne T, Leopold L B, 1978. Water in Environmental Planning. San Francisco: W.H.Freeman.

4
Elmore A J, Kaushal S S, 2008. Disappearing headwaters: Patterns of stream burial due to urbanization.Frontiers in Ecology and the Environment, 6(6): 308-312.Headwater streams provide important ecosystem services, including clean drinking water, habitat for aquatic life, and rapid processing and uptake of nutrients, which can reduce delivery of nitrogen and phosphorus to downstream coastal waters. Despite their importance to ecosystem functioning, very little research has addressed the extent to which headwater streams are buried beneath the land surface during urbanization. We measured the occurrence of stream burial within a major tributary to the Chesapeake Bay, for streams with catchment areas ranging from 10 ha to 104 ha. We used hydrologic modeling to identify where streams should be and then calibrated a map of impervious surface area, using high-resolution aerial photography to build a stream channel decision-tree classification. We found that 20% of all streams were buried, with streams in low-residential and suburban areas outside Baltimore City exhibiting 19% burial rates. Smaller headwater streams were more extensively buried than larger streams, a...

DOI

5
Graf W L, 1977. Network characteristics in suburbanizing streams.Water Resources Research, 13(2), 459-463.Analysis of hydrologic, geomorphic, and suburbanization data from a small instrumented drainage basin near Iowa City, Iowa, indicates that channel networks are radically altered when suburban development overtakes a drainage basin. Changes in channel networks are such that the network becomes much more efficient in collecting water quickly, so that lag time and kurtosis of storm hydrographs are altered to produce the familiar flash floods of urban areas. The data show that network changes are closely associated with lag time and kurtosis of storm hydrographs and suggest that corrective measures should be concentrated on the internal links of the network. Changes in characteristics of channel networks should be considered in addition to changes in areas of impervious surfaces when the hydrologic impact of suburbanization is assessed.

DOI

6
Gregory K J, Davis R J, Downs P W, 1992. Identification of river channel change due to urbanization.Applied Geography, 12(4): 299-318.ABSTRACT Techniques for determining the precise location of river channel changes are required to complement space-time substitution and three major techniques are illustrated for the Monks Brook drainage basin in central southern England. First, channel widths were measured from large-scale topographic maps of three dates, the results compared with field measurements, and the spatial pattern of planform change was constructed. Secondly, field indicators based on vegetation, structures and morphological criteria were used to quantify channel width, depth and capacity changes at particular locations. Thirdly, mapping of the spatial variation in channel adjustments using field indicators was shown to be viable by comparing the results obtained by two independent operators surveying the same reach. Channel change due to the influence of urbanization on the Monks Brook involves capacity increases of up to 2–2.5 times, width increases of up to 2.2 times and bed lowering of up to 0.4 m. The three groups of techniques are capable of being applied to other channels. Channel capacity enlargements are demonstrated to be spatially discontinuous and may involve widening, deepening, or a combination of the two. The character and location of such changes can be an important consideration for channel management.

DOI

7
Hammer T. R, 1972. Stream channel enlargement due to urbanization.Water Resources Research, 8(6), 1530-1540.Stream channel enlargement occurs in response to the change in streamflow regimen accompanying urbanization. This empirical study relates the imputed increase in channel cross-sectional area to detailed land use data and other information for 78 small watersheds near Philadelphia. Important differences between the effects of various types of impervious land use are observed: large channel enlargement effects are found for sewered streets and area of major impervious parcels such as parking lots, and much smaller effects are observed for unsewered streets and impervious area involving detached houses. Relatively low channel enlargement effects are attributed to all types of impervious development less than 4 years old and also to street and house area more than 30 years old. The influence of impervious development on channel size is found to be significantly related to topographic characteristics of the watershed, to the location of impervious development within the watershed, and to man-made drainage alterations. Although the relative importance of these interactive factors proves difficult to establish, the most critical determinant of the amount of channel enlargement resulting from a given level of urbanization appears to be basin slope.

DOI

8
Han Changlai, Mao Rui, 1997. The structure characteristics and the functional variation of the river systems in Taihu Lake catchment.Journal of Lake Science, 9(4): 300-306. (in Chinese)In the upper reaches of Taihu Lake Basin, the river courses assume branches in shapeand fan shaped drainage system distribute in the lower reaches. Throughout the drainge area river, lakes and link up one another. Affected by sea tide and the river flow. the hydrographic net of lower river has become changeable and the capacity of preventing flood and fighting calamities weak. In recent years such functional variations have happened as "moderate rain with heavy calamities",the inadequate water resources and the serious water pollution,etc. The main cause is that with the effect of natural and artifical factors. many new problems and controdictions in the human being and nature, present and future.economy and environment are brought forward and need to be solved further.

DOI

9
Han Longfei, Xu Youpeng, Shao Yulong.et al., 2013. Effect of urbanization on the stream structure and connectivity: A case study in the midlower reaches of the Qinhuai River.Journal of Lake Sciences, 25(3): 335-341. (in Chinese)

10
Han Longfei, Xu Youpeng, Yang Liu.et al., 2015. Temporal and spatial change of stream structure in Yangtze River Delta and its driving forces during 1960s-2010s.Acta Geographica Sinica, 70(5): 819-827.lt;p>Spatial and temporal variations of river systems in the Yangtze River Delta (YRD) during the 1960s-2010s were investigated based on streams derived from the topographic map in the 1960s, 1980s and 2010s. A list of indices, drainage density (<i>Dd</i>), water surface ratio (<i>WSR</i>), the ratio of area to length of main river (<i>R</i>), evolution coefficient of branch river (<i>K</i>) and box dimension (<i>D</i>), were classified into three types (quantitative, structural, and complex indices) and used to quantify the variation of stream structure. Results showed that: (1) quantitative indices (<i>Dd</i> <i>WSR</i>) presented a decreasing trend in the past 50 years, and <i>Dd</i> in Wuchengxiyu, Hangjiahu and Yindongnan decreased by about 20%. Structurally, the Qinhuai river basin was characterized by a significantly upward <i>R</i> and <i>K</i> value in Hangjiahu went down dramatically by 46.8% during the 1960s-2010s. A decreasing tendency in <i>D</i> was found to dominate the YRD, and decreasing magnitude in Wuchengxiyu and Hangjiahu peaked for 7.8%, and 6.5%, respectively in the YRD. (2) Urbanization affected the spatial pattern of river system, and areas with a high level of urbanization exhibited least <i>Dd</i> (2.18 km/km<sup>2</sup>), <i>WSR</i> (6.52%), <i>K</i> (2.64) and <i>D</i> (1.42), compared with moderate and low levels of urbanization. (3) Urbanization also affected the evolution of stream system. In the past 50 years, areas with high level of urbanization showed a compelling decreasing tendency in quantitative (27.2% and 19.3%) and complex indices (4.9%) and trend of enlargement of main rivers (4.5% and 7.9% in periods of the 1960s-1980s and 1980s-2010s). (4) Expanding of urban land, construction of hydraulic engineering and irrigation and water conservancy activities were the main means.</p>

DOI

11
Horton Robert E, 1945. Erosional development of streams and their drainage basins: Hydrophysical approach to quantitative morphology.Geological Society of America Bulletin, 56(3): 275-370.

12
Huang Yilong, Wang Yanglin, Liu Zhenhuan.et al., 2008. Stream construction characteristics in rapid urbanization area: Shenzhen city as a case.Geographical Research, 27(5): 1212-1220. (in Chinese)Urban River is an important part of urban ecosystem.There are close relationship between stream construction and its ecological function.The form and evolution of stream construction is controlled by geology,topography,soil,climate,vegetation and human activity at local area.At present,human activity,especially urbanization has become the major factor influencing the stream structure.In order to study the effect of urbanization on stream construction,taking Shenzhen city,a rapid urbanization area as a case,which is one of the most rapid urbanization areas in China,by using Strahler classification and Horton laws,this paper analyzed the effect of urbanization on stream length,stream density,bifurcation ratio of rivers,ability of bifurcation of rivers and fractal dimension etc.The result exhibited that:(1)The stream length,stream density and stream number all decreased,especially for the lower order stream from 1982 to 2002.and(2)the ratio and ability of bifurcation decreased of all the watersheds.The stream construction was simplified with time.The fractal dimension of stream construction also decreased with time.(3)The stream construction changing characteristic was different for different watersheds due to the effect of urbanization level.This paper suggested:(1)to improve planning and implement blue-line,strengthen the management of river net and add it to the content of urban planning and managing;(2)to protect the stream in the process of land use change;and(3)to strengthen the control of soil and water erosion,thus decrease the yield of river sediments.

DOI

13
Ji Xiaomin, Xu Youpeng, Han Longfei.et al., 2014. Impacts of urbanization on river system structure: A case study on Qinhuai River Basin, Yangtze River Delta.Water Science & Technology, 70(4): 671-677.Stream structure is usually dominated by various activities over a short term. An analysis of variation in stream structure from 1979 to 2009 in the Qinhuai River Basin, China, was performed based on remote sensing images and topographic maps by using ArcGIS. A series of river parameters derived from river geomorphology are listed to describe the status of river structure in the past and present. Results showed that urbanization caused a huge increase in the impervious area. The number of rivers in the study area has decreased and length of rivers has shortened. Over the 30 years, there was a 41.03% decrease in river length. Complexity and stability of streams have also changed and consequently the storage capacities of river channels in intensively urbanized areas are much lower than in moderately urbanized areas, indicating a greater risk of floods. Therefore, more attention should be paid to the urban disturbance to rivers.

DOI PMID

14
Li Yuanyuan, Li Jianqiang, Li Zongli.et al., 2011. Issues and challenges for the study of the interconnected river system network.Resources Science, 33(3): 386-391. (in Chinese)The issue of sustainable water resources has been receiving much attention for years. With the development of economy and society in China, increasing requirements on water resources will necessitate a strategic shift. Being the new strategy of China, the Interconnected River System Network (IRSN) plan will play a significant role in water resources management in the future. To that end, it is urgent to prompt the research on the theoretical and technology system. Nowadays, studies on IRSN are more loosely scattered and have not been developed into a systemic and scientific theory system. Within IRSN, three major functions will be realized, i.e., increasing water resources allocation, improving river health, and enhancing flood and drought control. IRSN is a pan-regional concept, with different scales showing different characteristics. In terms of reality of water resources exploitation and protection in China, the authors stated in the paper that the research on IRSN can be essentially divided into three levels, i.e., national, regional, and basin levels. Differences are highlighted at each scale, i.e., 1) at the national scale, it primarily focuses on regional differences and how to make sustainable use of water resources, and coordinate the relationships among resources, society, economy and the environment. This will greatly promote the national and regional development; 2) at the regional scale, according to the functional position, comparative advantages, and water system characters of the region, it will contribute to rational water resources allocation, adapting to productive layout, and ultimately realize sustainable development of the region; and 3) at the river basin scale, the principle is the integration of the interest of every user among different reaches, and the development of nature and human within the whole river basin, with the aim to ultimately realize the sustainable water resource use, the environmental health, and sustainable development of economic society at the basin level. In the changing environment, there will be a series of challenges in the research, e.g., 1) how to match best between the distribution of river systems, and the eco-social layout. This is an effective measure of solving water shortages and ensuring stable economic development, and also the key point and great challenge of the IRSN; 2) uncertainty of climate change and the effects on IRSN. In particular, increasing extreme events will impose a big challenge for flood and drought control of the IRSN; and 3) interdisciplinary and comprehensive research. Due to the complexity of the system, the research on the IRSN will involve interdisciplinary theory, which is also a challenge for the researchers.

15
Marsh George Perkins, 1865. Man and Nature, or Physical Geography as Modified by Human Action. University of Washington Press.

16
Meyer J L, Wallace J B, Press M C et al., 2001. Lost linkages and lotic ecology: Rediscovering small streams. In: Ecology: Achievement and Challenge. The 41st Symposium of the British Ecological Society sponsored by the Ecological Society of America held at Orlando, Florida, USA, 10-13 April 2000. Blackwell Science, 295-317.

17
Ni Jinren, Liu Yuanyuan, 2006. Ecological rehabilitation of damaged river system.Science and Technology Review, 24(7): 17-20. (in Chinese)Based on the analysis on relationship between river health and its functions,characteristics and regulation of rivers are discussed in terms of different phases including the natural-cycled phase,engineering-regulated phase,pollution-controlled phase and ecological-rehabilitated phase.The equilibrium states of a healthy river system and its influencing factors are analyzed for the given phases and river reaches.A diagnosis index system for river health is established,and the principles for guiding the design of ecological rehabilitation are proposed.The goal of river ecological rehabilitation is to sustain a healthy river system and to create a harmonious relationship between river and human being.Primary technology for river ecological rehabilitation includes riparian buffer strips,vegetation,water replenishing,biology-ecology measures,habitat restoration and hydrobios community rehabilitation.A well designed four-layer structure based on the general idea of analytical hierarchy process(AHP) is used to summarize the complicated relationships among river health,river functions and corresponding indexes,thresholds and level of damage,and measures for ecological rehabilitation.

DOI

18
Strahler Arthur N, 1957. Quantitative analysis of watershed geomorphology.Eos, Transactions American Geophysical Union, 38(6): 913-920.Quantitative geomorphic methods developed within the past few years provide means of measuring size and form properties of drainage basins. Two general classes of descriptive numbers are (1) linear scale measurements, whereby geometrically analogous units of topography can be compared as to size; and (2) dimensionless numbers, usually angles or ratios of length measures, whereby the shapes of analogous units can be compared irrespective of scale.Linear scale measurements include length of stream channels of given order, drainage density, constant of channel maintenance, basin perimeter, and relief. Surface and crosssectional areas of basins are length products. If two drainage basins are geometrically similar, all corresponding length dimensions will be in a fixed ratio.Dimensionless properties include stream order numbers, stream length and bifurcation ratios, junction angles, maximum valley-side slopes, mean slopes of watershed surfaces, channel gradients, relief ratios, and hypsometric curve properties and integrals. If geometrical similarity exists in two drainage basins, all corresponding dimensionless numbers will be identical, even though a vast size difference may exist. Dimensionless properties can be correlated with hydrologic and sediment-yield data stated as mass or volume rates of flow per unit area, independent of total area of watershed.

DOI

19
Tian Guangjin, Jiang Jing, Yang Zhifeng.et al., 2011. The urban growth, size distribution and spatio-temporal dynamic pattern of the Yangtze River Delta megalopolitan region, China.Ecological Modelling, 222(3): 865-878.As one of the six megalopolitan regions in the world, the Yangtze River Delta is one of the most populated and developed regions of China. The spatial and temporal dynamic pattern of the urbanization process of the megalopolitan region is investigated. This work compared the spatial and temporal dynamic pattern of the urban growth for the five urban areas (Shanghai, Nanjing, Suzhou, Wuxi and Changzhou) in this region. During the 15 years, urban growth patterns were dramatically uneven over three 5-year periods. The size distribution of the five urban areas became more even with the rapid urbanization process. The patterns of urban expansion reflected policy adjustment and economic development throughout the time. Landscape metric analysis across concentric buffer zones was conducted to elucidate the area, shape, size, complexity and configuration of urban expansion. The study indicates the coalescence process occurred during the rapid urban growth from 1990 to 1995 and the moderate growth period from 2000 to 2005, but different urban growth period between 1995 and 2000. The urban growth pattern was coalesced for the Nanjing and Wuxi metropolitan areas and diffused for Shanghai. Suzhou and Changzhou. This approach indicates that the coalescence process was the major growth model for this region in the recent 15 years despite their different size, economic growth and population growth. The diffusion-coalesce dichotomy represent endpoints rather than alternate states of urban growth. This work will be beneficial in understanding the size distribution and urbanization process of the megalopolitan region in China. (C) 2010 Elsevier B.V. All rights reserved.

DOI

20
Vanacker Veerle, Molina Armando, Govers Gerard.et al., 2005. River channel response to short-term human-induced change in landscape connectivity in Andean ecosystems.Geomorphology, 72(1): 340-353.The drainage basin of the Deleg River (88 km 2 ), located in the southern Ecuadorian Andes, was studied to assess the geomorphic and hydrologic response of a fluvial system to human-induced environmental change in its contributing area. Historical data on land use, channel morphology and sedimentology were collected, based on a spatial analysis of aerial photographs (1963鈥1995) and a field survey (2002). Analysis of channel cross-sectional profiles and sedimentological data revealed a major change in morphology and sedimentology of the Deleg River during the past four decades: (i) the active river channel narrowed by over 45%, (ii) the riverbed incised on average by over 1.0 m and (iii) the median grain size of the bed surface decreased from 13.2 cm to 4.7 cm. The spatial pattern of land cover within the Deleg catchment also changed considerably: highly degraded agricultural land in the low-lying areas was abandoned and partially afforested for timber and wood production, whereas secondary upland forest was increasingly cleared for expansion of cropland and pastures. Notwithstanding large changes in the spatial organization of land use within the catchment, the overall land use did not change significantly during the past four decades. This suggests that the response of the Deleg River to land-use change not only depends on the overall land-use change, but also on the spatial pattern of land-use/cover change within the catchment. Although forestation and regeneration of bare gully slopes and floors throughout the catchment only represented a minor part of the total land-use change, these land-use/cover changes had a major impact on the hydrological and sediment connectivity in the landscape.

DOI

21
Xiao P F, Wang X H, Feng X Z.et al., 2014. Detecting China’s urban expansion over the past three decades using nighttime light data.IEEE Journal of Selected Topics in Applied Earth Observations and Remote Sensing, 7(10): 4095-4106.

22
Xu Guanglai, Xu Youpeng, Wang Liuyan, 2013. Temporal and spatial changes of river systems in Hangzhou-Jiaxing-Huzhou Plain during 1960s-2000s.Acta Geographica Sinica, 68(7): 966-974. (in Chinese)Based on the topographic map data in 1960s, 1980s and 2000s, the temporal and spatial changes of river networks of Hangzhou-Jiaxing-Huzhou Plain region were analyzed from aspects of the river density (<em>D</em><sub>R</sub>), rate of water area (<em>W</em><sub>P</sub>), development coefficient of the river network (<em>K</em><sub>&omega;</sub>), the ratio of area-length of main river (RAL) and box dimension (D0) etc. The results showed that: (1) <em>D</em><sub>R</sub> and <em>W</em><sub>P</sub> presented a decline trend during the 1960s-2000s with river length decreased by 11023.33 km (about 38.67%) and water area decreased by 151.58 km<sup>2</sup> (about 18.83%), and the trend was still intensifying. (2) <em>K</em><sub>&omega;</sub> also showed a decline trend with K2 decreasing from 1.41 to 1.35 (a decrease of 3.9%) during the 1960s-1980s and to 0.15 during the period of 1980s-2000s (decreased by 88.6% ). And the main rivers were gradually dominant in river network in the process of urbanization. (3) The spatial variation of the river network was obvious, the southern regions with an intensive river network was the most dramatic. (4) Each river system has its characteristics under different underlying surface conditions. Wp was smaller with 4.9%-9.4% in city regions. The <em>D</em><sub>R</sub> and <em>W</em><sub>P</sub> had decreased since the 1960s. Some river channel projects for dredging and urban flood control were implemented in the process of urbanization. In the regions of intensive river network (<em>D</em><sub>R</sub> was 2.1-5.3 km/km<sup>2</sup>), there was a significantly decreasing trend of tributary rivers, and an increasing trend of main rivers. In the lake regions with bigger <em>W</em><sub>P</sub> (about 17.8%-19.7%), there were no significant changes of river system pattern.

23
Xu Youpeng, 2012. Impacts of Urbanization of the Yangtze River Delta Region on River System in Basins and Hydrological Processes. Beijing: Science Press. (in Chinese)

24
Yang Kai, Yuan Wen, Zhao Jun.et al., 2004. Stream structure characteristics and its urbanization responses to tidal river system.Acta Geographica Sinica, 59(4): 557-564. (in Chinese)lt;p>Based on the data from Shanghai water resources survey separately conducted at the beginning of the 1980s and the end of the 1990s, taking water conservation zone, which is generally used to manage water resources and prevent serious flood, as the basic unit for stream structure analysis, this paper discussed the characteristics of stream structure and its growth laws under the situation of rapid urbanization in Shanghai. The research showed that (1) Horton law still plays an important role in some areas with relative lower urbanization level, and stream number and average length of stream decrease in geometric series with the raising of stream order. Self-similarity of stream structure lies in different stream orders. (2) Urbanization is the dominant factor changing the structure of river system in urban area. In high-urbanized water conservancy zones, self-similarity properties of stream structure could not be observed. (3) There existed significant relationship between stream structure and its function. Because water area and stream ramification decreased obviously during the proCess of urbanization in Shanghai, it is an urgent task to pay more attention to those indicators such as water area, stream ramification, river naturalness, and try best to maintain the reasonable values for these indicators.</p>

DOI

25
Yuan Wen, Yang Kai, Tang Min.et al., 2005. Stream structure characteristics and their impact on storage and flood control capacity in the urbanized plain river network.Geographical Research, 24(5): 717-724. (in Chinese)Stream structure in urbanized river network area has unique characteristics under the effect of physical factors and human modification. Hence the issues of what and how such changes worked on river network storage and flood control capacity become the focus of this study. Taking Shanghai as a sample area, which is one of the largest cities in China located in the eastern Yangtze Delta, by using Horton-Strahler classification and Horton laws as reference based on the stream classification system that is commonly adopted in Shanghai and other cities around it, this paper analyzed the stream structure characteristics in each catchment under various urbanization levels;approached the effect of urbanization on stream structure development; and demo nstrated the possible relations between stream structure and river network storage and flood control capacity. The flood storage and control functions of streams in each order were further discussed in this paper. The main results are: (1 ) The stream number and length within the river network were highly developed in the study area. Stream number developed better than stream length. (2) The stream structure could only be modified when urbanization was up to a certain high level. Physical laws still played important roles in those catchments with lower urbanization level. (3) The stream structure expressed the possible trends from comprehension to simplicity, from multiform to singleness during the process of urbanization. (4) There was an obvious converse change between river network storage and flood control capacity and urbanization level. River network stor age and flood control capacity was influenced both by the quantity of water area and stream structure and much more closely related to the number and length of streams in the lower order. (5) For those streams in the higher order, the stor age capacity was stronger than the control capacity and the converse situatione xisted in those streams in the lower order. (6) proper quantity of water area and better stream structure were the infrastructures to assure ecological flood storage and control in urban area.

DOI

26
Yuan Wen, Yang Kai, Wu Jianping, 2007. River structure characteristics and classification system in river network plain during the course of urbanization.Scientia Geographica Sinica, 27(3): 401-407. (in Chinese)Stream structure development in river network regions was both affected by physical conditions and rapid urbanization.Based on remote-sensing data,four measuring dimensions including the degree of urbanization,river patterns,stream structure and river functions were brought forward to be used as tools for stream structure classification.Twelve indicators such as the percentage of urbanized area,river length and width distribution,river fractal dimension,river flood storage and control capacities were designed for explaining the four measuring dimensions and describing the characteristics of stream structure type.The characteristics of three kinds of stream structure that were defined as the mainstream type,and the "#" type and the natural type were discussed based on the classification system developed in the paper.The results showed that the mainstream type was formed mainly because of high level of urbanization and branches were engineered out for the sake of urban construction and expanded.The natural type was maintained mostly in the area with lower lever of urbanization,which always reflects the local physical features.The "#" type stream structure was a sort of result caused by intermediate level of urbanization under spatial distribution of mainstreams in a catchment.Generally,following the urbanization process,stream structure might be changed from the natural type to the "#" type and at last,to become the mainstream type.The paper further discussed the qualitative and quantitative criteria that could used to guide differentiating structure status in river network regions.The authors thought it was valuable and important to maintain natural stream structure and plan and restore multi-functions of rivers in the process of urbanization.

27
Zhang Shixia, Guo Yakun, Wang Ziwen, 2015. Correlation between flood frequency and geomorphologic complexity of rivers network: A case study of Hangzhou China.Journal of Hydrology, 527: 113-118.Urban flooding is a combined product of the climate and watershed geomorphology. River system is one of the vital components of watershed geomorphology. The geomorphic characteristics of rivers have important effect on the formation of flooding. However, there have been few attempts so far to investigate the relationship between flooding frequency, the probability of flooding, and the geomorphological complexity of river system. Such relationship is essential in order to predict likely responses of flooding frequency to the large-scale changes in the complexity of the rivers network induced by accelerating urbanization around rivers. In this study we investigate the correlation between geomorphological characteristics of river system and the probability of flooding. Hangzhou city in China, which has suffered severe flooding, is chosen as a case study to evaluate this correlation and to investigate the impact of changes of drainage networks morphology on the local flooding. The fractal dimension, which is used to quantitatively assess geomorphological complexity of rivers network, is calculated by using box-counting method based on fractal geometry for eight sub rivers network in Hangzhou. A model based on the correlation of flooding frequency and fractal dimension is established. The model is applied to investigate the effect of the rapid urbanization induced changes of river geomorphology on the local flood frequency in two typical regions in Hangzhou. The results show that the flood frequency/event increases with the decrease of fractal dimension of the rivers network, indicating that the geomorphologic complexity of rivers network has an important effect on flooding. This research has great referential value for future flood quantitative investigations and provides new method for urban flood control and river system protection.

DOI

28
Zhou Hongjian, Shi Peijun, Wang Jingai.et al., 2008. River network change and its ecological effects in Shenzhen region in recent 30 years.Acta Geographica Sinica, 63(9): 969-980. (in Chinese)lt;p>Based on the topographic map data (in the late of the 1960s and 1980s), rivers general investigation data (in 2003) and remote sensing data (MMS in 1980; TM in 1988, 2005) of Shenzhen region, the temporal and spatial changes of river networks and the relationship between river networks and urbanization ratio were analyzed. According to the above results, ecological effects of river networks change in Guanlan River basin, based on the four indicators of vegetation coverage (Vc), biological resources value (Br), ecosystem services value (Es) and ecological capital (Ec), were discussed. The results showed that: (1) the river network structure appeared as a trend from comprehension to simplicity, and the development of river branches were restricted strongly in recent 30 years. The length was shortened by 355.4 km, and the number of rivers reduced 378, while the drainage density decreased from 0.84 km/km<sup>2 </sup>to 0.65 km/km<sup>2</sup>. The major area, where the river networks decreased or disappeared, is located in the circle area with the town as the center and the radius of 1-2 km. There were 4 different types of change characteristics of river networks in all 9 drainages of Shenzhen according to urbanization ratio in the main drainage and whether or not it flows into sea directly. (2) There was significant correlation between urban expansion and river networks reduction, especially with river branches decreasing when the urban land ratio was less than 30% ; while it was above 30% , the effects became weak. (3) The ecological functions of Guanlan River basin became weaker remarkably, of which Br decreased most (about 41%), Vc was second (24%). The ecological capital per unit area decreased from 22.79 million yuan/km<sup>2</sup> to 2.34 million yuan/km<sup>2</sup> while total capital reduced 3136 million yuan in 2000-2005. (4) Changing river networks and urbanization were the main reasons for the degradation of ecological functions, and they had different contribution ratios for decline of the four indexes, of which they were respectively 23.1% and 35.8% for Vc, 25.1% and 32.7% for Br, 7.7% and 56.2% for Es, and 10.6% and 52.2% for Ec. The paper provided an empirical case to recover river networks in the last several periods, and a quantitative expression of river networks change.</p>

DOI

29
Zhou Hongjian, Wang Jingai, Yue Yaojie.et al., 2006. Assessment of flood hazard based on river network change: Taking the Beijing-Tianjin segment of Yongding River watershed as an example.Journal of Natural Disasters, 15(6): 45-49. (in Chinese)

Outlines

/