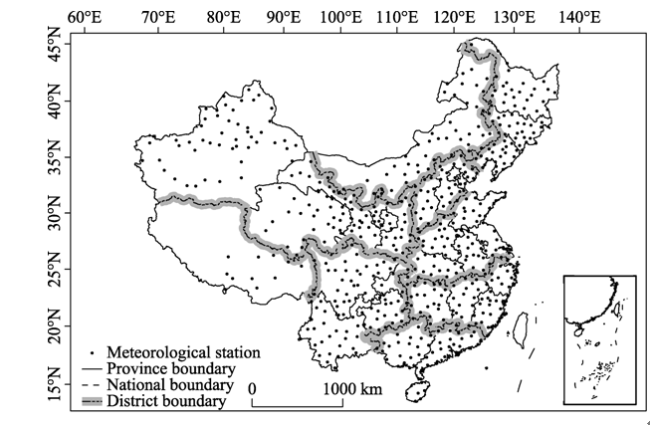
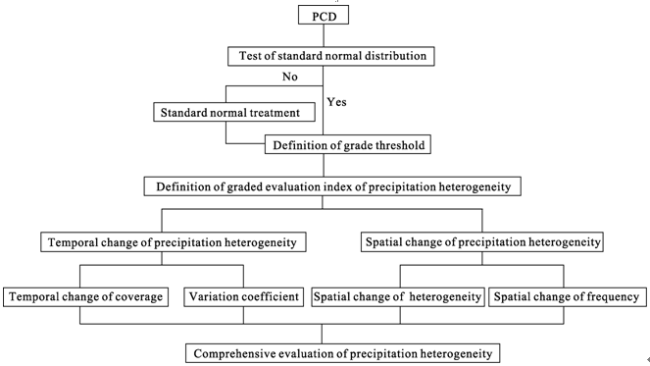
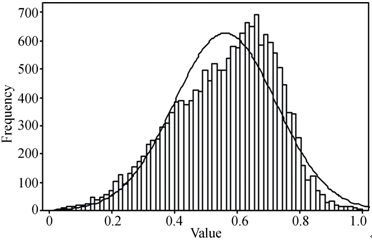
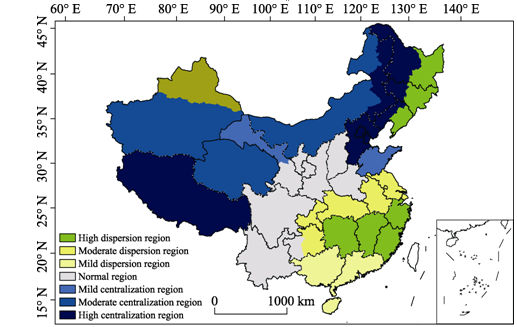
4.2.1 Spatial changes in the precipitation heterogeneity
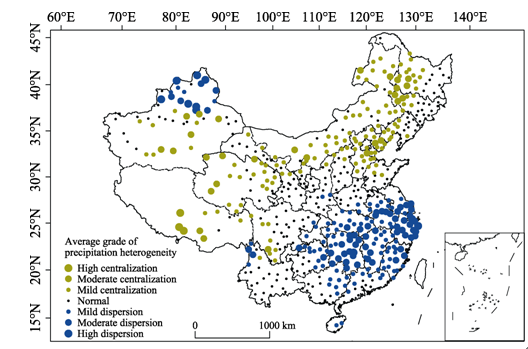
By analyzing the average grade of the precipitation heterogeneity at each meteorological station, we concluded that the precipitation heterogeneity showed the characteristics of spatial dispersion in the south and east and of centralization in the north and west (
Figure 5).
In northwestern China, the distribution of the precipitation heterogeneity grade revealed three sections. That of the eastern section (Shaanxi, Ningxia and eastern Gansu) tended to be normal. The northern part of the middle section (western Gansu) was characterized as normal while the southern part of the middle section was characterized as mainly mildly or moderately centralized. The eastern section was divided into two parts by the Tianshan Mountains; its northern part (northern Xinjiang) was characterized by high dispersion and its southern part (southern Xinjiang) was characterized by mild or moderate centralization. The Tianshan area was normal.
The precipitation in northern China was generally mildly centralized. Within this region, the precipitation in Hebei, Beijing, Tianjin and northern Shanxi was mainly mildly centralized, that in eastern Hebei was moderately centralized and that in southern Shanxi was mainly normal.
The precipitation in Inner Mongolia was mainly mildly centralized, but at individual meteorological stations, it was mainly normal or moderately centralized.
There was a two-section “east-west” distribution in northeastern China. The precipitation in the east was generally normal, that in the west was generally mildly or moderately centralized and that in the area near the Greater Khingan Range was generally moderately centralized.
There was a two-section “south-north” distribution in eastern China in which the precipitation tended to be dispersive from north to south. The precipitation in the northern part (Henan and Shandong) was generally normal and that in northern Shandong tended to be mildly centralized; in the southern part (Hubei, Anhui, Jiangsu and Shanghai), the precipitation was generally mildly or moderately centralized.
The precipitation in the Jiangnan region (area south of the Yangtze River Basin) was generally moderately dispersed. In the eastern (Zhejiang and eastern Fujian) and western (Hunan and western Jiangxi) parts, the precipitation was generally moderately dispersed, and in the middle part (eastern Jiangxi and western Fujian), it was generally mildly dispersed.
In southern China, the precipitation was generally normal or mildly dispersed. In the middle part, it was generally mildly dispersed, but it was generally normal in the eastern and western parts.
In southwestern China, the precipitation was generally normal or mildly dispersed. In the eastern part (Chongqing and eastern Guizhou), it was generally mildly or moderately dispersed; in the middle part (eastern Sichuan) and Yunnan Province, it was generally moderately dispersed; in the Hengduan Mountains, it was generally moderately dispersed; and in western Sichuan, it was generally mildly centralized.
In Tibet, the precipitation was generally moderately or highly centralized. Due to incomplete meteorological data and the large area of Tibet, it was necessary to consider whether the data are representative by analyzing the spatial characteristics of the precipitation heterogeneity grades of individual meteorological stations. However, the results of performing the calculations using data from only 11 meteorological stations showed that the heterogeneity grades generally tended to be centralized. This consistency supports the result given above.
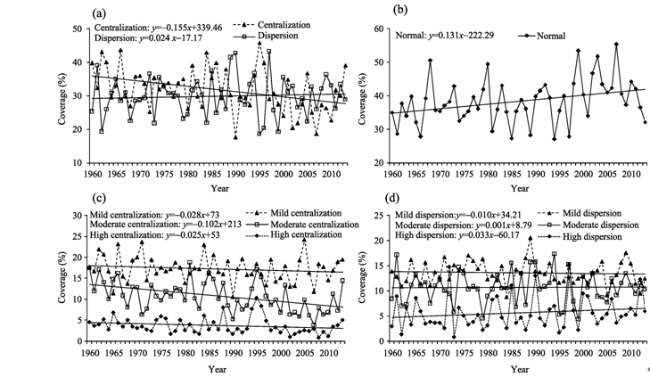
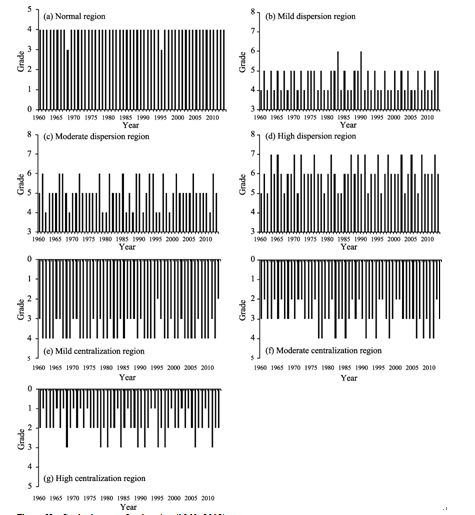
By analyzing the variation coefficients of the precipitation heterogeneity at various meteorological stations, the numerical stability of the precipitation heterogeneity was shown to have the following spatial characteristics: the “south and east were steady, but the north and west were fluctuant” (
Figure 6). People living in the regions in which the precipitation homogeneity tended to fluctuate should pay more attention to the spatiotemporal regulation of water to respond to droughts and floods. The precipitation heterogeneity tended to fluctuate more in Inner Mongolia, the eastern part of northern China (Hebei, Beijing and Tianjin), the eastern part of northeastern China, the middle (western Qinghai and western Gansu) and western parts of northwestern China (southern Xinjiang) and Tibet.
Figure 5 Spatial distribution of average grade of precipitation heterogeneity |
Figure 6 Spatial distribution of grade variation coefficient of precipitation heterogeneity |
4.2.2 Spatial changes in the frequency of each precipitation heterogeneity grade
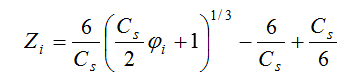
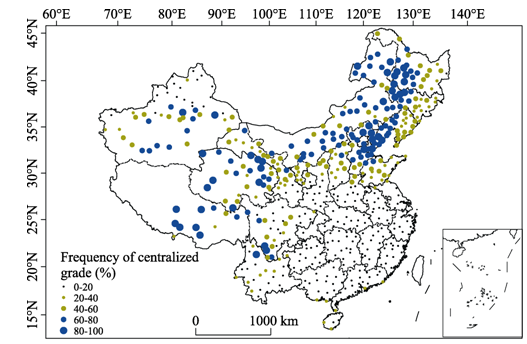
We analyzed the frequency of each precipitation heterogeneity grade at various meteorological stations in China. For the purpose of convenient description and understanding, we defined the frequency grades as follows: 0-20% is very low, 20%-40% is low, 40%-60% is moderate, 60%-80% is high, and 80%-100% is very high.
(1) The spatial distribution of the frequency of the centralization grade
In the nearly 54 years of the study period, the frequency of the centralization grade was generally low in the south and high in the north (
Figure 7).
The frequency increased from east to west in northwestern China. Among these cities, the frequency was very low at Shaanxi, very low or moderate at Ningxia and Gansu, high at Qinghai, very low in northern Xinjiang, and moderate or high in southern Xinjiang.
The frequency was high in northern China, especially in the east, and the frequency gradually increased from west to east.
The frequency was high in the Inner Mongolia region and very high in the area near the Greater Khingan Range.
The frequency increased from east to west in northeastern China.
In southern China, the Jiangnan region, eastern China (except for Shandong Province) and the eastern part of southwestern China (Guizhou and Chongqing), the frequency was low, which showed that the precipitation in these areas was homogenous.
The frequency was low in southwestern China and tended to be low in the west and high in the east. It was low in the east (Guizhou and Chongqing) and the west (eastern Sichuan and eastern Yunnan). In addition, the frequency was high on the border between Yunnan and Sichuan.
The frequency was very high in Tibet.
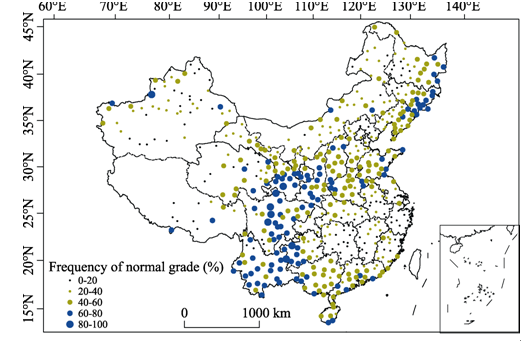
(2) The spatial distribution of the frequency of the normal grade
The spatial distribution of the frequency of normal precipitation was complex during the 54 years of the study period, and the distribution was different in each region (
Figure 8).
In northwestern China, the frequency was high in the east and low in the west. The frequency was high in Shaanxi, Ningxia, and eastern Gansu and very low or low in Qinghai, western Gansu and Xinjiang.
In northern China, the frequency exhibited the special characteristic of being low in the west and high in the east. It was very low or low in Hebei, Beijing and Tianjin and very high in Shanxi.
The frequency was low or moderate in the Inner Mongolia region.
The frequency was high in the east and low in the west of northeastern China. It was high in the east and low or moderate in west.
The spatial distribution of the frequency showed that it was high in the northern part and low in the southern part of northern China. The frequency was moderate or high in Shandong and Henan, but low or very low in Hubei, Anhui, Jiangsu, and Shanghai.
In the Jiangnan region, the frequency was low or very low, but it was higher in Fujian.
In southern China, the frequency was low or moderate.
On the whole, the frequency was high in southwestern China. It was low in eastern Chongqing and Guizhou but high or very high in western Guizhou, Sichuan and Yunnan.
There were some internal differences in Tibet, and the frequency was very low or low in general.
Figure 7 Spatial distribution of frequency of centralization grade (1960-2013) |
Figure 8 Spatial distribution of frequency of normal grade (1960-2013) |
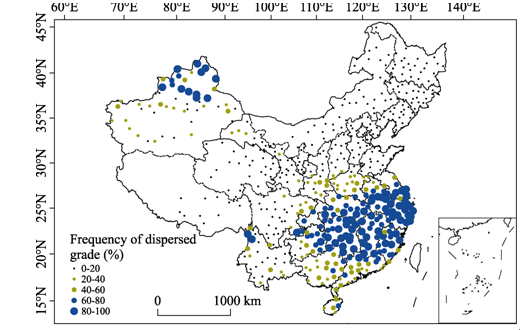
(3) The spatial distribution of the frequency of the dispersion grade
The spatial pattern of the frequency of the dispersion grade in China was that it was high in the south and low in the north (
Figure 9).
In northwestern China, the frequency was generally high in the west and low in the east. The frequency was low or moderate in southern Shaanxi and very low in northern Shaanxi, Gansu and Qinghai. The frequency was low or moderate in southern Xinjiang and very high in northern Xinjiang.
In northern China, the Inner Mongolia region, northeastern China and Tibet, the frequency was very low.
The frequency gradually increased from north to south in eastern China. The frequency was low in Henan and very low in Shandong and high or very high in Hubei, Anhui, Jiangsu and Shanghai.
Figure 9 Spatial distribution of frequency of dispersed grade (1960-2013) |
The frequency was high and generally characterized as extremely high in the Jiangnan region.
The frequency was low or moderate in southern China.
In view of the overall situation, the southwestern part exhibited a spatial distribution of the frequency that was high in the east and low in the west. The frequency in eastern Chongqing and Guizhou was high or very high, but it was very low or low in Sichuan, Yunnan and western Guizhou.

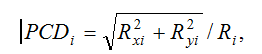
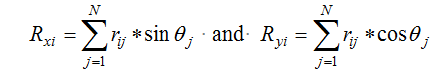
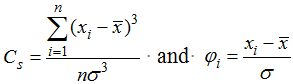
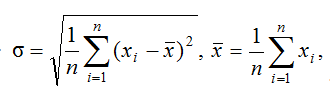 and xi is the value of meteorological factor i.
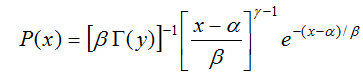
 is the average of the climatic elements.
