Research Articles

Distribution and trend on consecutive days of severe weathers in China during 1959-2014

  • SHI Jun , 1, 2 ,
  • WEN Kangmin 1, 2 ,
  • CUI Linli 3
Expand
  • 1. Ecological Technique and Engineering College, Shanghai Institute of Technology, Shanghai 201418, China
  • 2. Shanghai Climate Center, Shanghai Meteorological Bureau, Shanghai 200030, China
  • 3. Shanghai Center for Satellite Remote Sensing and Application, Shanghai 201199, China

Author: Shi Jun (1975-), specialized in climate change and meteorological disaster. E-mail:

Received date: 2015-10-16

  Accepted date: 2015-12-25

  Online published: 2016-06-15

Supported by

National Natural Science Foundation of China, No.41571044, No.41001283

China Clean Development Mechanism (CDM) Fund Project, No.2012043

CAS Pilot Special Project, No.XDA05090204

Copyright

Journal of Geographical Sciences, All Rights Reserved

Abstract

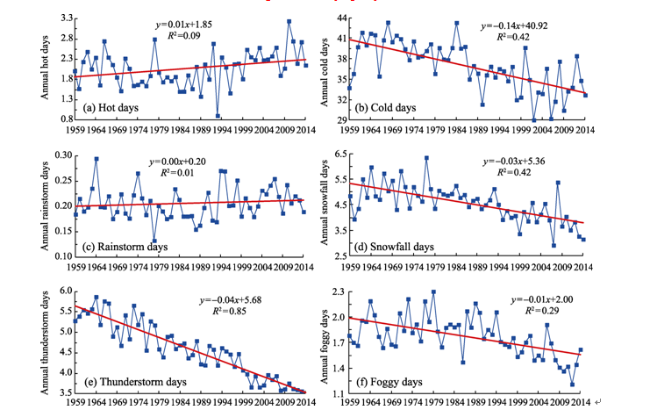
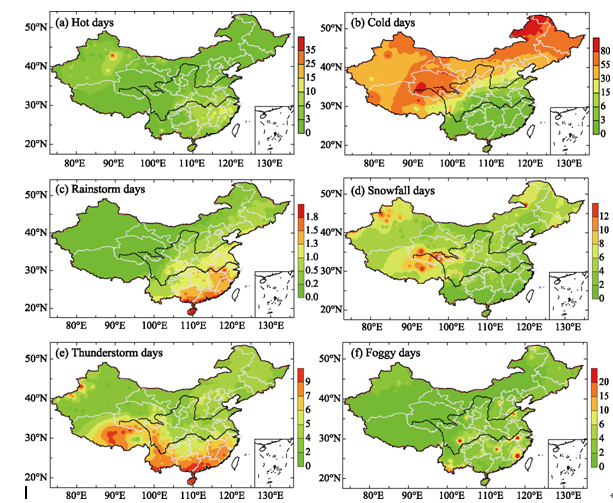
Based on daily surface climate data and weather phenomenon data, the spatial and temporal distribution and trend on the number of consecutive days of severe weathers were analyzed in China during 1959-2014. The results indicate that the number of consecutive days for hot weathers increased at a rate of 0.1 day per decade in China as a whole, while that for cold weathers, snowfall weathers, thunderstorm weathers and foggy weathers showed significant decreasing trends at rates of 1.4, 0.3, 0.4 and 0.4 day per decade, respectively. Spatially, there were more consecutive hot days and rainstorm days in southeastern China, and more consecutive cold days and snowfall days in northeastern China and western China. Consecutive thunderstorm days were more in southern China and southwestern China, and consecutive foggy days were more in some mountain stations. Over the past 56 years, annual number of consecutive cold days decreased mainly in most parts of western China and eastern China. Consecutive thunderstorm days decreased in most parts of China. The trend of consecutive hot days, snowfall days and foggy days was not significant in most parts of China, and that of consecutive rainstorm days was not significant in almost the entire China.

Cite this article

SHI Jun , WEN Kangmin , CUI Linli . Distribution and trend on consecutive days of severe weathers in China during 1959-2014[J]. Journal of Geographical Sciences, 2016 , 26(6) : 658 -672 . DOI: 10.1007/s11442-016-1291-2

1 Introduction

The combined global land and ocean average temperature shows an linear increase of 0.89°C during 1901-2012 and 0.72°C during 1951-2012, and the increase of global surface temperatures for 2081-2100 will likely be in the range of 0.3-4.8°C relative to 1986-2005 (IPCC, 2013). A changing climate will lead to the changes of extreme weather and climate events in their frequencies, intensities, durations, spatial extents and timings (Xia et al., 2012; Fu et al., 2013; Wang et al., 2014; Ren et al., 2015), and can result in unprecedented death, injury and property damage (IPCC, 2012). During the 2001-2010 decade, our world suffered unparalleled high-impact climate extremes in history, and over 370,000 people died from extreme weather and climate conditions (WMO, 2013). The analysis of the climatic characteristics of weather and climate extremes, including their frequency, intensity and duration, is thus necessary for scientific research of climate change and for developing climate change mitigation and adaptation strategies (de Vyver, 2012).
Severe weathers refer to any hazardous meteorological or hydro-meteorological phenomena which potentially cause major damage, serious social disruption or loss of human life (WMO, 2004). The main severe weathers in China include rainstorm, thunderstorm, snowstorm, dust/sand storm, tornado, gale, extreme temperature, fog, haze, etc. Previous studies have investigated the variation patterns of some severe weathers in China. For example, Yu et al. (2012) analyzed the interdecadal variations of thunderstorm, hail and gale in the south of the Yangtze River, Jiang-Huai area, Huang-Huai area and the north of the Yellow River from 1971 to 2000. Fu et al. (2013) examined the variability in the frequency of precipitation extremes in China during 1961-2009. Wang et al. (2014) investigated the distribution and variability of extreme temperature in the Yangtze River Basin from 1962 to 2011. Zhu et al. (2014) studied the spatiotemporal variation patterns of the beginning and ending dates of snowfall and snowfall days in Qinghai Province during 1962-2012. Liu et al. (2015) analyzed the spatiotemporal variation of cold surges and their possible driving factors in Inner Mongolia during 1960-2012.
However, there are some insufficiencies in the previous studies. To begin with, the majorities of existing studies are concerned with the frequency change of severe weathers based on monthly or annual data, but few studies focus on the consecutive days of severe weathers based on daily observation data. Then, those findings from early researches do not contain the recent observation data, so they can't reflect the latest changes of severe weathers especially in recent years. Finally, most of previous studies are related to temperature and/or precipitation extremes, and only a minority of researches considers other severe weathers, such as thunderstorm and snowfall (Singh and Patwardhan, 2012; Brooks, 2013; Zhu et al., 2014). The characteristics of these severe weathers are absolutely necessary to engineering design and risk mitigation under global climate change.
In this study, we take the whole of China as study area, using the weather monitoring data from 1959 to 2014, to detect the temporal and spatial patterns in the consecutive days of six types of severe weathers, namely, hot weathers, cold weathers, rainstorm weathers, snowfall weathers, thunderstorm weathers and foggy weathers. The datasets that we used and methods that we employed are described in the next section. The interannual variability, spatial distribution and trend associated with severe weathers are presented in Section 3. This is followed by a discussion of the main findings in Section 4. Finally, we summarize our most important findings and provide conclusions in Section 5.

2 Data and method

2.1 Data

The daily surface climate data and weather phenomenon data provided by the National Meteorological Information Center, China Meteorological Administration (NMIC/CMA) were used to produce the consecutive days of severe weathers in this study. After a comprehensive consideration of the time duration and the missing rate of observation data, 604 among 756 available stations, with relatively complete data series of daily maximum temperature (Tmax), daily minimum temperature (Tmin), daily precipitation and daily weather phenomenon records of snowfall, thunderstorm and fog, were chosen. The administrative division of China and the distribution of selected meteorological stations are shown in Figure 1. These selected stations have the missing values of less than 10% in daily surface climate data and weather phenomenon data. Erroneous data and outliers of climate elements and weather phenomena was checked to improve the data quality and avoid the negative effects on climatic trend, and the missing data were filled in with the synchronous values of neighboring stations through simple linear regression method or with the climatological standard normals, 1981-2010 of the stations themselves (Zhang et al., 2008). Since 2014, thunderstorm was no longer observed and recorded at meteorological stations of China, so the analysis period of thunderstorm was actually from 1959 to 2013.
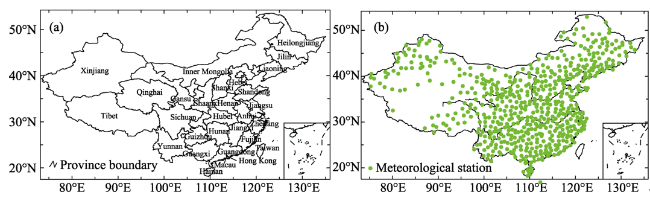
Figure 1 The administrative division (a) and the locations of 604 meteorological stations (b) in this study

2.2 Method

2.2.1 The definition of the days of severe weathers
In this study, hot days are specified as those days with Tmax no less than 35°C, and cold days are those with Tmin less than -5°C. Rainstorm days are defined as days with daily precipitation no less than 50 mm. The definition of snowfall, thunderstorm and foggy days is in accordance with Standard of the Surface Observation about Meteorology (CMA, 2003), namely, snowfall is a type of precipitation falling from clouds in the form of flakes of crystalline water ice. Thunderstorm is a storm in which there is thunder and lightning and a lot of heavy rain. Fog is a visible mass consisting of droplets of water vapor or ice crystals in the air near the ground, which causes a reducing visibility of less than 1 km (Shi et al., 2010). If the above-mentioned weathers occurred on a same day simultaneously, that day was recorded as the corresponding type of severe weathers respectively.
2.2.2 The sequence of consecutive days for severe weathers
For each type of severe weathers, the sequences for annual average days and annual maximum days of consecutive severe weathers were built in China respectively. Based on the daily sequence of severe weathers, the periods of consecutive days for each type of severe weathers were determined and annual maximum number of consecutive days (or the length of the longest consecutive days in each year) was counted to form the annual sequence of consecutive days at each station. To obtain the sequence of annual average days of consecutive severe weathers in China, annual average days of consecutive severe weathers in each province was calculated firstly with the station-averaged method, and then annual average days of consecutive severe weathers for China were calculated with the area-weighted average method according to the area of each province. The longest consecutive days for each type of severe weathers were selected directly from 604 stations in each year to obtain the annual maximum sequence of consecutive severe weathers in China.
2.2.3 Distribution and trend of consecutive days for severe weathers
Based on the annual sequence of consecutive days for each type of severe weathers, the average annual consecutive days and the linear trend of annual consecutive days of severe weathers were calculated at each station and in the whole China during 1959-2014. Trend is defined by linear regression coefficient (Niu et al., 2004). The linear trends were calculated with the method of ordinary least squares regression, which was generally used in extreme temperature and precipitation studies (Kruger and Sekele, 2013; de Lima et al., 2013), and the statistical significance was tested at the 0.05 confidence level using a two-tailed t-test (Wang et al., 2013b). According to the longitude and latitude of meteorological stations, the spatial distribution and trend in annual consecutive days of severe weathers were spatialized with the inverse distance weighted (IDW) interpolation technique and were displayed by drawing software Surfer 8. The spatial distribution indicates the general condition of consecutive severe weathers in China, and the spatial trend manifests the linear regression coefficient on a time scale of ten years.

3 Results and analysis

3.1 Temporal characteristics in the consecutive days of severe weathers in China

To understand the temporal variations in the consecutive days of severe weathers, the distributions and trends in annual and decadal average days of consecutive severe weathers, and those in annual maximum days were analyzed for each type of severe weathers in China.
3.1.1 Interannual and interdecadal variations in average days of consecutive severe weathers
During 1959-2014, annual average number of consecutive hot weathers increased at a rate of 0.1 day per decade in China and the trend was significant (Figure 2a). Annual consecutive hot days decreased slightly during 1959-1985 and then increased rapidly. The number of consecutive hot weathers was 2.1, 2.0, 1.8 and 2.0 days per year during 1959-1970, the 1970s (1971-1980), the 1980s (1981-1990) and the 1990s (1991-2000) respectively, but during 2001-2014, it increased to 2.4 days per year in China (Table 1). Annual average number of consecutive cold weathers decreased at a rate of 1.4 days per decade during 1959-2014, and the trend was also significant in China (Figure 2b). Annual consecutive cold days decreased continuously during 1959-2006 and then increased a little in recent years. The number of consecutive cold weathers was 39.6 and 39.0 days per year during 1959-1970 and the 1970s respectively, and during 2001-2014, it decreased to 33.4 days per year (Table 1).
Table 1 Annual consecutive days of severe weathers in China during five periods
Severe weathers Periods of time
1959-1970 1971-1980 1981-1990 1991-2000 2001-2014
Hot days 2.08 1.95 1.77 2.01 2.42
Cold days 39.62 38.99 37.69 35.58 33.43
Rainstorm days 0.21 0.20 0.19 0.22 0.22
Snowfall days 4.95 5.09 4.78 4.26 3.90
Thunderstorm days 5.38 5.06 4.59 4.38 3.72
Foggy days 1.82 1.98 1.89 1.74 1.54
The trend of annual average number of consecutive rainstorm weathers was not significant in China during 1959-2014 (Figure 2c). Consecutive rainstorm days were more in the 1990s and during 2001-2014, both with an average of 0.22 day per year, and they were less in the 1980s, with an average of 0.19 day per year (Table 1). Annual average number of consecutive snowfall weathers decreased significantly at a rate of 0.3 day per decade in China (Figure 2d). Over the past 56 years, annual consecutive snowfall days increased slightly at first and then decreased continuously. In the 1970s, the number of consecutive snowfall weathers was more, with an average of 5.1 days per year, and during 2001-2014, it was less, with an average of 3.9 days per year (Table 1).
Figure 2 Annual consecutive days of severe weathers in China during 1959-2014 (The blue lines are annual value and the red lines are linear trend)
Annual average number of consecutive thunderstorm weathers decreased at a rate of 0.4 day per decade in China, and the trend was also significant during 1959-2013 (Figure 2e). Annual consecutive thunderstorm days decreased continuously in the past 55 years. During 1959-1970, the number of consecutive thunderstorm weathers was more, with an annual average of 5.4 days, and during 2001-2013, it was less, with an annual average of 3.7 days (Table 1). Annual average number of consecutive foggy weathers decreased significantly at a rate of 0.4 day per decade in China (Figure 2f). Over the past 56 years, annual consecutive foggy days decreased at first and then increased and later decreased continuously. In the 1980s, the number of consecutive foggy weathers was more, and during 2001-2014, it was less, with an annual average of 5.8 days (Table 1).
3.1.2 Interannual variations in the maximum days of consecutive severe weathers
Annual maximum number of consecutive hot weathers increased at a rate of 2.1 days per decade but the trend was not significant in China during 1959-2014 (Figure 3a). The maximum number of consecutive hot days decreased slightly during 1959-1990, and then it increased rapidly. Consecutive hot weathers were the most at Turpan station of Xinjiang in 2008, which were 101 days. Annual maximum number of consecutive cold weathers decreased at a rate of 2.2 days per decade and the trend was significant in China (Figure 3b). The maximum number of consecutive cold days decreased continuously before 2007, and then it increased. Consecutive cold weathers were the most at Wudaoliang station of Qinghai in 1975, which were 138 days.
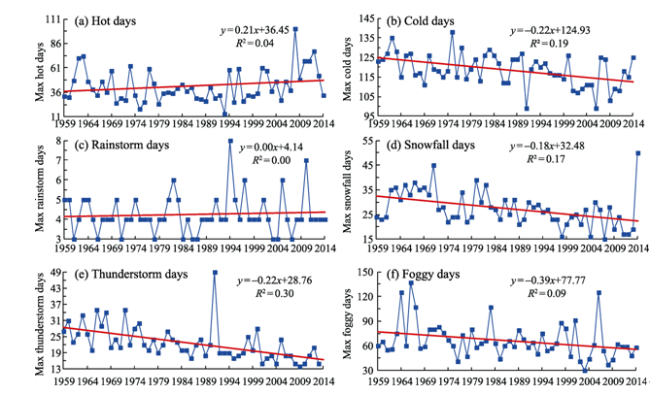
Figure 3 The maximum number of consecutive days for severe weathers in China during 1959-2014 (The blue lines are annual value and the red lines are linear trend)
In the past 56 years, the trend of annual maximum number of consecutive rainstorm weathers was not significant in China (Figure 3c). Consecutive rainstorm weathers were the most at Dongxing station of Guangxi in 1994, which were 8 days. Annual maximum number of consecutive snowfall weathers decreased at a rate of 1.8 days per decade and the trend was significant in China (Figure 3d). Consecutive snowfall weathers were the most at Alashankou (Alataw Pass) station of Xinjiang in 2014, which were 50 days.
Annual maximum number of consecutive thunderstorm weathers decreased significantly at a rate of 2.2 days per decade in China (Figure 3e). The maximum number of consecutive thunderstorm days decreased continuously over the past 55 years. Consecutive thunderstorm weathers were the most at Xainza station of Tibet in 1991, which were 49 days. Annual maximum number of consecutive foggy weathers decreased at a rate of 3.9 days per decade and the trend was also significant in China (Figure 3f). Consecutive foggy weathers were the most at Mount Emei station of Sichuan in 1966, which were 137 days.

3.2 Spatial characteristics in the consecutive days of severe weathers in China

3.2.1 Spatial distribution in average annual days of consecutive severe weathers
During 1959-2014, average annual days of consecutive hot weathers were more in northwestern and southeastern China, but less in northeastern and southwestern China (Figure 4a). In some areas of eastern Xinjiang, central and southern Anhui, most parts of Zhejiang and Hunan, northern and western Fujian, northern Guangdong, northeastern Guangxi, southeastern Hubei, Jiangxi and Chongqing, the number of consecutive hot weathers was mainly over 6 days per year on average. In northeastern China, eastern and central Inner Mongolia, most parts of Hebei, Shanxi, Shaanxi and Tibet, Ningxia, Gansu, Qinghai, Yunnan, western Sichuan and Guizhou, the number of consecutive hot weathers was less than 3 days per year. At Turpan station of Xinjiang, the number of consecutive hot weathers was the greatest, with an annual average of 41 days, and at 103 stations mainly distributed in Tibet, Qinghai, western Sichuan, Yunnan, eastern Jilin and some high mountain stations, there were no consecutive hot weathers during 1959-2014.
Figure 4 Spatial distribution of annual consecutive days of severe weathers in China during 1959-2014
Average annual days of consecutive cold weathers were more in northeastern China, Inner Mongolia and western China, but less in southern China over the past 56 years, with obvious differences between northern China and southern China (Figure 4b). In Heilongjiang, Jilin, Inner Mongolia, Ningxia, Xinjiang, Qinghai, the northern parts of Hebei, Shanxi and Shaanxi, most parts of Liaoning, Gansu and Tibet, and northwestern Sichuan, the number of consecutive cold weathers was over 30 days per year on average, especially in Heilongjiang, northern Jilin, eastern Inner Mongolia, most parts of Qinghai, northeastern Xinjiang and some parts of central and western Tibet, it was over 55 days per year. In Fujian, Guangdong, Jiangxi, Hunan, Guizhou, Chongqing, Hubei, Hainan, Guangxi, Yunnan, eastern and southern Sichuan, Shanghai, and the southern parts of Jiangsu and Anhui, the number of consecutive cold weathers was less than 5 days per year. At Wudaoliang station of Qinghai, the number of consecutive cold weathers was the greatest, with an annual average of 115 days, and at 110 stations mainly distributed in Hainan, Guangdong, Guangxi, Yunnan, Chongqing, eastern Sichuan and southern Fujian, there were no consecutive cold weathers during 1959-2014.
Average annual days of consecutive rainstorm weathers were more in southeastern China, but less in western China during 1959-2014 (Figure 4c). In eastern and southern Shandong, southern Henan, most parts of Hubei, eastern Sichuan, eastern and southern Guizhou, southern Yunnan, and regions south of the above-mentioned areas, the number of consecutive rainstorm weathers was over one day per year on average, especially in southern and western Zhejiang, southern Anhui, eastern Hubei, northern and eastern Jiangxi, Fujian, Guangdong, Hainan, central and eastern Guangxi, it was over 1.3 days per year. In Xinjiang, Qinghai, Tibet, the western parts of Sichuan, Gansu and Inner Mongolia, the number of consecutive rainstorm weathers was less than 0.2 day per year. At Dongxing station of Guangxi, the number of consecutive rainstorm weathers was the greatest, with an average of 2.7 days per year, and at 82 stations mainly distributed in Xinjiang, Qinghai, Tibet, and the western parts of Inner Mongolia, Gansu and Sichuan, there was no consecutive rainstorm weathers during 1959-2014.
Over the past 56 years, average annual number of consecutive snowfall weathers was more in northeastern and western China, but less in southern China (Figure 4d). In northwestern Xinjiang, central and southern Qinghai, central and eastern Tibet, some parts of Heilongjiang, Jilin, western Sichuan, eastern Inner Mongolia and southwestern Gansu, the number of consecutive snowfall weathers was over 6 days per year on average, especially in southern Qinghai, north-central Tibet and the Alashankou regions of northwestern Xinjiang, it was over 8 days per year. In central and southern Fujian, Guangdong, Guangxi, Hainan and most parts of Yunnan, the number of consecutive snowfall weathers was less than 2 days per year. At Tulogart station of Xinjiang, the number of consecutive snowfall weathers was the greatest, with an annual average of 17 days, and at 29 stations mainly distributed in Hainan, southern Guangdong and southern Guangxi, there was no consecutive snowfall weathers during 1959-2014.
Average annual number of consecutive thunderstorm weathers was more in southern and southwestern China, but less in northwestern China during 1959-2013 (Figure 4e). In most parts of Zhejiang, southern Anhui, southeastern and southwestern Hubei, Hunan, Guizhou, western Sichuan, southern Qinghai, central and eastern Tibet, Yunnan, Guangxi, Guangdong, Hainan, Jiangxi, Fujian and some small parts of western Xinjiang, Gansu, Shanxi and Hebei, the number of consecutive thunderstorm weathers was over 5 days per year on average, especially in central and western Fujian, southern Jiangxi, Guangdong, southern and central Guangxi, Hainan, southern and central Yunnan, central Tibet and some parts of southwestern Sichuan, it was over 7 days per year. In western Inner Mongolia, most parts of Gansu and Xinjiang, Ningxia, northwestern Qinghai, eastern Heilongjiang and some parts of Shanxi, Henan, Liaoning and Shandong, the number of consecutive thunderstorm weathers was less than 4 days per year. At Dongxing station of Guangxi, the number of consecutive thunderstorm weathers was the greatest, with an annual average of 14 days.
During 1959-2014, average annual number of consecutive foggy weathers was more in some mountain stations, but less in most areas of western China and Inner Mongolia (Figure 4f). In some high mountain stations, such as Mount Tai (1533.7 m above sea level), Huang (1840.4 m), Jvxian (1653.5 m) and Emei (3047.4 m) stations, the number of consecutive foggy weathers was over 20 days per year on average. In eastern China and central China, including southern Hebei, eastern and southern Shanxi, central and southern Shaanxi, the eastern parts of Gansu and Sichuan, and the regions south of the above-mentioned areas, the number of consecutive foggy weathers was over 2 days per year. In most parts of Heilongjiang, Liaoning and Yunnan, eastern Jilin, northeastern Inner Mongolia, northwestern Xinjiang, the number of consecutive foggy weathers was also over 2 days per year. In Tibet, Qinghai, western Sichuan, southern and eastern Xinjiang, Ningxia, most parts of Gansu and Inner Mongolia, the number of consecutive foggy weathers was less than one day per year. At Mount Jvxian station of Fujian, the number of consecutive foggy weathers was the greatest, with an annual average of 56 days.
3.2.2 Spatial trend in annual days of consecutive severe weathers
During 1959-2014, consecutive hot weathers varied mainly at rates of -0.4 to 0.5 day per decade (Figure 5a), but the trend was not significant in most parts of China. In some parts of eastern Xinjiang and western and north-central Inner Mongolia, and some southeastern coastal areas, including southern Jiangsu, Shanghai, northern and eastern Zhejiang, southwestern and eastern Fujian, Guangdong, southeastern Guangxi, eastern Hainan, northern Chongqing and some parts of eastern Sichuan, the number of consecutive hot weathers increased significantly at a rate of over 0.2 day per decade. In central and western Shandong, Henan, most parts of Hubei and Hunan, central and northern Jiangxi, northwestern Fujian, western Zhejiang, Anhui, northern Jiangsu, and some scattered areas of Xinjiang, Yunnan, Chongqing and Sichuan, the number of consecutive hot weathers decreased mainly at a rate of 0-0.4 day per decade, though the trend was not significant.
Except for Hainan, Leizhou Peninsula of Guangdong, and several scattered stations in Heilongjiang and Tibet, the number of consecutive cold weathers decreased in the whole China during 1959-2014, and the trend was significant in west-central Inner Mongolia, most parts of Xinjiang, Qinghai, Tibet and Gansu, western Sichuan, western Shaanxi, Hebei, Shandong, Jiangsu, Anhui, Zhejiang, eastern and southern Henan and eastern Hubei (Figure 5b). There were obvious differences in the decreasing trends of consecutive cold weathers between northern China and southern China. In regions north of Jiangsu, central Anhui, Henan, southern Shaanxi and those regions west of central Sichuan and Yunnan, the number of consecutive cold weathers decreased at rates of 1.0-3.0 days per decade in most areas, but in regions south of the above-mentioned areas, the number of consecutive cold weathers decreased uniformly at a rate of 0-1.0 day per decade.
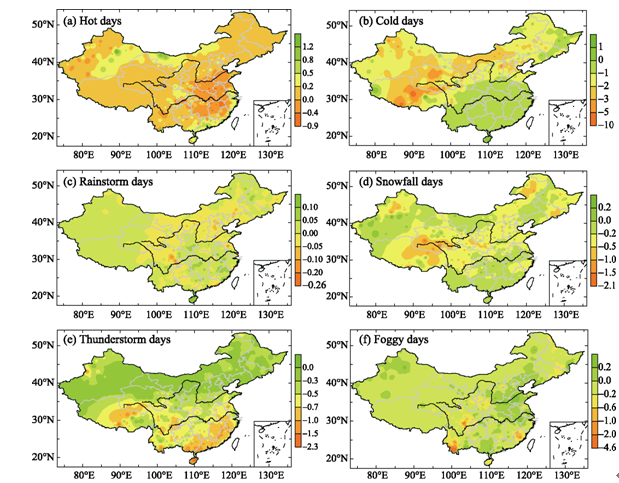
Figure 5 Spatial trend of annual consecutive days of severe weathers in China during 1959-2014
The spatial trend of consecutive rainstorm weathers was less in China as a whole, varied from -0.05 to 0.05 day per decade in most areas, and the trend was not significant except for several scattered stations (Figure 5c). In western, southeastern and northeastern China, including most parts of Xinjiang, Tibet, Zhejiang, Fujian, Anhui and Jiangxi, western Gansu, western Qinghai, western and southeastern Yunnan, southwestern and eastern Sichuan, Chongqing, Hunan, southern Jiangsu, southern and western Hubei, southern Shaanxi, central and eastern Henan, western and northern Heilongjiang, northeastern Inner Mongolia, and some scattered areas of other provinces, the number of consecutive rainstorm weathers increased at a rate of 0-0.05 day per decade. In northern China and some areas of northwestern China and southwestern China, the number of consecutive rainstorm weathers decreased at a rate of 0-0.05 day per decade in the past 56 years.
Except for some stations in central and southwestern Xinjiang, southern Anhui, northern Jiangxi, Hunan and Guizhou, the number of consecutive snowfall days decreased in whole China during 1959-2014 (Figure 5d). In some parts of eastern Inner Mongolia, eastern Jilin, central Shaanxi, southeastern Gansu, southern Qinghai, north-eastern Tibet and western Xinjiang, the number of consecutive snowfall weathers decreased significantly at a rate of over 0.5 day per decade. In other regions, the number of consecutive snowfall weathers decreased at a rate of 0-0.5 day per decade, without obvious geographic distribution differences, and the trend was also not significant.
Consecutive thunderstorm weathers showed a decreasing trend in almost entire China during 1959-2013 (Figure 5e), and the trend was all significant except for eastern and southern Xinjiang, northern Qinghai, northwestern Gansu, eastern and western Tibet, western Inner Mongolia, northern Shaanxi, central and northern Shanxi, most parts of Hebei and Liaoning, and some scattered areas of Jilin, Heilongjiang and eastern Inner Mongolia, where the decreasing trend was less than 0.3 day per decade. The decreasing trend of consecutive thunderstorm days was more in southern China than in northern China. In regions south of Shandong, Henan, central Shaanxi, Gansu, central Qinghai and western Tibet, the number of consecutive thunderstorm weathers decreased mainly at a rate of 0.5-1.0 day per decade, but in northeastern, northern and northwestern China, it decreased mainly at a rate of 0-0.5 day per decade.
The spatial change of consecutive foggy weathers ranged from -0.2 to 0.2 day per decade, and the trend was not significant in most areas of China during 1959-2014 (Figure 5f). In western and southern Liaoning, most parts of Hebei, Shandong and Henan, Tianjin, Anhui, south-central Jiangsu, northwestern Zhejiang, northeastern Hubei, southern Shanxi, central and southern Guangxi, some parts of western Xinjiang and eastern Inner Mongolia, and some small parts of other provinces, the number of consecutive foggy weathers increased mainly at a rate of 0-0.4 day per decade, but the trend was not significant in most areas. In other regions, the number of consecutive foggy weathers decreased mainly at a rate of 0-0.6 day per decade, and the trend was also not significant.

4 Discussion

Severe weathers are weather conditions that are hazardous to human life and property. There is great interest to evaluate changes in severe weathers due to their serious and adverse effects on natural ecosystems, social economy and human life (Easterling et al., 2000; Wang et al., 2012; Tang et al., 2013; Compeán, 2013; Saundersa et al., 2014). In recent years, the frequent appearance of severe weathers, such as high temperature and heat waves, rainstorm, snowfall and fog have been reported all over the world (Zhao et al., 2013; Chen et al., 2013; Zhang et al., 2015), and some of them have caused enormous damage to agricultural production and social infrastructure, brought about serious disruption to human activities, even personal injury and loss of life (Marengo et al., 2010; Barriopedro et al., 2011; Sun et al., 2014). Insurance statistics revealed that there were 980 documented loss events in 2014, 92% of which were weather-related, including floods, storms, heat waves, droughts, cold waves and wildfires (Munich Re, 2015). Understanding and predicting the variations in severe weathers is thus a major social issue, including, for example, government policy-making, urban infrastructure planning, resources and environment management, and insurance types and premiums.
The types of severe weathers depends on latitude, longitude, terrain and atmospheric conditions (WMO, 2004), and the mortalities and economic losses from severe weathers are higher in developing countries as an expression of the proportion to gross domestic product (GDP) (IPCC, 2012). During 1970-2008, more than 95% of deaths from natural disasters happened in developing countries (IPCC, 2012). China, strongly influenced by the East Asian monsoon, is particularly vulnerable to frequent severe weathers and meteorological disasters, like droughts, floods, storms and heat waves. It is estimated that the economic loss caused by meteorological disasters accounts for as much as 3% to 6% of GDP each year since 1990 (Jiang et al., 2012). The impacts of severe weathers are not only related to the frequencies and extreme values, but also associated with the continuous days. Three or more consecutive days of severe weathers tend to cause more serious consequences than alone. During July and August, 2013, continuous hot weathers hit eastern China, and Shanghai suffered from sustained high temperature. There were 10 consecutive days with Tmax exceeding 38°C and 4 consecutive days with Tmax over 40°C. Meanwhile, urban electricity peak and water supply had created new historical records, 29.4 million kw and 6.796 million m3 respectively, and hot weathers also caused a few emergent public health incidents, such as heat stroke, diarrhea and so on (China Meteorological Administration, 2015).
However, the research into consecutive days of severe weathers has been more limited. Zheng et al. (2012) examined the trends of extreme weather events in Beijing and results showed that since the 1990s, continuous high temperature days had an increasing tendency. Wang et al. (2013a) analyzed the variation characteristics of low-temperature weathers in winter and the results indicated that continuous low-temperature days showed slightly decreasing tendency on decadal scale in Henan Province of China. Huang et al. (2012) studied the climate change of lasting fog for 12 hours and 3 days in region around the Three Gorges Reservoir and found that annual mean foggy weathers of lasting for 3 days significantly reduced after impoundment. Ren et al. (2015) researched the variations of precipitation extremes in South China and results showed consecutive wet days decreased at -0.05 day per year from 1961 to 2011.
In estimating the impacts of climate change, a primary concern is the potential changes of severe weathers that could accompany global warming. It has been widely recognized that climate change may increase the likelihood of severe weathers such as heat waves, heavy rainfall, and severe storms over most global land areas (Bender et al., 2010; Kharin et al., 2013; Sillmann et al., 2013; Yang et al., 2014). Research into other severe weathers such as thunderstorm and fog in relationship to global climate change has been more limited. It is thus of great importance and urgency to launch a circumstantial estimate of how frequency and intensity of these severe weathers might change for some time to come due to the global climate change (Brooks, 2013; Akimoto and Kusaka, 2015). The impacts of severe weathers are also to a large extent dependent on the social or eco-environmental vulnerability, resiliency and adaptation and mitigation capacity (Singh and Patwardhan, 2012). Climate change may be most frequently perceived when it is associated with severe weathers, especially where vulnerable populations or high value properties are at risk (IPCC, 2013). Our social vulnerability is increasing as the society gets more and more complex and interconnected, and as personal, industrial and commercial development spreads to high risk areas (IPCC, 2012; Yin et al., 2013). Adaptation policies and efforts such as modifying local infrastructure to withstand floods and storms, adjusting urban patterns to account for heat waves, as well as establishing emergency planning in our communities and homes, would achieve great benefits from avoiding disaster and risk of severe weathers.
Although provide longer records, climatic datasets based on site observations discourage adequate sampling of the meteorological elements for global and regional applications, especially over desert or mountainous areas in Tibet, Xinjiang and Qinghai province. The interpolation results of severe weathers in western China may not be able to reflect the actual distribution and variation trend due to sparse meteorological stations. Compared with ground observations, space-borne observations provide more homogeneous data (Schulz et al., 2009), especially in the mountainous or oceanic regions. The TRMM lightning imaging sensor (LIS) and precipitation radar (PR) have been applied to resaearch precipitation and lightning in many parts of the world (Prakash et al., 2012; Zhu et al., 2013; Nastos et al., 2013). In addition, reanalysis data can be a potential source of useful data for assessing the long-term changes of some severe weathers in data sparse regions. You et al. (2013) showed that both NCEP/NCAR reanalysis data and ECMWF reanalysis data can reproduce the variations of temperature extremes acquired from surface observations, and can be used in the study of climate extremes to certain extent. Further using these space-based observation data and reanalysis data into the study, and adopting the scientific method to carry out the examination of data homogenization and the filling of missing data, is the direction of future efforts.

5 Conclusions

The distribution and trend of consecutive days for six types of severe weathers were analyzed and results indicate that annual consecutive hot weathers increased at a speed of 0.1 day per decade in China, but consecutive cold, snowfall, thunderstorm and foggy weathers decreased at rates of 1.4, 0.3, 0.4 and 0.4 day per decade respectively. The maximum number of consecutive cold, snowfall, thunderstorm and foggy weathers decreased at rates of 2.2, 1.8, 2.2 and 3.9 days per decade respectively. The trend of consecutive rainstorm weathers was not significant in China during 1959-2014.
Spatially, consecutive hot weathers were more in northwestern and southeastern China, but less in northeastern and southwestern China. Consecutive cold weathers and snowfall weathers were more in northeastern and western China, but less in southern China. Consecutive rainstorm weathers were more in southeastern China and less in western China. Consecutive thunderstorm weathers were more in southern and southwestern China, but less in northwestern China. Consecutive foggy weathers were more in some mountain stations and less in most areas of western China and Inner Mongolia.
Over the past 56 years, consecutive cold weathers decreased in most areas of western China, the central and northern parts of eastern China, west-central Inner Mongolia, Hebei, eastern and southern Henan and eastern Hubei. Consecutive snowfall weathers decreased in some parts of eastern Inner Mongolia, eastern Jilin, central Shaanxi, southeastern Gansu, southern Qinghai, north-eastern Tibet and western Xinjiang. Consecutive thunderstorm weathers decreased in most areas of China. The trend of consecutive hot weathers and foggy weathers was not significant in most areas of China, and that of consecutive rainstorm weathers was not significant in almost the entire China.

The authors have declared that no competing interests exist.

1
Akimoto Y, Kusaka H, 2015. A climatological study of fog in Japan based on event data.Atmospheric Research, 151: 200-211.A climatological study is carried out to understand the characteristics of fog in Japan. This study uniquely focuses on fog density and fog type using atmospheric visibility data from surface observations. The main results are summarized below, within the following three contexts: 1) the characteristics of fog and dense fog, 2) fog type, and 3) long-term change in the number of foggy days.

DOI

2
Barriopedro D, Fischer E M, Luterbacher J.et al., 2011. The hot summer of 2010: Redrawing the temperature record map of Europe.Science, 332: 220-224.

PMID

3
Bender M A, Knutson T R, Tuleya R E.et al., 2010. Modeled impact of anthropogenic warming on the frequency of intense Atlantic hurricane.Science, 327(5964): 454-458.Several recent models suggest that the frequency of Atlantic tropical cyclones could decrease as the climate warms. However, these models are unable to reproduce storms of category 3 or higher intensity. We explored the influence of future global warming on Atlantic hurricanes with a downscaling strategy by using an operational hurricane-prediction model that produces a realistic distribution of intense hurricane activity for present-day conditions. The model projects nearly a doubling of the frequency of category 4 and 5 storms by the end of the 21st century, despite a decrease in the overall frequency of tropical cyclones, when the downscaling is based on the ensemble mean of 18 global climate-change projections. The largest increase is projected to occur in the Western Atlantic, north of 20掳N.

DOI PMID

4
Brooks H E, 2013. Severe thunderstorms and climate change.Atmospheric Research, 123: 129-138.As the planet warms, it is important to consider possible impacts of climate change on severe thunderstorms and tornadoes. To further that discussion, the current distribution of severe thunderstorms as a function of large-scale environmental conditions is presented. Severe thunderstorms are much more likely to form in environments with large values of convective available potential energy (CAPE) and deep-tropospheric wind shear. Tornadoes and large hail are preferred in high-shear environments and non-tomadic wind events in low shear. Further, the intensity of tornadoes and hail, given that they occur, tends to be almost entirely a function of the shear and only weakly depends on the thermodynamics.<br/>Climate model simulations suggest that CAPE will increase in the future and the wind shear will decrease. Detailed analysis has suggested that the CAPE change will lead to more frequent environments favorable for severe thunderstorms, but the strong dependence on shear for tornadoes, particularly the strongest ones, and hail means that the interpretation of how individual hazards will change is open to question. The recent development of techniques to use higher-resolution models to estimate the occurrence of storms of various kinds is discussed. Given the large interannual variability in environments and occurrence of events, caution is urged in interpreting the observational record as evidence of climate change. Published by Elsevier B.V.

5
Chen Shangfeng, Chen Wen, Wei Ke, 2013. Recent trends in winter temperature extremes in eastern China and their relationship with the Arctic Oscillation and ENSO.Advances in Atmospheric Sciences, 30(6): 1712-1724.<p>Interannual variations in the number of winter extreme warm and cold days over eastern China (EC) and their relationship with the Arctic Oscillation (AO) and El Ni&ntilde;o-Southern Oscillation (ENSO) were investigated using an updated temperature dataset comprising 542 Chinese stations during the period 1961-2011. Results showed that the number of winter extreme warm (cold) days across EC experienced a significant increase (decrease) around the mid-1980s, which could be attributed to interdecadal variation of the East Asian Winter Monsoon (EAWM).&nbsp;</br> Probability distribution functions (PDFs) of winter temperature extremes in different phases of the AO and ENSO were estimated based on Generalized Extreme Value Distribution theory. Correlation analysis and the PDF technique consistently demonstrated that interannual variation of winter extreme cold days in the northern part of EC (NEC) is closely linked to the AO, while it is most strongly related to the ENSO in the southern part (SEC). However, the number of winter extreme warm days across EC has little correlation with both AO and ENSO. Furthermore, results indicated that, whether before or after the mid-1980s shift, a significant connection existed between winter extreme cold days in NEC and the AO. However, a significant connection between winter extreme cold days in SEC and the ENSO was only found after the mid-1980s shift. These results highlight the different roles of the AO and ENSO in influencing winter temperature extremes in different parts of EC and in different periods, thus providing important clues for improving short-term climate prediction for winter temperature extremes.</p>

DOI

6
China Meteorological Administration. (CMA), 2003. Standard of the Surface Observation about Meteorology. Beijing: China Meteorological Press, 1-151. (in Chinese)

7
China Meteorological Administration. (CMA), 2015. China Meteorological Disasters Yearbook (2014). Beijing: China Meteorological Press, 1-238. (in Chinese)

8
Compeán R G, 2013. The death effect of severe climate variability.Procedia Economics and Finance, 5: 182-191.Using data for all 2,454 municipalities of Mexico for the period 1980-2010, this paper analyzes the relationship between exposure to extreme temperatures and mortality rates. I find that severe heat increases mortality, while the health effect of severe cold is generally trivial. I show that exchanging one day with a temperature of 16-18°C for one day with temperatures higher than 30°C increases the crude mortality rate by 0.15 percentage points, a result robust to several model specifications. It is also found that the extreme heat effect on death is significantly more acute in rural regions, leading to increases of up to 0.2 percentage points vis-à-vis a 0.07-point increase in urban areas.

DOI

9
de Lima M I P, Santo F E, Ramos A M.et al., 2013. Recent changes in daily precipitation and surface air temperature extremes in mainland Portugal, in the period 1941-2007.Atmospheric Research, 127: 195-209.Changes in the climatology of precipitation and surface air temperature are being investigated worldwide, searching for changes in variability, the mean and extreme events (maximum and minimum). By exploring recent adjustments in the climate of mainland Portugal, particularly in the intensity, frequency and duration of extreme events, this study investigates trends in selected specific indices that are calculated from daily precipitation data from 57 and surface air temperature data from 23 measuring stations scattered across the territory. Special attention is paid to regional differences and variations in seasonality. The data cover the periods 1941-2007 for precipitation, and 1941-2006 for temperature. They are explored at the annual and seasonal scales and for different sub-periods.<br/>Results show that trends in annual precipitation indices are generally weak and, overall, not statistically significant at the 5% level. Nevertheless, a decreasing trend is revealed by regional indices of total wet-day precipitation and extreme precipitation (above the 99th percentile). Seasonal precipitation exhibits significant decreasing trends in spring precipitation, while extreme heavy precipitation events, in terms of both magnitude and frequency, have become more pronounced in autumn. Results for winter and summer suggest that the extremes have not suffered any significant aggravation.<br/>Trends for air temperature are statistically more significant and marked than for precipitation and indicate general warming across the territory. This warming trend is revealed very consistently by the time series of individual stations and regional mean temperature, and is also consistent with the findings reported in other studies for Portugal and at the European scale. (C) 2012 Elsevier B.V. All rights reserved.

DOI

10
de Vyver H V, 2012. Evolution of extreme temperatures in Belgium since the 1950s.Theoretical and Applied Climatology, 107: 113-129.The objective of the present study is to apply a wide range of efficient trend estimation methods for understanding how temperature extremes are locally changing. Temporal patterns of changes in extreme daily maximum or minimum temperature at homogeneous climate stations located in Belgium and their associations with changes in climate means are examined for the period 1952/1953 until present. A considerable amount of work is devoted to the formulation of extreme value models in the presence of non-stationarity. The covariate process is considered to be linear in time or/and in the North Atlantic Oscillation index as well. Additional insights on historical changes in frequency and amplitude of temperature extremes are obtained with the non-parametric quantile-perturbation approach.

DOI

11
Easterling D R, Evans J L, Groisman P Y.et al., 2000. Observed variability and trends in extreme climate events: A brief review.Bulletin of the American Meteorological Society, 81(3): 417-425.

12
Fu Guobin, Yu Jingjie, Yu Xiubo.et al., 2013. Temporal variation of extreme rainfall events in China, 1961-2009.Journal of Hydrology, 487: 48-59.The spatial and temporal variability of the frequency of extreme precipitation events in China for 1961鈥2009 was examined using the high quality rainfall dataset provided by the China Meteorology Administration (CMA) for 599 stations. Extreme events were defined by duration and recurrence interval, the event durations chosen were 1, 5, 10 and 30days and the event thresholds were those associated with recurrence intervals of 1, 5 and 10years. The results indicated that temporal variations of extreme precipitation index (EPI) showed interannual and interdecadal variability. Time series of anomalies of the nine regional EPI indices indicated that Northeast China, North China and the Yellow River basin had experienced a decreasing trend of extreme rainfall events during the last 50years, while other six regions, namely the Yangtze River basin, Southeast Coast, South China, the Inner Mongolia, Northwest China and Tibetan Plateau, had experienced an increasing trend of extreme rainfall events. Seasonal results indicated that 95.6% of 1-day, 1-yr recurrence interval extreme rainfall events occurred from April to September in China. The possible attributions of trend and variability of extreme rainfall events at China include, but are not limited to, El Ni帽o 鈥 Southern Oscillation (ENSO), the magnitude of East Asian Monsoon, wind circulations, as well as global warming. Obviously these factors are not independent. For example, it has long been recognized that ENSO can exert an important impact on the East Asian monsoon.

DOI

13
Huang Zhiyong, Niu Ben, Ye Limei.et al., 2012. An analysis of climatic characteristics of extreme fog in the region around the Three Gorges Reservoir.Resources and Environment in the Yangtze Basin, 21(5): 646-652. (in Chinese)<p>In order to further understanding the characteristics of fog in the region around the Three Gorges Reservoir,this paper studied the climate changes of extreme fog which last 12 hours and 3 days,discussed the possible reasons of the fog changing by using linear trend estimates and moletwavelet analysis.The results show that,the annual mean fog days in the region around the Three Gorges Reservoir shows a weak downward trend and there are decadal oscillations of 8,18 and 32 years.Extreme fog lasting 12 hours and 3 days shows a significant increasing trend,and there are decadal oscillations of 10,17,32 years and decadal oscillations of 12,32 years,respectively. The annual mean fog days&nbsp; in west section of the Three Gorges Reservoir significantly reduced,but increased in&nbsp; east section after impoundment.The annual mean fog days of extreme fog lasting 12 hours changes little after impoundment,but the annual mean fog days of extreme fog lasting 3 days significantly reduced after impoundment.The reduction of foggy days in Three Gorges area is affected by the results of global warming and urbanization,and there is no evidence that the impoundment in three Gorges area have influence on the fog</p>

14
IPCC, 2012. Managing the risks of extreme events and disasters to advance climate change adaptation. A special report of working groups I and II of the Intergovernmental Panel on Climate Change. Cambridge and New York: Cambridge University Press, 1-582.

15
IPCC, 2013. Climate Change 2013: The Physical Science Basis. Contribution of Working Group I to the Fifth Assessment Report of the Intergovernmental Panel on Climate Change. Cambridge and New York: Cambridge University Press, 1-1535.

16
Jiang Zhihong, Song Jie, Li Laurent.et al., 2012. Extreme climate events in China: IPCC-AR4 model evaluation and projection.Climatic Change, 110(1): 385-401.Observations from 550 surface stations in China during 1961鈥2000 are used to evaluate the skill of seven global coupled climate models in simulating extreme temperature and precipitation indices. It is found that the models have certain abilities to simulate both the spatial distributions of extreme climate indices and their trends in the observed period. The models鈥 abilities are higher overall for extreme temperature indices than for extreme precipitation indices. The well-simulated temperature indices are frost days (Fd), heat wave duration index (HWDI) and annual extreme temperature range (ETR). The well-simulated precipitation indices are the fraction of annual precipitation total due to events exceeding the 95th percentile (R95T) and simple daily intensity index (SDII). In a general manner, the multi-model ensemble has the best skill. For the projections of the extreme temperature indices, trends over the twenty-first century and changes at the end of the twenty-first century go into the same direction. Both frost days and annual extreme temperature range show decreasing trends, while growing season length, heat wave duration and warm nights show increasing trends. The increases are especially manifested in the Tibetan Plateau and in Southwest China. For extreme precipitation indices, the end of the twenty-first century is expected to have more frequent and more intense extreme precipitation. This is particularly visible in the middle and lower reaches of the Yangtze River, in the Southeast coastal region, in the west part of Northwest China, and in the Tibetan Plateau. In the meanwhile, accompanying the decrease in the maximum number of consecutive dry days in Northeast and Northwest, drought situation will reduce in these regions.

DOI

17
Kharin V V, Zwiers F W, Zhang X.et al., 2013. Changes in temperature and precipitation extremes in the CMIP5 ensemble.Climatic Change, 119(2): 345-357.Twenty-year temperature and precipitation extremes and their projected future changes are evaluated in an ensemble of climate models participating in the Coupled Model Intercomparison Project Phase 5 (CMIP5), updating a similar study based on the CMIP3 ensemble. The projected changes are documented for three radiative forcing scenarios. The performance of the CMIP5 models in simulating 20-year temperature and precipitation extremes is comparable to that of the CMIP3 ensemble. The models simulate late 20th century warm extremes reasonably well, compared to estimates from reanalyses. The model discrepancies in simulating cold extremes are generally larger than those for warm extremes. Simulated late 20th century precipitation extremes are plausible in the extratropics but uncertainty in extreme precipitation in the tropics and subtropics remains very large, both in the models and the observationally-constrained datasets. Consistent with CMIP3 results, CMIP5 cold extremes generally warm faster than warm extremes, mainly in regions where snow and sea-ice retreat with global warming. There are tropical and subtropical regions where warming rates of warm extremes exceed those of cold extremes. Relative changes in the intensity of precipitation extremes generally exceed relative changes in annual mean precipitation. The corresponding waiting times for late 20th century extreme precipitation events are reduced almost everywhere, except for a few subtropical regions. The CMIP5 planetary sensitivity in extreme precipitation is about 6%/degrees C, with generally lower values over extratropical land.

DOI

18
Kruger A C, Sekele S S, 2013. Trends in extreme temperature indices in South Africa: 1962-2009.International Journal of Climatology, 33(3): 661-676.Trends in daily maximum and minimum extreme temperature indices were investigated for 28 weather stations in South Africa, not only for the common period of 19622009, but also for longer periods which the individual record lengths of the stations would allow. The utilized weather stations had limited gaps in their time series, did not undergo major moves, or had their exposure compromised during the study period, as to influence the homogeneity of their time series. The indices calculated were forthcoming from those developed by the WMO/CLIVAR Expert Team on Climate Change Detection and Indices (ETCCDI), but only those applicable to the South African climate were selected. The general result is that warm extremes increased and cold extremes decreased for all of the weather stations. The trends however vary on a regional basis, both in magnitude and statistical significance, broadly indicating that the western half, as well as parts of the northeast and east of South Africa, show relatively stronger increases in warm extremes and decreases in cold extremes than elsewhere in the country. These regions coincide to a large degree with the thermal regimes in South Africa which are susceptible to extreme temperatures. The annual absolute maximum and minimum temperatures do not reflect the general trends displayed by the other indices, showing that individual extreme events cannot always be associated with observed long-term climatic trends. The analyses of longer time series than the common period indicate that it is highly likely that warming accelerated since the mid-1960s in South Africa. Copyright (c) 2012 Royal Meteorological Society

DOI

19
Liu Xianfeng, Zhu Xiufang, Pan Yaozhong.et al., 2015. Spatiotemporal changes of cold surges in Inner Mongolia between 1960 and 2012.Journal of Geographical Sciences, 25(3): 259-273.<p>In this study, we analyzed the spatiotemporal variation of cold surges in Inner Mongolia between 1960 and 2012 and their possible driving factors using daily minimum temperature data from 121 meteorological stations in Inner Mongolia and the surrounding areas. These data were analyzed utilizing a piecewise regression model, a Sen+Mann- Kendall model, and a correlation analysis. Results demonstrated that (1) the frequency of single-station cold surges decreased in Inner Mongolia during the study period, with a linear tendency of -0.5 times/10a (-2.4 to 1.2 times/10a). Prior to 1991, a significant decreasing trend of -1.1 times/10a (-3.3 to 2.5 times/10a) was detected, while an increasing trend of 0.45 times/10a (-4.4 to 4.2 times/10a) was found after 1991. On a seasonal scale, the trend in spring cold surges was consistent with annual values, and the most obvious change in cold surges occurred during spring. Monthly cold surge frequency displayed a bimodal structure, and November witnessed the highest incidence of cold surge. (2) Spatially, the high incidence of cold surge is mainly observed in the northern and central parts of Inner Mongolia, with a higher occurrence observed in the northern than in the central part. Inter-decadal characteristic also revealed that high frequency and low frequency regions presented decreasing and increasing trends, respectively, between 1960 and 1990. High frequency regions expanded after the 1990s, and regions exhibiting high cold surge frequency were mainly distributed in Tulihe, Xiao'ergou, and Xi Ujimqin Banner. (3) On an annual scale, the cold surge was dominated by AO, NAO, CA, APVII, and CQ. However, seasonal differences in the driving forces of cold surges were detected. Winter cold surges were significantly correlated with AO, NAO, SHI, CA, TPI, APVII, CW, and IZ, indicating they were caused by multiple factors. Autumn cold surges were mainly affected by CA and IM, while spring cold surges were significantly correlated with CA and APVII.</p>

DOI

20
Marengo J, Rusticucci M, Penalba O.et al., 2010. An intercomparison of observed and simulated extreme rainfall and temperature events during the last half of the twentieth century (Part 2): Historical trends.Climatic Change, 98: 509-529.<a name="Abs1"></a>We analyze historical simulations of variability in temperature and rainfall extremes in the twentieth century, as derived from various global models run informing the Fourth Assessment Report of the Intergovernmental Panel on Climate Change (IPCC-AR4). On the basis of three indices of climate extremes, we compare observed and modeled trends in time and space, including the direction and significance of the changes at the scale of South America south of 10° S. The climate extremes described warm nights, heavy rainfall amounts and dry spells. The reliability of the GCM simulations is suggested by similarity between observations and simulations in the case of warm nights and extreme rainfall in some regions. For any specific extreme temperature index, minor differences appear in the spatial distribution of the changes across models in some regions, while substantial differences appear in regions in the interior of tropical and subtropical South America. The differences are in the relative magnitude of the trends. Consensus and significance are less strong when regional patterns are considered, with the exception of the La Plata Basin, where observed and simulated trends in warm nights and extreme rainfall are evident.

21
Munich Re, 2015. Topics Geo Natural Catastrophes 2014: Analyses, Assessments and Positions. 1-67.

22
Nastos P T, Kapsomenakis J, Douvis K C, 2013. Analysis of precipitation extremes based on satellite and high-resolution gridded data set over Mediterranean basin.Atmospheric Research, 131: 46-59.The objective of this study is to compare and analyze satellite precipitation extremes of Tropical Rainfall Measuring Mission level 3 output (TRMM 3B42) over Mediterranean region against the respective high resolution gridded precipitation datasets (0.25 x 0.25) based on the E-OBS project, for the period 2000-2011.<br/>The Tropical Rainfall Measuring Mission (TRMM) is a joint U.S.-Japan satellite mission to monitor tropical and subtropical precipitation and to estimate its associated latent heating. The E-OBS data set (a European daily high-resolution gridded dataset of surface temperature and precipitation) was developed as part of the European Union Framework 6 ENSEMBLES project, with the aim being to use it for validation of Regional Climate Models (RCMs) and for climate change studies.<br/>The indices used in the analysis can be divided in three categories: percentile, absolute and duration indices. The percentile indices concern: very wet days (the number of days with daily precipitation amount above the 95th percentile from the examined period) and extremely wet days (the number of days with daily precipitation amount above the 99th percentile from the examined period). The absolute threshold indices concern: number of heavy precipitation days (number of days with daily precipitation amount above 10 mm), number of very heavy precipitation days (number of days with daily precipitation amount above 20 mm) and simple daily intensity index (daily precipitation amount on wet days in a period per number of wet days in the period). The duration indices concern consecutive dry days (the largest number of consecutive days with daily precipitation amount below 1 mm) and consecutive wet days (the largest number of consecutive days with daily precipitation amount above 1 mm).<br/>The spatial distribution of the differences between the two datasets along with the spatial distribution of the correlation coefficients are presented and analyzed. Results show considerable regional differences of precipitation indices over the Mediterranean Region. (C) 2013 Elsevier B.V. All rights reserved.

DOI

23
Niu Tao, Chen Longxun, Zhou Zijiang, 2004. The characteristics of climate change over the Tibetan Plateau in the last 40 years and the detection of climatic jumps.Advances in Atmospheric Sciences, 21(2): 193-203.<a name="Abs1"></a>Through analyzing the yearly average data obtained from 123 regular meteorological observatories located in the Tibetan Plateau (T-P), this article studies the characteristics of climate change in T-P in the last 40 years. From the distribution of the linear trend, it can be concluded that the southeastern part of T-P becomes warmer and wetter, with an obvious increase of rainfall. The same characteristics are found in the southwestern part of T-P, but the shift is smaller. In the middle of T-P, temperature and humidity obviously increase with the center of the increase in Bangoin-Amdo. The south of the Tarim Basin also exhibits the same tendency. The reason for this area being humid is that it gets less sunshine and milder wind. The northeastern part of T-P turns warmer and drier. Qaidam Basin and its western and southern areas are the center of this shift, in which the living environment is deteriorating. Analyzing the characteristics of the regional average time series, it can be found that in the mid-1970s, a significant sudden change occurred to annual rainfall, yearly average snow-accumulation days and surface pressure in the eastern part of T-P. In the mid-1980s, another evident climatic jump happened to yearly average temperature, total cloud amount, surface pressure, relative humidity, and sunshine duration in the same area. That is, in the mid 1980s, the plateau experienced a climatic jump that is featured by the increase of temperature, snow-accumulation days, relative humidity, surface pressure, and by the decrease of sunshine duration and total cloud amount. The sudden climatic change of temperature in T-P is later than that of the global-mean temperature. From this paper it can be seen that in the middle of the 1980s, a climatic jump from warm-dry to warm-wet occurred in T-P.

DOI

24
Prakash S, Mahesh C, Gairola R M.et al., 2012. Comparison of high-resolution TRMM-based precipitation products during tropical cyclones in the North Indian Ocean.Natural Hazards, 61: 689-701.Abstract<br/>In order to evaluate the performance of satellite-retrieved precipitation estimation during cyclonic events, qualitative and quantitative evaluation of surface rain rate from three different data products namely TMI-2A12, TMPA-3B42, and GSMaP are carried out with respect to PR-2A25 data product. For this purpose, four recent tropical cyclones in the North Indian Ocean (NIO) during 2009–2010 are considered. Some aspects of the associated environmental wind fields are also investigated for their relationship with the tropical rainfall intensity in the individual cases. The relatively small root-mean-square error (RMSE) of TMPA-3B42 product shows better performance than the other two precipitation products during low to moderate rainfall regimes. But, the negative bias associated with all the three precipitation products show underestimation of rain rates with respect to PR derived rain rates. Furthermore, the GSMaP precipitation product shows better compliance than the TMPA-3B42 product with PR rain rate under extreme (more than 10 mm h<sup class="a-plus-plus">−1</sup>) rain events. The lack of information regarding the associated uncertainties and reliability of these precipitation products suggest that substantial efforts are necessary to develop algorithms that can capture such extreme precipitation events more reliably.<br/>

DOI

25
Ren Zhengguo, Zhang Mingjun, Wang Shengjie.et al., 2015. Changes in daily extreme precipitation events in South China from 1961 to 2011.Journal of Geographical Sciences, 25(1): 58-68.<p>Based on the daily precipitation from a 0.5&deg;&times;0.5&deg; gridded dataset and meteorological stations during 1961-2011 released by National Meteorological Information Center, the reliability of this gridded precipitation dataset in South China was evaluated. Five precipitation indices recommended by the World Meteorological Organization (WMO) were selected to investigate the changes in precipitation extremes of South China. The results indicated that the bias between gridded data interpolated to given stations and the corresponding observed data is limited, and the proportion of the number of stations with bias between -10% and 0 is 50.64%. The correlation coefficients between gridded data and observed data are generally above 0.80 in most parts. The average of precipitation indices shows a significant spatial difference with drier northwest section and wetter southeast section. The trend magnitudes of the maximum 5-day precipitation (RX5day), very wet day precipitation (R95), very heavy precipitation days (R20mm) and simple daily intensity index (SDII) are 0.17 mm&middot;a<sup>-1</sup> 1.14 mm&middot;a<sup>-1</sup> 0.02 d&middot;a<sup>-1</sup> and 0.01 mm&middot;d<sup>-1</sup>&middot;a<sup>-1</sup> respectively, while consecutive wet days (CWD) decrease by -0.05 d&middot;a<sup>-1</sup> during 1961-2011. There is spatial disparity in trend magnitudes of precipitation indices, and approximate 60.85%, 75.32% and 75.74% of the grid boxes show increasing trends for RX5day, SDII and R95, respectively. There are high correlations between precipitation indices and total precipitation, which is statistically significant at the 0.01 level.</p>

DOI

26
Saunders M, Tobin B, Sweeney C.et al., 2014. Impacts of exceptional and extreme inter-annual climatic events on the net ecosystem carbon dioxide exchange of a Sitka spruce forest.Agricultural and Forest Meteorology, 184: 147-157.

27
Schulz J, Albert P, Behr H-D.et al., 2009. Operational climate monitoring from space: The EUMETSAT Satellite Application Facility on Climate Monitoring (CM-SAF).Atmospheric Chemistry and Physics, 9: 1687-1709.The Satellite Application Facility on Climate Monitoring (CM-SAF) aims at the provision of satellite-derived geophysical parameter data sets suitable for climate monitoring. CM-SAF provides climatologies for Essential Climate Variables (ECV), as required by the Global Climate Observing System implementation plan in support of the UNFCCC. Several cloud parameters, surface albedo, radiation fluxes at the top of the atmosphere and at the surface as well as atmospheric temperature and humidity products form a sound basis for climate monitoring of the atmosphere. The products are categorized in monitoring data sets obtained in near real time and data sets based on carefully intercalibrated radiances. The CM-SAF products are derived from several instruments on-board operational satellites in geostationary and polar orbit as the Meteosat and NOAA satellites, respectively. The existing data sets will be continued using data from the instruments on-board the new joint NOAA/EUMETSAT Meteorological Operational Polar satellite. The products have mostly been validated against several ground-based data sets both in situ and remotely sensed. The accomplished accuracy for products derived in near real time is sufficient to monitor variability on diurnal and seasonal scales. The demands on accuracy increase the longer the considered time scale is. Thus, interannual variability or trends can only be assessed if the sensor data are corrected for jumps created by instrument changes on successive satellites and more subtle effects like instrument and orbit drift and also changes to the spectral response function of an instrument. Thus, a central goal of the recently started Continuous Development and Operations Phase of the CM-SAF (2007鈥2012) is to further improve all CM-SAF data products to a quality level that allows for studies of interannual variability.

DOI

28
Shi Jun, Cui Linli, He Qianshan.et al., 2010. The changes and causes of fog and haze days in eastern China.Acta Geographica Sinica, 65(5): 533-542. (in Chinese)<p>Based on the fog, haze, air temperature and dew point temperature data of 449 weather stations, the land use data in 1980 and 2005 and remote sensing aerosol optical depth from MODIS data during 2000-2007 in eastern China, the change characteristics and causes of fog and haze days from 1961 to 2007 was studied with climatologically statistical diagnosis methods, remote sensing and geographic information system (GIS) technology. The results indicate that from 1961 to 2007, the number of fog days increased firstly and then decreased, but that of haze days increased gradually. The number of fog days was the most in the 1980s, but the least during 2001-2007. The number of haze days was the most during 2001-2007, but the least in the 1960s. In the past 47 years, the number of fog days increased in most northern parts of eastern China, including Shandong, the northern and western parts of Jiangsu and the northern part of Anhui, but decreased in most southern parts of eastern China, especially in Fujian province. The number of haze days increased in most parts of eastern China from 1961 to 2007. In most parts of eastern China, the number of fog days increased during the period 1961-1980, but decreased during 1981-2007, and the number of haze days increased during the two periods of 1961-1980 and 1981-2007. The change characteristics of fog and haze are consistent with other results of China. The increases of mean annual temperature, urban heat island effects and aerosol optical depth, and the decreases of air humidity and wind speed, which resulted mainly from the change of weather and climate conditions, regional urbanization and land use change, and the increase of air pollution disposal, are the main causes for the changes of fog and haze days.</p>

DOI

29
Sillmann J, Kharin V V, Zwiers F W.et al., 2013. Climate extremes indices in the CMIP5 multimodel ensemble (Part 2): Future climate projections. Journal of Geophysical Research: Atmospheres, 118: 2473-2493.

30
Singh A, Patwardhan A, 2012. Spatio-temporal distribution of extreme weather events in India.APCBEE Procedia, 1: 258-262.Alteration in characteristics of extreme weather events is projected in most part of the world, in changing climate due to increase in greenhouse gases and aerosols in the atmosphere. The changes in patterns in extreme weather events would lead to issues including energy, water and food securities. Therefore, it is important to study pattern in the events. In the study, we have selected ten key climate extreme events namely, flood, tropical cyclone, heat wave, cold wave also gale, squall, lightning, dust-storm, hailstorm and thunderstorm to study their recent past spatio-temporal pattern over India. Data on the occurrence have been acquired from India Meteorological Department and other relevant government agencies. Flood constitutes major share of the events. Cyclonic events with negligible share in occurrence have sizeable impact on socio-economic system. Regression analysis on the annual total number of occurrences of the combined events reveals a significant increasing trend. Except cyclone, all the events show increasing trend. Leading states by event category has also been computed and found that few states are relatively more prone to the repeated occurrence of particular events. Finally, we have concluded with the suggestions for the improvement in data collection and key recommendations for further study.

DOI

31
Sun Ying, Zhang Xuebin, Zwiers F W.et al., 2014. Rapid increase in the risk of extreme summer heat in eastern China.Nature Climate Change, 4: 1082-1085.The summer of 2013 was the hottest on record in Eastern China. Severe extended heatwaves affected the most populous and economically developed part of China and caused substantial economic and societal impacts. The estimated direct economic losses from the accompanying drought alone total 59 billion RMB (ref. ). Summer (June-August) mean temperature in the region has increased by 0.82 掳C since reliable observations were established in the 1950s, with the five hottest summers all occurring in the twenty-first century. It is challenging to attribute extreme events to causes. Nevertheless, quantifying the causes of such extreme summer heat and projecting its future likelihood is necessary to develop climate adaptation strategies. We estimate that anthropogenic influence has caused a more than 60-fold increase in the likelihood of the extreme warm 2013 summer since the early 1950s, and project that similarly hot summers will become even more frequent in the future, with fully 50% of summers being hotter than the 2013 summer in two decades even under the moderate RCP4.5 emissions scenario. Without adaptation to reduce vulnerability to the effects of extreme heat, this would imply a rapid increase in risks from extreme summer heat to Eastern China.

DOI

32
Tang Xiangling, Lv Xin, Xue Feng.et al., 2013. Progress and prospect of extreme climate events in arid Northwest China.International Journal of Geosciences, 4(1): 36-42.Extreme climate events have significant influences on ecological systems and social economic systems. The global climate is becoming warmer and warmer, so extreme climate events will probably increase in both frequency and intensity, and the Northwest arid region of China is situated in the middle latitudes, all of which combine to make this area be come the most sensitive region to global climate change. For this reason, based on home and broad literature of research in extreme climate events, this paper mainly discusses those scientific problems which are waiting for resolved and we should strength work that those need research in future from extreme climatic events concept, their change regular, the discussion of theory reasons, and review from mode and simulate, as well as sum up some research results related ex treme climatic change.

DOI

33
Wang Huijun, Sun Jianqi, Chen Huopo.et al., 2012. Extreme climate in China: Facts, simulation and projection.Meteorologische Zeitschrift, 21(3): 279-304.In this paper, studies on extreme climate in China including extreme temperature and precipitation, dust weather activity, tropical cyclone activity, intense snowfall and cold surge activity, floods, and droughts are reviewed based on the peer-reviewed publications in recent decades. The review is focused first on the climatological features, variability, and trends in the past half century and then on simulations and projections based on global and regional climate models. As the annual mean surface air temperature (SAT) increased throughout China, heat wave intensity and frequency overall increased in the past half century, with a large rate after the 1980s. The daily or yearly minimum SAT increased more significantly than the mean or maximum SAT. The long-term change in precipitation is predominantly characterized by the so-called southern flood and northern drought pattern in eastern China and by the overall increase over Northwest China. The interdecadal variation of monsoon, represented by the monsoon weakening in the end of 1970s, is largely responsible for this change in mean precipitation. Precipitation-related extreme events (e.g., heavy rainfall and intense snowfall) have become more frequent and intense generally over China in the recent years, with large spatial features. Dust weather activity, however, has become less frequent over northern China in the recent years, as result of weakened cold surge activity, reinforced precipitation, and improved vegetation condition. State-of-the-art climate models are capable of reproducing some features of the mean climate and extreme climate events. However, discrepancies among models in simulating and projecting the mean and extreme climate are also demonstrated by many recent studies. Regional models with higher resolutions often perform better than global models. To predict and project climate variations and extremes, many new approaches and schemes based on dynamical models, statistical methods, or their combinations have been developed, resulting in improved skills. With the improvements of climate model capability and resolution as well as our understanding of regional climate variability and extremes, these new approaches and techniques are expected to further improve the prediction and projection on regional climate variability and extremes over China in the future.

DOI

34
Wang Jijun, Pan Pan, Hu Caihong, 2013a. Spatial-temporal change characteristics of continuous low temperature weather during winter in Henan Province.Meteorological and Environmental Sciences, 36(4): 1-5. (in Chinese)Using the diurnal temperature observation data from 49 stations in winter during Decem-ber to February in 1957-2008,and the index of maximum continuous low temperature days and its strength,we analyze the spatial-temporal change characteristics with the method of linear trend and wave-let analysis. The main results are as follows. The mean of the continuous low temperature days is 15. 6 of Henan province during 1957-2008 and its interannual variability is evident,it's longest in 1984 with 34. 2 d and shortest in 1965 with 6. 5 d. The spatial distribution of continuous low temperature is heterogenei-ty: Lingbao and Gushi have the longest continuous low temperature with 56 and 48 days separately in 1977; Lingbao,Xuchang,Weishi,Xiangcheng,Huaiyang,Shenqiu and Yongcheng et al have the shor-test continuous low temperature with only 4 days separately in the years of 1965,1991,1995 and 2007. In decadal scale,low temperature days show little shorten tendency,and the period of 6-12 years is sig-nificant. The low temperature strength is also difference in spatial,and the larger values are in the east and southeast part and weaker values are in the west and southwest part. The interannual change of con-tinuous low temperature strength is obvious and has a decreasing trend. The low temperature strength has maximum value in the year 1964 and minimum value in the year 1995.

35
Wang Qiong, Zhang Mingjun, Wang Shengjie.et al., 2014. Changes in temperature extremes in the Yangtze River Basin, 1962-2011.Journal of Geographical Sciences, 24(1): 59-75.<p>Based on daily maximum and minimum temperature observed by the China Meteorological Administration at 115 meteorological stations in the Yangtze River Basin from 1962 to 2011, the methods of linear regression, principal component analysis and correlation analysis are employed to investigate the temporal variability and spatial distribution of temperature extremes. Sixteen indices of extreme temperature are selected. The results are as follows: (1) The occurrence of cold days, cold nights, ice days, frost days and cold spell duration indicator has significantly decreased by -0.84, -2.78, -0.48, -3.29 and -0.67 days per decade, respectively. While the occurrence of warm days, warm nights, summer days, tropical nights, warm spell duration indicator and growing season length shows statistically significant increasing trends at rates of 2.24, 2.86, 2.93, 1.80, 0.83 and 2.30 days per decade, respectively. The tendency rate of the coldest day, coldest night, warmest day, warmest night and diurnal temperature range is 0.33, 0.47, 0.16, 0.19 and -0.07℃ per decade, respectively. (2) The magnitudes of changes in cold indices (cold nights, coldest day and coldest night) are obviously greater than those of warm indices (warm nights, warmest day and warmest night). The change ranges of night indices (warm nights and cold nights) are larger than those of day indices (warm days and cold days), which indicates that the change of day and night temperature is asymmetrical. (3) Spatially, the regionally averaged values of cold indices in the upper reaches of the Yangtze River Basin are larger than those in the middle and lower reaches. However, the regionally averaged values of most warm indices (except warm spell duration indicator) and growing season length in the middle and lower reaches are larger than those in the upper reaches. (4) The extreme temperature indices are well correlated with each other except diurnal temperature range.</p>

DOI

36
Wang Shengjie, Zhang Mingjun, Wang Baolong.et al., 2013b. Recent changes in daily extremes of temperature and precipitation over the western Tibetan Plateau, 1973-2011.Quaternary International, 313/314: 110-117.

37
WMO, 2004. Workshop on Severe and Extreme Events Forecasting: Final Report. Toulouse, France, 26-29 October 2004: 1-25.

38
WMO, 2013. The Global Climate 2001-2010: A decade of climate extremes. WMO-No.1103. World Meteorological Organization, Geneva, Switzerland. 1-110.

39
Xia Jun, She Dunxian, Zhang Yongyong.et al., 2012. Spatio-temporal trend and statistical distribution of extreme precipitation events in Huaihe River Basin during 1960-2009.Journal of Geographical Sciences, 22(2): 195-208.Abstract<br/><p class="a-plus-plus">Based on the daily precipitation data of 27 meteorological stations from 1960 to 2009 in the Huaihe River Basin, spatio-temporal trend and statistical distribution of extreme precipitation events in this area are analyzed. Annual maximum series (AM) and peak over threshold series (POT) are selected to simulate the probability distribution of extreme precipitation. The results show that positive trend of annual maximum precipitation is detected at most of used stations, only a small number of stations are found to depict a negative trend during the past five decades, and none of the positive or negative trend is significant. The maximum precipitation event almost occurred in the flooding period during the 1960s and 1970s. By the L-moments method, the parameters of three extreme distributions, i.e., Generalized extreme value distribution (GEV), Generalized Pareto distribution (GP) and Gamma distribution are estimated. From the results of goodness of fit test and Kolmogorov-Smirnov (K-S) test, AM series can be better fitted by GEV model and POT series can be better fitted by GP model. By the comparison of the precipitation amounts under different return levels, it can be found that the values obtained from POT series are a little larger than the values from AM series, and they can better simulate the observed values in the Huaihe River Basin.</p><br/>

DOI

40
Yang Shili, Feng Jinming, Dong Wenjie.et al., 2014. Analyses of extreme climate events over China based on CMIP5 historical and future simulations.Advances in Atmospheric Sciences, 31: 1209-1220.Based on observations and 12 simulations from Coupled Model Intercomparison Project Phase 5 (CMIP5) models, climatic extremes and their changes over China in the past and under the future scenarios of three Representative Concentration Pathways (RCPs) are analyzed. In observations, frost days (FD) and low-temperature threshold days (TN10P) show a decreasing trend, and summer days (SU), high-temperature threshold days (TX90P), heavy precipitation days (R20), and the contribution of heavy precipitation days (P95T) show an increasing trend. Most models are able to simulate the main characteristics of most extreme indices. In particular, the mean FD and TX90P are reproduced the best, and the basic trends of FD, TN10P, SU and TX90P are represented. For the FD and SU indexes, most models show good ability in capturing the spatial differences between the mean state of the periods 1986-2005 and 1961-80; however, for other indices, the simulation abilities for spatial disparity are less satisfactory and need to be improved. Under the high emissions scenario of RCP8.5, the century-scale linear changes of the multi-model ensemble (MME) for FD, SU, TN10P, TX90P, R20 and P95T are -46.9, 46.0, -27.1, 175.4, and 2.9 days, and 9.9%, respectively; and the spatial change scope for each index is consistent with the emissions intensity. Due to the complexities of physical process parameterizations and the limitation of forcing data, great uncertainty still exists with respect to the simulation of climatic extremes.

DOI

41
Yin Zhan’e, Yin Jie, Zhang Xiaowei, 2013. Multi-scenario-based hazard analysis of high temperature extremes experienced in China during 1951-2010.Journal of Geographical Sciences, 23(3): 436-446.<p>China is physically and socio-economically susceptible to global warming-derived high temperature extremes because of its vast area and high urban population density. This article presents a scenario-based analysis method for high temperature extremes aimed at illustrating the latter&rsquo;s hazardous potential and exposure across China. Based on probability analysis, high temperature extreme scenarios with return periods of 5, 10, 20, and 50 years were designed, with a high temperature hazard index calculated by integrating two differentially-weighted extreme temperature indices (maximum temperature and high temperature days). To perform the exposure analysis, a land use map was employed to determine the spatial distribution of susceptible human activities under the different scenarios. The results indicate that there are two heat-prone regions and a sub-hotspot occupying a relatively small land area. However, the societal and economic consequences of such an environmental impact upon the North China Plain and middle/lower Yangtze River Basin would be substantial due to the concentration of human activities in these areas.</p>

DOI

42
You Qinglong, Fraedrich K, Min Jinzhong.et al., 2013. Can temperature extremes in China be calculated from reanalysis?Global and Planetary Change, 111: 268-279.Based on daily maximum, minimum and mean surface air temperature from National Centers for Environmental Prediction/National Center for Atmospheric Research Reanalysis (NCEP/NCAR) and European Centre for Medium-Range Weather Forecasts (ECMWF) reanalyses, the distributions of twenty temperature indices are examined in China during 1958-2011. ECMWF includes ERA-40 for the period 1958-2001 and ERA-Interim during 2002-2011. The consistency and discrepancy of extreme indices between reanalyses and observations (303 stations) are assessed. In most cases, temperature indices between NCEP/NCAR and ECMWF have good agreements. For both reanalysis, cold days/nights have decreased, while warm days/nights have increased since 1980. Temperatures of the coldest days/nights and warmest days/nights significantly increase over the entire China, and the diurnal temperature range demonstrates slight variations; the amounts of growing season length, and summer/tropical days have increased, consistent with the decrease in numbers of frost/ice days. Furthermore, the persistence of heat wave duration and warm spell days has increased and consecutive frost days have reduced. Meanwhile, consecutive frost days, cold wave duration and cold spell days from NCEP/NCAR have decreased and consecutive frost days have increased, while these indices from ECMWF turn to the opposite directions. Compared with observations, temperature extremes from two reanalyses have small relative bias and the root mean squared errors, while correlation coefficients are positively high. These suggest that both reanalyses can reproduce the variability of temperature extremes obtained from observations, and can be applied to investigate climate extremes to some extent, although the biases exist due to the assimilation differences. (C) 2013 Elsevier B.V. All rights reserved.

DOI

43
Yu Rong, Zhang Xiaoling, Li Guoping.et al., 2012. Analysis of frequency variation of thunderstorm, hail and gale in eastern China from 1971 to 2000.Meteorological Monthly, 38(10): 1207-1216. (in Chinese)

44
Zhang Qigao, Xu Chong-Yu, Zhang Zhi.et al., 2008. Climate change or variability? The case of Yellow River as indicated by extreme maximum and minimum air temperature during 1960-2004.Theoretical and Applied Climatology, 93: 35-43.

45
Zhang Suping, Chen Yang, Long Jingchao.et al., 2015. Interannual variability of sea fog frequency in the Northwestern Pacific in July.Atmospheric Research, 151: 189-199.The interannual variability in the sea fog frequency (SFF) in July in the midlatitude Northwestern Pacific (40°N–50°N, 140°E–170°W) from 1979 to 2009 is investigated with observations and reanalysis datasets. Composite analysis shows that in high-SSF years the center of the Northwestern Pacific subtropical high (SH) shifts eastward and a strengthened ridge exists in the midlatitude Northwestern Pacific. Under such conditions, large amount of moisture from the subtropics are transported northwardly by the southerlies over the west flank of the SH. The ridge is helpful for stable stratification and conductive to fog formation. In contrast, in low-SFF years the center of the SH expands westward and drifts further south; thus moisture can hardly reach the midlatitudes. Meanwhile an anomalous trough in the midlatitudes and the associated anomalous northerlies both weaken the southerlies and reduce the stability, unfavorable for fog occurrence. The case studies confirmed that the air parcels moving from the subtropical zone to the midlatitudes controlled by the SH, kept the higher temperature and humidity when flowing across the Kuroshio Extension, and then cooled down over the cold oceanic surface in fog case. The SFF in the Northwestern Pacific would decline under the conditions of global warming.

DOI

46
Zhao Chun-Yu, Wang Ying, Zhou Xiao-Yu.et al., 2013. Changes in climatic factors and extreme climate events in Northeast China during 1961-2010.Advances in Climate Change Research, 4(2): 92-102.Zhao, C.-Y., Y. Wang, X.-Y. Zhou, et al., 2013: Changes in climatic factors and extreme climate events in Northeast China during 1961–2010. Adv. Clim. Change Res., 4 (2), doi: 10.3724/SP.J.1248.2013.092.

DOI

47
Zheng Zuofang, Zhang Xiuli, Ding Haiyan, 2012. Change trend of extreme weather events in Beijing area in recent 50 years.Journal of Natural Disasters, 21(1): 47-52. (in Chinese)Based on the daily meteorological observation station data from 1958 to 2008,the trends of extreme weather events in Beijing area were analyzed.Result shows that(1) All kinds of the extreme weather events have remarkable annual change on intensity and frequency.High temperature events and their intensities have a trend of increasing in the last 50 years,which means that,nowadays high temperature events are in a relatively highly-occurred period,while low temperature events are on the contrary.(2) The strong convection events such as rainstorm,hailstone and thunderstorm have no remarkable annual change,but weaken in intensity.Strong wind,sand storm and dense fog events decrease remarkably in the last 50 years.(3) The amount and intensity of the acid rain events increase significantly.(4)There are obvious differences in intensities and frequencies of extreme weather before and after abrupt weather warming,and the abrupt change of extreme temperature indices in the 1990s is 1~2 years later than the abrupt temperature change.That is to say,the process of abrupt temperature change might be the intermediate of the extreme temperatures from one stationary period to another stationary one.

DOI

48
Zhu Runpeng, Yuan Tie, Li Wanli.et al., 2013. Characteristics of global lightning activities based on satellite observations.Climatic and Environmental Research, 18(5): 639-650. (in Chinese)The characteristics of global lightning activities are investigated by using the lightning data recorded by the Optical Transient Detector(OTD) and the Lightning Imaging Sensor(LIS) during 1995–2006.Results indicate that approximately 46.2 fl s–1(fl denotes flash and numbers the times lightnings happen) lightning flashes including intra-cloud and cloud-to-ground types occur worldwide and that nearly 78.1% of global lightning flashes occur in the region of 30°S–30°N.Moreover,the lightning density ratio of land to ocean is approximated at 9.64:1.Although offshore areas account for nearly 30% of all oceans,lightning flashes over these areas account for nearly 70% of the total lightning flashes over all oceans;the lightning density over open sea is very low.Furthermore,monthly variations in lightning activities over both land and offshore areas clearly show a characteristic single peak with the maximum appearing in July.The lightning density over offshore areas on the east coast of content is larger than that on the west coast in middle-and high-latitude regions,while the reverse is true over equatorial areas.Variation in lightning density with altitude is represented by two peaks and three valleys with the former appearing at 100–2400 m and 3300–4600 m,and the latter appearing below 100 m,at 2400–3300 m,and above 4600 m.These features are caused by the combined action of various factors influenced by terrain and geographic location.

49
Zhu Xiaofan, Zhang Mingjun, Wang Shengjie.et al., 2014. Spatiotemporal variation patterns of the beginning and ending dates of snowfall, and snowfall days in Qinghai Province during 1962 to 2012.Chinese Journal of Ecology, 33(3): 761-770. (in Chinese)<p>Based on the daily snowfall data from 27 meteorological stations in Qinghai Province from 1962 to 2012, the spatiotemporal variation patterns of the beginning and ending dates of snowfall and snowfall days were analyzed by means of inverse distance-weighted interpolation, and Mann-Kendall mutation test. The results show that the beginning date of snowfall in Qinghai Province mainly concentrated in September, October and November, but the ending date mainly concentrated in April and May. The earliest snowfall occurred in the Three-River headwaters region, and the latest was in the Qaidam Basin. In addition, the beginning date of snowfall in most areas of Qinghai Province was gradually delayed, but the ending date of snowfall was brought forward. The snowfall days concentrated on March, April and October (mainly light and heavy snows), and showed a decreasing trend at rates of 1-3 days per decade. An obvious abrupt change existed in the beginning and ending dates of snowfall and snowfall days. Latitude, altitude and annual mean temperature correlated strongly with the beginning and ending dates of snowfall and snowfall days, and the correlations of the beginning and ending dates of snowfall with the average daily temperature (mean, maximum and minimum values) were different in different months. Besides, a positive correlation between snow season length and mean snowfall days existed.</p>

Outlines

/