
Journal of Geographical Sciences >
Spatio-temporal changes in agricultural hydrothermal conditions in China from 1951 to 2010
*Corresponding author: Qin Yaochen (1959-), Professor, specialized in a regional model on sustainable development and geographic information science. E-mail: qinyc@henu.edu.cn
Author: Cui Yaoping (1984-) specialized in land use and climate change, E-mail: cuiyp@lreis.ac.cn; Ning Xiaoju (1987-) specialized in sustainable development, E-mail: nxj0655@163.com. Both of the authors had the same contributions to the paper.
Received date: 2015-12-29
Accepted date: 2016-02-01
Online published: 2016-06-15
Supported by
National Basic Program of China (973 Program), No.2012CB955800
National Natural Science Foundation of China, No.41171438, No.41401504
Copyright
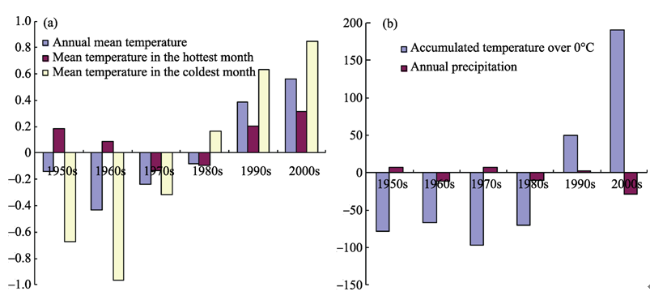
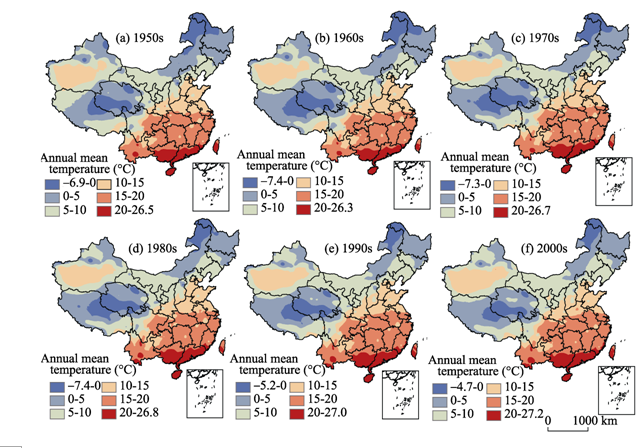
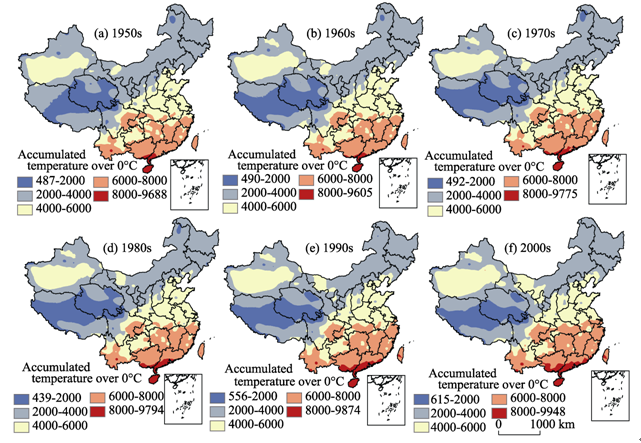
Based on the daily observation data of 824 meteorological stations during 1951- 2010 released by the National Meteorological Information Center, this paper evaluated the changes in the heat and moisture conditions of crop growth. An average value of ten years was used to analyze the spatio-temporal variation in the agricultural hydrothermal conditions within a 1 km2 grid. Next, the inter-annual changing trend was simulated by regression analysis of the agricultural hydrothermal conditions. The results showed that the contour lines for temperature and accumulated temperatures (the daily mean temperature ≥0°C) increased significantly in most parts of China, and that the temperature contour lines had all moved northwards over the past 60 years. At the same time, the annual precipitation showed a decreasing trend, though more than half of the meteorological stations did not pass the significance test. However, the mean temperatures in the hottest month and the coldest month exhibited a decreasing trend from 1951 to 2010. In addition, the 0°C contour line gradually moved from the Qinling Mountains and Huaihe River Basin to the Yellow River Basin. All these changes would have a significant impact on the distribution of crops and farming systems. Although the mechanisms influencing the interactive temperature and precipitation changes on crops were complex and hard to distinguish, the fact remained that these changes would directly cause corresponding changes in crop characteristics.
Key words: temperature; precipitation; accumulated temperature; agricultural condition; China
CUI Yaoping , NING Xiaoju , QIN Yaochen , LI Xu , CHEN Youmin . Spatio-temporal changes in agricultural hydrothermal conditions in China from 1951 to 2010[J]. Journal of Geographical Sciences, 2016 , 26(6) : 643 -657 . DOI: 10.1007/s11442-016-1290-3
Table 1 Cross-examination accuracy of interpolation methods |
| Climatic factor | Examination | 1950s | 1960s | 1970s | 1980s | 1990s | 2000s |
|---|---|---|---|---|---|---|---|
| Annual mean temperature | Mean error of prediction | 0.025 | 0.027 | 0.023 | 0.023 | 0.028 | 0.027 |
| Standard root mean square error | 1.864 | 1.284 | 1.382 | 1.433 | 1.376 | 1.405 | |
| Mean temperature in the hottest month | Mean error of prediction | 0.016 | 0.021 | 0.019 | 0.020 | 0.016 | 0.017 |
| Standard root mean square error | 1.293 | 1.486 | 1.378 | 1.505 | 1.225 | 1.306 | |
| Mean temperature in the coldest month | Mean error of prediction | 0.023 | 0.026 | 0.021 | 0.026 | 0.036 | 0.036 |
| Standard root mean square error | 1.283 | 0.938 | 0.095 | 0.982 | 1.088 | 1.085 | |
| Accumulated temperature over 0°C | Mean error of prediction | 4.586 | 5.184 | 4.589 | 4.692 | 3.896 | 4.104 |
| Standard root mean square error | 1.92 | 1.298 | 1.37 | 1.412 | 1.372 | 1.421 | |
| Annual precipitation | Mean error of prediction | 3.679 | 1.726 | 0.704 | 2.4 | 2.008 | 2.07 |
| Standard root mean square error | 1.834 | 1.44 | 1.406 | 1.496 | 1.341 | 1.268 |
Figure 1 Decadal changes in agricultural climatic factors in China |
Table 2 The statistical characteristics of agricultural climatic factors |
| Climatic factors | Statistical factors | 1950s | 1960s | 1970s | 1980s | 1990s | 2000s |
|---|---|---|---|---|---|---|---|
| Annual mean temperature | Standard deviation | 6.7 | 6.7 | 6.7 | 6.6 | 6.5 | 6.5 |
| Coefficient of variation | 0.6 | 0.6 | 0.6 | 0.6 | 0.5 | 0.5 | |
| Mean temperature in the hottest month | Standard deviation | 4.9 | 5.1 | 5.1 | 5.0 | 4.9 | 4.8 |
| Coefficient of variation | 0.2 | 0.2 | 0.2 | 0.2 | 0.2 | 0.2 | |
| Mean temperature in the coldest month | Standard deviation | 10.6 | 10.1 | 10.2 | 10.2 | 10.1 | 10.1 |
| Coefficient of variation | -3.1 | -2.7 | -3.3 | -3.9 | -4.7 | -5.2 | |
| Accumulated temperature over 0°C | Standard deviation | 1798 | 1795 | 1825 | 1814 | 1824 | 1831 |
| Coefficient of variation | 0.4 | 0.4 | 0.4 | 0.4 | 0.4 | 0.4 | |
| Annual precipitation | Standard deviation | 545.5 | 527 | 550 | 541 | 572.3 | 529 |
| Coefficient of variation | 0.6 | 0.6 | 0.6 | 0.6 | 0.7 | 0.6 |
Figure 2 Spatial interpolation results of mean temperature in China from 1951 to 2010 |
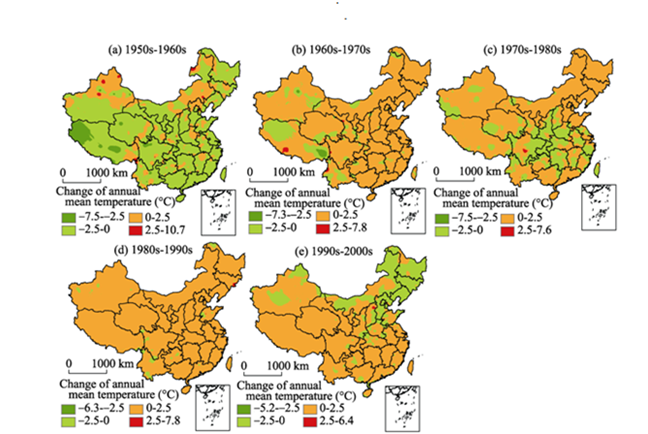
Figure 3 Spatial changing trend of mean temperature in China over the past 60 years |
Table 3 The statistical characteristics of regression analysis and significance test |
| Percentage / % | Regression coefficients b>0 and f (significance) | Regression coefficients b>0 and f (non significance) | Regression coefficients b<0 and f (significance) | Regression coefficients b<0 and f (non significance) |
|---|---|---|---|---|
| Annual mean temperature | 85.94 | 0.86 | 10.15 | 3.06 |
| Mean temperature in the hottest month | 34.19 | 10.17 | 31.86 | 23.77 |
| Mean temperature in the coldest month | 81.94 | 0.12 | 16.09 | 1.84 |
| Accumulated temperature over 0°C | 86.32 | 0.49 | 11.11 | 2.08 |
| Annual precipitation | 6.72 | 10.87 | 35.53 | 46.89 |
Figure 4 Spatial interpolation results of the accumulated temperatures over 0°C in China from 1951 to 2010 |
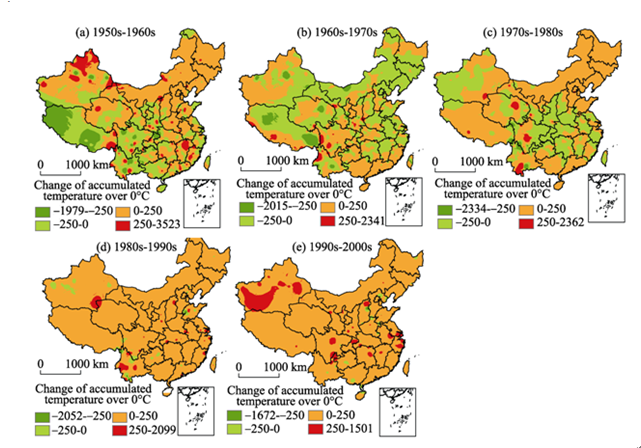
Figure 5 Spatial changing trend of the accumulated temperatures over 0°C in China from 1951 to 2010 |
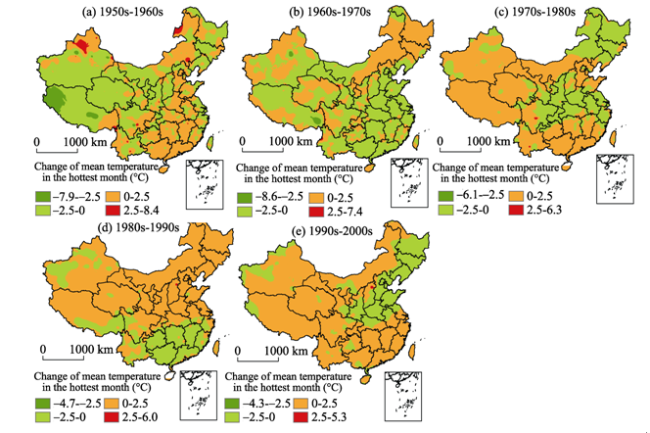
Figure 6 Spatial changing trend of mean temperature in the hottest month in China from 1951 to 2010 |
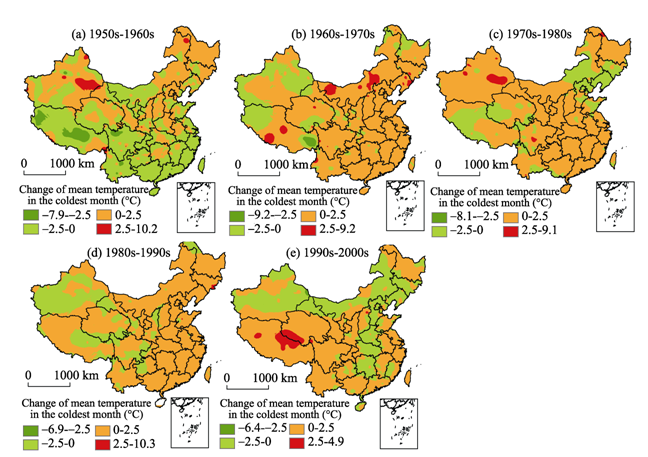
Figure 7 Spatial changing trend of mean temperature in the coldest month in China from 1951 to 2010 |
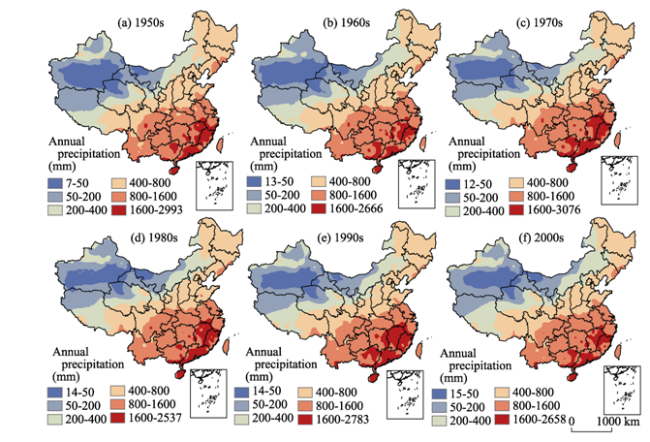
Figure 8 Spatial interpolation results of annual precipitation in China from 1951 to 2010 |
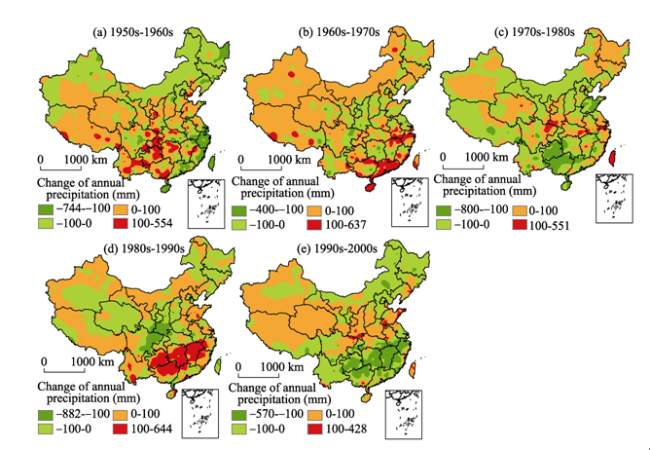
Figure 9 Spatial changing trend of annual precipitation in China over the past 60 years |
The authors have declared that no competing interests exist.
| 1 |
|
| 2 |
|
| 3 |
|
| 4 |
|
| 5 |
|
| 6 |
|
| 7 |
|
| 8 |
|
| 9 |
|
| 10 |
|
| 11 |
|
| 12 |
|
| 13 |
|
| 14 |
|
| 15 |
|
| 16 |
|
| 17 |
|
| 18 |
|
| 19 |
|
| 20 |
|
| 21 |
|
| 22 |
|
| 23 |
|
| 24 |
|
| 25 |
|
| 26 |
|
| 27 |
|
| 28 |
|
| 29 |
|
| 30 |
|
| 31 |
|
| 32 |
|
| 33 |
|
| 34 |
|
| 35 |
|
| 36 |
|
| 37 |
|
/
| 〈 |
|
〉 |