Research Articles

A spatial-temporal analysis of urban recreational business districts: A case study in Beijing, China

  • ZHU He 1, 2, 3 ,
  • LIU Jiaming , 1, 2, * ,
  • CHEN Chen 4 ,
  • LIN Jing 1, 2, 3 ,
  • TAO Hui 1, 2, 3, 5
Expand
  • 1. Institute of Geographic Sciences and Natural Resources Research, CAS, Beijing 100101, China
  • 2. Key Laboratory of Regional Sustainable Development Modeling, CAS, Beijing 100101, China
  • 3. University of Chinese Academy of Sciences, Beijing 100049, China
  • 4. College of Water Resources & Civil Engineering, China Agricultural University, Beijing 100083, China
  • 5. Institute of Economics and Management, Hubei Minzu University, Enshi 445000, Hubei, China
*Corresponding author: Liu Jiaming (1966-), Professor, specialized in tourism geography. E-mail:

Received date: 2015-06-01

  Accepted date: 2015-07-15

  Online published: 2015-12-31

Supported by

National Natural Science Foundation of China, No.41071110

Copyright

Journal of Geographical Sciences, All Rights Reserved

Abstract

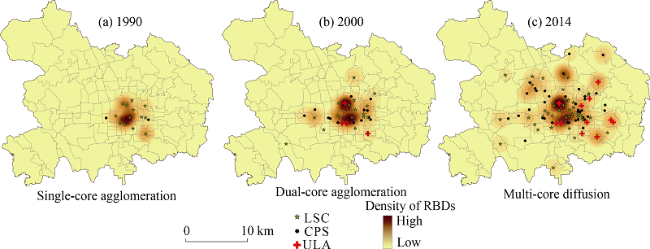
This study has revealed spatial-temporal changes in Recreational Business Districts (RBDs) in Beijing and examined the relationship between the location of urban RBDs and traffic conditions, resident and tourist density, scenic spots, and land prices. A more reasonable classification of urban RBDs (LSC, CPS, and ULA) is also proposed. Quantitative methods such as Gini Coefficient, Spatial Interpolation, Kernel Density Estimation, and Geographical Detector were employed to collect and analyze the data from three types of urban RBDs in Beijing in 1990, 2000, and 2014, respectively, and the spatial-temporal patterns as well as the distribution characteristics of urban RBDs were analyzed using ArcGIS software. It was concluded that (1) both the number and scale of urban RBDs in Beijing have been expanding and the trend for all types of urban RBDs in Beijing to be spatially agglomerated is continuing; (2) the spatial-temporal evolution pattern of urban RBDs in Beijing is “single-core agglomeration-dual-core agglomeration-multi-core diffusion”; and (3) urban RBDs were always located in areas with low traffic density, tourist attractions, high resident and tourist population density, and relatively high land valuations; these factors also affect the scale size of RBDs.

Cite this article

ZHU He , LIU Jiaming , CHEN Chen , LIN Jing , TAO Hui . A spatial-temporal analysis of urban recreational business districts: A case study in Beijing, China[J]. Journal of Geographical Sciences, 2015 , 25(12) : 1521 -1536 . DOI: 10.1007/s11442-015-1249-9

1 Introduction

Urban tourism emerged in the 1990s as a significant and distinctive type of tourism (Pearce 2001), and which has brought with it large-scale, significant social and economic benefits (Law, 1992). Urban destinations have become important tourist attractions, especially their urban waterfronts, theme parks, culturally historic urban cores, and important museums (Edwards et al., 2008).
The majority of recent research studies have focused on aspects related to supply and demand (Hayllar and Griffin, 2005), marketing and place-image (Judd, 1995; Bramwell and Rawding, 1996), host-visitor relationship (Hoffman et al., 2003), and the competitiveness of urban tourism destinations (Daskalopoulou and Petrou, 2009). However, an extremely important direction for research lies in the spatial structure of urban tourism (Pearce, 1998), which emphasizes how geographical phenomena affect urban tourism planning and design applications (Li et al., 2015).
An urban recreational business district (RBD), defined as a place where local residents and tourists go for leisure, tourism, and consumption, is widely accepted as an indispensable component of urban recreational systems in recent years (Li and Tao, 2003). As a destination for a variety of visitors, the RBD is a useful research subject to investigate the evolution of urban tourism and its impact on the city development (Page, 1995). Analysis of the spatial structure of RBDs would contribute significantly towards clarifying the concepts underlying RBD and would better guide tourism planning in urban areas (Getz, 1993).
In order to enrich the concepts underpinning the urban RBD and its research methods, this paper begins with a short review of existing RBD research and proposes a reasonable classification of urban RBDs. By using geographical information system (GIS) tools and statistical models of Gini Coefficient and Geographic Detector, we have investigated the spatial-temporal structural characteristics of the urban RBDs in Beijing. More specifically, this study attempted to (1) reveal the spatial structural evolution of urban RBDs in Beijing and (2) analyze the factors which affect the location strategies of urban RBDs as well as the extent of these effects.

2 Literature review

The concept of the RBD was first proposed by Stansfield and Richert in 1970 who described it as a “seasonal leisure street in a city”. As such, it referred to “the linear aggregation of restaurants, various special food stands, candy stores and a varied array of novelty and souvenir shops which cater to visitors’ leisurely shopping needs” (Stansfield and Richert, 1970). However, as research into RBDs continued, conflicting opinions began to emerge. For example, Taylor defined it simply as tourism facilities. He considered that the leisure service facilities of a typical RBD, including restaurants, hotels, and stores, should occupy no less than 50% of the total area, while the spatial distribution should consist of an elongated strip layout, as exemplified by a case study of an East London seaside resort in South Africa (Taylor, 1975). The seaside resort was frequently used as an example case in RBD research (Stansfield, 1969; Pearce, 1989; Meyer-Arendt, 1990). In addition, according to Shaw and Williams, an urban RBD is characterized by its concentration of different leisure activities and leisure attractions, which can satisfy the leisure needs of both local residents and tourists (Shaw and Williams, 1994). Furthermore, some researchers, including Butler, presented more diverse interpretations of the concept. In a case study of the West Edmonton Mall in Alberta, Canada, Butler showed that by aggregating with catering, entertainment, hotels, and retailing, a simple shopping mall could be developed into a multi-functional center, which was then categorized as a certain type of RBD (Butler, 1991). In some studies, the concept of the RBD was extended to include various other terms. Getz put forward the notion of the Tourism Business District (TBD) and the strategies needed for planning it (Getz, 1993), while Burtenshaw explained the idea of the Central Tourist District (CTD) and how it was formed (Burtenshaw et al., 1991). All these concepts are very similar to that of the RBD.
In China, research into the RBD began with Bao Jigang, who defined the urban RBD as a district where souvenir shops, restaurants, food stalls, and tourism attractions were gathered together, attracting a large number of tourists (Bao and Gu, 1998). His definition shared many features with that of Smith (Smith, 1983). In Bao’s study, the urban RBDs were classified as shopping malls, commercial pedestrian streets, reconstructed historical and cultural blocks, and cultural tourism zones in a newly built area of a city, which proved to be an authoritative classification. Following this, Hou, Yu, and Zhang each studied the urban RBD (Hou and Huan, 2002; Yu and He, 2003; Zhang and Sang, 2006), but no consensus about the concept and classification of RBDs has so far emerged. The existing conclusions about the RBD are incomplete and unable to encompass all of the current RBDs, as urban leisure continues to develop and expand, which will spell trouble for future research.
With the development of RBD research, the distinction between the recreational business district and the central business district (CBD) has become a key focus. The definition of the CBD was first put forward by Burgess, containing classical concentric zones, sectors, and multi-nuclei models (Yan et al., 2000). The conventional CBD consisted of highly concentrated cores for international businesses and was itself the core of the regional financial and functional system of a city with the highest level of economic activity (Wong, 2004). Bao and Zhang each distinguished between RBD and CBD with regard to location, land price, structure, function, flow of people, etc. (Bao and Gu, 1998; Zhang and Sang, 2006). They each concluded that there was no seasonal peak land price or visitor flow fluctuation in the RBD as compared with the CBD. Yet, with the development of urban tourism, more and more tourists were attracted to the CBD because of a strong sense of commercial atmosphere, prosperous streets, and unique building shapes. To meet the needs of white-collar workers and tourists, commercial streets began to consist of a series of leisure places, such as retail stores, restaurants, cinemas, bars, and cafes. These emerged in the CBD, thus gradually changing the CBD to an RBD by expanding its leisure functions.
Some researchers had investigated the spatial structure and layout of the RBD, which focus on its relationship to surrounding areas, form of integration, spatial location and form, and relationship between internal and external factors. Smith and Page each thought that the RBD is linear in spatial structure and without peak land prices (Smith, 1983; Page, 1995). Battino found that the downtown area formed the main gathering area and that the RBD partly overlapped the CBD by analyzing the format of the RBD (Battino et al., 2014). Li and Tao summed up the structure of the RBD evolving from “single core” to “double core” and further to “chain-structure” development with a case study of Suzhou (Li and Tao, 2003). Furthermore, the distribution pattern of a city’s tourist phenomena can be explained by factors such as accessibility, land rent, planning restrictions, comparative shopping, and proximity to other tourism-related phenomena (Ashworth and Tunbridge, 1990), which was also later demonstrated by both Yu and Bian (Yu and He, 2003; Bian and Zhang, 2004). However, most of these conclusions are the result of authors’ subjective perceptions and common sense inferences, instead of coming from empirical and quantitative studies, thus objective proof is needed.

3 Data sources and methods

3.1 Definition and classification of the urban RBD

Concept research is one of the most important research directions for studies of the RBD. At present, there is no consensus definition of the recreational business district, but those that do exist have some characteristics in common. From an analysis of these similarities, combined with typical case studies from academic RBD research, a list of urban RBD features can be enumerated. First, urban RBDs are generally located in main city areas, and related to urban transportation, land, infrastructure, and recreational and other attractions. With regard to scale, the space required for urban RBDs is always large and includes higher concentrations of business, recreational, and servicing facilities. In terms of customers, urban RBDs are designed for both local residents and tourists, with functions such as sight-seeing, shopping, and social interaction. Seasonally, the urban RBD is generally characterized by periodic peak waves of people flow during holidays and festivals. Also, because the urban RBD contains a large number of leisure facilities, restaurants, bars, etc., the number of nighttime tourists is greater than during the day, which is the main difference between the RBD and the CBD. The services that are generally provided in RBDs include shopping, entertainment, and catering. In addition, many RBDs have information services and city advocacy functions. Retail merchandise in RBDs generally consists of tourist souvenirs and monopoly products, while staple goods such as fruit, vegetables, items for the home, and other related items tend to sell less. From the cultural perspective, unique cultural characteristics, including city history, creative and commercial culture, etc., are the most essential attractive features that tourists demand. The cultural characteristics of urban RBDs appear in diverse forms, such as historical and cultural relics, unique architecture and landscape, ethnic cuisine, tourist artifacts and trinkets, theatrical shows, art exhibitions, etc.
Based on these characteristics, the author defines the urban RBD as “the city area where retail, services, and entertainment businesses are gathered together alongside recreational attractions and cultural and leisure facilities, and exists as the leisure space for providing services to tourists and local residents”. According to the spatial scale of the urban RBD, it can be divided into three groups: punctuated-large shopping center, linear-commercial pedestrian street, and block-urban leisure area.
The Large Shopping Center (LSC), also called Shopping Mall, the main part of which is occupied by large-scale retail businesses, consists of numerous specialty stores and commercial service facilities, with catering, entertainment, leisure functions, and a large parking lot. Compared with the ordinary shopping center, this LSC has corresponding services and facilities in a large area that is always more than 100,000 square meters. In addition to residents from the local district, the customer bank also includes residents from other districts and a certain number of external tourists. It also features its own unique architecture, modern commercial atmosphere, full range of goods, one-stop service, and large specialty stores as the main recreational attractions.
The Commercial Pedestrian Street (CPS), with its characteristics of shopping, tourism, culture, and leisure, has an elaborated environment, unique cultural atmosphere, and a certain theme; the street itself is also a recreational attraction. Spatially, most of these streets have both large marketplaces and scattered shops. All kinds of elements are located along both sides of the street, which always forms a strip or T-shape. The construction of this kind of RBD is always combined with urban renewal, integrated into the resources of old urban areas to reflect the history and culture of the city, or injected into a new cultural space, forming a themed block.
The Urban Leisure Area (ULA) is usually transformed from city districts displaying other functions, for example, a CBD transformed to a leisure function or an industrial district transformed to a cultural tourism district. The ULA is always mixed with city districts providing other functions, thus gaining a wider range of functions. Besides leisure, shopping, entertainment, and catering, it usually also has real estate, culture creation, and other functions. This kind of RBD consists of several blocks and has a relatively large scale. Compared with ordinary commercial districts, the inner part of the ULA lacks peak land values, the distribution of the elements within it is relatively even, and the recreational attractions are relatively diversified.

3.2 Data sources

Beijing, as the capital of China and a typical urban tourism destination, was selected as a case study. According to the most recent statistics released by the Tourism Administration of China (2014), the total annual number of tourists visiting Beijing is two hundred million.
The statistical data for LSCs are selected from information on large shopping marketplaces in Beijing hosted on well-known consumer information websites, such as http://www.dianping.com, http://www.ly.com, etc. Following data selection, large, integrated shopping marketplaces with various shopping, catering, and entertainment functions were chosen, and then those marketplaces with tourist souvenir sales and a certain number of out-of-town tourists were screened out from investigations in the field for statistical purposes.
The statistical data for CPSs come mainly from The Twelfth Five-Year Plan of Commercial and Service Industry Development in Beijing, the 26 unique commercial streets listed by Beijing Municipal Commission of Commerce and the commercial street information published in the Beijing Consumer Handbook edited by the Beijing Municipal Commission of Commerce.
ULA statistics are based on The Twelfth Five-year Plan of Cultural Industry Development in Beijing and the list of important industrial parks at the city and district level. The cultural innovative parks and CBD parks with large-scale leisure and commercial agglomeration were selected and analyzed.
To avoid double counting, the RBD of the largest spatial dimension was counted, but not the small parts in the same area, because of different RBD types always permeated and interacted. For example, a CPS in a ULA was not counted, neither was a LSC in a CPS or a ULA. RBDs in the main districts of Beijing (Dongcheng District, Xicheng District, Haidian District, Chaoyang District, Fengtai District, and Shijingshan District) were analyzed rather than those in suburbs, because of their larger size and scale (Figure 1).
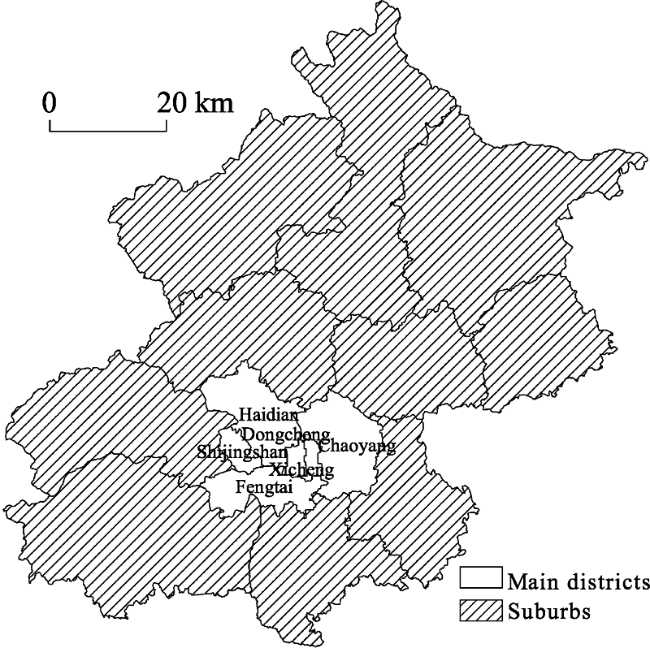
Figure 1 The study area in Beijing
A considerable amount of fieldwork was carried out in the RBD areas to ensure they were representative and operated normally. Geographical coordinates (X, Y) of all the sampling points were identified, with their central points used as fixed points, as were the formation conditions and areas in 1990, 2000, and 2014. Estimates were obtained by means of interviews, visual estimations, and map calculations for those sampling points without specific data. Other basic data were obtained from relevant official publications, statistical yearbooks, and official websites to guarantee their reliability, including data for 531 star hotels, the population of 138 streets in main districts, land prices, etc.
The main Beijing districts were vector handled by ArcGIS10.0 software with the map of Beijing in 2009 as the working base map (Beijing Geodetic Coordinate System 1954). Base map hierarchical information included the main traffic lines (line layer) and administrative divisions (polygon layer, including district layer and subdistrict layer), with the most recent subway lines and stations (point layer) obtained from the Baidu map.

3.3 Methods

In this study, the RBDs in 1990, 2000, and 2014 were marked as fixed positions on the map (Beijing Geodetic Coordinate System 1954, with the form X,Y) and were then analyzed by combining them with other related data from quantitative methods such as Gini Coefficient, Kernel Density Estimation (KDE), etc. Using the RBD data for 2000 and 2014 analyzed by ArcGIS10.0, the distribution characteristics, regularities, and genesis of urban RBDs were also analyzed and the methods of KDE, Buffer Analysis, Spatial Interpolation, and Geographical Detector were utilized.
3.3.1 Gini Coefficient
In order to analyze the three kinds of urban RBD in Beijing (including LSC, CPS and ULA), point density of RBD of 138 subdistricts in the main city area was calculated by taking the subdistrict as a unit and Gini Coefficient as the method (Arbia, 2001). Gini Coefficient is a common index in measuring the spatial agglomeration of certain industry, with the formula as follows (Krugman, 1991),
where G is the Gini Coefficient, n is the number of subdistricts, s is the average point density of RBDs in all subdistricts, and si and sj are the point densities of RBDs in subdistricts i and j, respectively. Within the range of values 0-1, the larger the Gini Coefficient is the more unbalanced on its distribution.
3.3.2 Kernel Density Estimation (KDE)
Density estimation is a way of measuring the area sample density from the samples of known points, and is divided into Simple Density Estimation and Kernel Density Estimation. KDE enables a smoother resulting distribution by using the kernel function to endow the points in the search area with different weights and so obtain the density of the unknown area (Seaman and Powell, 1991).
where K[ ] is the kernel function, h is the bandwidth, n is the number of known points in the bandwidth, and d is the dimension of the data. x is a vector of coordinates describing the location where the function is being evaluated, and xi is a series of vectors whose coordinates describe the location of each observation i. Scale variation, which means a property value of all of the known points, should be taken into consideration, that in order to eliminate various different attributes of the points and to ensure the objectivity of the statistical data.
3.3.3 Spatial interpolation
Spatial interpolation is the process by which the values of other unknown points in the area are estimated using the data of nearer known points which influence the unknown points (Jeffrey et al., 2001). Inverse Distance Weighting (IDW) and Kriging or Gaussian process regression are the interpolation methods adopted in this paper.
Using the hypothesis, that nearer known points have more influence on the unknown points than those further away, IDW can be expressed as follows (Perry and Hollis, 2005):
where zx is the estimated value of point x, zi is the known value z of point i, di is the distance between point i and point x, s is the number of known points used in the process of estimation, and k is the certain power, here equals two. The important feature of IDW is that all the predicted values range from minimum to maximum of known values, which avoids extreme values.
Kriging is a geostatistical approach (Matheron, 1971) that has gained acceptance as a tool for the interpolation of many types of data (Daly et al., 1994). It is the most popular interpolation method employed in statistics and has been used in this paper because of its emphasis on spatial factors and its use of the semi-variation function to interpolate data points.
3.3.4 Geographical Detector
The method known as Geographical Detector was first proposed by Wang as a means of detecting and assessing the risk of disease (Wang et al., 2010), and has become a significant technique in detecting the causes and mechanisms of various factors in its application to research studies of society, the economy, nature, etc. (Wang and Hu, 2012; Ren et al., 2014; Liu and Yang, 2012). The factor detector, which is a type of Geographical Detector, can test if a particular factor is the reason to lead certain special distribution diversity, through comparing the total variance of the index in a sub-region with that in the entire region (Wang and Hu, 2010):
where D is the influencing factor, H is the affected index, PD,H is the effect of D on H, n and σ2 are the number and variance of the samples, respectively, m is the classification number of an index, and nD,i is the sample number of D of type i. Within the range of values from 0 to 1, the larger PD,H is the more it can influence the region.

4 The spatial structural evolution of urban RBDs in Beijing

4.1 The development of urban RBDs in Beijing

As shown in Table 1, the number and scale of urban RBDs in Beijing increased at a steady rate when examining the data for 1990, 2000, and 2014. The number of RBDs increased by 18 in 2000, compared to 1990, at an annual growth rate of 8.20%, and the area increased by 3.6055 km2. The increase in 2014 was 55 at an annual growth rate of 7.26%, and the area increased by 950.9 m2.
Table 1 Statistics of urban RBDs in Beijing in 1999, 2000 and 2014
Year LSC CPS ULA Total
Number Scale (km2) Number Scale (km2) Number Scale (km2) Number Scale (km2)
1990 2 0.0149 13 0.3289 0 0 15 0.3439
2000 13 0.3449 16 2.5125 4 1.0920 33 3.9494
2014 37 2.3953 40 6.3984 11 4.6648 88 13.4584
Between 1990 and 2014, LSCs increased very rapidly in number by 35 at an annual growth rate of 12.9%, and the area increased by 2.3804 km2 at an annual growth rate of 23.6%, which reflects the fact that the LSC is easy to promote due to its relatively small scale. At present, new LSCs are similar to HOPSCA (Hotel, Office, Park, Shopping Mall, Convention, Apartment) and are developed in a systematic way, and thus are easy to duplicate due to their adaptability and operability.
The number of CPSs increased by 27 between 1990 and 2014 at an annual growth rate of 4.76%, and the area increased by 6.0695 km2 at an annual growth rate of 13.16%. This kind of RBD is the commonest, but its rate of increase is partly constrained by unique tourist resources, cultural climate, and policy. In addition, the area of CPSs increased at a faster rate than their number, which meant that the major development strategy for CPSs lies in their expansion based on surrounding area renovated or in developing larger business districts.
The ULA appeared in Beijing after 1990. Between 2000 and 2014, the number of ULAs increased by 11 at an annual growth rate of 7.49%, and their increased by 4.6648 km2 at an annual growth rate of 10.93%. Based on the development of culture-oriented travel, many large-scale cultural-industrial parks emerged with the support of government policy, and this formed the model for future ULAs, 72% of which were located in Chaoyang District in 2014. Cultural innovative industries are high-end industries in Chaoyang District supported by a series of policy documents. All of these policy documents have helped promote the development of ULAs in Chaoyang District, which has the greatest number of cultural industry clusters in Beijing and is planned to become the center of the cultural industry and a leisure tourism destination, according to The Development Plan of Cultural and Creative Industry of Chaoyang District, Beijing during the 12th Five-Year Plan, which document demonstrates that the development of ULAs is greatly influenced by government policy.
The Gini Coefficients of LSCs, CPSs, and ULAs in Beijing were calculated for the 138 subdistricts in the main urban region for 1990, 2000, and 2014 (Table 2). The results show that the Gini Coefficient of RBDs in Beijing was 0.5286 in 1990, 0.5829 in 2000 at an annual growth rate of 0.98%, and 0.6793 in 2014 at an annual growth rate of 1.10%, which reflects the fact that RBDs showed strengthening and acceleration of geographical aggregation in Beijing.
Table 2 Gini Coefficient variation of urban RBDs in Beijing
Year
1990 2000 2014
Gini Coefficient of LSCs 0.5015 0.5280 0.5949
Gini Coefficient of CPSs 0.5228 0.5402 0.5998
Gini Coefficient of ULAs - 0.5079 0.5287

Note: “-” means there is no data.

The annual Gini Coefficient of CPSs was the highest, while that of ULAs was the lowest. The results show that CPSs formed more easily from geographical aggregation because of various unique development resources, while geographical aggregation of ULAs changed more slowly because of their more complete functions and larger size.
Compared with the Gini Coefficient in 1990, the Gini Coefficient of LSCs in 2014 rose by 0.0934, with the highest growth rate of 0.71%. The Gini Coefficient of CPSs rose by 0.077, with a growth rate of 0.57%. Between 2000 and 2014, the Gini Coefficient of ULAs rose by 0.0208 at a growth rate of 0.29%. These results show that LSCs were easy to construct because of their relatively small scale, and the development of their geographical aggregation was faster because of their limited radiation range. The development of the geographical concentration of CPSs was mostly in equilibrium, given its medium-size scale, while the ULA showed the lowest rate of increase due to its more complete functions and widest radiation range.

4.2 The spatial-temporal structure of urban RBDs in Beijing

Using a distance of 3 km as the search radius for KDE, RBD density maps for Beijing in 1990, 2000, and 2014 were drawn up (Figure 2). The high-density spots of urban RBDs were located mainly in the center of the city and showed single-core agglomeration in 1990. In 2000, the high-density spots of urban RBDs were located in the main districts with a spatial structure of dual-core agglomeration and sprawl to the immediate neighborhood. Compared with 2000, the dual-core agglomeration of 2014 spread by means of larger spots, and the high-density spots of urban RBDs showed up in many districts with a new net structure of multi-core diffusion. The development process of urban RBDs turned out to be a “single-core agglomeration-dual-core agglomeration-multi-core diffusion” pattern, which was similar to results found for other cities (Li and Tao, 2003).
Figure 2 Density distribution of urban RBDs in Beijing in 1990, 2000 and 2014

5 Spatial factors influencing distribution and scale of RBDs

5.1 The distribution characteristics of RBDs

The characteristics of the spatial structure of RBDs were studied using ArcGIS software, with traffic conditions, inhabitant density, tourist density, distance from attractions, and land prices as the influencing factors. Only relevant data for 2000 and 2014 were analyzed, those for 1990 being missing.
Traffic conditions: One of the most important reasons why consumers chose RBDs as their destination for recreation and consumption was the low cost of transportation. One kilometer buffer zones of main traffic lines and subway stations were established in Beijing because we considered that a range of 1 km was convenient for most pedestrians (Figure 3).
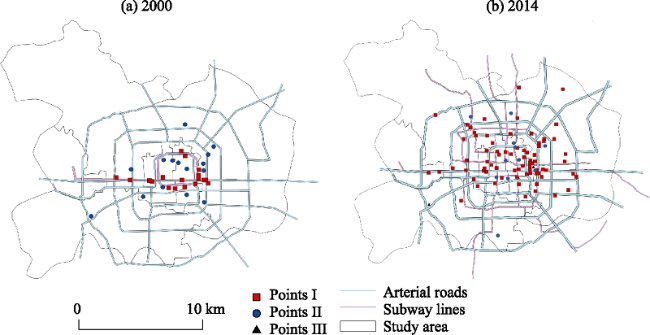
Figure 3 Classification and distribution of urban RBDs in Beijing based on traffic conditions
All of the RBDs were located in buffer zones in 2000, while 85 out of 88 RBDs (96.59%) were located in buffer zones in 2014. The traffic conditions of all RBDs were then analyzed, taking into account arterial roads and subway stations. RBDs located in both highway traffic buffer zones and subway station buffer zones are denoted as points I, RBDs located in either type of buffer zone as points II, and RBDs located in neither type of buffer zone as points III. The results of this study treated points I as being in areas experiencing the best traffic conditions, points II as in the better areas, and points III as being in the most inconvenient areas. The results showed that 18 out of 33 RBDs (54.55%) were points I in 2000, while other 15 RBDs were all points II (45.45%). In 2014, 63 out of 88 RBDs were points I (71.59%), 22 were points II (25%), and only 3 belonged to points III (3.41%). The results showed that convenient traffic conditions were a principal factor affecting the layout of RBDs.
Inhabitant density: The main purpose of RBDs is to meet the needs of their inhabitants and tourists for both recreation and consumption, as well as providing a more enriching nightlife. Theoretically, therefore, the distribution of RBDs should be strongly correlated with the density of both inhabitants and tourists (Figure 4).
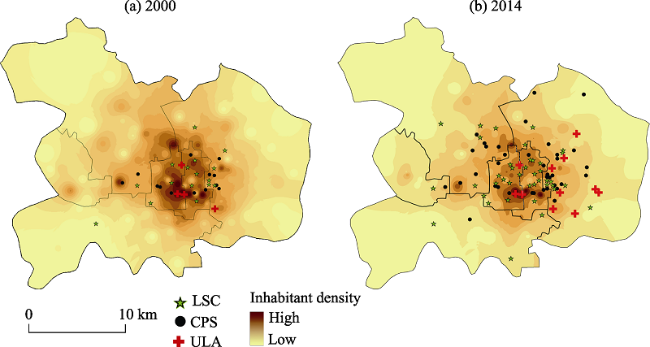
Figure 4 Relationship between urban RBDs and population density in Beijing
The density of inhabitants in all subdistricts in the main Beijing districts was calculated from the number of residents and the areas of all subdistricts obtained from the fifth and sixth censuses of Beijing carried out in 2000 and 2010, as well as from the Statistical Yearbook of Regions in Beijing (1999 and 2012). Taking the calculated population density as the central population density of each subdistrict, the map of population density of the main districts in Beijing and the population density of all the RBDs were obtained using the IDW method. The results showed that the locations of RBDs were highly correlated with the population density. In 2000, the population density of the main districts in Beijing was 6340 people per km2, while the population density of 33 RBDs was 24,270 people per km2, i.e. 3.83 times higher. Similarly, in 2014, the population density of the main districts was 9660 people per km2, while the population density of 88 RBDs was 20,980 people per km2, i.e. 2.17 times higher. The results demonstrated that RBDs were located in areas of high population density and were in close correlation with the distribution of inhabitants.
Tourist density: As tourists are the main consumers in RBDs, it seemed reasonable to assume that the layout of RBDs should closely correlate with tourist density. However, it was difficult to estimate tourist numbers at specific subdistricts from relevant references and statistical yearbooks. Considering that tourists and inhabitants have different accommodation requirements, the number of tourists, especially overnight tourists, could perhaps be estimated by counting beds in hotels. The specific locations of, and numbers of beds in, all star hotels in the main Beijing districts for 2000 and 2014 were obtained from the Star Hotels Statistic Report of Beijing (2000 and 2013) published by the Chinese Tourist Hotel Association, as well as from data published on dianping.com and the Baidu map. The tourist density distribution map was constructed using the KDE method, with beds as size variables and 3 km as the search dimension. Figure 5 shows that the location of RBDs coincided significantly with the areas of highest tourist density (Figure 5).
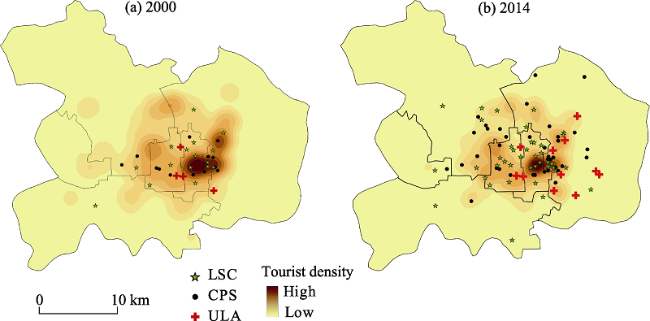
Figure 5 Relationship between urban RBDs and tourist density in Beijing
Distance from attractions: A range of favorable resources existed that enabled the formation of RBDs around attractions suitable for leisure and recreation. The data for A-level tourist attractions in Beijing were obtained from the website of the Tourism Administration of Beijing and used to analyze the relationship between the location of RBDs and distance from attractions. Buffer zones were established using the degree of A-level attractions as the standard within 5 km of 5A attractions, 4 km of 4A attractions, and so on.
The distance between the center point of each RBD and the nearest A-level attraction was determined. In 2000, all of the 33 RBDs were located in the buffer zones of A-level attractions with an average distance of 918.15 m, while in 2014, 85 of 88 RBDs were located within 96.59% of the buffer zones, with 1420.29 m the average distance to A-level attractions. Seven RBDs were themselves A-level attractions and eight were fully developed based on their attractions. Thus the development of RBDs was closely related to the distance from attractions, which, as the center for recreational and commercial service, attracted more tourists the nearer they were located to attractions.
Land prices: The commercial layout of Beijing has been heavily influenced by land prices, and so have RBDs as one kind of commercial and recreational development requiring land to build on. Sale price was chosen as the criterion among several kinds of land price, and was the total of rent in the process of selling country-owned land comprising commercial, residential, comprehensive, industrial land, etc. (Li et al., 2003). The price of commercial and comprehensive land was obtained from the announcement published by the Land Resources and Real Estate Management Bureau of Beijing in 2000 and 2013 and converted to a unit price. Then the center point of each area of land was located using coordinates of the form (X, Y) and the sale price of the main districts in Beijing was calculated by the Kriging method. Land prices for each RBD were compared with the map of land prices for Beijing for 2000 and 2014 (Figure 6).
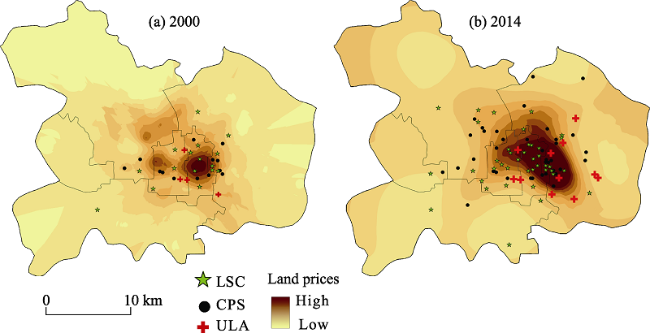
Figure 6 Relationship between urban RBDs and land valuations in Beijing
The average sale price of 33 RBDs in Beijing was 4935 yuan/m2, i.e. 2.7 times more than that of commercial land in Beijing, which was 1828 yuan/m2 in 2000, while the average sale price of 88 RBDs in Beijing was 31,646.19 yuan/m2, i.e. 2.5 times more than that of commercial land in Beijing, which was 12,640 yuan/m2 in 2014. The number of RBDs that cost more than 30,000 yuan/m2 reached 40 and the highest price was 67,280 yuan/m2. Because of the broad range of groups which they serve, locations in core areas were more favorable for RBDs. In addition, RBDs are the kinds of places which attract high earners in the early stages of development.

5.2 Spatial factors influencing the scale of RBDs

Spatial factors have affected both the location and scale of RBD development, as measured by the Geographical Detector. First, the factors, including traffic conditions, inhabitant and tourist density, location of attractions, and land prices, were classified. The inhabitant and tourist density and land price factors were classified into five categories according to density (price) distribution, the traffic conditions factor was classified into three categories, as mentioned previously, and the location of attractions factor was classified into five categories by measuring the distance between RBDs and their nearest attraction using ArcGIS software. Because the scale sizes vary greatly in different types of RBD, the influencing factors were measured according to classification into LSC, CPS, and ULA, respectively.
The results show that spatial factors had more influence on the scale of different kinds of RBD in 2000 than in 2014 (Table 3). As for LSCs, the density of inhabitants and tourists had much more influence than distance from attractions, land price, and traffic conditions, which were the most important factors in both 2000 and 2014. For CPSs, the tourist density was also the main factor, with an average influence in 2000 and a dominant influence in 2014, compared to other factors, and this reflects its leading effect on CPSs. For ULAs, the distance from attractions was the most important factor, with a dominant influence in 2000 and a lesser, but still important, influence in 2014.
Table 3 Spatial factors influencing the scale size of RBDs
2000 2014
LSC CPS ULA LSC CPS ULA
Traffic conditions 0.11 b 0.24 0.38 b 0.07 b 0.05 b 0.14
Inhabitant density 0.34 a 0.21 0.41 b 0.27 a 0.08 b 0.24
Tourist density 0.45 a 0.28 0.44 b 0.29 a 0.36 a 0.32
Distance from attractions 0.20 b 0.21 0.72 a 0.14 b 0.03 b 0.43
Land prices 0.07 b 0.21 0.41 b 0.09 b 0.08 b 0.27

Note: a, b means in a row without a common superscript letter are different significantly (P< 0.05).

6 Conclusions

In this work, we analyzed the spatial-temporal pattern of urban RBDs in Beijing according to feature description, classification, and definition, using a series of methods such as Gini Coefficient, KDE, Geographical Detector, ArcGIS, etc., using data for 1990, 2000, and 2014. Further, by focusing on 2014 using a combination of Geographical Detector and ArcGIS, we discovered the layout features and the causes of scale differentiation of RBDs. Our conclusions are summarized as follows:
(1) By analyzing existing cases and research studies in terms of location, scale, customers, seasonal changes, service functions, culture, etc., we summarize the basic features of RBDs and give explicit categorizations of RBDs as: punctuated-Large Shopping Center (LSC), linear-Commercial Pedestrian Street (CPS), and block-Urban Leisure Area (ULA) according to spatial scale, combination types, and so on.
(2) Over time, the number and total size of Beijing RBDs between 1990 and 2014 increased from 15 to 88 (486.7%) and from 0.3439 to 13.4584 km2 (3813.5%), respectively, with the biggest growth rate in LSCs and the least in ULAs. This trend can be related to features, resource environmental conditions, policy guides, etc.
(3) The degree of spatial agglomeration of RBDs in Beijing increased from 0.5286 in 1990 to 0.6793 in 2014, with an obvious concentrating trend. The Gini Coefficient of LSCs increased by 0.0934 with the largest growth rate, while that of CPSs was 0.5998 in 2014, which is the largest. As for ULAs, they showed the lowest increase and total amount, which could be explained by spatial scale and radiation power.
(4) The development process of urban RBDs presents a “single-core agglomeration-dual-core agglomeration-multi-core diffusion” mode, with the trend for multi-centers in the spatial layout determined by analyzing the density of urban RBDs.
(5) The distribution of RBDs was closely correlated with traffic conditions, population, distance from attractions, land prices, etc. In general, 95.46% of RBDs were located close to subway stations and arterial roads, 96.59% of RBDs were located in the buffer zones of A-level tourism attractions in 2014, while all the RBDs were located in the convenient traffic conditions buffer zone and A-level tourism attractions buffer in 2000.We also found, from estimation of population densities, that areas of inhabitant and tourist accumulation, together with high-value areas, are often dense distributing areas for RBDs.
(6) Factors such as traffic conditions, resident and tourist population, distance from attractions, and land prices, influence the scale of RBD development. LSCs, for example, are influenced mainly by inhabitant and tourist density, CPSs by tourist density, and ULA by tourism attractions and their locations.

The authors have declared that no competing interests exist.

1
Arbia G, 2001. The role of spatial effects in the empirical analysis of regional concentration.Geographical Systems, 3(3): 271-281.Economists have recently devoted an increasing attention to the issue of spatial concentration of economic activities. However, surprisingly enough, most of the empirical work is still based on the computation of very basic statistical measures in which the geographical characteristics of data play no role. By making use of a series of empirical examples we show that spatial concentration consists of two different features that are rarely kept as separate in the statistical analysis: an a-spatial concept of variability which is invariant to permutations, and the concept of polarization that refers to the geographical position of observations.

DOI

2
Ashworth G J, Tunbridge J E, 1990. The Tourist-historic City: Retrospect and Prospect of Managing the Heritage City. London: Belhaven.

3
Bao J, Gu S, 1998. Tentative research on RBDs of cities.Planners, 59(14): 59-64, 126. (in Chinese)

4
Bian X, Zhang S, 2004. Research on the exploration and development of urban recreational business districts.Economic Geography, 24(2): 206-211. (in Chinese)Urban resident's leisure activities prefer to act at home and mainly happen at the urban environs. These results provide theoretical foundations to explore and develop city's RBD. RBD have a quit great development in some big cities in China, but there are some problems, which restrain RBD development seriously. First, the paper relates the conception, type, regional location characteristic, and tourist leisure function of urban RBD. Secondly, the paper makes preliminary researches on RBD key problems and replying strategies in its development in our country, via reference of Douglas G Pearce's(1999)studies on the urban RBD, such as the Printemps Haussman, the Galeries Lafayette, and the Carrousec in Paris, etc.

5
Battino S, Borruso G, Donato C, 2014. Some preliminary remarks on the recreational business district in the city of Sassari: A social network approach. In: Murgante B et al. ICCSA 2014, Part II, LNCS 8580, 629-641.In geographical studies the Central Business District represents the ‘central place’ of the city, or its core, where the activities typical of a city, and different from those carried on in rural sett

DOI

6
Bramwell B, Rawding L, 1996. Tourism marketing images of industrial cities.Annals of Tourism Research, 23(1): 201-221.Images pour la commercialisation touristique des villes industrielles. Cet article examine le degré auquel les villes projettent des images différentes ou similaires dans leur publicité et la raison de cette différence ou similitude. On prête une attention toute particulière aux ressemblances et aux différences entre les images touristiques de cinq vieilles villes industrielles britanniques: Birmingham, Bradford, Manchester, Sheffield et Stoke-sur-Trent. On trouve une certaine standardisation dans leurs images publicitaires, mais il y a aussi des différences significatives. On examine quelques influences qui déterminent le caractère de ces images en se basant sur des théories des domaines de la géographie, du marketing et de la sociologie critique. On propose les grandes lignes d'un plan de recherche intégré et multidisciplinaire pour le travail futur au sujet des images touristiques des villes.

DOI

7
Burtenshaw D, Bateman M, Ashworth G, 1991. The European City: A Western Perspective. London: David Fulton Publishers.

8
Butler R, 1991. West Edmonton mall as a tourist attraction.Canadian Geographer, 35(2): 87-95.Recent years have seen the mega-phenomenon assume increasing significance in tourism; it is not surprising, therefore, that West Edmonton Mall, the world's first mega-mall, should be viewed as a tourist attraction. This article discusses the role of shopping as a tourist activity and the opportunity to shop as a facet of the appeal of a location to tourists. It examines the relative attractiveness of West Edmonton Mall as a tourist destination in this context and concludes that it has few outstanding characteristics beyond its unique size and range of leisure facilities. The permanence of its appeal beyond the regional scale is therefore unikely. The long-term appeal of shopping and related facilities is discussed in the context of a model of tourism development.

DOI

9
Daly C, Neilson R P, Phillips D L, 1994. A statistical-topographic model for mapping climatological precipitation over mountainous terrain.Journal of Applied Meteorology, 33: 140-158.

10
Daskalopoulou I, Petrou A, 2009. Urbantourism competitiveness: Networks and the regional asset base.Urban Studies, 46(4): 779-801.Firms are acknowledged to be important actors involved in the deployment of resources available to a tourism destination. In turn, successful tourism firms can contribute to building the competitive advantage of tourism destinations through affecting a destination's tourism product or service. The present study analyses business performance in urban tourism using networks and entrepreneurial perceptions over a city's asset base as a framework of competitive performance. Business performance is measured in terms of productive efficiency09恪眛hat is, technical and scale efficiency. Results indicate that networks and entrepreneurial perceptions of a city's asset base constitute important determinants of the successful operation of tourism businesses.

DOI

11
Edwards D, Griffin T, Hayllar B, 2008. Urban tourism research: Developing an agenda.Annals of Tourism Research, 35(4): 1031-1052.<h2 class="secHeading" id="section_abstract">Abstract</h2><p id="">The article discusses the role of authenticity in the seaside destination choice and introduces the weight attributed to authenticity as a psychographic segmentation variable. Importance ascribed to authenticity of different destination attractions was acquired by use of conjoint analysis in a study carried out in Slovenia. The results show that considerable differences in terms of the quest for authenticity exist among tourists and suggest that resort product transformation by means of inclusion and promotion of authentic features should be oriented towards carefully chosen segments. Additionally, there are some indications that social changes will influence the demand structure so that an increased search for authenticity is expected in the future.</p>

DOI

12
Getz D, 1993. Planning for the tourism business district.Annals of Tourism Research, 20: 583-600.Planification pour les quartiers de commerce touristique. Cette étude de cas montre comment deux systèmes contrastés de planification— l'un régulateur et l'autre proactif—ont abouti à des aménagements touristiques bien différents aux Chutes du Niagara, au Canada et aux Etats- Unis. Dans ces deux villes frontiéres, les vieux centre-villes ont été surpassées; aux Etats-Unis, les installations, entreprises et services touristiques ont été intégrés intentionnellement aux utilisations foncières ordinaires du quartier commer04ant, créant un quartier commer04ant touristique bien défini. On examine les caractéristiques de ce genre de quartier et les questions de planification touristique et urbaine qui influencent l'agrément et la compétitivité. On tire des conclusions au sujet des modéles de quartiers commer04ants touristiques et des stratégies de planification pour ces quartiers.

DOI

13
Hayllar B, Griffin T, 2005. The precinct experience: A phenomenological approach.Tourism Management, 26(4): 517-528.An examination of the extant literature relating to urban tourism in general, and historic precincts in particular, highlights the predominantly structural and functional nature of existing research. Issues such as spatial form, land-use mix, development processes, management, marketing, economic impact and accommodation are recurring themes. While such studies have made a substantial contribut...

DOI

14
Hoffman L M, Fainstein S S, Judd D R, 2003. Cities and Visitors: Regulating People, Markets, and City Space. Oxford: Blackwell.

15
Hou G, Huang Z, 2002. Research on the formed mechanism and spatial structure of urban business recreation district.Human Geography, 17(5): 12-16. (in Chinese)The urbanization of tourism makes city becoming the center of tourism attraction. Especially, the center business district of big city has becoming the visiting "focus" to citizens and visitors. The center business district develops very quickly and then it produces the Urban Business Recreation District (UBRD). It based on the urban business central district, involved in kinds of recreation activities, then it came into being a district for people to recreate?to shop?to amuse themselves. Along with the discussing of the importance of UBRD research, the paper, taking the Human Road of Nanjing city as a case, discusses the forming process of UBRD and the mechanism of motive force to build up UBRD. The paper points out that UBRD has synthetical and systematicness development factors, such as nature?culture?traffic?business?finance?community?government and so on factors playing active roles in its development course. Its dynamic mechanism is an inter dynamic system composed of many interknitted factors. In this system, the recreational consumption subsystem and recreation products subsystem are motive forces and medium system is the guide of recreational consumption, and urban supporting system is the condition of development. Then the paper analyzes the spatial structure of UBRD. UBRD belongs to cantonal recreation and be located in the central area of city. The inner space of UBRD can be divided into four hierarchies, such as intercourse space, building space, street space, square space. The UBRD scope isn顒媡 paused by an unambiguous bound. The layout of facilities from inside to outside is a gradual course. UBRD can be divided into core and frame by the density of recreational facilities. The core is dense distribution area of recreational facilities and recreational activities. The frame is a transitional area from outside cantonal to UBRD. The space of UBRD is the combined styles and the relationships of recreational facilities and recreational activities in the district. It is the result of interaction of agglomerative and diffusive effect, neighbor effect, transmission effect, and self organization effect of urban spaces. Look on geometry, UBRD is a regional shape composed of "points"?"lines"?"plane" of kinds of recreational facilities and recreational activities.

16
Jeffrey S J, Carter J O, Moodie K Bet al., 2001. Using spatial interpolation to construct a comprehensive archive of Australian climate data.Environmental Modelling & Software, 16: 309-330.A comprehensive archive of Australian rainfall and climate data has been constructed from ground-based observational data. Continuous, daily time step records have been constructed using spatial interpolation algorithms to estimate missing data. Datasets have been constructed for daily rainfall, maximum and minimum temperatures, evaporation, solar radiation and vapour pressure. Datasets are available for approximately 4600 locations across Australia, commencing in 1890 for rainfall and 1957 for climate variables. The datasets can be accessed on the Internet at http://www.dnr.qld.gov.au/silo. Interpolated surfaces have been computed on a regular 0.05° grid extending from latitude 10°S to 44°S and longitude 112°E to 154°E. A thin plate smoothing spline was used to interpolate daily climate variables, and ordinary kriging was used to interpolate daily and monthly rainfall. Independent cross validation has been used to analyse the temporal and spatial error of the interpolated data. An Internet based facility has been developed which allows database clients to interrogate the gridded surfaces at any desired location.

DOI

17
Judd D R, 1995. Promoting tourism in US cities.Tourism Management,16(3): 175-187.Urban tourism is a relatively recent phenomenon but is now being embraced by most US cities, which are using substantial funds to compete for visitors, creating elaborate new infrastructures in the process. This article provides an analytical overview of the steps a variety of US cities are taking &mdash; such as developing a new brand image, refurbishing run-down areas, touting for conference business, building shopping malls and creating &lsquo;carousal&rsquo; zones &mdash; to promote tourism. The author also examines how far these strategies translate into economic and social success.

DOI

18
Krugman P R, 1991. Geography and Trade. Cambridge, Massachusetts: MIT Press.

19
Law C M, 1992. Urban tourism and its contribution to economic regeneration.Urban Studies, 29: 599-618.

DOI

20
Li Limei, Tao W, 2003. Spatial structure evolution of system of recreation business district.Chinese Geographical Science, 13(4): 370-377.<a name="Abs1"></a>The growing attention on urban tourism was very widespread. There are two angles to study urban tourism: supply-side and demand-side. And the supply-side of the tourism remains very important. The RBD (Recreation Business District) is a useful framework to understand the components of urban tourism and how they fit together. The paper begins with a review on the RBD and the spatial structure of tourism in urban areas and then attempts to develop a more general understanding of the spatial structure evolution of RBDs in a tourist-historic city&#8212;Suzhou. The spatial structures and functions of the RBDs in Suzhou are examined, based on field observations, interviews with city officials and industry leaders, and a review of available documents. The urban tourism of Suzhou has developed in a range of contexts, that various types of RBDs have emerged as a result of different urban development strategies. The spatial structure has evolved from the past "Single-cored Structure" to "Double-cored Structure" at present, and then to "Chain Structure" in the future. The spatial form and evolution of RBD in Suzhou are closely relative with its urban spatial expansion. Urban area dispersal is the prerequisite of the emergence of the RBD. Planning and constructing the RBD becomes a new impetus to urban growth or renewal. Finally, a number of strategies for planning and developing the RBD in Suzhou are suggested. The different RBDs should adopt different strategies. Intensification can be the possible strategy for the RBDs in the ancient city. Accreting with the urban theme park or engrafting on the Jinji Lake is suggested respectively for the RBD in the Suzhou New District and the Suzhou Industrial Park.

DOI

21
Li Ling, Gu S, Hu K, 2003. Spatial analysis method for metropolitan land price and its application in Beijing.Resources Science, 25(4): 85-92. (in Chinese)

22
Li Mimi, Fang L, Huang X, 2015. A spatial-temporal analysis of hotels in urban tourism destination.International Journal of Hospitality Management, 45(2): 34-43.This study investigates the spatial associations of urban tourism phenomena by using GIS and statistical methods to examine the relationships between hotels and land use types, attractions, transportation facilities, and the economic variables of the tertiary planning units in which the hotels are located. Hong Kong is used as an example. The study first introduces the spatial characteristics of hotels and attractions development in Hong Kong. A geographical information system is then used to map hotels and investigate the characteristics of the land use, attractions, and transport facilities around hotels. The spatial relationships are then analyzed with a set of logistic regression models. The results reveal that commercial land type and the number of attractions around hotels are significantly related to the distribution of upper-grade hotels in Hong Kong. The determinants vary over time and the spatial structure changes accordingly. The analysis is important theoretically as it enriches the methodologies for analyzing the relationships between hotels and urban structure, and for conceptualizing and identifying tourism functional zones. It is important for practitioners as it provides useful information for selecting sites for hotels.

DOI

23
Liu Y, Yang R, 2012. The spatial characteristics and formation mechanism of the county urbanization in China.Acta Geographica Sinica, 67(8): 1011-1020. (in Chinese)The spatial and temporal characteristics and the formation mechanism of the county urbanization in China since 1990 were analyzed systematically, using the methods including regional differences, transect and geography detectors. Results show that the temporal and spatial differences of the county urbanization were significant. The "herringbone" shape region pattern of high county urbanization was gradually highlighted, which were made by the counties along the north border and in eastern coastal areas. The county urbanization process of some regions were accelerated and enhanced, including Wuhan metropolitan region, Chengdu-Chongqing region and Guanzhong-Tianshui region. The low county urbanization level was maintained in Southwest China and Qinghai-Tibet Plateau regions. The differences of urbanization and the change rate of county urbanization were converged in China after 2000, but the rate has slowed down since 2000. The county urbanization trend of transects were significantly different, including Lianyungang-Lanzhou railway and Lanzhou-Urumqi railway transects, the Yangtze River transect, the border of north China transect, 106 National Road transect, and the eastern coastal transect. There are many factors affecting county urbanization, mainly including economic development stage, the level of secondary and tertiary industries, rural net income per capita, population density, leading position of grain production, demographic statistics and special arrangements for counties. The high county urbanization in northern border regions was a typical type of statistical unrealistically high urbanization. In the future county urbanization development should follow the geographical differences, highlight its leading function, and adopt multiple urbanization development models such as promoting urbanization intensively in key urban economic development areas, separating urbanization in cropland and grain producing areas, migrating urbanization in ecological and water resource protection areas, suburban areas and urban-based urbanization and other leading county urbanization patterns.

DOI

24
Matheron G, 1971. The theory of regionalized variables and its applications. Les Cahiers de Morphologie Mathematique (Fontainebleau).Fasc.5: 218.

25
Meyer-Arendt K, 1990. Recreational business districts in Gulf of Mexico seaside resorts.Journal of Cultural Geography, 11: 39-55.Within the body of literature addressing tourism imprints upon the cultural landscape, the recreational business district (RBD) has been identified as a key component of a resort area, and the seaside has been no exception. Comprised of tourist-oriented businesses and historically focused upon the beach, incipient RBDs evolved at seaside termini of railroads, highways, and footpaths. Construction of bathhouses, casinos or beach hotels at these sites was followed by nearby clustering of secondary and tertiary recreational enterprises. Lateral expansion of coastal roads often led to RBD elongation, but RBD core areas usually remained as the central focus of tourist activity. Variations in RBD development have resulted from shifts in beach access corridors and/or ‘redevelopment’ of older resort landscapes. Along the shores of the Gulf of Mexico, the RBD persists as an artifact of the touristic landscape.

DOI

26
Page S, 1995. Urban Tourism, London: Longman.

27
Pearce D G, 1989. Tourist Development. London: Longman.

28
Pearce D G, 1998. Tourism development in Paris: Public intervention.Annals of Tourism Research, 25(2): 457-476.L'aménagement touristique de Paris: intervention publique. Cet article examine quelques aspects du développement du tourisme à Paris et cherche à identifier et àévaluer les divers moyens par lesquels le gouvernement, national et local, est intervenu dans l'aménagement touristique de Paris et a encouragé ou géré de fa04on directe la croissance du tourisme dans la ville. Les trois exemples qui sont examinés en détail—l'urbanisme, le réaménagement des Champs-07lysées et le Grand Louvre—indiquent que l'intervention publique dans ce secteur ne se fait d'habitude que comme élément de politiques plus générales, notamment celles visant à l'image de Paris et à son rayonnement. Les considérations culturelles et politiques semblent l'emporter sur les bénéfices économiques immédiats.

DOI

29
Pearce D G, 2001. An integrative framework for urban tourism research.Annals of Tourism Research, 28(4): 926-946.<h2 class="secHeading" id="section_abstract">Abstract</h2><p id="">This paper outlines an integrative framework for urban tourism and illustrates applications with reference to selected aspects of the literature. The framework emphasizes the identification of subject cells within a matrix defined in terms of scale (site, district, city-wide, regional, national, and international) and themes (demand, supply, development, and impacts). It stresses the need to examine the relationships between these, both vertically and horizontally. This is offered as a means of providing a more systematic and coherent perspective on urban tourism, as a way of integrating a steadily growing but as yet largely fragmented body of research and providing structure for future efforts in this field, both conceptually and empirically.</p><h2 class="secHeading" id="section_abstract">R&eacute;sum&eacute;</h2><p id="">Un sch&eacute;ma d'int&eacute;gration pour les recherches sur le tourisme urbain. Cet article expose les grandes lignes d'un sch&eacute;ma d'int&eacute;gration pour les recherches sur le tourisme urbain et en illustre des applications en se reportant &agrave; certains aspects de la litt&eacute;rature. Ce sch&eacute;ma souligne l'identification de cellules de sujet dans une matrice qui est d&eacute;finie en fonction d'&eacute;chelle (site, quartier, ville, r&eacute;gion, nation, monde) et de th&egrave;mes (demande, offre, d&eacute;veloppement, impacts). On accentue le besoin d'examiner verticalement et horizontalement les rapports entre les &eacute;l&eacute;ments de la matrice. Ce sch&eacute;ma pourrait offrir une perspective plus syst&eacute;matique et coh&eacute;rente sur le tourisme urbain, int&eacute;grer une importante bibliographie qui continue &agrave; s'accro??tre tout en restant en grande partie fragmentaire et fournir une structure pour des recherches futures dans ce domaine &agrave; partir des points de vue conceptuel et empirique.</p>

DOI

30
Perry M, Hollis D, 2005. The generation of monthly gridded datasets for a range of climatic variables over the UK. International Journal of Climatology, 25: 1041-1054.Abstract Monthly or annual 5 km × 5 km gridded datasets covering the UK are generated for the 1961–2000 period, for 36 climatic parameters. As well as the usual elements of temperature, rainfall, sunshine, cloud, wind speed, and pressure, derived temperature variables (such as growing-season length, heating degree days, and heat and cold wave durations) and further precipitation variables (such as rainfall intensity, maximum consecutive dry days, and days of snow, hail and thunder) are analysed. The analysis process uses geographical information system capabilities to combine multiple regression with inverse-distance-weighted interpolation. Geographic and topographic factors, such as easting and northing, terrain height and shape, and urban and coastal effects, are incorporated either through normalization with regard to the 1961–90 average climate, or as independent variables in the regression. Local variations are then incorporated through the spatial interpolation of regression residuals. For each of the climatic parameters, the choice of model is based on verification statistics produced by excluding a random set of stations from the analysis for a selection of months, and comparing the observed values with the estimated values at each point. This gives some insight into the significance, direction, and seasonality of factors affecting different climate elements. It also gives a measure of the accuracy of the method at predicting values between station locations. The datasets are being used for the verification of climate modelling scenarios and are available via the Internet. 08 Crown Copyright 2005. Reproduced with the permission of Her Majesty's Stationery Office. Published by John Wiley & Sons, Ltd.

DOI

31
Ren Y, Deng L, Zuo Set al., 2014. Geographical modeling of the spatial interaction between human activity and forest connectivity in an urban landscape of southeast China.Landscape Ecology, 29(10): 1741-1758.Geographical detector models provide a quantitative approach for evaluating spatial correlations among ecological factors, population density and landscape connectivity. Here, we used a geographical m

DOI

32
Seaman D E, Powell R A, 1996. An evaluation of the accuracy of kernel density estimators for home range analysis.Ecological Society of America, 77(7): 2075-2085.Kernel density estimators are becoming more widely used, particularly as home range estimators. Despite extensive interest in their theoretical properties, little empirical research has been done to investigate their performance as home range estimators. We used computer simulations to compare the area and shape of kernel density estimates to the true area and shape of multimodal two-dimensional distributions. The fixed kernel gave area estimates with very little bias when least squares cross validation was used to select the smoothing parameter. The cross-validated fixed kernel also gave surface estimates with the lowest error. The adaptive kernel overestimated the area of the distribution and had higher error associated with its surface estimate.

DOI

33
Shaw G, Williams A M, 1994. Critical Issues in Tourism-A Geographical Perspective. Portland: Blackwell.

34
Smith S, 1983. Recreation Geography. London: Longman.This book provides a systematic examination of the methods used by geographers in their study of recreation. These methods are divided into descriptive, explanatory and predictive techniques for both recreational travel patterns and location patterns. Two chapters also examine policy related (normative) research. Recreation geography is defined in the book as 'the systematic study of the patter...

35
Stansfield C A Jr.1969. Recreational land use patterns within an American seaside resort.The Tourist Review, 24(4): 128-136.Urban areas whose dominant economic activities are those of providing an array of recreational services to tourists normally reflect this specialization in their land use patterns. Although precise statistical definition of the relative importance of recreational functions within an urban economy has certain inherent difficulties, some towns are so obviously dependent on tourism that they are universally recognized as resorts. In these towns, a characteristic urban morphology is apparent. Their unique physical qualities, so readily observed in the basic urban structure of resorts, may provide students of the science of tourism with insight into their function. Function and form, in tourism as in other urban activities, are, necessarily, closely interwined. ‘The landscape of a town, or if the word is accepted, the “townscape”, is worthy of far more geographical research than it now receives.’ The objective of this paper is the description of this interrelationship as observed in a representative American seaside resort, together with a brief historical interpretation of urban development in this resort.

DOI

36
Stansfield C A, Rickert J E, 1970. The recreational business district.Journual of Leisure Research, 4: 213-225.

37
Taylor V, 1975. The recreational business district: A component of the East London urban morphology.South Africa Geography, 5: 139-144.

38
Wang J F, Hu Y, 2012. Environmental health risk detection with geodetector.Environmental Modelling & Software, 33: 114-115.中国科学院机构知识库(中国科学院机构知识库网格(CAS IR GRID))以发展机构知识能力和知识管理能力为目标,快速实现对本机构知识资产的收集、长期保存、合理传播利用,积极建设对知识内容进行捕获、转化、传播、利用和审计的能力,逐步建设包括知识内容分析、关系分析和能力审计在内的知识服务能力,开展综合知识管理。

DOI

39
Wang J F, Li X H, Christakos Get al., 2010. Geographical detectors-based health risk assessment and its application in the neural tube defects study of the Heshun region, China.International Journal of Geographical Information Science, 24(1): 107-127.Physical environment, man-made pollution, nutrition and their mutual interactions can be major causes of human diseases. These disease determinants have distinct spatial distributions across geographical units, so that their adequate study involves the investigation of the associated geographical strata. We propose four geographical detectors based on spatial variation analysis of the geographical strata to assess the environmental risks of health: the risk detector indicates where the risk areas are; the factor detector identifies factors that are responsible for the risk; the ecological detector discl

DOI

40
Wong T C, 2004. The changing role of the central business district in the digital era: The future of Singapore’s new financial district.Land Use Policy, 21: 33-44.

41
Yan X P, Zhou C S, Leng Yet al., 2000. Functional features and spatial structure of CBDs in Guangzhou.Acta Geographica Sinica, 55(4): 475-486. (in Chinese)This paper, on the basis of literature review on CBD research results, studies the functional features and spatial structure of CBDs in Guangzhou, a metropolis of South China, in terms of documents, data and on the spot investigation. The attention is initially paid to the delimitation of CBD. A comprehensive method of delimiting CBD is invested from the major characters of CBD dividing the streets with high land value according to the basic land value of Guangzhou, determining the transport circle surrounding the districts with high land value and further determining the limits of CBD, and investigating some typical streets in the delimited CBD by the index of Murphy and Vance so as to examine the feasibility of the delimitation. In terms of the comprehensive method, the CBD of Guangzhou is divided into three sub districts including one traditional and two new CBD sub districts. Then the functional features including the overall and sub-district features of CBD are analyzed. Some indicators, such as location quotient, office floor area, vacant office floor rate, establishments and employment of central functions, offices of non Guangzhou enterprises, offices of transnational enterprises and transnational financial organs, are used to reflect the overall features of centralization and overseas orientation. The comparative analysis on the central, external and dwelling functions of the three CBD sub districts reveals that the traditional CBD is dominated by retail but the new CBDs by enterprise offices, finance and insurance, and information consultation. These two types of functions represent different stages of CBD development and reflect the evolution of CBD function. Thirdly, the spatial structure of CBD and its formation mechanism are examined. The research results reveal that the CBD of Guangzhou shows a ‘separation’ structure with time, characterized by the spatial subdivision and agglomeration of various functions. From the horizontal structure of CBD sub districts, based on the analysis of land value and function, the traditional CBD shows a ‘twin core ring’ structure, i.e. land use changes regularly with the distance from the peak land value intersection, but the new CBDs show a ‘linear’ structure, i.e. the central functions distribute along the major streets. From the vertical structure of CBD sub districts, based on the analysis of the on the spot investigation, the three sub districts differ in vertical changes of building height and floor function. Furthermore, the formation mechanism of CBD spatial structure, in the aspects of CBD function demand, rent bid relation, environment, technology and behavior, are analyzed. Finally, a brief conclusion is drawn and a discussion on the general evolution model of CBD function and spatial structure of Guangzhou and further Chinese metropolises is made.

42
Yu S, He S-B, 2003. The research of RBD destribution.Human Geography, 18(4): 10-15. (in Chinese)

43
Zhang J, Sang Z, 2006. A comparative study between CBD and RBD and the extension of their functions.Tourism Tribune, 21(12): 53-56. (in Chinese)Under the background of large-scale urban construction and rapid development of tourism industry in our country, the study of CBD and RBD has been put under spotlight in recent years. However, the confusion of these two concepts has misled and, in some sense, narrowed the vision of their correlative studies. Based on the comparative study between CBD and RBD, the present article holds that: First, RBD includes those recreational business districts both in and out of the city. The research of urban RBD could not replace the characteristics of all RBD. Second, judged by their origins and functions, CBD and RBD have greater difference than they are in common. The extension of their functions leads to the emergence of TDB, so the construction of CBD, RBD and TBD should have their own characteristics.

Outlines

/