
Journal of Geographical Sciences >
Spatial pattern and its evolution of Chinese provincial population: Methods and empirical study
Received date: 2014-06-06
Accepted date: 2015-03-15
Online published: 2015-12-31
Supported by
Key Program of the National Natural Science Foundation of China, No.71433008.Key Research Program of the Chinese Academy of Sciences, No.KZZD-EW-06-04.National Natural Science Foundation of China, No.41271174.National Key Technology R&D Program, No.2012BAI32B06.Beijing Planning of Philosophy and Social Science, No.13CSC011
Copyright
China has been experiencing an unprecedented urbanization process. In 2011, China’s urban population reached 691 million with an urbanization rate of 51.27%. Urbanization level is expected to increase to 70% in China in 2030, reflecting the projection that nearly 300 million people would migrate from rural areas to urban areas over this period. At the same time, the total fertility rate of China’s population is declining due to the combined effect of economic growth, environmental carrying capacity, and modern social consciousness. The Chinese government has loosened its “one-child policy” gradually by allowing childbearing couples to have the second child as long as either of them is from a one-child family. In such rapidly developing country, the natural growth and spatial migration will consistently reshape spatial pattern of population. An accurate prediction of the future spatial pattern of population and its evolution trend are critical to key policy-making processes and spatial planning in China including urbanization, land use development, ecological conservation and environmental protection. In this paper, a top-down method is developed to project the spatial distribution of China’s future population with considerations of both natural population growth at provincial level and the provincial migration from 2010 to 2050. Building on this, the spatial pattern and evolution trend of Chinese provincial population are analyzed. The results suggested that the overall spatial pattern of Chinese population will be unlikely changed in next four decades, with the east area having the highest population density and followed by central area, northeast and west area. Four provinces in the east, Shanghai, Beijing, Tianjin and Jiangsu, will remain the top in terms of population density in China, and Xinjiang, Qinghai and Tibet will continue to have the lowest density of population. We introduced an index system to classify the Chinese provinces into three categories in terms of provincial population densities: Fast Changing Populated Region (FCPR), Low Changing Populated Region (LCPR) and Inactive Populated Region (IPR). In the FCPR, China’s population is projected to continue to concentrate in net immigration leading type (NILT) area where receives nearly 99% of new accumulated floating population. Population densities of Shanghai, Beijing, Zhejiang will peak in 2030, while the population density in Guangdong will keep increasing until 2035. Net emigration leading type (NELT) area will account for 75% of emigration population, including Henan, Anhui, Chongqing and Hubei. Natural growth will play a dominant role in natural growth leading type area, such as Liaoning and Shandong, because there will be few emigration population. Due to the large amount of moving-out labors and gradually declining fertility rates, population density of the LCPR region exhibits a downward trend, except for Fujian and Hainan. The majority of the western provinces will be likely to remain relatively low population density, with an average value of no more than 100 persons per km2.
Key words: China; provincial; population; urbanization; migration; spatial pattern; natural growth
DENG Yu , LIU Shenghe , CAI Jianming , LU Xi , Chris P NIELSEN . Spatial pattern and its evolution of Chinese provincial population: Methods and empirical study[J]. Journal of Geographical Sciences, 2015 , 25(12) : 1507 -1520 . DOI: 10.1007/s11442-015-1248-x
Table 1 Main indicators of population forecasting by the UN |
| 2010 | 2015 | 2020 | 2025 | 2030 | 2035 | 2040 | 2045 | 2050 | |
|---|---|---|---|---|---|---|---|---|---|
| Total population | 133972.49 | 136974.3 | 138779.2 | 139525.6 | 139307.6 | 138158.8 | 136090.6 | 133176.8 | 129560.4 |
| Urban population | 669192.56 | 761579 | 846363 | 911804 | 957649 | 984446 | 998581 | 1004090 | 1001612 |
| Urbanization rate | 0.49 | 0.55 | 0.61 | 0.65 | 0.69 | 0.71 | 0.73 | 0.75 | 0.77 |
Data source: World Population Prospects, the 2010 Revision |


Table 2 Net-migration population to the urban area at national level |
| Year | Registered residence (million) | ||||||
|---|---|---|---|---|---|---|---|
| Total | Urban area | Rural area | |||||
| Subtotal | Intra- province | Inter- province | Subtotal | Intra- province | Inter- province | ||
| Up to 2010 | 212.25 | 83.85 | 70.39 | 13.46 | 128.4 | 75.25 | 53.15 |
| Up to 2000 | 98.12 | 43.39 | 37.93 | 5.46 | 54.74 | 35.44 | 19.30 |
| 2000-2010 | 114.13 | 40.47 | 32.46 | 8.01 | 73.66 | 39.81 | 33.85 |
Data source: The 5th National Population Census, 2000, and the 6th National Population Census, 2010 |
Table 3 Definitions of variables or parameters used in this analysis |
| Parameters or variables | Definition |
|---|---|
| Rn,t | Population natural growth rate in province n for year t |
| Pn,t | Population amount for natural growth in province n for year t |
| P'n,t | Improved population amount for natural growth in province n for year t |
| UP | Total urban population |
| ΔMR | Migration amounts from rural to urban area |
| ΔNM | Net inter-provincial migration matrix |
| TPM | Net transition probability matrix |
| M | Migration amount |
| ΔM | Total net migration amounts |
| δn, t | Difference between provincial population projection and the data from the UNs in province n for year t |
| TPn,t | Total population amount in province n for year t |
| Sn,t | Area of province in province n for year t |
| DPn,t | Population density of province in province n for year t |
| An | Variance of population density of province n |
| Bn | Ratio of new accumulated net-migration to maximum of the total population in province n |
| Cn | Ratio of new accumulated net-migration to maximum of natural growth population of province n |


Table 4 A comparison between reported population and projected population in 2010 |
| Province | Population 2000 (million) | Decade natural growth rate | Projected natural growth population 2010 (million) | Reported net migration 2000-2010 number (million) | Projected population 2010 (million) a | Reported population 2010 (million) | Percentage of projected population error b |
|---|---|---|---|---|---|---|---|
| Beijing | 13.82 | 1.81 | 14.07 | +4.40 | 18.47 | 19.61 | 5.81% |
| Tianjin | 10.01 | 1.80 | 10.19 | +2.07 | 12.26 | 12.94 | 5.26% |
| Hebei | 67.44 | 5.99 | 71.48 | -1.81 | 69.67 | 71.85 | 3.03% |
| Shanxi | 32.97 | 5.90 | 34.91 | -0.51 | 34.4 | 35.71 | 3.67% |
| Inner Mongolia | 23.76 | 4.03 | 24.72 | +0.33 | 25.05 | 24.71 | 1.38% |
| Liaoning | 42.38 | 1.11 | 42.85 | +0.09 | 42.94 | 43.75 | 1.85% |
| Jilin | 27.28 | 2.33 | 27.91 | -0.62 | 27.29 | 27.46 | 0.62% |
| Heilongjiang | 36.89 | 2.35 | 37.76 | -1.26 | 36.5 | 38.31 | 4.72% |
| Shanghai | 16.74 | 1.01 | 16.91 | +5.73 | 22.64 | 23.02 | 1.65% |
| Jiangsu | 74.38 | 2.34 | 76.12 | +3.50 | 79.62 | 78.66 | 1.22% |
| Zhejiang | 46.77 | 4.44 | 48.85 | +7.76 | 56.61 | 54.43 | 4.01% |
| Anhui | 59.86 | 6.32 | 63.64 | -4.81 | 58.83 | 59.50 | 1.13% |
| Fujian | 34.71 | 6.05 | 36.81 | +1.31 | 38.12 | 36.89 | 3.33% |
| Jiangxi | 41.40 | 8.08 | 44.74 | -1.76 | 42.98 | 44.57 | 3.57% |
| Shandong | 90.79 | 5.27 | 95.57 | -0.91 | 94.66 | 95.79 | 1.18% |
| Henan | 92.56 | 5.42 | 97.58 | -5.44 | 92.14 | 94.02 | 2.00% |
| Hubei | 60.28 | 2.93 | 62.05 | -2.68 | 59.37 | 57.24 | 3.72% |
| Hunan | 64.40 | 5.35 | 67.84 | -2.55 | 65.29 | 65.68 | 0.59% |
| Guangdong | 86.42 | 7.65 | 93.03 | +5.98 | 99.01 | 104.30 | 5.07% |
| Guangxi | 44.89 | 7.98 | 48.47 | -1.33 | 47.14 | 46.03 | 2.41% |
| Hainan | 7.87 | 9.07 | 8.58 | +0.05 | 8.63 | 8.67 | 0.46% |
| Chongqing | 30.90 | 3.21 | 31.89 | -1.96 | 29.93 | 28.85 | 3.74% |
| Sichuan | 83.29 | 3.03 | 85.81 | -1.38 | 84.43 | 80.42 | 4.99% |
| Guizhou | 35.25 | 8.23 | 38.15 | -2.10 | 36.05 | 34.75 | 3.74% |
| Yunnan | 42.88 | 8.10 | 46.35 | -1.07 | 45.28 | 45.97 | 1.50% |
| Tibet | 2.62 | 11.17 | 2.91 | +0.02 | 2.93 | 3.00 | 2.33% |
| Shaanxi | 36.05 | 4.07 | 37.52 | -0.61 | 36.91 | 37.33 | 1.13% |
| Gansu | 25.62 | 6.38 | 27.26 | -0.80 | 26.46 | 25.58 | 3.44% |
| Qinghai | 5.18 | 9.76 | 5.69 | +0.05 | 5.74 | 5.63 | 1.95% |
| Ningxia | 5.62 | 10.52 | 6.21 | +0.04 | 6.25 | 6.30 | 0.79% |
| Xinjiang | 19.25 | 10.99 | 21.37 | +0.24 | 21.61 | 21.81 | 0.92% |
Note: a Projected population 2010=projected natural growth population 2010+reported migration 2000-2010 number b Percentage of estimated population error = | reported population 2010-projected population 2010| / reported population 2010 Data source: The 5th National Population Census, 2000, the 6th National Population Census, 2010, and China Statistical Yearbook, 2011 |
Table 5 Provincial migration in China |
| Year | Total population (million) | Urban population (million) | Urbanization rate | Growth in urban population (million) | Migration from rural to urban area | Growth in migration of inter-province (million) | ||
|---|---|---|---|---|---|---|---|---|
| Inter- province | Intra- province | Total | ||||||
| 2000 | 1259.95 | 456.35 | 0.36 | - | - | - | - | - |
| 2010 | 1339.72 | 669.19 | 0.50 | 212.84 | 34.23 | 40.26 | 74.49 | 46.07 |
| 2015 | 1369.74 | 761.58 | 0.56 | 92.39 | 12.74 | 14.98 | 27.72 | 17.34 |
| 2020 | 1387.79 | 846.36 | 0.61 | 84.78 | 11.69 | 13.75 | 25.42 | 15.91 |
| 2025 | 1395.26 | 911.80 | 0.65 | 65.44 | 6.01 | 7.07 | 13.08 | 8.19 |
| 2030 | 1393.08 | 957.65 | 0.69 | 45.85 | 2.11 | 2.48 | 4.59 | 2.87 |
| 2035 | 1381.59 | 984.45 | 0.71 | 26.80 | 0.00 | 1.61 | 1.61 | 0.00 |
| 2040 | 1360.91 | 998.58 | 0.73 | 14.14 | 0.00 | 0.57 | 0.57 | 0.00 |
| 2045 | 1331.77 | 1004.09 | 0.75 | 5.51 | 0.00 | 0.11 | 0.11 | 0.00 |
| 2050 | 1295.60 | 1001.61 | 0.77 | -2.48 | 0.00 | 0.00 | 0.00 | 0.00 |
Data source: World Population Prospects, the 2010 and 2011 Revisions |
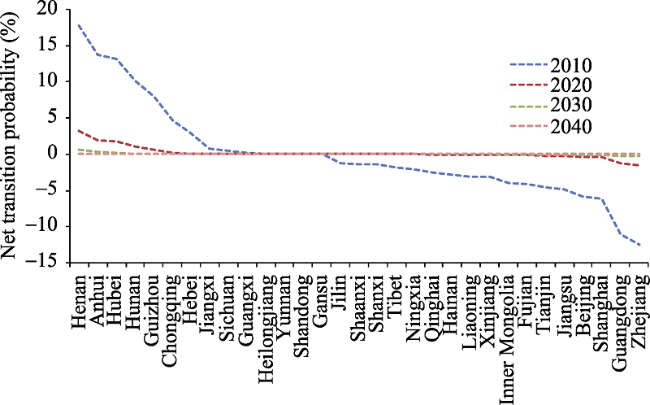
Figure 1 Net transition probability of each province |
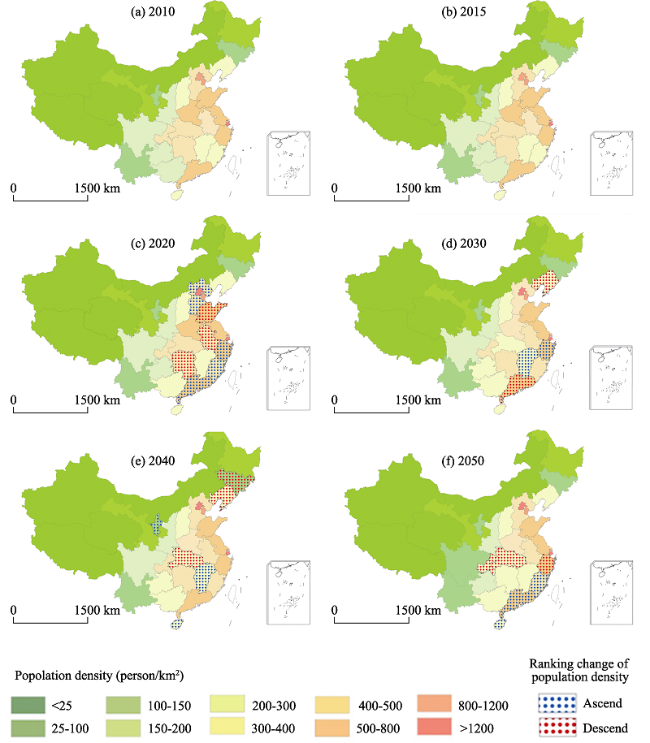
Figure 2 Provincial population density and its ranking change in 2010-2050 |
Table 6 Regional type and its characters of spatial pattern |
| Regional type | Criterion | Ratio of new accumulated floating population (%) | Ratio of new accumulated natural population growth (%) | Province | |||
|---|---|---|---|---|---|---|---|
| Class | Sub-classes | A | B | C | |||
| Fast Changing Populated Region | Net immigration leading type | A>10 | b>5% | c>>1 | 99 | 18 | Beijing, Tianjin, Jiangsu, Shanghai, Zhejiang, Guangdong |
| Net emigration leading type | B<-5% | c<<-1 | -75 | 14 | Henan, Anhui, Chongqing, Hubei | ||
| Natural growth leading type | b≈0% | |c|≈0 | -1 | 6 | Liaoning, Shandong | ||
| Low Changing Populated Region | Net immigration type | 5<a<10 | 0<b<5% | 0<c<1 | 1 | 5 | Fujian, Hainan |
| Net emigration type | -5%<b<0 | -1<c<0 | -18 | 31 | Hebei, Shanxi, Jilin, Heilongjiang, Hunan, Jiangxi, Guangxi, Sichuan, Shaanxi | ||
| Inactive Populated Region | a<5 | 0<b<5% | |c|≈0 | -6 | 26 | Guizhou, Yunnan, Ningxia, Gansu, Inner Mongolia, Xinjiang, Qinghai, Tibet | |
Note: A represents variance of population density change; B denotes the ratio of new accumulated net-migration to maximum of total population amount; C demonstrates the ratio of new accumulated net-migration to maximum of natural growth population. |
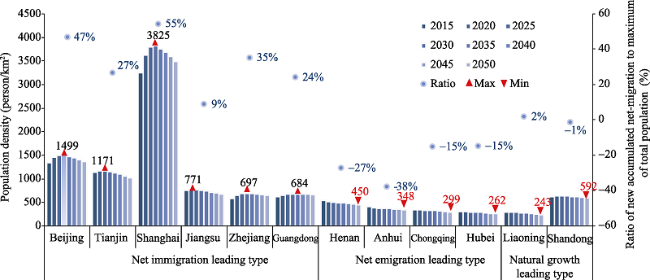
Figure 3 Population densities forecasting for fast changing populated region in 2010-2050 Note: “—” denotes there’s net emigration population |
The authors have declared that no competing interests exist.
| 1 |
|
| 2 |
|
| 3 |
|
| 4 |
|
| 5 |
|
| 6 |
|
| 7 |
|
| 8 |
|
| 9 |
|
| 10 |
|
| 11 |
|
| 12 |
|
| 13 |
|
| 14 |
Nakicenovic, 2000. Special Report on Emissions Scenarios, IPCC, Geneva and Cambridge University Press.
|
| 15 |
|
| 16 |
|
| 17 |
|
| 18 |
|
| 19 |
|
| 20 |
|
| 21 |
|
/
| 〈 |
|
〉 |