Research Articles

Land use/land cover classification and its change detection using multi-temporal MODIS NDVI data

  • M USMAN 1 ,
  • R LIEDL 1 ,
  • M A SHAHID 2 ,
  • A ABBAS 3, 2
Expand
  • 1. Institute for Groundwater Management, TU Dresden, 01069 Dresden, Germany
  • 2. University of Agriculture, Faisalabad, Pakistan
  • 3. Leibniz Centre for Agricultural Landscape Research (ZALF), Eberswalder Str. 84, 15374, Müncheberg, Germany;

Received date: 2014-11-08

  Accepted date: 2015-06-10

  Online published: 2015-12-31

Copyright

Journal of Geographical Sciences, All Rights Reserved

Abstract

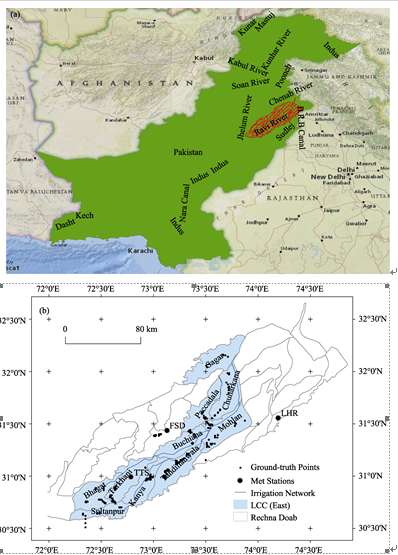
Detailed analysis of Land Use/Land Cover (LULC) using remote sensing data in complex irrigated basins provides complete profile for better water resource management and planning. Using remote sensing data, this study provides detailed land use maps of the Lower Chenab Canal irrigated region of Pakistan from 2005 to 2012 for LULC change detection. Major crop types are demarcated by identifying temporal profiles of NDVI using MODIS 250 m × 250 m spatial resolution data. Wheat and rice are found to be major crops in rabi and kharif seasons, respectively. Accuracy assessment of prepared maps is performed using three different techniques: error matrix approach, comparison with ancillary data and with previous study. Producer and user accuracies for each class are calculated along with kappa coefficients (K). The average overall accuracies for rabi and kharif are 82.83% and 78.21%, respectively. Producer and user accuracies for individual class range respectively between 72.5% to 77% and 70.1% to 84.3% for rabi and 76.6% to 90.2% and 72% to 84.7% for kharif. The K values range between 0.66 to 0.77 for rabi with average of 0.73, and from 0.69 to 0.74 with average of 0.71 for kharif. LULC change detection indicates that wheat and rice have less volatility of change in comparison with both rabi and kharif fodders. Transformation between cotton and rice is less common due to their completely different cropping conditions. Results of spatial and temporal LULC distributions and their seasonal variations provide useful insights for establishing realistic LULC scenarios for hydrological studies.

Cite this article

M USMAN , R LIEDL , M A SHAHID , A ABBAS . Land use/land cover classification and its change detection using multi-temporal MODIS NDVI data[J]. Journal of Geographical Sciences, 2015 , 25(12) : 1479 -1506 . DOI: 10.1007/s11442-015-1247-y

1 Introduction

Land cover is the most important property of earth’s surface defining its physical condition and biotic component; whereas land use is the modification of land cover as per human needs and actions (Prakasam, 2010). Similarly, identifying these modifications in Land Use/Land Cover (LULC) over times and not over times is known as its change detection (Anderson, 1977). Rapid changes in LULC are observed throughout the world especially in developing countries due to their heavy reliance on agricultural production and increasing population. These changes necessitate the availability of improved and updated LULC datasets (Wardlow et al., 2007) for effective planning and production management, thus facilitating both farmers and policy makers (Liang et al., 2013).
Use of LULC data is highly acknowledged for water resources management (Schilling et al., 2008), through their extensive applicability for hydrological modeling studies. Water accounting is essential input in hydrological modeling and its accurate assessment is only possible with precise LULC mapping (Dappen et al., 2008; Molden, 1997). Moreover, information on areal extent of crops (especially irrigated crops), their types, and locations is very critical for estimating crop consumptive water use having varying crop water demand (Zheng and Baetz, 1999). In addition, as the parameters of lumped hydrological models cannot explicitly account for the variability within individual sub-basins in watershed due to missing spatial input data, this issue can be handled through the use of distributed models. In this case, impacts of LULC change represent the overall change as well as its spatial distribution (Kimaro et al., 2005).
Conventionally, LULC data in many developing countries including the current study region is available without much detail on their spatial distribution. The use of these data does not yield realistic LULC scenarios, thus leading to fussy inferences regarding management of total available water resources in different regions. This increasing demand for LULC information due to its ability in capturing spatial distribution at higher resolutions cannot be fulfilled through intensive ground surveys. Two facts are noteworthy in this regard. Firstly, the spatio-temporal changes of LULC are extremely quick particularly for irrigated areas which are beyond the scope of ground surveys. Secondly, the ground surveys are comparatively expensive, as well. This situation demands development of modern methodologies for collection and estimation of different LULC data from larger areas within short time durations (Osborne et al., 2001).
The deficiency in LULC data is overcome by the introduction of modern remote sensing data for agriculture use. Use of satellite remote sensing data is in practice since the 1970s in monitoring LULC changes at coarser spatial scales (Shao et al., 2001). Nevertheless, its use in irrigated agriculture has gained much popularity in recent years. For example, extensive research work has been done to map rice cultivated areas worldwide in the late 1980s and early 1990s for its use in climatic and trace gas emission studies. These datasets were available at coarser spatial resolution (0.5º to 5º) (Matthews et al., 1983; Oslon, 1994). Mapping of global rice area at a spatial scale of 5 arc minutes (Leff et al., 2004) and rice mapping for south Asian countries using MODIS data are the new additions in recent past in this field (Xiao et al., 2006). Apart from rice mapping, several land cover databases have also been developed. These databases classify target areas into a number of classes of interest. The most recent development in this regard is the preparation of global land cover map by Gong et al. (2013) using 30 m × 30 m Landsat Thematic Mapper (TM) and Enhanced Thematic Mapper Plus (ETM+) data. Table 1 presents a brief overview of some prominent local/regional land cover datasets developed over time.
Table 1 Summary of selected regional to country level Land Use/Land Cover datasets
Sr. No Name of the dataset Data description Source Coverage/
Spatial scale
1 FAOSTAT Agricultural lands http://faostat3.fao.org/home/E Country level
2 FORIS Inland waters, forest and woodland http://www.fao.org/forestry/site/fra/en Country level
3 GLCC Built-up areas, water resources, barren or sparsely vegetated areas, grasslands, open shrub lands, forests http://edc2.usgs.gov/glcc/glcc.php 1 km × I km
4 GLCC-2000 Forests, cultivated and managed areas, bare areas, water bodies, urban and built-up areas http://forobs.jrc.ec.europa.eu/ 1 km × 1 km
5 MOD12Q1 Land Cover and Land Cover Dynamics products Land cover change vectors http://modis.gsfc.nasa.gov/about/ 500 m × 500 m
6 GISS Forests, cultivated land and grasslands http://data.giss.nasa.gov/landuse/ 1o (≈ 111 km)
7 GLCF Land tree cover, forest cover change, Geo cover http://glcfapp.glcf.umd.edu:8080/esdi/index.jsp 500 m × 500 m
8 PELCOM Coniferous, deciduous and mixed forests, grassland,
rainfed and irrigated arable land, perennial crops, shrub, barren land, ice and snow cover, wetlands, inland waters, sea and urban area
www.geo-informatie.nl/projects/pelcom/public/index.htm 1 km × 1 km
(Covers only European countries)
9 Global land cover map Cultivated areas, built-up lands, forests, barren lands, etc. Yu et al. (2013); Gong et al. (2013) 30 m × 30 m
The major limitations of using many of these datasets are their coarser spatial resolution and missing details on LULC at local or sub-basin level (Portmann et al., 2010) being only suitable at regional or global level. Moreover, some crop-specific land use maps do not cover the current study region including rice maps developed by Xiao et al. (2006) and Shao et al. (2001). In addition, regional LULC mapping done in the 1970s and 1980s (Wilson and Henderson-Sellers, 1985) is very old and based on diverse data sources. The relatively newer mapping of different LULC in Indus Basin has been carried out for the year 2007 by Cheema and Bastiaanssen (2010) at a spatial resolution of 1 km × 1 km using Satellite Probatoire d’Observation delaTerre (SPOT) vegetation data. At this spatial resolution, problems may arise for complex cropping which may not be well-represented even at a spatial resolution of 1 km × 1 km. Under these circumstances, there is a felt need to develop detailed local LULC data at higher spatial scales for accommodating crop heterogeneity of complex cropping systems prevailing in the Rechna Doab.
To date, a number of earth observation satellites have been launched with varying degrees of resolution, i.e. Advanced Very High Resolution Radiometer (AVHRR) bearing coarse spatial resolution by National Oceanic and Atmospheric Administration (NOAA) while MODIS, Land Satellite (Landsat), and Advanced Space-borne Thermal Emission and Reflection Radiometer bear fine resolutions (ASTER) (Lu et al., 2013; Xiao et al., 2006). Some pros and cons are associated with each type of program. Only few images are available from Landsat per year, while ASTER charges fee for retrieving data. Many studies on LULC mapping have been carried out using a single-date imagery acquired from medium-to-higher resolution optical sensors such as ASTER, Landsat Thematic Mapper (TM), and SPOT (Niu et al., 2012; Fisher, 2010; Mitrakis et al., 2011). However, the temporal coverage of detailed LULC classes is still unexplored and is accomplishable by using images from MODIS that provides cost-free data including NDVI data after each 8 to 16 days at a higher spatial resolution of 250 m × 250 m. This resolution is high enough in capturing almost all major crop classes in the current study region for precise measurement of crop water requirements and subsequent water allocation planning for various parts of irrigated agricultural regions (Douglas et al., 2013; Jeong et al., 2011; Peng et al., 2011). The LULC mapping results by Cheema and Bastiaanssen (2010) exhibit an overlap of NDVI trends within different classes at certain crop stages thus making classification process tedious due to the use of single day data. This issue complicates further in case of multi-cropping system with varying crop scheduling (Gumma et al., 2011). Thus multi-temporal NDVI data not only facilitate classification process but also help in identifying various dates of crop stages within a growing season (Julien and Sobrino, 2009). With this background, this particular study presents a methodology for the classification of major LULC classes within complex cropping system of Lower Chenab Canal (LCC), Punjab, Pakistan’s irrigated areas by combining satellite-derived NDVI time series data with 250 m × 250 m spatial resolution as well as the ground information and agronomist opinion on phenology of the crops. The information is applied to identify different cropping patterns for each cropping season from year 2005 to 2012. This information is further used for assessing real patterns of water use along with exploring different LULC change scenarios for major crops by evaluating maximum flexibility of change within the study period. The specific objectives of this study are:
(1) Classification of major LULC and their accuracy assessment in complex irrigated lands of LCC at a higher spatial resolution.
(2) Study of relationship of orography and climatic factors with NDVI and estimation of areal extents of different LULC classes for individual cropping seasons.
(3) Detection of spatial and temporal LULC changes for exploring maximum flexibility of change for major classes. (or: in case of major crops).
The remainder of the manuscript is divided into three main sections. The first section describes the study area, Lower Chenab Canal (LCC), Punjab, Pakistan. The next section presents details on different input data types and methodology for LULC classification. The last section deals with the discussion on classification results, its accuracy assessment and other details including areal coverage and change detection for major LULC classes and its utilization for LULC scenarios generation.

2 Materials and methods

2.1 Study area

The LCC irrigation system was designed in 1892-1898 in the Punjab Province, Pakistan. Its command area is about 1.24 million ha (Mha) situated in Rechna Doab, a land between rivers Ravi and Chenab. This area lies between 30°36'-32°09'N and 72°14'-77°44'E. The whole LCC area is divided into two parts, i.e., LCC East and LCC West. This study focuses on LCC East mainly comprising of Faisalabad (FSD) and Toba Tek Singh (TTS) districts. Administratively, the area is further divided into subunits called irrigation subdivisions (Figure 1) supervised by a sub-engineer. Ten irrigation subdivisions are studied in the study area for this research. A canal network supplies irrigation water to each subdivision separately. As water allocation to each irrigation subdivision varies within LCC, there is tremendous variability of groundwater and surface water use.
Figure 1 Map of LCC (East), Rechna Doab, Punjab, Pakistan and ground truthing points
The climate of the area is characterized by large seasonal fluctuations in temperature and rainfall. The summer is hot lasting from April through October with temperatures between 21-50℃, whereas winter (October-April) temperature ranges between 15-27℃. The area is sub-tropical in nature with mean annual precipitation varying from 290 mm in the South to 1046 mm in the North. The highest rainfall occurs during the monsoon season in July-August accounting for about 60% of the total average annual rainfall.

2.2 Cropping calendar in LCC

LCC has two distinct growing seasons, i.e., rabi and kharif respectively falling in winter and summer. Wheat and rabi fodder (mainly barseem and oat) are grown in rabi, whereas rice, cotton and kharif fodder (mainly sorghum, maize and millet) are grown in kharif season. Sugarcane is the annual crop which is mainly cultivated in September and in February as well. Figure 2 depicts the crop calendar of major crops grown in LCC.
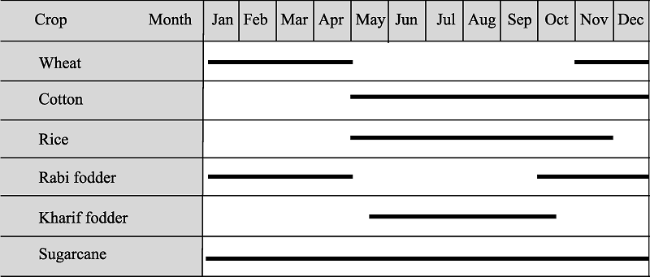
Figure 2 Crop calendar adopted in LCC

2.3 Classification, accuracy assessment and change detection of LULC

Vegetation indices provide possibility to estimate vegetation cover based on large differences of reflectance between the near infrared (NIR) and the red (R) bands (Tucker, 1979). These indices include NDVI and Enhanced Vegetation Index (EVI). NDVI is more sensitive to chlorophyll activity, whereas EVI is linked with vegetation structural variation and hence useful in mapping of tropical forests (Gao et al., 2000). The present work employs NDVI data for the estimation of green biomass of different irrigated crops in the study area. Although NDVI does not directly classify different LULC rather time series NDVI patterns help in the demarcation of different classes based on their unique behavior in terms of peak trends and duration of phenological stages within a specific agro-ecosystem (Shi et al., 2013; Julien and Sobrino, 2009). According to Peng et al. (2011) and Morton et al. (2006), land cover changes and their patterns could be successfully mapped with a 250 m × 250 m spatial resolution although the extraction of these parameters at this spatial resolution is somewhat unexplored (Barraza et al., 2013). Therefore, geometrically- and radiometrically-corrected NDVI images were retrieved from http://glovis.usgs.gov/ at a spatial resolution of 250 m × 250 m. This portal provides cost-free and duly corrected images from board-Terra and Aqua satellites after each 16 days but with a difference of 8 days. Thus, NDVI data for the whole study area for the period October, 2005 to March, 2012 were retrieved successfully.
The retrieved data were preprocessed including image-sub-setting and image-enhancement. Once the product was ready for further processing and analysis, a hierarchical crop classification approach was utilized. As a first step in this approach, Iterative Self Organizing Data Analysis Technique (ISODATA) of unsupervised classification (Tou and Gonzalez, 1974) was employed to reduce the spectral confusion among different LULC classes. This technique disintegrates the whole image into clusters and each pixel in the image is assigned to a particular cluster based on its arbitrary mean vector value. This algorithm also permits clusters to change from one iteration to the next, by merging, splitting and deleting. Finally, all pixels are re-classified into the revised set of clusters, and the process continues till there is no significant change in the cluster statistics or maximum number of iteration is reached (Campbell, 2002). For this study, LULC classification was performed with 99% convergence threshold and 100 iterations. Following ISODATA algorithm, further refining of results was facilitated by seeking agronomists’ opinion considering different cropping patterns in the study area. NDVI temporal profiles were utilized to merge some classes and also to identify crop growth stages e.g., sowing and harvesting. Significant increase in NDVI represented initial crop growth stage while decrease in NDVI was identified as the end of growing season. Separate LULC classes were generated for both cropping seasons to cater for various crops grown during these seasons and to facilitate LULC change detection from one cropping season to the other. The details of the classification methodology are portrayed in Figure 3.
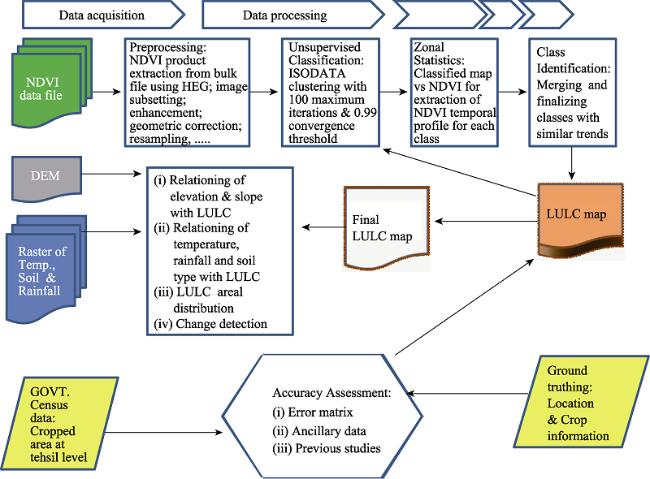
Figure 3 Flow diagram showing methodological and analytical steps
To explore the accuracy of the classification results, classical confusion matrix approach was employed along with comparison of results with ancillary dataset and previous empirical work in the study area. As confusion matrix approach uses reference data and precise information about the ground situation (Latifovic and Olthof, 2004), therefore, ground truthing points and polygons of different crops were ascertained with the help from water management officials within each district. GPS positioning of each field and crop-related information were recorded using a pre-designed questionnaire in a face-to-face discussion with farmers and experts (Figure 4).
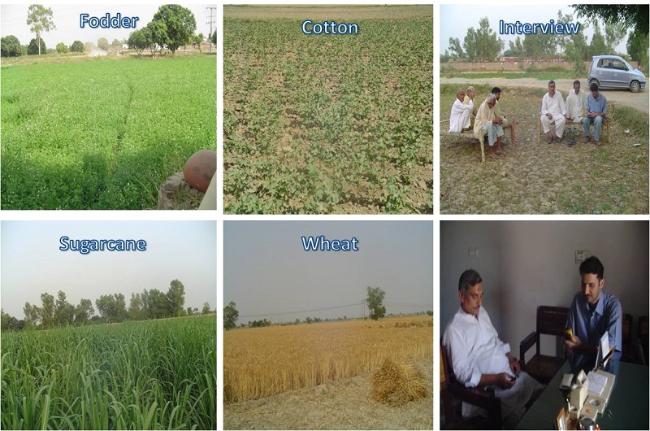
Figure 4 Highlights of the field visit in the study area
Similarly, for getting ancillary data on cropping area within the study area was gathered from relevant section of the provincial agriculture department. This department maintains complete record of cropped area under different crops at sub-district level (Tehsil). The reliability of estimates was corroborated by comparing area fractions of various crops at tehsil level with remote sensing data and statistically checked by coefficient of determination (R2). Another accuracy assessment was performed by comparing the classification results with the findings of relevant work in the study area.
To evaluate the effects of physical conditions (e.g. soil type, elevation, slope, temperature and precipitation) on major LULC classes, soil-type maps were obtained from the local office of International Water Management Institute (IWMI). The overlay analysis was performed between classified maps and soil maps using ArcGIS. Similarly, the effect of elevation and slope on LULC was accomplished using digital elevation model (DEM) with a resolution of 90 m acquired from http://glcf.umiacs.umd.edu/data/srtm/. Data regarding rainfall and temperature were collected for a number of climatic stations from Pakistan Meteorological Department (PMD). Average values of elevation, slope, temperature and rainfall were extracted for individual major LULC class to examine the spatial variability of these parameters in the study area.
Finally, areal distribution of each LULC class was calculated for both cropping seasons over the whole study period. Detection of spatial and temporal LULC changes was carried out for various crops to explore maximum range in change. Temporal changes were explored on the basis of overall difference of areas for various LULC between two particular cropping years, while spatial changes were explored on pixel-by-pixel scale to evaluate intra-class changes during these cropping years.

3 Results and discussion

3.1 Classification of major LULC

About 15 crop classes were identified by visualizing the trends of NDVI temporal profiles at first which reduced to nine by merging classes with similar NDVI trends keeping in view the crop calendar and expert’s opinion. These classes are treated separately for both rabi and kharif cropping seasons. For rabi, wheat is the dominant crop cultivated on a vast area along with fodder (mainly berseem and mustard) while other crops are sugarcane, sparsely-cultivated orchards and vegetables. Demarcation of rabi fodders could not be attained due to their overlapping growth period with dominating wheat crop and hence NDVI exhibited higher overall values and similar trends for fodders and wheat. Furthermore, cultivated area for individual fodder is not available from any source to ensure maximum accuracy of classification. Resultantly, all fodders are merged to one class and hence four classes are demarcated for rabi seasons comprising of residence/fallow/barren, wheat, sugarcane and rabi fodder. Water is hardly distinguishable into a separate class due to its presence in relatively narrow irrigation channels under a spatial resolution of 250 m × 250 m. Employing ISODATA clustering algorithm at the 250 m × 250 m spatial resolution, five LULC classes were demarcated for kharif season including rice, cotton, sugarcane, kharif fodder and residence/fallow/barren. A three period moving average filtering technique suggested by Reed et al. (1994) is used for smoothening of NDVI trends for each LULC class (Figure 5).
Two peaks and two depressions in one cropping year are observed in Figure 5. The first peak corresponds to the maximum growth period of wheat during February to March. The second peak corresponds to rice at its maximum growth in the mid of August. The two depressions appear at the end of April (at wheat harvesting) and before the start of November (before wheat sowing). The individual crops’ starting time and crop-cycle length can be visualized easily from NDVI trends as well. Wheat sowing starts after the second week of November in the study area while NDVI becomes maximum around mid of February (Wajid et al., 2007). Berseem (rabi fodder) is cultivated in late November or in the beginning of December and its growth remains suppressed initially and then attains maximum height in late February and early March due to relatively increased temperature and rainfall. Sugarcane is mostly cultivated in September and sometimes also in February. Its trend remains static and low during the rabi season and attains higher values in kharif season due to increased vegetative growth. The ‘Residence/Fallow/Barren’ class has the least NDVI values throughout the year owing to low reflectance, which is in accordance with the previous findings by Pettorelli (2013). He found very low positive values of NDVI (0.1 or less) for barren areas of rock, sand or snow; and 0.1-0.2 for soils. Most vegetation has moderate NDVI values (~0.2-0.5) while dense forests show high NDVI values (~0.6-0.9). The class ‘rice’ in kharif season has a very unique trend. The initial part is a bit slack and lengthy because of rice nursery growth from end of May to mid of June; whereas the later part attains maximum height due to rapid rice growth by the end of August.
Sugarcane and cotton are difficult to demarcate due to very similar NDVI trends seemingly because of September-sown sugarcane’s height and rapid vegetative growth of cotton during mid and later stages of growing season (Wajid et al., 2010). Nevertheless, difference in sowing time of cotton from late May to mid-June facilitated the classification process and its demarcation from sugarcane.
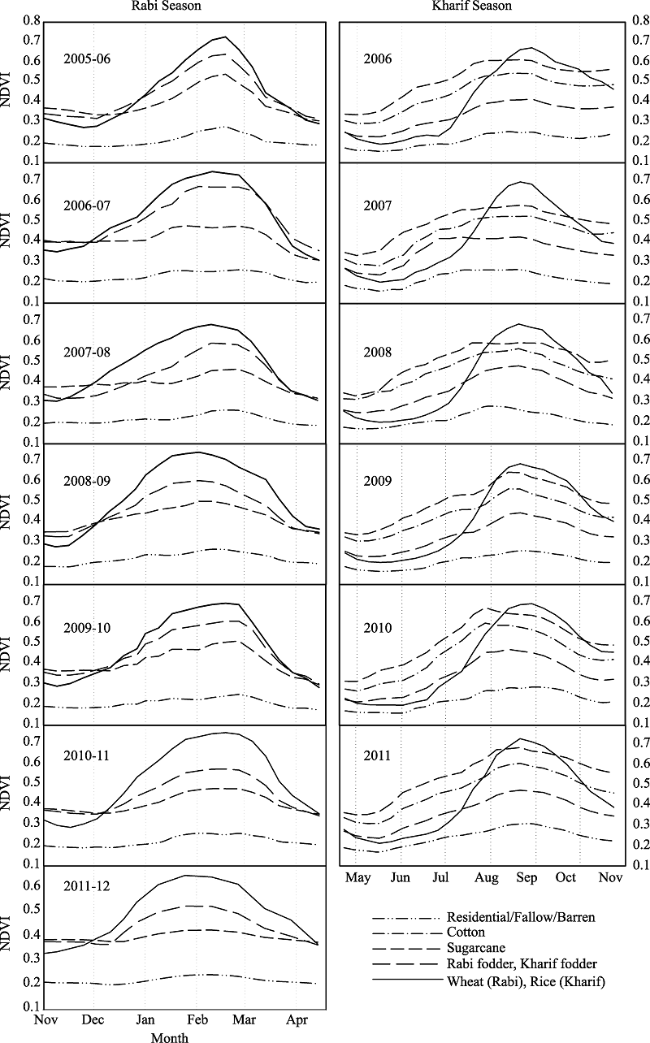
Figure 5 Mean NDVI temporal trends for major crops: rabi 2005-06 to rabi 2011-12
Results show that during different cropping years, a number of cropping patterns are adopted by the farmers in LCC, which include ‘Wheat-Rice-Wheat’, ‘Wheat-Cotton-Wheat’, ‘Wheat-Sugarcane-Wheat’, ‘Wheat-Kharif Fodder-Wheat’, and ‘Rice-Kharif Fodder-Rice’. This scheme of cropping pattern is comparable with the actually prevailing system within the study area as explored during field visits.

3.2 Assessing classification accuracy

Accuracy assessment is an important component of LULC classification studies. The classification process is only considered to be reliable after meeting some accuracy checks as LULC maps derived from satellite images may contain some errors due to number of factors ranging from techniques in classification to satellite-data retrieval methods. We have employed a number of methods to ensure accuracy including error matrix, ancillary dataset and comparison with previous localized study.
3.2.1 Error matrix
Error matrix (also known as confusion matrix, correlation matrix or covariance matrix) is the most common and popular means to present accuracy results (Lu et al., 2013; Shi et al., 2013; Campbell, 2002). Many statistical measures of thematic accuracy can be drawn from the error matrix including overall accuracy, percentage of commission and omission error and the kappa coefficient (K) which address the error caused by chance (Congalton and Green, 1999). Commission error (i.e. user’s accuracy) and omission error (i.e. producer’s accuracy) take into account the probability of a particular cell value being similar with actual ground information and generated classified information, and vice versa, respectively. The overall classification accuracy summarizes the overall agreement or disagreement between classified and reference ground information about land use (Jensen, 1996) and is derived by using the following relationship:
Error matrices are constructed for the classified and actual ground information for different LULC classes. These error matrices reveal that overall accuracy for rabi seasons varies from 79.52% (minimum value) to 87.39% (maximum value) while for kharif seasons, it varies from 76.19% to 80.08%. The overall average accuracy levels for rabi and kharif are 82.83% and 78.21%, respectively. This range of accuracy is in accordance with the findings of Thi et al. (2012) and Wardlow et al. (2007). Moreover, Bastiannssen (1998a) has noted that overall accuracy ranges from 49% to 96% depending on the spatial coverage of satellite information and the size of the field under consideration. The average accuracies for producer and user are 78.62% and 77.87% for rabi and 79.95% and 76.70% for kharif, respectively. User’s accuracy values affirm that 77.87% and 76.70% of all classes identified on the classified map for rabi and kharif, respectively, match with the ground information. On the other hand, the producer’s accuracy values indicate that 78.62% and 79.95% of the actual LULC information matches with the classified results for LULC for rabi and kharif seasons, respectively.
The lowest and highest producer’s accuracy values observed for ‘sugarcane’ are 70.83 % (rabi 2005-06) and 86.15 % (rabi 2010-11). For ‘rabi fodder’ these values are 69.57% (rabi 2006-07) and 78.18% (rabi 2007-08). Lower values of producer’s accuracies in different seasons for ‘sugarcane’ and ‘rabi fodder’ are possibly due to smaller plot sizes given 250 m × 250 m of spatial resolution and mixed cropping pattern. In contrast, wheat is cultivated on large areas and hence has higher accuracy value. For kharif seasons, average producer’s accuracies range between 76.59% for ‘rice’ and 90.24% for ‘residence/fallow/barren’ whereas the values for cotton, sugarcane and kharif fodder are 77.16%, 78.96% and 76.76%, respectively. The lower accuracy values for kharif season also stems due to small plot sizes and blending of pixels due to mixed cropping pattern (Cheema and Bastiaanssen, 2010). The detail of producer’s and user’s accuracies for different LULC classes for each cropping year is presented in Table 2.
Table 2 Summary of producer’s and user’s accuracies for different classes of rabi and kharif seasons
Year &
Accuracy
Season & Class
Producer’s accuracy (%) User’s accuracy (%)
2005-06 2006-07 2007-08 2008-09 2009-10 2010-11 2011-12 Avg. 2005-06 2006-07 2007-08 2008-09 2009-10 2010-11 2011-12 Avg.
Rabi 1 75 83.3 77.8 71.4 81.8 75 75 77.0 64.3 62.5 77.8 62.5 81.8 66.7 75.0 70.1
2 81.3 86.4 85.8 90.5 90.4 91.3 89.5 87.9 77.4 82.1 83.7 83.5 91.2 84.1 88.0 84.3
3 70.8 71.1 81.3 82.5 71.7 76.0 86.2 77.1 75.6 76.2 77.6 81.3 73.3 80.9 82.4 78.2
4 71.4 70.8 73.1 72.0 78.2 69.6 72.3 72.5 76.4 78.0 80.3 84.4 75.4 80.0 78.3 79.0
Kharif 5 88.0 94.7 90.0 86.4 88.2 94.1 90.2 68.8 66.7 69.2 76.0 71.4 80.0 72.0
6 75.6 93.0 74.5 74.5 71.4 74.0 77.2 70.8 72.7 74.5 76.1 83.3 72.5 75.0
7 72.2 72.7 83.3 84.9 84.8 75.7 79.0 76.5 78.4 74.1 71.4 77.8 77.9 76.0
8 76.7 74.5 75.2 73.1 75.0 86.0 76.8 81.2 90.5 86.4 82.9 80.5 87.1 84.7
9 73.7 78.1 77.8 73.0 81.3 75.8 76.6 77.8 73.5 75.7 75.0 74.3 78.1 75.7

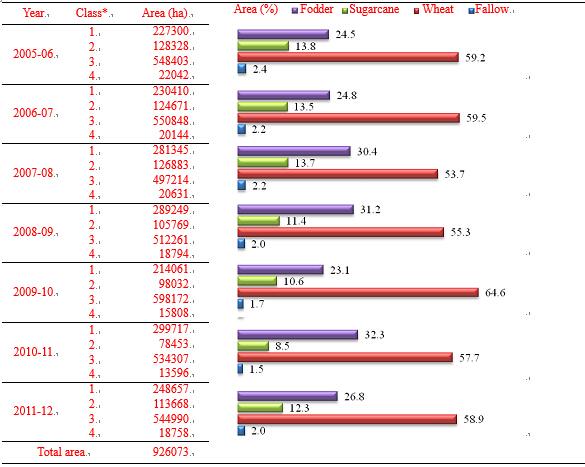
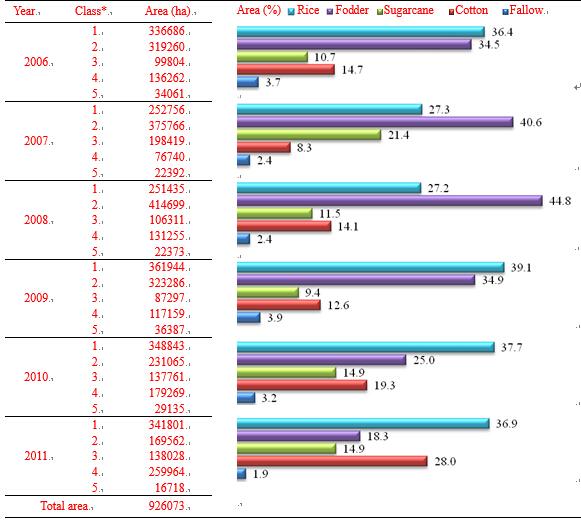
*Numbers in this column represent as follows: 1&5=Residential/Fallow/Barren; 2=Wheat; 3&7=Sugarcane; 4&8= Fodder; 6=Cotton; 9=Rice

The overall classification efficiency provides a crude measure of accuracy (Giri et al., 2005) while accuracy assessment through error matrix depends on sampling points. Fewer sampling points may lead to misspecification of classes (Foody, 2002) which we can diagnose by estimating the kappa coefficient (K) (Congalton, 1996). The value of K incorporates the off-diagonal elements of the error matrices and exhibits agreement after removing the agreement by chance. The value of K for each season is calculated as under and shown in Table 3.
Comparison of estimated average values of K (shown in Table 3) for present study with earlier studies (shown in Table 4) reveals a close match between the two.
Table 3 Summary of seasonal accuracies and K (Kappa coefficient)

Sr. No.

Year
Rabi Season Kharif Season
Avg. Prod. Accur. Avg. User Accur. Overall accuracy K Avg. Prod. Accur. Avg. User Accur. Overall accuracy K
1 2005-06 74.7 73.4 87.4 0.77
2 2006-07 77.9 74.7 79.5 0.66 77.2 75.0 76.2 0.69
3 2007-08 80.6 80.4 83.6 0.74 82.6 76.4 79.3 0.73
4 2008-09 78.0 77.9 81.9 0.71 80.2 76.0 78.1 0.71
5 2009-10 79.5 79.9 81.2 0.71 78.4 76.3 77.0 0.70
6 2010-11 80.8 80.9 83.8 0.75 80.2 77.5 78.6 0.72
7 2011-12 79.0 77.9 82.5 0.74 81.1 79.1 80.1 0.74
Average 78.6 77.9 82.8 0.73 79.9 76.7 78.2 0.71
3.2.2 Ancillary data
Estimated and reported crop area fractions for major crops are measured with the help of remote sensing and ancillary data collected from provincial agriculture department. The estimated area fraction is calculated by dividing the remotely-sensed area for a particular crop in a tehsil by the geographical area of that tehsil. Similarly, reported crop area fractions are measured by dividing each crop’s area in tehsils to their total geographical area. The relationship of reported and estimated crop area fractions for major crops is presented in Figure 6. The distribution of data points shows wheat to be the major crop in rabi occupying major area in all tehsils. A higher value for the coefficient of determination (R2=0.85) shows a higher reliability of this estimation (Figure 6). Other crops in the area include rabi fodder and sugarcane during rabi season. As the cultivation of sugarcane in various tehsils is not so high, most points fall around 0.20. Moreover, as the sugarcane lasts during both seasons, its crop area fraction is calculated for both seasons together having a coefficient of determination equal to 0.75. This relatively small value stems from mixing with other crops due to large pixel size relative to field size along with ancillary data having low standard accuracy.
Table 4 Comparison of accuracy values and K from earlier studies with present study
Sr. No. Classification
accuracy
K Type of data Reference
1 91.5 0.89 RADARSAT Shao et al., 2001
2 77.2 0.736 MODIS Giri et al., 2005
3 84.4-87.1 82.3-83.6 Landsat MSS. ETM+ Reis, 2008
4 77 0.73 SPOT Cheema et al., 2010
5 94 0.93 SPOT Thi et al., 2012
6 78-99 - Landsat Ding et al., 2013
7 84-93 0.78-0.92 Landsat Lu et al., 2013
8 78.2-82.8 0.71-0.73 MODIS Present study
For kharif seasons, the relationship is observed for both cotton and rice. The coefficients of determination for cotton and rice are found to be 0.78 and 0.83, respectively. Almost identical planting dates for various crops during this season make it difficult to discriminate these crops along with mixing of pixels and ancillary data quality. Nevertheless, values of R2 for different crops depict reliable and encouraging results given the complex cropping patterns prevailing in LCC.
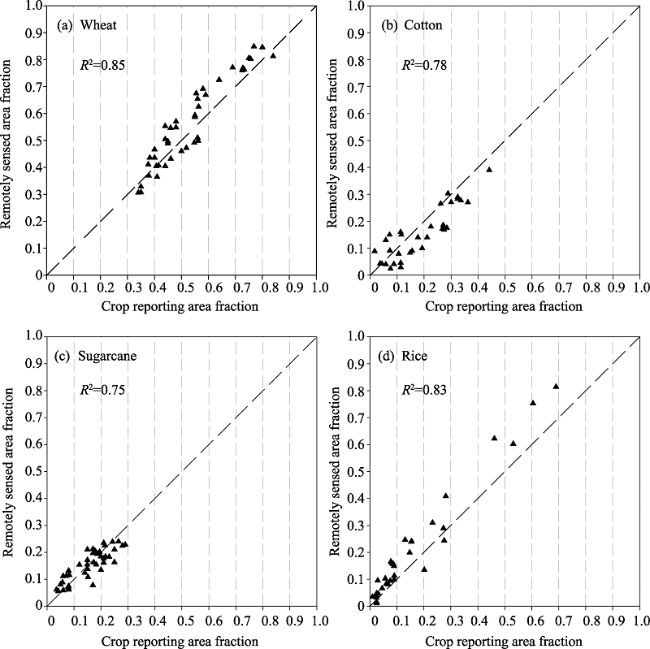
Figure 6 Relationship between reported cropped-area fraction and remotely-sensed cropped-areas fraction for wheat, cotton, sugarcane and rice crops (1:1 Plot)
3.2.3 Comparison with localized study
The third accuracy assessment technique used is the comparison of classification results with a previous localized study. Cheema and Bastiaanssen (2010) conducted a study to classify the whole Indus Basin into different LULC classes for the cropping year 2007. A map of LULC for LCC, being part of Indus Basin, was obtained from the quoted authors. This map is available at 1 km × 1 km spatial resolution with non-separable classes for rabi and kharif seasons (Figure 7). This Figure shows the dominance of arable agriculture in the area. Rice and wheat are dominating crops in the upper parts of the study area during kharif and rabi seasons, respectively. Cotton is dominant in the downstream area along with sugarcane and fodder. The spatial details of areas under different major classes by Cheema and Bastiaanssen (2010) and the current study can be seen in Figure 7.
3.2.4 Orographic and climate effects on LULC
Soil and orography have a great effect on adaptability of LULC in different parts of the world. Similarly, climate change influences the terrestrial biosphere closely linked with hydrological, carbon and energy cycles thus affecting vegetation indices to a great extent (Kim, 2013). Many studies depict this influence in many parts of the world including USA, India, China, Turkey and Indus Basin (Kim, 2013; Fang et al., 2005; Reis, 2008; Cheema and Bastiaanssen, 2010). For the present study, overlay analysis of soil map with LULC distribution revealed increased adaptability of wheat and sugarcane cultivation on moderately-fine to moderately-coarse soils, while rice and cotton have more suitability with moderately-fine and moderately-coarse soils, respectively (Table 5). Rabi and kharif fodders are mostly cultivated on moderately-coarse soils. Slope data from Table 5 indicate that the area is relatively flat with slopes ranging from 1.14% to 2.4%. Rice is dominant at relatively higher slope and cotton at lower slope. The slope decreases from north-east to south-west of LCC. Rice and wheat are cultivated at relatively higher elevations, i.e., 192 m and 187 m, respectively. As a matter of fact, wheat cultivation is common throughout the study area having much concentration in the northern parts. Sugarcane is found to be cultivated at the lowest elevation (169 m) mostly along the areas near river Ravi. There is no significant difference in mean elevation for cultivation of other crops.
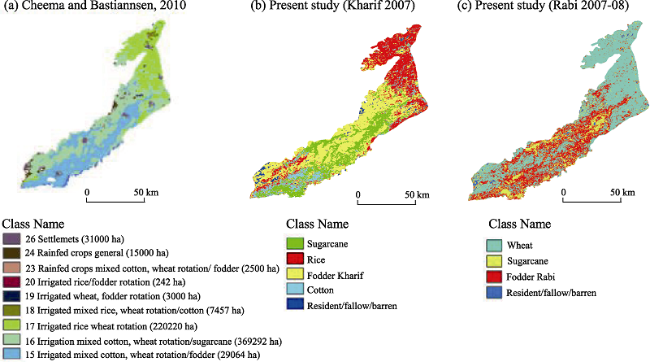
Figure 7 Comparison of crop area estimates with Cheema and Bastiannssen (2010)
Among different climatic factors, rainfall and temperature are more linked with NDVI (Adam Black and Haroon Stephen, 2014; Kim, 2013). Present study investigated the effect of precipitation and temperature on NDVI for major crops in LCC. Temporal information for rainfall and temperature concerning each crop is extracted using zonal statistics function. As given by Figure 8, wheat is sown in the mid of November onward. Relatively higher tem- perature is observed for wheat in the initial stages with little rainfall. Later on, temperature decreases and rainfall increases between the months of February and March, thus causing increase in NDVI values in the middle of wheat growth. Temperature continues to increase towards the end of wheat growth and NDVI values continue to decrease till its harvest in the mid-April onward. These conditions best suit wheat production in the study area as revealed by the local crop experts, who opined that low temperatures at germination would suppress crop growth while high temperatures at mid stages (especially milking stage) would cause crop shriveling. The trends of temperature for cotton and rice crops during kharif are not very different and exhibit less fluctuation throughout the growing period but the major difference is observed in case of rainfall. In the cotton growing areas, less rainfall is observed at germination stages and then smoothly increases resulting into increase in NDVI trends. Completely contrasting situation prevails in rice-growing areas where rainfall is higher at the initial stages of crop growth, lasting till the end of monsoon season. Completely different cropping conditions of rice and cotton in respective areas partially explain variation in growth stages and allied benefits or disadvantages. Plenty of moisture is beneficial for rice cultivation, whereas rainfall at initial stages of cotton would form soil crust which hampers its germination. Similarly, local experts believe that higher temperature with lower precipitation has a detrimental effect on rice growth especially in its early stage while cooler nights towards the crop maturity help improve grain quality. The NDVI trend for sugarcane is very clear and indicates increasing NDVI values with increase in rainfall and vice versa. This NDVI trend is relatively static during winter months mainly due to lower temperature coupled with a smaller amount of rainfall during this time which suppresses sugarcane vegetative activity.
Table 5 Summary of soil texture, elevation and slope for each LULC
Class Name Texture Class Texture Elevation (m) Slope (%)
Wheat Moderately fine/ Moderately-coarse Sandy-clay-loam, clay-loam, silty-clay-loam/sandy-loam,
fine sandy-loam
187 1.98
Rice Moderately-fine Sandy-clay-loam, clay-loam, silty-clay-loam 192 2.40
Cotton Moderately-coarse Sandy-loam, fine sandy-loam 176 1.14
Sugarcane Moderately fine/Moderately-coarse Sandy-clay-loam, clay-loam, silty-clay-loam/sandy-loam,
fine sandy-loam
169 2.00
Rabi fodder Moderately-coarse Sandy-loam, fine sandy-loam 175 1.41
Kharif fodder Moderately-coarse Sandy-loam, fine sandy-loam 179 1.91
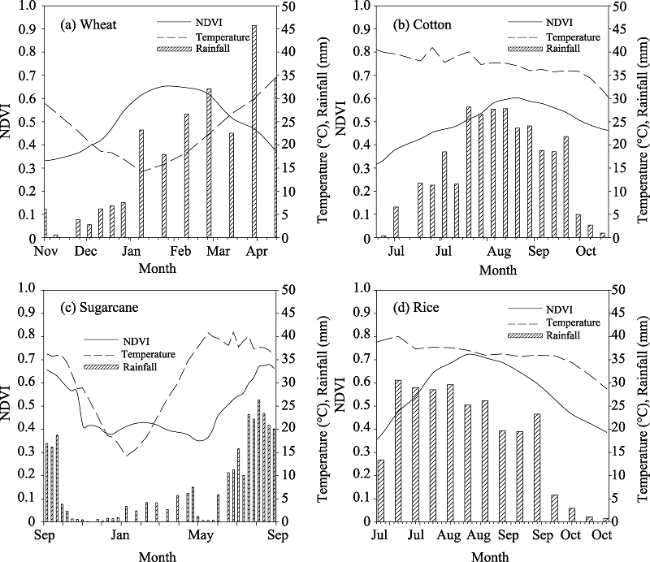
Figure 8 Relationship of NDVI to temperature and precipitation for wheat, cotton, sugarcane and rice
3.2.5 Areal distribution of major crop classes
Estimation of areal distribution for various crops forms one of the key informations for hydrological modeling especially in irrigated agriculture. Tables 6 and 7 show this areal dis- tribution under different classes for both rabi and kharif seasons. During all rabi seasons, wheat is the major class in LCC with an overall cropped area of more than 50% with values ranging between 497,214 ha (53.7%) in 2007-08 to 598,172 ha (64.6%) in 2009-10. Rest of the area is occupied by rabi fodder and sugarcane with values ranging between 299,717 ha(32.3%) to 128,328 ha (13.8%) for sugarcane, and 214,061 ha (23.1%) to 78,453 ha (8.5%) for rice considering all study years.
Table 6 Areal distribution of LULC classes during rabi seasons in LCC
For kharif seasons, a distinctive pattern in crop cultivated area is observed at various intervals during the study period. The cultivation of rice has the least relative fluctuation in area with values in the range of 251,435 ha (27.2%) and 361,944 ha (39.1%). Maximum and minimum values for area of sugarcane are 198,419 ha (21.4%) and 87,297 ha (9.4%), respectively. The cultivated area under kharif fodder decreases from previous to current years while it is vice versa for cotton. Minimum and maximum values for kharif fodder are 169,562 ha (18.3%) and 414,699 ha (44.8%), respectively while for cotton, they are 76,740 ha (8.3%) and 259,964 ha (28%), respectively.
Table 7 Areal distribution of LULC classes during kharif seasons in LCC
3.2.6 LULC change detection
Most studies on LULC change detection consider two well-separated years for this process (Lu et al., 2013; Ding et al., 2013). In this study, however, the cropping seasons with maximum and minimum cropped areas under a particular LULC are selected as upper and lower baselines to identify the maximum relative change during the study period. Positive values indicate an increase in cropped area for specific crop year having minimum cultivated area under particular crop and vice versa. Results indicate minimum change in wheat cultivated area for the study period with values ranging from -16.9% to +20.3%. This is mainly driven by its being main staple food in the country, relatively cheaper inputs and reduced chance of crop failure. In contrast, sugarcane has the maximum flexibility in change, i.e., -38.8% to 63.5%, while the change for rabi fodder is between -28.6% to 40%.
For kharif seasons, rice exhibits minimum variation in cropped area ranging from -30.55% and 43.9%. Cotton has a very high volatility in percentage change from -70.4% to 238.1%. This extremely large variation is due to recent increase in cotton cultivation during the last cropping season of the study period. The second highest positive change for cotton is 133.4% during 2010. Results indicate an increasing trend of cotton cultivation in recent years as evinced by Agricultural Outlook Forum (2012) who observed up to 14% increase in cropped area under cotton in Pakistan compared with that of 2011. It is possibly driven by increased Bt-Cotton cultivation while a shallow change in rice cultivation stems from its excessive water requirements given depleting water resources in the study area. Kharif fodder also shows a clear decreasing trend with positive change in recent years while sugarcane exhibits a change of about ± 60%, except 127.2% in 2007.
The LULC change detection discussed so far regarding various crops focused only on quantitative changes in cropped areas for whole LCC. It is also important to explore spatial changes in cultivated area for a particular crop during specific cropping season, thus helping to know the allocation of cropped area over time along with potential of a particular crop to replace another one. This end is achieved by performing analysis for change detection considering two different cropping seasons. For this purpose, a number of techniques are helpful such as post-classification comparison, image ratio, image regression and manual on-screen digitization of change. For this study, post classification comparison approach is used, which provides detailed ‘From-To’ change trajectories at per-pixel level (Lu et al., 2013; Reis, 2008) for each LULC class. Same baseline cropping years as discussed above are used to make these comparisons. Area matrices for different crops are constructed and are presented in Tables 8 and 9.
From the results, the changes in area for major crops can be identified and presented in colored maps. For example, out of total wheat area of 598,403 ha, 120,855 ha are shifted from rabi fodder between years 2007-08 and 2009-10 while the sugarcane area shifted to wheat is 32,161 ha. However, 444,865 ha of land remained under wheat cultivation in both years. This greater value of shared land for wheat between two cropping years shows the preference to wheat cultivation among farmers. The amount of fallow land shifted to wheat remained 476 ha, indicating a prior occupation of most cultivated area by wheat (Table 8). As sugarcane area was higher in 2005-06 as compared to 2010-11 (Table 6), the shared area between the two seasons is 45,465 ha, whereas, the shift from wheat to sugarcane is 4752 ha and 12,150 ha for years 2010-11 and 2005-06, respectively. Similarly, the area shifted from rabi fodder to sugarcane is 19,852 ha and 69,015 ha for years 2010-11 and 2005-06, respectively. As the area under rabi fodder increased in 2010-11 compared to the previous year, the shared area under this crop is 136,430 ha while an area of 46,500 ha is shifted from sugarcane to rabi fodder. The transfer of wheat area to rabi fodder is maximum, i.e., 116,472 ha (Table 8).
Table 8 Pixel-by-pixel LULC change detection between maximum and minimum cropped areas for rabi seasons
To sum-up, change from fodder to wheat is the highest in LCC and vice versa, as well. Similarly, shift from sugarcane to wheat is conspicuous but is less pronounced in case of wheat to sugarcane. The reason is the annual nature of sugarcane crop with relatively higher water requirements compared with wheat. Farmers find it easy to allocate area from sugarcane to wheat which is otherwise less-attractive. The shifting of area from sugarcane to rabi fodder is the urge on farmers’ part to provide a biophysical relief to the soil.
Results of area transformation between crops for kharif seasons are presented in Table 9. It is evident that rice is the major crop occupying a common area of 224,125 ha. This shows a decreased volatility of rice area to shift. The rank-wise contribution of kharif fodder, sugarcane and cotton area to rice area is 88,378 ha, 35,831 ha and 13,726 ha, respectively during 2009. Cotton area also shows increasing trend during recent years. Major contribution to cotton area during 2011 comes from kharif fodder (143,959 ha) and sugarcane (81,034 ha). The area converted from rice to cotton amounts to 25,881 ha. Kharif fodder area has a greater flexibility to be allocated to other crops during the season. Similarly, conversion of cotton area to sugarcane cultivation and vice versa is also observable, whereas change from rice area to cotton and vice versa is less conspicuous.
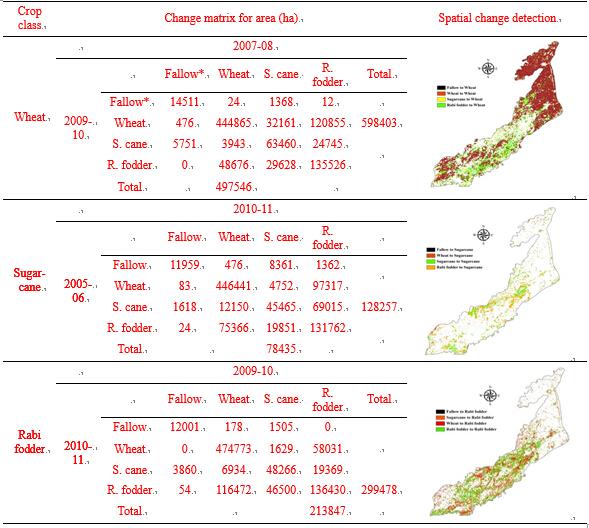
Table 9 Pixel-by-pixel LULC change detection between maximum and minimum cropped areas for kharif seasons
Crop class Change matrix for area (ha) Spatial change detection
Rice 2008
2009 Fallow* Cotton S. cane K. fodder Rice Total
Fallow* 18388 0 0 16913 1118
Cotton 0 75533 8266 32982 184
S. cane 0 23966 61450 928 821
K. fodder 3937 17799 672 275465 25388
Rice 131 13726 35831 88378 224125 362218
Total 251654
Cotton 2007
2011 Fallow Cotton S. cane K. fodder Rice Total
Fallow 12566 0 0 4395 190
Cotton 12 8623 81034 143959 25881 259529
S. cane 0 23407 102895 7993 3485
K. fodder 8480 59 1701 154152 5156
Rice 1392 44662 12435 65239 218285
Total 76758
Kharif fodder 2011
2008 Fallow Cotton S. cane K. fodder Rice Total
Fallow 14088 0 0 7826 541
Cotton 0 83704 40660 1290 4775
S. cane 0 13006 81129 36 12049
K. fodder 2866 154378 10104 152249 95069 414699
Rice 196 8421 5888 7553 229578
Total 169562

* Fallow/Residential/Barren

3.2.7 LULC change scenarios for hydrological studies
The LULC are amongst important environmental factors which are affected heavily by anthropogenic activities and therefore impact the hydrological cycle (Lorencov´a et al., 2013). Evapotranspiration is the single term that links land surface energy balance and surface water balances (Zhao et al., 2013). This forms a key process of hydrological cycle and regarded valuable in water balance modeling especially in irrigated areas (Usman et al., 2015a). Evapotranspiration is generally not considered directly in hydrological studies but as a recharge which varies spatially due to differences in water use for various land uses (Wegehenkel, 2009). As the water balance approach is not perfect without its consideration for evapotranspiration in any agro-climatic region (Usman et al., 2015b), it is estimated by using Surface Energy Balance Algorithm (SEBAL) devised by Bastiannssen et al. (1998b) for its significance in recharge estimation and its application in hydrological studies.
The detailed methodology and application of SEBAL is omitted to save space but it is accessible from Usman et al. (2014). The results of different LULC areal coverage and its change detection as discussed above are correlated with spatially distributed evapotranspiration for establishing patterns of water use within these LULC and to identify potential areas of change for different LULC in all subdivisions of LCC. For this, zonal statistics approach is used to estimate seasonal average water use by different crops in different irrigation subdivisions of LCC as given in Table 10.
Table 10 Irrigation-subdivision wise seasonal average evapotranspiration (mm) and percent of total cultivated area for each LULC class in the study area
LULC Sagar Chuharkana Paccadala Mohlan Buchiana Tandla Tarkhani Kanya Bhagat Sultanpur
Cotton Evapotranspiration 563.4 537.9 550.9 557.4 579.3 545.1 525.0 520.6 518.4 539.8
% area 1.1 2.9 5.8 11.8 15.4 21.9 13.7 14.1 9.6 3.6
Sugarcane Evapotranspiration 602.1 578.4 576.1 587.5 595.0 595.1 571.9 560.8 583.5 595.3
% area 0.03 0.10 0.61 7.35 7.44 19.17 19.26 16.40 8.16 21.48
Kharif fodder Evapotranspiration 529.3 525.6 513.1 534.3 544.7 516.5 482.9 505.1 460.7 530.5
% area 4.1 4.6 16.7 9.9 16.6 10.2 11.7 6.9 17.8 1.6
Rice Evapotranspiration 589.9 581.4 576.9 604.4 619.4 604.6 555.6 553.1 565.6 600.1
% area 30.5 24.4 9.6 16.2 0.6 2.0 2.0 1.9 7.5 5.4
The results of different LULC areal coverage presented in section 3.2.5 represent overall information at LCC scale. In reality, the cultivated area under a particular LULC class is not uniform throughout LCC but specific classes are dominant in particular irrigation subdivisions of LCC. Similarly, LULC change is also not uniform throughout LCC but it is highly dependent on overall areal coverage of a particular class in specific sub-region. Due to this fact and hence to consider spatial variability of any LULC change, total area under any LULC class is segregated at irrigation subdivision level (Table 10). These estimated proportions take into consideration the overall suggested change in any LULC at LCC scale. The potential change from any LULC class to another class is suggested based on the findings that appear in Tables 8 and 9.
Subsequently, different LULC scenarios are generated in order to feed their results for future hydrological modeling and to explore their impacts on possible changes in groundwater levels in the study area. To achieve this end, the following two conditions are followed while devising these scenarios:
(1) Ensuring the realistic limits of the area of each LULC class while introducing changes in the area of a particular LULC class based on estimated results (Type I).
(2) Maintaining the area of a particular LULC class within its realistic change limits with no consideration to cropped areas of other classes (Type II).
Along with meeting the above-stated conditions, the following points are considered to ensure maximum suitability of LULC scenarios to the study area:
(a) Change in any LULC class is based on its spatial coverage in any particular sub-region of LCC.
(b) Increase/decrease in LULC area of any particular class is based on its current status in LCC (i.e. year 2011, the latest study year).
(c) LULC change scenarios are based only on classes in kharif cropping seasons as options for change are limited during rabi seasons and the difference in consumptive water use is also less among rabi crops (Usman et al., 2015a; Usman et al., 2014).
Table 11 LULC change scenarios and water utilization (ha-m)
Sr. No. Scenario Type Sagar Chuharkana Paccadala Mohlan Buchiana Tandla Tarkhani Kanya Bhagat Sultanpur CWU*
1 25% decrease in Rice area by replacing it with K.fodder & S.cane Type-I 100% Rice to K.fodder 50% each to K.fodder & S.cane (600.7) 100% Rice to K.fodder (37.5) 100% Rice to S.cane
(15.9)
50% Rice each to K.fodder & S.cane 4452.4
1579.6 1163.8 524.3 47.1 32.7 280.2 170.5
2 25% decrease in Rice area by its major conversion to K.fodder 100% Rice to K.fodder 100% to S.cane
(15.9)
100% Rice to K.fodder 4402.7
1579.6 1163.8 524.3 484.2 37.5 60.7 39.1 337.8 159.7
3 25% decrease in Rice area by replacing it with S.cane 100% Rice to K.fodder 100% to S.cane
(116.4)
100% to K.fodder
(37.5)
100% to S.cane
(15.9)
100% Rice to S.cane 3370.8
1579.6 1163.8 524.3 -13.6 -6.4 -57.6 10.8
4 50% decrease in Cotton area by its conversion to S.cane & K.fodder 100% Cotton to S.cane 50% Cotton each to K.fodder and S.cane 100% to K.fodder
(722.8)
100% to S.cane
(-263.0)
-139.7
-56.4 -151.7 47.9 -53.8 189.0 -305.1 -43.5 -225.9
5 50% decrease in Cotton area by its major conversion to S.cane Type II 100% Cotton to S.cane 100% to K.fodder
(722.8)
100% to S.cane
(-263.0)
-1729.7
-56.4 -151.7 -94.9 -230.9 -157.6 -711.6 -418.2 -368.3
6 50% decrease in Cotton area by its major conversion to K.fodder Type-I 100% to S.cane 100% Cotton to K.fodder 100% to S.cane
(-263.0)
1841.8
-56.4 -151.7 142.8 177.1 346.6 406.4 374.7 142.4 722.8
7 50% increase in K.fodder by replacing Rice, Cotton and S.cane 100% K.fodder from Rice 50% each from Rice and Cotton
(718.3)
50% K.fodder each from S.cane and Cotton 50% each from Cotton & Rice
(1225.7)
50% K.fodder each from Cotton and Rice
55.2
4662.4
208.3 217.5 320.6 595.1 462.1 650.5 209.2
8 50% increase in K.fodder by major replacement of S.cane & Cotton 100% K.fodder from Rice 100% K.fodder from S.cane 100% from K. fodder Cotton 2838.6
208.3 217.5 450.9 223.6 352.7 338.9 441.7 163.6 435.0 6.5
9 50% increase in K.fodder area by major replacement of Cotton & Rice 100% K.fodder from Rice 100% K.fodder from Cotton 100% from Rice
(790.7)
100% from Rice
(48.6)
2249.6
208.3 217.5 267.4 97.0 242.4 123.2 208.7 45.6

(to be continued on the next page)

The details of different LULC change scenarios and possible water saving or more water utilization against each scenario relative to current water usage are presented in Table 11. The results also provide details of variation for water saving or its more utilization for each irrigation subdivisions under each LULC class along with explaining spatial variability of change. Out of many possible scenarios, 15 scenarios are presented here. These scenarios portray changes in water demand for different LULC changes, thus providing valuable clues regarding their ultimate effect on groundwater table and surface water provision. The last column of Table 11 indicates change in consumptive water use at LCC scale. The negative values depict increased water demand and vice versa under changed land use scenario. Very few scenarios show similar changes in consumptive water use at LCC scale however, the variation of change for each irrigation subdivision is significant and leads to spatial variability of water table. This effect is easily detectable by incorporating these results to hydrological modeling.

4 Conclusions

Land use/land cover (LULC) change is a global phenomenon and it is accurate and updated information has major significance compulsory for detailed eco-system studies using hydrological modeling. It becomes extremely important in regions dominated by agricultural lands owing to their complexity of use and rapid changes from season to season. In recognition to the role of irrigated agriculture, many global, regional, and country level studies have been conducted varying in space and time scales covering different aspects of crop-water interactions. The present study was conducted in LCC, Pakistan and shows that MODIS 250 m × 250 m spatial resolution data prove quite useful to discriminate different major LULC. Time series NDVI profiles were constructed and areas under different LULC were measured based on this information. This process was repeated for each cropping season separately from year 2005 to year 2012 while considering rabi and kharif as distinct cropping seasons. Different classification accuracy assessment techniques were employed including error matrix, comparison of LULC maps to ancillary data and with previous studies focusing on the study area.
The error matrix analysis shows overall accuracy varying from 79.52% to 87.39% for rabi and 76.19% to 80.08% for kharif. Kappa coefficients indicate good agreement between actual crop information and classified map information. Kappa values change from 0.66 to 0.77 for individual rabi seasons with an average of 0.73 while range between 0.69 and 0.74 with an average of 0.71 for kharif. The maximum value for coefficient of determination is observed for wheat (0.85) followed by rice (0.83), cotton (0.78) and sugarcane (0.75); showing a potential for replacement of manual data (by government agencies) with remote sensing techniques at spatial resolution of 250 m × 250 m.
Orographic and climatic conditions have specific effects for different crops. For example, the growth conditions for rice and cotton crops are completely different from completely distinct growing areas for both of these crops. Soil with more drainage ability and climates with fewer rainfalls are suitable for cotton which is other way round for rice crop. Wheat is cultivated on all types of soils but its cultivation generally starts in relatively warmer months followed by growth stages favoring cooler months. Sowing of sugarcane is mostly adopted in lowsloping areas especially alongside river Ravi.
Based on areal crop coverage data, wheat and rice are ranked first in rabi and kharif cropping seasons, respectively. Overall LULC change detection for individual crops from with respect to maximum and minimum cropped areas indicates wheat as least volatile crop in terms of in cropped area (-16.9% to 20.3%) during rabi and rice (-30.55% to 43.9%) in kharif. Cotton exhibits maximum positive change while kharif fodder maximum negative change in recent years. Sugarcane shows a change between ± 60%. Spatial LULC change detection at pixel scale indicates that fodder crop has maximum volatility in change compared with all other crops during kharif and rabi seasons. Transformation of cotton area to rice cultivation is less conspicuous but it is remarkably high for sugarcane fodder crops. Change from cotton to rice is less popular but it is more pronounced from sugarcane and fodder to rice.
A number of LULC change scenarios can be proposed based on the classification results for different cropping seasons. These scenarios along with spatio-temporal evapotranspiration explore different options of consumptive water use change.

The authors have declared that no competing interests exist.

1
Agricultural Outlook Forum, 2012. The world and United States cotton outlook. United States Department of Agriculture.No abstract is available for this item.

2
Anderson J R, 1977. Land use and land cover changes: A framework for monitoring.Journal of Research by the Geological Survey, 5: 143-153.

3
Barraza V, Grings F, Salvia Met al., 2013. Monitoring and modelling land surface dynamics in Bermejo River Basin, Argentina: Time series analysis of MODIS NDVI data.International Journal of Remote Sensing, 34(15): 5429-5451. doi: 10.1080/01431161.2013.791759.The purpose of this work was to monitor and model land surface phenology over the past ten years in the South American Bermejo River basin using the Moderate Resolution Imaging Spectroradiometer (MODIS) normalized difference vegetation index (NDVI) product. In order to do this, we evaluated the characteristics of the satellite data and information available on the study area's ecosystem to choose the best model to capture the temporal dynamics of NDVI in local vegetation (sufficiently complex to provide a good fit and simple enough so that each parameter has an immediate ecological meaning). An ecological interpretation of model parameters was provided. Different land surfaces showed distinct fluctuations over time in NDVI values, and this information was used to improve object-oriented classification. A decision tree classification was developed to identify spatial patterns of NDVI functional form and the fluctuations that these patterns presented from 2000 to 2010. We integrated inter-annual information in a final map that distinguishes stable areas from changing sites. Assuming that large inter-annual spatial-scale fluctuations were related to climatic events, we established how vegetated land surfaces within the study area responded to these. Our study was designed to emphasize the interpretation of the spatial and temporal scales of land surface phenology.

DOI

4
Bastiannssen W G M, 1998a. Remote sensing in water resources management: The state of the art. International Water Management Institute, Colombo, Sri Lanka.No abstract is available for this item.

5
Bastiaanssen W G M, Menenti M, Feddes R Aet al., 1998b. A remote sensing surface energy balance algorithm for land (SEBAL) formulation.J. Hydrol., 212/213: 198-212.The major bottlenecks of existing algorithms to estimate the spatially distributed surface energy balance in composite terrain by means of remote sensing data are briefly summarised. The relationship between visible and thermal infrared spectral radiances of areas with a sufficiently large hydrological contrast (dry and wet land surface types, vegetative cover is not essential) constitute the basis for the formulation of the new Surface Energy Balance Algorithm for Land (SEBAL). The new algorithm (i) estimates the spatial variation of most essential hydro-meteorological parameters empirically, (ii) requires only field information on short wave atmospheric transmittance, surface temperature and vegetation height, (iii) does not involve numerical simulation models, (iv) calculates the fluxes independently from land cover and (v) can handle thermal infrared images at resolutions between a few meters to a few kilometers. The empirical relationships are adjusted to different geographical regions and time of image acquisition. Actual satellite data is inserted in the derivation of the regression coefficients. Part 2 deals with the validation of SEBAL.

DOI

6
Black A, Stephen H, 2014. GIScience & remote sensing relating temperature trends to the normalized difference vegetation index in Las Vegas.GIScience and Remote Sensing, 51(4): 468-482.ABSTRACT "Letter to the editor"

DOI

7
Campbell J B, 2002. Introduction to Remote Sensing. New York: The Guilford Press.

8
Cheema M J M, Bastiaanssen W G M, 2010. Land use and land cover classification in the irrigated Indus Basin using growth phenology information from satellite data to support water management analysis.Agricultural Water Management, 97(10): 1541-1552. doi: 10.1016/j.agwat.2010.05.009.Water resources planning and management is fundamental for food security, environmental conservation, economic development and livelihoods. In complex basins like the Indus Basin, water is utilized by different land cover and land uses. Up to date information about these Land Use and Land Cover (LULC) classes provide essential information on the water flow path. Traditionally, landscapes are described by cover type. For water management analysis, the information on land use is vital. To this end, a classification of LULC in the Indus Basin (covering 116.2 million hectares of Pakistan, India, China and Afghanistan) has been made. Vegetation index images freely available from SPOT-Vegetation satellite were used to describe the phenological cycle of all agro-ecosystems at a spatial resolution of 1脗 km脗 x脗 1脗 km. An unsupervised clustering technique was adapted to classify 27 land use classes. Ground information and expert knowledge on the growing patterns of crops was used to label the resulting LULC classes. This helped to discern specific crops and crop rotations. An error matrix was prepared using ground truthing data to evaluate the classification accuracy. Existing global, regional and local studies were also considered for validation. The results show an overall accuracy of 77%, with the producer's accuracy being 78% and user's accuracy 83%. The Kappa coefficient (0.73) shows moderate agreement between on ground and satellite derived map. This is deemed sufficient for supporting water management analysis. The availability of major crop rotation statistics and types of forests and savanna is key information for the input data in hydrological models and water accounting frameworks.

DOI

9
Congalton R, Green K, 1999. Assessing the Accuracy of Remotely Sensed Data: Principles and Practices. Boca Raton: CRC/Lewis Press, FL. 137 p.

10
Congalton R G, 1996. Accuracy assessment: A critical component of land cover mapping in gap analysis: A landscape approach to biodiversity planning. A Peer-Reviewed Proceedings of the ASPRS/GAP Symposium, February 27 - March 2, 1995, Charlotte, N.C. 119-131.

11
Dappen Patti R, Ratcliffe I C, Robbins C R et al., 2008. Mapping agricultural land cover for hydrologic modeling in the Platte River Watershed of Nebraska. Great Plains Research: A Journal of Natural and Social Sciences, Paper 926, .

12
Ding H, Shi W, 2013. Land-use/land-cover change and its influence on surface temperature: A case study in Beijing City.International Journal of Remote Sensing, 34(15): 5503-5517. doi: 10.1080/01431161.2013.792966.ABSTRACT Rapid global economic development has resulted in a corresponding intensification of urbanization, which has in turn impacted the ecology of vast regions of the world. A series of problems have thus been introduced, such as changes in land-use/land-cover LULC and changes in local climate. The process of urbanization predominantly represents changes in land-use, and is deemed by researchers to be the chief cause of climate change and ecological change. One of the principal purposes of the research in this field is to find ways to mitigate the influence of land-use change on local or global environments. In the study presented in this article, satellite images were utilized to extract information regarding land-use in Beijing City, and to develop maps of land surface temperature LST during two different periods of time: 2 August 1999 and 8 August 2010. A supervised classification scheme, a support vector machine, was used to derive the land-use change map for the above periods. Maps of surface temperature are derived from the thermal band of Landsat images using the mono-window algorithm. Results from post-classification comparison indicated that an increase in impervious surface areas was found to be dramatic, while the area of farmland decreased rapidly. The changes in LULC were found to have led to a variation in surface temperature, as well as a spatial distribution pattern of the urban heat island phenomenon. This research revealed that the hotspots were mainly located in areas dominated by three kinds of material: bare soil, rooftops, and marble surfaces. Results from the local Moran's I index indicated that the use of lower surface temperature materials will help to mitigate the influence of the urban heat island phenomenon. The results of this research study provide a reference for government departments involved in the process of designing residential regions. Such a reference should enable the development of areas sympathetic to environmental changes and hence mitigate the effects of the growing intensity of urbanization.

DOI

13
Douglas K B, Mark A F, 2013. Forecasting crop yield using remotely sensed vegetation indices and crop phenology metrics.Agricultural and Forest Meteorology, 173: 74-84.We used data from NASA's Moderate Resolution Imaging Spectroradiometer (MODIS) in association with county-level data from the United States Department of Agriculture (USDA) to develop empirical models predicting maize and soybean yield in the Central United States. As part of our analysis we also tested the ability of MODIS to capture inter-annual variability in yields. Our results show that the MODIS two-band Enhanced Vegetation Index (EVI2) provides a better basis for predicting maize yields relative to the widely used Normalized Difference Vegetation Index (NDVI). Inclusion of information related to crop phenology derived from MODIS significantly improved model performance within and across years. Surprisingly, using moderate spatial resolution data from the MODIS Land Cover Type product to identify agricultural areas did not degrade model results relative to using higher-spatial resolution crop-type maps developed by the USDA. Correlations between vegetation indices and yield were highest 65–75 days after greenup for maize and 80 days after greenup for soybeans. EVI2 was the best index for predicting maize yield in non-semi-arid counties ( R 2 02=020.67), but the Normalized Difference Water Index (NDWI) performed better in semi-arid counties ( R 2 02=020.69), probably because the NDWI is sensitive to irrigation in semi-arid areas with low-density agriculture. NDVI and EVI2 performed equally well predicting soybean yield ( R 2 02=020.69 and 0.70, respectively). In addition, EVI2 was best able to capture large negative anomalies in maize yield in 2005 ( R 2 02=020.73). Overall, our results show that using crop phenology and a combination of EVI2 and NDWI have significant benefit for remote sensing-based maize and soybean yield models.

DOI

14
Fang W, Chen J, Shi P, 2005. Variability of the phenological stages of winter wheat in the North China Plain with NOAA/AVHRR NDVI data (1982-2000).IEEE International Geoscience and Remote Sensing Symposium Proceedings, 5: 3124-3127.ABSTRACT Not Available

DOI

15
Fisher P F, 2010. Remote sensing of land cover classes as type 2 fuzzy sets.Remote Sensing of Environment, 114: 309-321.

16
Foody G M, 2002. Status of land cover classification accuracy assessment.Remote Sensing of Environment, 80: 185-201.The production of thematic maps, such as those depicting land cover, using an image classification is one of the most common applications of remote sensing. Considerable research has been directed at the various components of the mapping process, including the assessment of accuracy. This paper briefly reviews the background and methods of classification accuracy assessment that are commonly used and recommended in the research literature. It is, however, evident that the research community does not universally adopt the approaches that are often recommended to it, perhaps a reflection of the problems associated with accuracy assessment, and typically fails to achieve the accuracy targets commonly specified. The community often tends to use, unquestioningly, techniques based on the confusion matrix for which the correct application and interpretation requires the satisfaction of often untenable assumptions (e.g., perfect coregistration of data sets) and the provision of rarely conveyed information (e.g., sampling design for ground data acquisition). Eight broad problem areas that currently limit the ability to appropriately assess, document, and use the accuracy of thematic maps derived from remote sensing are explored. The implications of these problems are that it is unlikely that a single standardized method of accuracy assessment and reporting can be identified, but some possible directions for future research that may facilitate accuracy assessment are highlighted.

DOI

17
Gao X, Huete A R, Ni Wet al., 2000. Optical-biophysical relationships of vegetation spectra without back-ground contamination.Remote Sensing of Environment, 74: 609-620.

18
Giri, Chandra, Jenkins C, 2005. Land cover mapping of greater Mesoamerica using MODIS data. Remote Sensing, 31(4): 274-282. Retrieved at .

19
Gong P, Wang J, Yu Let al., 2013. Finer resolution observation and monitoring of global land cover: First mapping results with Landsat TM and ETM+ data.International Journal of Remote Sensing, 34(7): 2607-2654. doi: 10.1080/01431161.2012.748992.

20
Gumma M K, Nelson A, Thenkabail P Set al., 2011. Mapping rice areas of South Asia using MODIS multitemporal data.J. Applied Remote Sensing, 5(1): 53547. doi: 10.1117/1.3619838.ABSTRACT Our goal is to map the rice areas of six South Asian countries using moderate-resolution imaging spectroradiometer (MODIS) time-series data for the time period 2000 to 2001. South Asia accounts for almost 40% of the world's harvested rice area and is also home to 74% of the population that lives on less than $2.00 a day. The population of the region is growing faster than its ability to produce rice. Thus, accurate and timely assessment of where and how rice is cultivated is important to craft food security and poverty alleviation strategies. We used a time series of eight-day, 500-m spatial resolution composite images from the MODIS sensor to produce rice maps and rice characteristics (e.g., intensity of cropping, cropping calendar) taking data for the years 2000 to 2001 and by adopting a suite of methods that include spectral matching techniques, decision trees, and ideal temporal profile data banks to rapidly identify and classify rice areas over large spatial extents. These methods are used in conjunction with ancillary spatial data sets (e.g., elevation, precipitation), national statistics, and maps, and a large volume of field-plot data. The resulting rice maps and statistics are compared against a subset of independent field-plot points and the best available subnational statistics on rice areas for the main crop growing season (kharif season). A fuzzy classification accuracy assessment for the 2000 to 2001 rice-map product, based on field-plot data, demonstrated accuracies from 67% to 100% for individual rice classes, with an overall accuracy of 80% for all classes. Most of the mixing was within rice classes. The derived physical rice area was highly correlated with the subnational statistics with R 2 values of 97% at the district level and 99% at the state level for 2000 to 2001. These results suggest that the methods, approaches, algorithms, and data sets we used are ideal for rapid, accurate, and large-scale mapping of paddy rice as well as for generating their statistics over large areas. C

DOI

21
Jensen J R, 1996. Introductory Digital Image Processing: A Remote Sensing Perspective. 2nd ed. New Jersey: Prentice-Hall, 316p.This book, reviews the art and science of applying digital image processing techniques to remotely sensed imagery. The digital image processing techniques presented are multidisciplinary in nature, and can be used in most Earth science and social science research by scientists who believe that the analysis of remotely sensed data by computer may benefit their decision-making capability. CONTENTS: Introduction to Digital Image Processing. Remote Sensing Data Acquisition Alternatives. Image Processing System Considerations. Initial Statistics Extraction. Initial Display Alternatives. Image Preprocessing-Radometric/Geometric. Useful Image Enhancements. Thematic Information Extraction. Change Detection. Appendix A: The SENSOR Digital Image Processing System Consisting of FORTRAN Subroutines. Appendix B: Addresses of Public and Commercial Suppliers of Digital Image Processing Hardware and Software.

DOI

22
Jeong S, Jang K, Hong Set al., 2011. Detection of irrigation timing and the mapping of paddy cover in Korea using MODIS images data.Korean Journal of Agricultural and Forest Meteorology, 13: 69-78.

23
Julien Y, Sobrino J A, 2009. Global land surface phenology trends from GIMMS database.International Journal of Remote Sensing, 30: 3495-3513.A double logistic function has been used to describe global inventory mapping and monitoring studies (GIMMS) normalized difference vegetation index (NDVI) yearly evolution for the 1981 to 2003 period, in order to estimate land surface phenology parameter. A principal component analysis on the resulting time series indicates that the first components explain 36, 53 and 37% of the variance for the start, end and length of growing season, respectively, and shows generally good spatial homogeneity. Mann-Kendall trend tests have been carried out, and trends were estimated by linear regression. Maps of these trends show a global advance in spring dates of 0.38 days per year, a global delay in autumn dates of 0.45 days per year and a global increase of 0.8 days per year in the growing seasons validated by comparison with previous works. Correlations between retrieved phenological parameters and climate indices generally showed a good spatial coherence.

DOI

24
Kim Y.2013. Drought and elevation effects on MODIS vegetation indices in northern Arizona ecosystems.International Journal of Remote Sensing, 34(14): 4889-4899. doi: 10.1080/2150704X.2013.781700.ABSTRACT Northern Arizona ecosystems are particularly sensitive to plant-available moisture and have experienced a severe drought with considerable impacts on ecosystems from desert shrub and grasslands to pinyon-juniper and conifer forests. Long-term time-series from the Moderate Resolution Imaging Spectroradiometer (MODIS) normalized difference vegetation index (NDVI) and enhanced vegetation index (EVI) are used to monitor recent regional vegetation activity and temporal patterns across various ecosystems. Surface air temperature, solar radiation and precipitation are used to represent meteorological anomalies and to investigate associated impacts on vegetation greenness. Vegetation index anomalies in the northern Arizona ecosystem have a decreasing trend with increasing surface air temperature and decreasing precipitation. MODIS NDVI and EVI anomalies are likely sensitive to the amount of rainfall for northern Arizona ecosystem conditions, whereas inter-annual variability of surface air temperature accounts for MODIS NDVI anomaly variation. The higher elevation area shows the slow vegetation recovery through trend analysis from MODIS vegetation indices for 2000–2011 within the study domain and along elevation.

DOI

25
Kimaro T A, Tachikawa Y, Takara K, 2005. Distributed hydrologic simulations to analyze the impacts of land use changes on flood characteristics in the Yasu River Basin in Japan.Journal of Natural Disaster Sciences, 27(2): 85-94.In most parts of the world, land use data from remote sensing have been accumulated for more than 30 years. Historical images of land use can be used to know the location and types of land use change as a step towards investigating the impact of such change on floods. In this paper, we present a distributed watershed model developed for using land use data for investigating the impacts of land use changes on floods. The output of the model includes hydrographs and runoff maps simulated with different land use data to show the impact of land use change. The model has been applied in the Yasu River basin in Japan to evaluate the impact of land use changes between 1976 and 1997. The results show that land use changes during this period can be associated with an increase of up to 18% in peak flow and decrease in travel time. The changes in flood peaks appear to be largely influenced by the spatial distribution of land use change, and the changes are explained by a physically based distributed hydrological model considering the spatiotemporal distributions of surface water storage and surface roughness derived from land use data.

26
Latifovic R, Olthof I, 2004. Accuracy assessment using sub-pixel fractional error matrices of global land cover products derived from satellite data.Remote Sensing of Environment, 90: 153-165.lt;h2 class="secHeading" id="section_abstract">Abstract</h2><p id="">Information on land cover distribution at regional and global scales has become fundamental for studying global changes affecting ecological and climatic systems. The remote sensing community has responded to this increased interest by improving data quality and methodologies for extracting land cover information. However, in addition to the advantages provided by satellite products, certain limitations exist that need to be objectively quantified and clearly communicated to users so that they can make informed decisions on whether and how land cover products should be used. Accuracy assessment is the procedure used to quantify product quality. Some aspects of accuracy assessment for evaluating four global land cover maps over Canada are discussed in this paper. Attempts are made to quantify limiting factors resulting from the coarse spatial resolution of data used for generating land cover information at regional and global levels. Sub-pixel fractional error matrices are introduced as a more appropriate way for assessing the accuracy of mixed pixels. For classification with coarse spatial resolution data, limitations of the classification method produce a maximum achievable accuracy defined as the average percent fraction of dominant land cover of all pixels in the mapped area. Relationships among spatial resolution, landscape heterogeneity and thematic resolution were studied and reported. Other factors that can affect accuracy, such as misregistration and legend conversion, are also discussed.</p>

DOI

27
Leff B, Ramankutty N, Foley J A, 2004. Geographic distribution of major crops across the world. Global Biogeochem. Cycles, 18, GB 1009. doi: 10.1029/203GB002108.ABSTRACT 1] Humans have transformed the surface of the planet through agricultural activities, and today, $12% of the land surface is used for cultivation and another 22% is used for pastures and rangelands. In this paper, we have synthesized satellite-derived land cover data and agricultural census data to produce global data sets of the distribution of 18 major crops across the world. The resulting data are representative of the early 1990s, have a spatial resolution of 5 min. ($10 km), and describe the fraction of a grid cell occupied by each of the 18 crops. The global crop data are consistent with our knowledge of agricultural geography, and compares favorably to another existing data set that partially overlaps with our product. We have also analyzed how different crops are grown in combination to form major crop belts throughout the world. Further, we analyzed the patterns of crop diversification across the world. While these data are not sufficiently accurate at local scales, they can be used to analyze crop geography in a regional-to-global context. They can also be used to understand the global patterns of farming systems, in analyses of food security, and within global ecosystem and climate models to understand the environmental consequences of cultivation.

DOI

28
Liang L, Gong P, 2013. Evaluation of global land cover maps for cropland area estimation in the conterminous United States.International Journal of Digital Earth: 1-16. doi: 10.1080/17538947.2013.854414.of the FROM-GLC regression model increased from 0.1 to 0.4, and the slope is much closer to one. Our analysis shows that images acquired in growing season are most suitable for Landsat-based cropland mapping in the conterminous USA.

DOI

29
Lorencov´ A E, Fr´ Elichov´ A J, Nelson Eet al., 2013. Past and future impacts of land use and climate change on agricultural ecosystem services in the Czech Republic.Land Use Policy, 33: 183-194.Climatic and land use change are amongst the greatest global environmental pressures resulting from anthropogenic activities. Both significantly influence the provision of crucial ecosystem services, such as carbon sequestration, water flow regulation, and food and fibre production, at a variety of scales. The aim of this study is to provide spatially explicit information at a national level on climate and land use change impacts in order to assess changes in the provision of ecosystem services. This work provides a qualitative and quantitative analysis of the impacts on selected ecosystem services (carbon sequestration, food production and soil erosion) in the agricultural sector of the Czech Republic. This assessment shows that, historical land use trends and land use under projected climate scenarios display some shared spatial patterns. Specifically, these factors both lead to a significant decrease of arable land in the border fringes of the Czech Republic, which is to some extent replaced by grasslands, in turn affecting the provision of ecosystem services. Moreover, this assessment contributes to a useful method for integrating spatially explicit land use and climate change analysis that can be applied to other sectors or transition countries elsewhere. (C) 2012 Elsevier Ltd. All rights reserved.

DOI

30
Lu D, Li G, Moran Eet al., 2013. Spatiotemporal analysis of land use and land cover change in the Brazilian Amazon.International Journal of Remote Sensing, 34(16): 5953-5978. doi:10.1080/01431161.2013.802825.This paper provides a comparative analysis of land-use and land-cover (LULC) changes among three study areas with different biophysical environments in the Brazilian Amazon at multiple scales, from per-pixel, polygon, census sector, to study area. Landsat images acquired during the years of 1990/1991, 1999/2000, and 2008/2010 were used to examine LULC change trajectories with the post-classification comparison approach. A classification system composed of six classes 鈥 forest, savanna, other vegetation (secondary succession and plantations), agro-pasture, impervious surface, and water 鈥 was designed for this study. A hierarchical-based classification method was used to classify Landsat images into thematic maps. This research shows different spatiotemporal change patterns, composition, and rates among the three study areas and indicates the importance of analysing LULC change at multiple scales. The LULC change analysis over time for entire study areas provides an overall picture of change trends, but detailed change trajectories and their spatial distributions can be better examined at a per-pixel scale. The LULC change at the polygon scale provides the information of the changes in patch sizes over time, while the LULC change at census sector scale gives new insights on how human-induced activities (e.g. urban expansion, roads, and land-use history) affect LULC change patterns and rates. This research indicates the necessity to implement change detection at multiple scales for better understanding the mechanisms of LULC change patterns and rates.

DOI PMID

31
Matthews E, 1983. Global vegetation and landuse: New high resolution data bases for climate studies.Journal of Climate and Applied Meteorology, 22: 474-487.ABSTRACT Global vegetation and land-use data bases (1° latitude by 1° longitude resolution), designed for use in studies of climate and climate change, were compiled in digital form drawing upon approximately 100 published sources complemented by a large collection of satellite imagery. The vegetation data were encoded using the UNESCO classification system; land-use data were encoded using a classification system developed by the author. The vegetation and land-use data were then integrated into a land-cover data base. Areal estimates for most ecosystems from the land-cover data base were found to be significantly different from areal estimates derived from two other global land-cover sources. Possible explanations for discrepancies among these data bases include differences in ecosystem definitions and source material used in compilation. From areal estimates of major ecosystems, derived from the new vegetation and land-cover data bases it is estimated that the total ecosystem reduction caused by agricultural activities amounts to 17.6 × 10⁶ km2 globally, with the greatest reduction occurring in non-tropical forests. Extensive subsistence agriculture which remains largely unreported in crop inventories accounts for 2.6 × 10⁶ km2 of this figure, with the balance of 15 × 106 km2 agreeing encouragingly well with FAO's (1980) reported global crop area of 14.5 × 10⁶ km2. As an example of the flexibility of the new data base, areal estimates and brief definitions of selected ecosystem subdivisions are presented for the world and mapped for North America.

DOI

32
Mitrakis N E, Mallinis G, Koutsias Net al., 2011. Burned area mapping in Mediterranean environment using medium-resolution multi-spectral data and a neuro-fuzzy classifier.International Journal of Image and Data Fusion, 1-20.In this study, we assess the performance of a self-organising neuro-fuzzy classifier for burned area mapping using multi-spectral satellite data. The proposed neuro-fuzzy model incorporates a multi-layered structure consisting of two types of nodes. The first type is a generic fuzzy neuron classifier (FNCs), whereas the second is solely a decision fusion operator. The Group Method of Data Handling algorithm is used for structure learning providing the model with self-organising attributes and feature selection capabilities. The resulting novel structure consists not only of layers of FNCs but also of layers with only decision fusion due to the nature of the burned area mapping problem. The algorithm is applied to an entire LANDSAT-5 TM multi-spectral image, acquired over central Greece shortly after the major wildfire events of the summer of 2007. In addition to the self-organising neuro-fuzzy classifier, the image data set was classified using neural networks, support vector machines and AdaBoost algorithms. In general, the neuro-fuzzy burned area map presented the highest overall accuracy (more than 95%) compared to the other methods. However, the differences were not statistically significant as suggested by the results of the McNemar's test.

DOI

33
Molden D, 1997. Accounting for water use and productivity. SWIM paper 1. Colombo, Srilanka.

34
Morton D C, DeFries R S, Shimabukuro Y Eet al., 2006. Cropland expansion changes deforestation dynamics in the southern Brazilian Amazon.Proceedings of the National Academy of Sciences of the United States of America, 103(39): 14637-14641.ABSTRACT Intensive mechanized agriculture in the Brazilian Amazon grew by >3.6 million hectares (ha) during 2001-2004. Whether this cropland expansion resulted from intensified use of land previously cleared for cattle ranching or new deforestation has not been quantified and has major implications for future deforestation dynamics, carbon fluxes, forest fragmentation, and other ecosystem services. We combine deforestation maps, field surveys, and satellite-based information on vegetation phenology to characterize the fate of large (>25-ha) clearings as cropland, cattle pasture, or regrowing forest in the years after initial clearing in Mato Grosso, the Brazilian state with the highest deforestation rate and soybean production since 2001. Statewide, direct conversion of forest to cropland totaled >540,000 ha during 2001-2004, peaking at 23% of 2003 annual deforestation. Cropland deforestation averaged twice the size of clearings for pasture (mean sizes, 333 and 143 ha, respectively), and conversion occurred rapidly; >90% of clearings for cropland were planted in the first year after deforestation. Area deforested for cropland and mean annual soybean price in the year of forest clearing were directly correlated (R(2) = 0.72), suggesting that deforestation rates could return to higher levels seen in 2003-2004 with a rebound of crop prices in international markets. Pasture remains the dominant land use after forest clearing in Mato Grosso, but the growing importance of larger and faster conversion of forest to cropland defines a new paradigm of forest loss in Amazonia and refutes the claim that agricultural intensification does not lead to new deforestation.

DOI PMID

35
Niu Z, Zhang H, Wang Xet al., 2012. Mapping wetland changes in China between 1978 and 2008.Chinese Science Bulletin, 57(22): 2813-2823. doi: 10.1007/s11434-012-5093-3.Four wetland maps for all China have been produced,based on Landsat and CBERS-02B remote sensing data between 1978 and 2008 (1978,1990,2000 and 2008).These maps were mainly developed by manual interpretation and validated by substantial field investigation in 2009.Based on these maps,we analyzed the 2008 wetland distribution in China and discussed wetland changes and their drivers over the past 30 years.(i) There were about 324097 km 2 of wetlands in 2008,for which inland marshes or swamps were the most common wetland type (35%),with lakes (26%) second.Most of the wetlands were in Heilongjiang,Inner Mongolia,Qinghai and Tibet,occupying about 55% of the national wetland area.(ii) From 1978 to 2008,China's wetland area continually and significantly decreased,by about 33% based on changes in the wetland map.This was in sharp contrast to the increase in artificial wetlands,which increased by about 122%.Inland marshes accounted for the main loss of total wetlands from 1978 to 2000.From 2000 through 2008,riverine and lacustrine wetlands constituted the main wetland loss.Fortunately however,the rate of wetland loss decreased from 5523 to 831 km 2 /a.(iii) The change ratio of lost natural wetlands (including inland and coastal wetlands) to non-wetlands has decreased slightly over the past 30 years.From 1978 to 1990,nearly all natural wetlands (98%) lost were transformed into non-wetlands.However,the ratio declined to 86% from 1990 to 2000,and to 77% from 2000 to 2008.(iv) All Chinese provinces were divided into three groups according to patterns of wetland changes,which could relate to the driving forces of such changes.Tibet was completely different from other provinces,as it was one representative example in which there was a net wetland increase,because of global warming and decreased human activity since 1990.Increased economic development caused considerable wetland loss in most eastern provinces,and artificial wetlands increased.

DOI

36
Osborne P, Alonso J, Bryant R, 2001. Modelling landscape-scale habitat use using GIS and remote sensing: A case study with great bustards.Journal of Applied Ecology, 38: 458-471.1. Many species are adversely affected by human activities at large spatial scales and their conservation requires detailed information on distributions. Intensive ground surveys cannot keep pace with the rate of land-use change over large areas and new methods are needed for regional-scale mapping. 2. We present predictive models for great bustards in central Spain based on readily available advanced very high resolution radiometer (AVHRR) satellite imagery combined with mapped features in the form of geographic information system (GIS) data layers. As AVHRR imagery is coarse-grained, we used a 12-month time series to improve the definition of habitat types. The GIS data comprised measures of proximity to features likely to cause disturbance and a digital terrain model to allow for preference for certain topographies. 3. We used logistic regression to model the above data, including an autologistic term to account for spatial autocorrelation. The results from models were combined using Bayesian integration, and model performance was assessed using receiver operating characteristics plots. 4. Sites occupied by bustards had significantly lower densities of roads, buildings, railways and rivers than randomly selected survey points. Bustards also occurred within a narrower range of elevations and at locations with significantly less variable terrain. 5. Logistic regression analysis showed that roads, buildings, rivers and terrain all contributed significantly to the difference between occupied and random sites. The Bayesian integrated probability model showed an excellent agreement with the original census data and predicted suitable areas not presently occupied. 6. The great bustard's distribution is highly fragmented and vacant habitat patches may occur for a variety of reasons, including the species' very strong fidelity to traditional sites through conspecific attraction. This may limit recolonization of previously occupied sites. 7. We conclude that AVHRR satellite imagery and GIS data sets have potential to map distributions at large spatial scales and could be applied to other species. While models based on imagery alone can provide accurate predictions of bustard habitats at some spatial scales, terrain and human influence are also significant predictors and are needed for finer scale modelling.

DOI

37
Oslon J S, 1994. Global ecosystem framework definitions. USGS EROS Data Center Internal Report, Sioux Falls, SD, 37p.

38
Peng D, Huete A R, Huang Jet al., 2011. Detection and estimation of mixed paddy rice cropping patterns with MODIS data.International Journal of Applied Earth Observation and Geoinformation, 13: 13-23.lt;h2 class="secHeading" id="section_abstract">Abstract</h2><p id="">In this paper, we developed a more sophisticated method for detection and estimation of mixed paddy rice agriculture from Moderate Resolution Imaging Spectroradiometer (MODIS) satellite data. Previous research demonstrated that MODIS data can be used to map paddy rice fields and to distinguish rice from other crops at large, continental scales with combined Enhanced Vegetation Index (EVI) and Land Surface Water Index (LSWI) analysis during the flooding and rice transplanting stage. Our approach improves upon this methodology by incorporating mixed rice cropping patterns that include single-season rice crops, early-season rice, and late-season rice cropping systems. A variable EVI/LSWI threshold function, calibrated to more local rice management practices, was used to recognize rice fields at the flooding stage. We developed our approach with MODIS data in Hunan Province, China, an area with significant flooded paddy rice agriculture and mixed rice cropping patterns. We further mapped the aerial coverage and distribution of early, late, and single paddy rice crops for several years from 2000 to 2007 in order to quantify temporal trends in rice crop coverage, growth and management systems. Our results were validated with finer resolution (2.5&#xA0;m) Satellite Pour l&rsquo;Observation de la Terre 5 High Resolution Geometric (SPOT 5 HRG) data, land-use data at the scale of 1/10,000 and with county-level rice area statistical data. The results showed that all three paddy rice crop patterns could be discriminated and their spatial distribution quantified. We show the area of single crop rice to have increased annually and almost doubling in extent from 2000 to 2007, with simultaneous, but unique declines in the extent of early and late paddy rice. These results were significantly positive correlated and consistent with agricultural statistical data at the county level (<em>P</em>&#xA0;&lt;&#xA0;0.01).</p>

DOI

39
Pettorelli N, 2013. The Normalized Difference Vegetation Index. Oxford: Oxford University Press.

40
Portmann F T, Siebert S, Döll P, 2010. MIRCA2000-Global monthly irrigated and rainfed crop areas around the year 2000: A new high-resolution data set for agricultural and hydrological modeling. Global Biogeochemical Cycles, 24: GB1011.

41
Prakasam C, 2010. Land use and land cover change detection through remote sensing approach: A case study of Kodaikanal taluk, Tamil nadu.International Journal of Geomatics and Geosciences, 1(2): 150-158.Land use and land cover is an important component in understanding the interactions of the human activities with the environment and thus it is necessary to be able to simulate changes. Empirical observation revealed a change in land use land cover classification in Kodaikanal taluk, a part of Western Ghats located in Tamilnadu state. In this paper an attempt is made to study the changes in lan...

42
Reed B C, Brown J F, VanderZee Det al., 1994. Measuring phenological variability from satellite imagery.Journal of Vegetation Science, 5: 703-714.Abstract. Vegetation phenological phenomena are closely related to seasonal dynamics of the lower atmosphere and are therefore important elements in global models and vegetation monitoring. Normalized difference vegetation index (NDVI) data derived from the National Oceanic and Atmospheric Administration's Advanced Very High Resolution Radiometer (AVHRR) satellite sensor offer a means of efficiently and objectively evaluating phenological characteristics over large areas. Twelve metrics linked to key phenological events were computed based on time-series NDVI data collected from 1989 to 1992 over the conterminous United States. These measures include the onset of greenness, time of peak NDVI, maximum NDVI, rate of greenup, rate of senescence, and integrated NDVI. Measures of central tendency and variability of the measures were computed and analyzed for various land cover types. Results from the analysis showed strong coincidence between the satellite-derived metrics and predicted phenological characteristics. In particular, the metrics identified interannual variability of spring wheat in North Dakota, characterized the phenology of four types of grasslands, and established the phenological consistency of deciduous and coniferous forests. These results have implications for large-area land cover mapping and monitoring. The utility of remotely sensed data as input to vegetation mapping is demonstrated by showing the distinct phenology of several land cover types. More stable information contained in ancillary data should be incorporated into the mapping process, particularly in areas with high phenological variability. In a regional or global monitoring system, an increase in variability in a region may serve as a signal to perform more detailed land cover analysis with higher resolution imagery.

DOI

43
Reis S, 2008. Analyzing land use/land cover changes using remote sensing and GIS in Rize, North-East Turkey.Sensors, 8(10): 6188-6202. doi: 10.3390/s8106188.Mapping land use/land cover (LULC) changes at regional scales is essential for a wide range of applications, including landslide, erosion, land planning, global warming etc. LULC alterations (based especially on human activities), negatively effect the patterns of climate, the patterns of natural hazard and socio-economic dynamics in global and local scale. In this study, LULC changes are investigated by using of Remote Sensing and Geographic Information Systems (GIS) in Rize, North-East Turkey. For this purpose, firstly supervised classification technique is applied to Landsat images acquired in 1976 and 2000. Image Classification of six reflective bands of two Landsat images is carried out by using maximum likelihood method with the aid of ground truth data obtained from aerial images dated 1973 and 2002. The second part focused on land use land cover changes by using change detection comparison (pixel by pixel). In third part of the study, the land cover changes are analyzed according to the topographic structure (slope and altitude) by using GIS functions. The results indicate that severe land cover changes have occurred in agricultural (36.2%) (especially in tea gardens), urban (117%), pasture (-72.8%) and forestry (-12.8%) areas has been experienced in the region between 1976 and 2000. It was seen that the LULC changes were mostly occurred in coastal areas and in areas having low slope values.

DOI

44
Schilling K E, Jha M K, Zhang Y et al., 2008. Impact of land use and land cover change on the water balance of a large agricultural watershed: Historical effects and future directions. Water Resources Research, 44(7): 1-12. Available at: [Accessed October 8, 2014].

45
Shao Y, Fan X, Liu Het al., 2001. Rice monitoring and production estimation using multitemporal RADARSAT.Remote Sensing of Environment, 76(3): 310-325. doi: 10.1016/S0034-4257(00)00212-1.ABSTRACT Rice monitoring and production estimation has special significance to China, as rice is the staple grain and accounts for 42% of the crop production in this country. Radar remote sensing is appropriate for monitoring rice because the areas where this crop is cultivated are often cloudy and rainy. Synthetic Aperture Radar (SAR) is thus anticipated to be the dominant high-resolution remote sensing data source for agricultural applications in tropical and subtropical regions. It also provides revisit schedules suitable for agricultural monitoring. This paper presents the results of a study examining the backscatter behavior of rice as a function of time using multitemporal RADARSAT data acquired in 1996 and 1997. A rice-type distribution map was produced, showing four types of rice with different life spans ranging from 80 days to 120鈥125 days. The life span of a rice crop has significant impact on the yield, as well as on the taste and quality of the rice, with the longer growing varieties having the best taste and the highest productivity. The rice production of three counties and two administrative regions, totaling 5000 km2, was estimated in this study. The accuracy of the rice classification was found to be 91% (97% after postclassification filtering) providing confidence that multitemporal RADARSAT data is capable of rice mapping. An empirical growth model was then applied to the results of the rice classification, which related radar backscatter values to rice life spans. These life spans could then be used to sum up the production estimates, which were obtained from agronomic models already in use for rice by local agronomists. These models related the yield of rice to their life span based on empirical observations for each type of rice. The resulting productivity estimate could not be compared to any other existing data on yield production for the study-area, but was well received by the local authorities. Based on the studies carried out in the Zhaoqing test site since 1993, it is suggested that rice production estimates require three radar data acquisitions taken at three different stages of crop growth and development. These three growth stages are: at the end of the transplanting and seedling development period, during the ear differentiation period, and at the beginning of the harvest period. Alternatively, if multiparameter radar data is available, only two data acquisitions may be needed. These would be at the end of the transplanting and seedling development period, and at the beginning of the harvest period. This paper also proposes an operational scenario for rice monitoring and production estimation.

DOI

46
Shi J, Huang J, Zhang F, 2013. Multi-year monitoring of paddy rice planting area in Northeast China using MODIS time series data. Journal of Zhejiang University (Science B), 14(10) (October): 934-946. doi: 10.1631/jzus.B1200352.The objective of this study was to investigate the tempo-spatial distribution of paddy rice in Northeast China using moderate resolution imaging spectroradiometer(MODIS) data.We developed an algorithm for detection and estimation of the transplanting and flooding periods of paddy rice with a combination of enhanced vegetation index(EVI) and land surface water index with a central wavelength at 2130 nm(LSWI2130).In two intensive sites in Northeast China,fine resolution satellite imagery was used to validate the performance of the algorithm at pixel and 3脳3 pixel window levels,respectively.The commission and omission errors in both of the intensive sites were approximately less than 20%.Based on the algorithm,annual distribution of paddy rice in Northeast China from 2001 to 2009 was mapped and analyzed.The results demonstrated that the MODIS-derived area was highly correlated with published agricultural statistical data with a coefficient of determination(R2) value of 0.847.It also revealed a sharp decline in 2003,especially in the Sanjiang Plain located in the northeast of Heilongjiang Province,due to the oversupply and price decline of rice in 2002.These results suggest that the approaches are available for accurate and reliable monitoring of rice cultivated areas and variation on a large scale.

DOI PMID

47
Thi T, Nguyen H, De-Bie C A J Met al., 2012. Mapping the irrigated rice cropping patterns of the Mekong delta, Vietnam, through hyper-temporal SPOT NDVI image analysis.International Journal of Remote Sensing, 33(2): 415-434.Successful identification and mapping of different cropping patterns under cloudy conditions of a specific crop through remote sensing provides important baseline information for planning and monitoring. In Vietnam, this information is either missing or unavailable; several ongoing projects studying options with radar to avoid earth observation problems caused by the prevailing cloudy conditions have to date produced only partial successes. In this research, optical hyper-temporal Satellite Pour l'Observation de la Terre (SPOT) VEGETATION (SPOT VGT) data (1998鈥2008) were used to describe and map variability in irrigated rice cropping patterns of the Mekong delta. Divergence statistics were used to evaluate signature separabilities of normalized difference vegetation index (NDVI) classes generated from the iterative self-organizing data analysis technique algorithm (ISODATA) classification of 10-day SPOT NDVI image series. Based on this evaluation, a map with 77 classes was selected. Out of these 77 mapped classes, 26 classes with prior knowledge that they represent rice were selected to design the sampling scheme for fieldwork and for crop calendar characterization. Using the collected information of 112 farmers鈥 fields belonging to the 26 selected classes, the map produced provides highly accurate information on rice cropping patterns (94% overall accuracy, 0.93 Kappa coefficient). We found that the spatial distributions of the triple and the double rice cropping systems are highly related to the flooding regime from the Hau and Tien rivers. Areas that are highly vulnerable to flooding in the upper part and those that are saline in the north-western part of the delta mostly have a double rice cropping system, whilst areas in the central and the south-eastern parts mostly have a triple rice cropping system. In turn, the duration of flooding is highly correlated with the decision by farmers to cultivate shorter or longer duration rice varieties. The overall spatial variability mostly coincides with administrative units, indicating that crop pattern choices and water control measures are locally synchronized. Water supply risks, soil acidity and salinity constraints and the anticipated highly fluctuating rice market prices all strongly influence specific farmers鈥 choices of rice varieties. These choices vary considerably annually, and therefore grown rice varieties are difficult to map. Our study demonstrates the high potential of optical hyper-temporal images, taken on a daily basis, to differentiate and map a high variety of irrigated rice cropping patterns and crop calendars at a high level of accuracy in spite of cloudy conditions

DOI

48
Tou J T, Gonzalez R C, 1974. Pattern Recognition Principles. London: Addison-Wesley, 1974.

49
Tucker C J, 1979. Red and photographic infrared linear combinations for monitoring vegetation.Remote Sensing of Environment, 8: 127-150.The vegetation index, transformed vegetation index, and square root of the IR/red ratio were the most significant, followed closely by the IR/red ratio. Less than a 6% difference separated the highest and lowest of these four ER and red linear combinations. The use of these linear combinations was shown to be sensitive primarily to the green leaf area or green leaf biomass. As such, these linear combinations of the red and photographic IR radiances can be employed to monitor the photosynthetically active biomass of plant canopies.

DOI

50
Tucker C J, Vanpraet C L, Sharman M Jet al., 1985. Satellite remote sensing of total herbaceous biomass production in the Senegalese Sahel: 1980-1984.Remote Sensing of Environment, 17: 233-249.ABSTRACT NOAA-6 and NOAA-7 1-km and 4-km advanced very high resolution radiometer data were obtained at frequent intervals during the 1980, 1981, 1982, 1983, and 1984 rainy or growing seasons in the Sahel zone of northern Senegal. Above-ground herbaceous biomass clippings, visual estimates, and hand-held radiometer measurements of herbaceous vegetation were made during and at the conclusion of the rainy seasons for 4 of the 5 years. The satellite data were compared to sampled above-ground biomass data and the integral of the satellite data over time was compared to end-of-growing-season above-ground total dry biomass. A strong correlation between the integrated NOAA-7 satellite data and end-of-season above-ground dry biomass was found for ground samples collected over a 3-year period. The satellite data documented the highly variable precipitation regime in the Senegalese Sahel both within years and among years and suggest a direct method of monitoring Sahelian total herbaceous biomass production in areas where the percentage cover of woody species is less than 10%. Predicted average total dry biomass production was 1093 kg/ha for 1981, 536 kg/ha for 1982, 178 kg/ha in 1983, and 55 kg/ha in 1984 for the study area.

DOI

51
Usman M, Liedl R, Awan U K, 2015a. Spatio-temporal estimation of consumptive water use for assessment of irrigation system performance and management of water resources in irrigated Indus Basin, Pakistan.J. Hydrol. doi: 10.1016/j.jhydrol.2015.03.031.

52
Usman M, Liedl R, Kavousi A, 2015b. Estimation of distributed seasonal net recharge by modern satellite data in irrigated agricultural regions of Pakistan.Environ. Earth Sciences. doi: 10.1007/s12665-015-4139-7.Groundwater is inevitable for agricultural production in the Indus Basin of Pakistan. Its management on sustainable basis is only possible by careful appraisal of its recharge potential and dynamics. This study aimed at exploring pixel-based groundwater recharge at 1km 2 spatial resolution usingremote sensing data through water balance method. Moreover, spatially distributed groundwater abstractions are estimated by new approach with the aid of remote sensing data and results are compared with the conventional utilization factor method. Groundwater abstraction estimation from conventional utilization factor method overstates results both for kharif and rabi cropping seasons. Recharge results obtained from water balance method and water table fluctuation approach are comparable both at irrigation subdivision and 1 km 2 spatial scales. During the kharif cropping seasons, rainfall is the main source of recharge followed by field percolation losses while for rabi cropping seasons, canal seepage remains the major source. Net groundwater recharge is mainly positive during all kharif seasons. A gradual increase in groundwater level is observed in major parts of the study area. Improvement in results from water table fluctuation method is possible by better distribution and increased intensity of piezometers while for water balance approach, it is possible by adopting alternative buffer zones for canal seepage. Detailed sensitivity and uncertainty analyses of input/output variables are needed to present the results with confidence interval and hence to support sustainable and economical operation of irrigation system.

DOI

53
Usman M, Liedl R, Shahid M A M, 2014. Managing irrigation water by yield and water productivity assessment of a rice-wheat system using remote sensing.Journal of Irrigation and Drainage Engineering. doi: 10.1061/(ASCE)IR.1943-4774.0000732.Rice and wheat are very important grain crops and are heavily grown in lands between the Ravi and Chenab Rivers in Pakistan. Because rice is generally cultivated under standing water conditions, careful estimation of actual water consumption and crop water productivity (CWP) is key for proper water management. In the current study, an effort is made to estimate actual evapotranspiration (ET\da) by using the soil and energy balance algorithm (SEBAL), which used the moderate-resolution imaging spectroradiometer (MODIS) satellite with a spatial resolution of 1,000m. Rice and wheat crop dominance areas were identified by using the ISODATA crop classification technique by utilizing MODIS normalized difference vegetation index (NDVI) 250m resolution data. Crop-specific ET\da was masked out both for rice and wheat, and this information was utilized with crop yield for estimation of CWP. Tehsil administrative-level crop-yield data were collected and extrapolated to model crop yield on a pixel basis by benefiting from crop yields and specific NDVI empirical relationships. Study results showed a variation of ET\da (402-780 and 244-328mm), yield (823-2,596 and 1,287-3,646kg/ha), and CWP (0.14-0.56 and 0.54-1.44kg/m鲁) for rice and wheat, respectively. Best results were attained for rice in tehsil Hafizabad with a coefficient of variation in CWP of 7.94%. Most of the other tehsils showed higher variability of approximately 16%. The primary cause of lower CWP for rice crop in these tehsils is higher values of ET\da (i.e.,greater than 600mm), which is ideal for maximizing CWP in the study region. For the wheat crop, because water consumption is almost similar in all parts and CWP is primarily variable owing to yield differences, this suggested minimum scope for CWP improvement by water management for wheat. Crop cultivation expenditures can be reduced both for rice and wheat by proper application and management of water and fertilizer.

DOI

54
Wajid A, Ahmad A, Khaliq Tet al., 2010. Quantification of growth, yield and radiation use efficiency of promising cotton cultivars at varying nitrogen levels.Pakistan Journal of Botany, 42(3): 1703-1711.Cotton cultivars response to different doses of nitrogen for radiation interception, canopy development, growth and seed yield were studied in 2006. The experiment was laid out in randomized complete block design with split arrangement under the climatic conditions of Bahawalpur. Data on seed yield, total dry matter (TDM), leaf area index (LAI), fraction of intercepted radiation (Fi), accumulat...

DOI

55
Wajid A, Hussain K, Maqsood Met al., 2007. Simulation modeling of growth, development and grain yield of wheat under semi arid conditions of Pakistan.Pakistan Journal of Agricultural Sciences, 44(2): 194-199.

56
Wardlow B D, Egbert S L, Kastens J H, .

57
Wegehenkel M, 2009. Modeling of vegetation dynamics in hydrological models for the assessment of the effects of climate change on evapotranspiration and groundwater recharge.Adv. Geosci., 21: 109-115. doi: 10.5194/adgeo-21-109-2009.ABSTRACT Vegetation affects water balance of the land surface by e.g. storage of precipitation water in the canopy and soil water extraction by transpiration. Therefore, it is essential to consider the role of vegetation in affecting water balance by taking into account the temporal dynamics of e.g. leaf area index, rooting depth and stomatal conductance in hydrological models. However until now, most conceptual hydrological models do not treat vegetation as a dynamic component. This paper presents an analysis of the effects of the application of two different complex vegetation models combined with a hydrological model on the model outputs evapotranspiration and groundwater recharge. Both model combinations were used for the assessment of the effects of climate change on water balance in a mesoscale catchment loctated in the Northeastern German Lowlands. One vegetation model assumes a static vegetation development independent from environmental conditions. The other vegetation model calculates dynamic development of vegetation based on photosynthesis, respiration, allocation, and phenology. The analysis of the results obtained from both model combinations indicated the importance of taking into account vegetation dynamics in hydrological models especially if such models are used for the assessment of the impacts of climate change on water balance components.

DOI

58
Wilson M, Henderson-Sellers A, 1985. A global archive of land cover and soils data for use in general circulation models.Journal of Climatology, 5: 119-143.

59
Xiao X, Boles S, Frolking S et al., 2006. Mapping paddy rice agriculture in South and South-east Asia using multi-temporal MODIS images. Remote Sensing of Environment, 100: 95-113 ..

60
Yu L, Wang J, Gong P, 2013. Improving 30 m global land-cover map FROM-GLC with time series MODIS and auxiliary data sets: A segmentation-based approach.International Journal of Remote Sensing, 34(16): 5851-5867. doi: 10.1080/01431161.2013.798055.FROM-GLC (Fine Resolution Observation and Monitoring of Global Land Cover) is the first 30聽m resolution global land-cover map produced using Landsat Thematic Mapper (TM) and Enhanced Thematic Mapper Plus (ETM+) data. Due to the lack of temporal features as inputs in producing FROM-GLC, considerable confusion exists among land-cover types (e.g. agriculture lands, grasslands, shrublands, and bareland). The Moderate Resolution Imaging Spectrometer (MODIS) provides high-temporal frequency information on surface cover. Other auxiliary bioclimatic, digital elevation model (DEM), and world maps on soil-water conditions are possible sources for improving the accuracy of FROM-GLC. In this article, a segmentation-based approach was applied to Landsat imagery to down-scale coarser-resolution MODIS data (250 m) and other 1 km resolution auxiliary data to the segment scale based on TM data. Two classifiers (support vector machine (SVM) and random forest (RF)) and two different strategies for use of training samples (global and regional samples based on a spatial temporal selection criterion) were performed. Results show that RF based on the global use of training samples achieves an overall classification accuracy of 67.08% when assessed by test samples collected independently. This is better than the 64.89% achieved by FROM-GLC based on the same set of test samples. Accuracies for vegetation cover types are most substantially improved.

DOI

61
Zhao L, Xia J, Xu Cet al., 2013. Evapotranspiration estimation methods in hydrological models.J. Geogr. Sciences, 23(2): 359-369. doi: 10.1007/s11442-013-1015-9.Actual evapotranspiration is a key process of hydrological cycle and a sole term that links land surface water balance and land surface energy balance.Evapotranspiration plays a key role in simulating hydrological effect of climate change,and a review of evapotranspiration estimation methods in hydrological models is of vital importance.This paper firstly summarizes the evapotranspiration estimation methods applied in hydrological models and then classifies them into the integrated converting methods and the classification gathering methods by their mechanism.Integrated converting methods are usually used in hydrological models and two differences exist among them:one is in the potential evaporation estimation methods,while the other in the function for defining relationship between potential evaporation and actual evapotranspiration.Due to the higher information requirements of the Penman-Monteith method and the existing data uncertainty,simplified empirical methods for calculating potential and actual evapotranspiration are widely used in hydrological models.Different evapotranspiration calculation methods are used depending on the complexity of the hydrological model,and importance and difficulty in the selection of the most suitable evapotranspiration methods is discussed.Finally,this paper points out the prospective development trends of the evapotranspiration estimating methods in hydrological modeling.

DOI

62
Zheng P Q, Baetz B W, 1999. GIS-based analysis of development options from a hydrology perspective.Journal of Urban Planning and Development, 125: 164-180.This paper summarizes research that investigated a range of suburban development alternatives from an urban hydrology perspective. increasingly sustainable urban fringe design is characterized in this work by a mix of single family dwellings, semidetached dwellings, townhouses and apartments, a gridiron street pattern, smaller lot sizes, narrower streets, and significant open space. An analysis of a number of design scenarios based on the above characteristics was conducted for a representative urban fringe development application, with the aid of a storm water runoff simulation model (QUALHYMO) and geographical information sytstems software. Geographical information systems played an indispensable role in forming a connecting link between the spatial data and the simulation model, performing such tasks as watershed delineation, hydrologic parameter determination, location of developable areas, and presentation of design scenario applications. The rainfall and runoff model was used to simulate the peak how and total runoff volume of a regional storm under current and future land use conditions. The results show that increasingly sustainable designs with smaller total development areas can effectively reduce peak flows and total runoff volumes when compared with less sustainable designs. The results of this research will be of interest to municipal engineers and local decision makers who are considering the range of possible effects of development proposals on their communities.

DOI

Outlines

/