
Journal of Geographical Sciences >
Contamination and health risk assessment of heavy metals in road dust in Bayan Obo Mining Region in Inner Mongolia, North China
Received date: 2015-03-04
Accepted date: 2015-05-10
Online published: 2015-12-31
Supported by
National Natural Scientific Foundation of China, No.41571473, No.41401591
Copyright
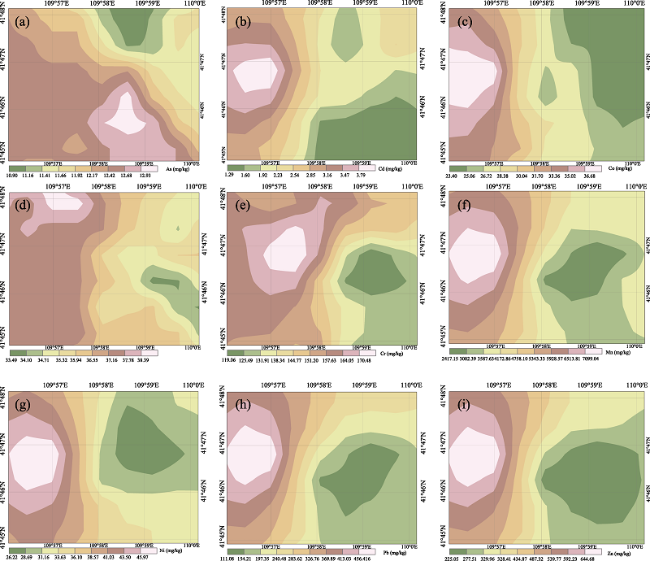
The objective of this study was to investigate the concentration and spatial distribution patterns of 9 potentially toxic heavy metal elements (As, Cd, Co, Cr, Pb, Cu, Zn, Mn, and Ni) in road dust in the Bayan Obo Mining Region in Inner Mongolia, China. Contamination levels were evaluated using the geoaccumulation index and the enrichment factor. Human health risks for each heavy metal element were assessed using a human exposure model. Results showed that the dust contained significantly elevated heavy metal elements concentrations compared with the background soil. The spatial distribution pattern of all tested metals except for As coincided with the locations of industrial areas while the spatial distribution of As was associated with domestic sources. The contamination evaluation indicated that Cd, Pb, and Mn in road dust mainly originated from anthropogenic sources with a rating of “heavily polluted” to “extremely polluted,” whereas the remaining metals originated from both natural and anthropogenic sources with a level of “moderately polluted”. The non-cancer health risk assessment showed that ingestion was the primary exposure route for all metals in the road dust and that Mn, Cr, Pb, and As were the main contributors to non-cancer risks in both children and adults. Higher HI values were calculated for children (HI=1.89), indicating that children will likely experience higher health risks compared with adults (HI=0.23). The cancer risk assessment showed that Cr was the main contributor, with cancer risks which were 2-3 orders of magnitude higher than those for other metals. Taken in concert, the non-cancer risks posed by all studied heavy metal elements and the cancer risks posed by As, Co, Cr, Cd, and Ni to both children and adults in Bayan Obo Mining Region fell within the acceptable range.
LI Kexin , LIANG Tao , YANG Zhiping , YANG Zhiping . Contamination and health risk assessment of heavy metals in road dust in Bayan Obo Mining Region in Inner Mongolia, North China[J]. Journal of Geographical Sciences, 2015 , 25(12) : 1439 -1451 . DOI: 10.1007/s11442-015-1244-1
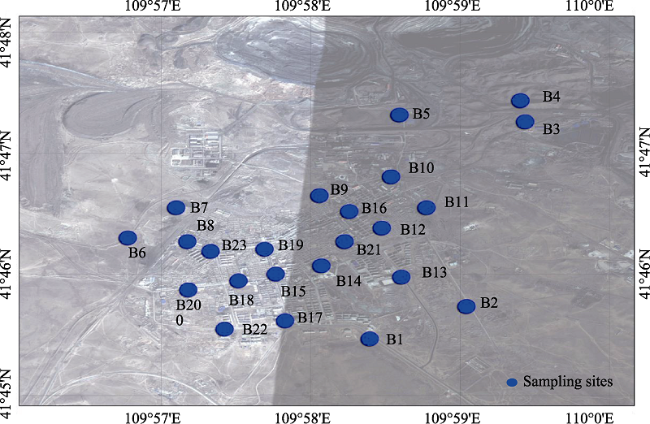
Figure 1 Map of the study area and sampling sites in Bayan Obo Mining Region (April 2014) |
Table 1 The classification of contamination levels based on the Igeo values |
| Igeo value | Class |
|---|---|
| Igeo ≤0 | Unpolluted |
| 0 < Igeo≤1 | Unpolluted/Moderately polluted |
| 1 < Igeo≤2 | Moderately polluted |
| 2 < Igeo≤3 | Moderately polluted/Strongly polluted |
| 3 < Igeo≤4 | Strongly polluted |
| 4 < Igeo≤5 | Strongly polluted/Extremely polluted |
| Igeo > 5 | Extremely polluted |


Table 2 Exposure factors |
| Factor | Definition | Value | Unit | Reference | |
|---|---|---|---|---|---|
| Adults | Children | ||||
| BW | Average body weight | 70 | 15 | kg | EPA, 1989 |
| IngR | Ingestion rate | 100 | 200 | mg·day-1 | EPA, 1989 |
| InhR | Inhalation rate | 20 | 7.6 | m3·day-1 | Zheng et al., 2010a |
| PEF | Particle emission factor | 1.36×10⁹ | m3·kg-1 | EPA, 2001 | |
| SA | Surface areas of the skin that contacts the airborne particulates | 5700 | 2800 | cm-2 | EPA, 2004 |
| SL | Skin adherence factor | 0.07 | 0.2 | mg·m-3 | |
| EF | Exposure frequency | 180 | 180 | days·year-1 | Zheng et al., 2010a |
| ED | Exposure duration | 24 | 6 | years | EPA,2001 |
| ET | Exposure time | 24 | hours·day-1 | ||
| AT (non-cancer risk) | Averaging time | ED×365 | days | ||
| AT (cancer risk) | Averaging time | 70×365 | days | ||
| ABS | Dermal absorption factor | 0.03 for As, 0.001 for other metals | - | EPA,2004 | |
| CF | Conversion factor | 1×10⁻⁶ | kg·mg-1 | ||
Table 3 The concentrations of heavy metals in road dust collected in Bayan Obo (April 2014, mg·kg-1) |
| Concentration | Maximum | Minimum | Mean | Geometric mean | Median | S.D. | Inner Mongolia B. |
|---|---|---|---|---|---|---|---|
| Cd | 4.63 | 1.21 | 2.20 | 2.05 | 1.83 | 0.90 | 0.037 |
| Co | 41.27 | 20.65 | 26.94 | 26.62 | 25.74 | 4.49 | 9.0 |
| Cr | 260.80 | 85.09 | 141.24 | 136.76 | 139.60 | 38.46 | 35.7 |
| Cu | 51.09 | 20.49 | 36.39 | 35.75 | 36.36 | 6.79 | 12.7 |
| Pb | 526.70 | 88.04 | 183.93 | 167.51 | 160.50 | 95.41 | 13.5 |
| Zn | 729.00 | 192.00 | 299.37 | 283.92 | 261.80 | 117.51 | 47.5 |
| As | 19.46 | 8.01 | 12.02 | 11.78 | 11.49 | 2.57 | 6.1 |
| Ni | 49.82 | 24.96 | 31.25 | 30.85 | 29.41 | 5.52 | 16.6 |
| Mn | 7956.00 | 1575.00 | 3407.30 | 3206.43 | 3172.00 | 1349.94 | 434.3 |
Table 4 The average concentrations of heavy metals in road dust in different areas (mg·kg-1) |
| Concentration | Cd | Co | Cr | Cu | Pb | Zn | As | Ni | Mn | Reference |
|---|---|---|---|---|---|---|---|---|---|---|
| Bayan Obo | 2.20 | 26.94 | 141.24 | 36.39 | 183.93 | 299.37 | 12.02 | 31.25 | 3407.30 | This study |
| Hangzhou | 1.59 | 19.96 | 51.29 | 116.04 | 202.16 | 321.40 | 25.88 | 509.56 | Zhang and Wang, 2009 | |
| Urumqi | 1.17 | 10.97 | 54.28 | 94.54 | 53.53 | 294.47 | 43.28 | 926.60 | Wei et al., 2009 | |
| Shanghai | 1.23 | 159.30 | 196.80 | 294.90 | 733.80 | 83.98 | Shi et al., 2008 | |||
| Baoji | 15.90 | 126.70 | 123.17 | 433.20 | 715.30 | 19.80 | 48.80 | 804.20 | Lu et al., 2009 | |
| Nanjing | 139.0 | 238.0 | 113.0 | 307.0 | 47.0 | 786.0 | Liu et al., 2014 | |||
| Inner Mongolia B. | 0.037 | 9.0 | 35.7 | 12.7 | 13.5 | 47.5 | 6.1 | 16.6 | 434.3 | Xu et al., 2004 Gao et al., 2007 |
| China B. | 0.07 | 11.2 | 53.9 | 20.0 | 23.6 | 67.7 | 11.2 | 23.4 | 482.0 | Xu et al., 2004 |
Figure 2 Map of the study area and sampling sites in Bayan Obo Mining Region (April 2014) |
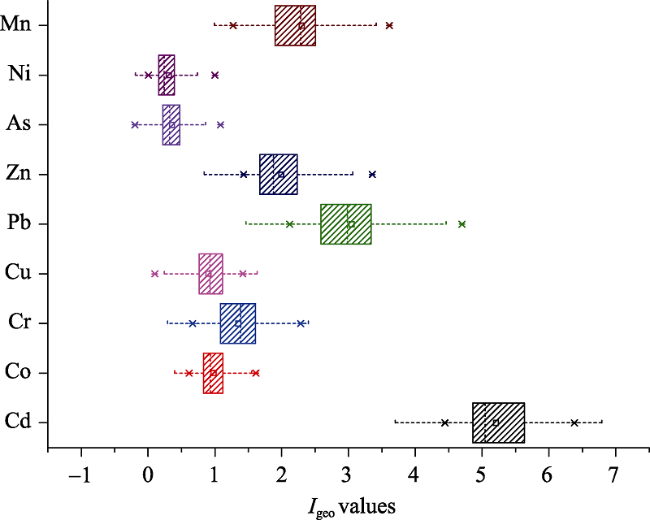
Figure 3 The Igeo value of heavy metals in road dust in Bayan Obo (April 2014) |
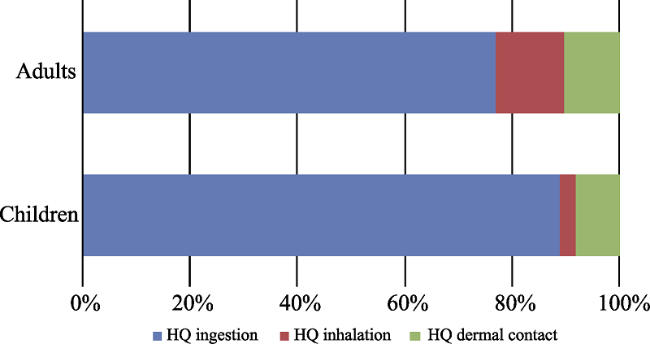
Figure 4 Non-carcinogenic risk distribution of different exposure ways for children and adults in Bayan Obo (April 2014) |
Table 5 The average Igeo values of heavy metals in road dust in different areas |
| Igeo | Cd | Co | Cr | Cu | Pb | Zn | As | Ni | Mn | Reference |
|---|---|---|---|---|---|---|---|---|---|---|
| Bayan Obo | 5.21 | 0.98 | 1.35 | 0.90 | 3.05 | 1.99 | 0.36 | 0.31 | 2.30 | This study |
| Hangzhou | 3.14 | 0.10 | -1.10 | 1.70 | 2.42 | 1.51 | -0.88 | -0.98 | Zhang and Wang, 2009 | |
| Urumqi | 0.80 | -0.30 | -0.10 | 0.40 | 0.30 | 0.50 | 0.00 | 0.00 | Wei et al., 2009 | |
| Shanghai | 2.65 | 0.50 | 2.19 | 2.94 | 2.54 | 0.84 | Shi et al., 2008 | |||
| Baoji | 1.79 | 3.19 | 2.58 | 3.04 | 0.17 | -0.21 | Lu et al., 2009 |
Table 6 The average EFs values of heavy metals in road dust collected in Bayan Obo (April 2014) |
| Cd | Cr | Cu | Pb | Zn | Co | As | Ni | Mn | |
|---|---|---|---|---|---|---|---|---|---|
| EF | 81.37 | 5.31 | 3.74 | 19.51 | 8.82 | 3.98 | 2.57 | 2.53 | 11.0 |
Table 7 HIs for each non-carcinogenic metal in road dust collected in Bayan Obo (April 2014) |
| C (95%UCL) | Oral RfD | Inhal RfD | Dermal RfD | HQ ingestion | ||
|---|---|---|---|---|---|---|
| Adult | Children | |||||
| Cd | 2.59 | 1.00E-03 | 1.00E-03 | 5.00E-05 | 1.82E-03 | 1.70E-02 |
| Cr | 157.87 | 3.00E-03 | 2.86E-05 | 6.00E-05 | 3.71E-02 | 3.46E-01 |
| Cu | 39.33 | 4.00E-02 | 4.02E-02 | 1.20E-02 | 6.93E-04 | 6.47E-03 |
| Pb | 225.19 | 3.50E-03 | 3.52E-03 | 5.25E-04 | 4.53E-02 | 4.23E-01 |
| Zn | 350.18 | 3.00E-01 | 3.00E-01 | 6.00E-02 | 8.22E-04 | 7.68E-03 |
| Ni | 33.63 | 2.00E-02 | 2.06E-02 | 5.40E-03 | 1.18E-03 | 1.11E-02 |
| Co | 28.88 | 2.00E-02 | 5.71E-06 | 1.60E-02 | 1.02E-03 | 9.49E-03 |
| As | 13.13 | 3.00E-04 | 3.01E-04 | 1.23E-04 | 3.08E-02 | 2.88E-01 |
| Mn | 3991.06 | 4.60E-02 | 1.43E-05 | 1.84E-03 | 6.11E-02 | 5.70E-01 |
| Sum | 1.80E-01 | 1.68E+00 | ||||
| HQ inhalation | HQ dermal | HI | ||||
| Adult | Children | Adult | Children | Adult | Children | |
| Cd | 2.81E-07 | 4.98E-07 | 1.52E-04 | 9.98E-04 | 1.98E-03 | 1.80E-02 |
| Cr | 5.71E-04 | 1.01E-03 | 7.39E-03 | 4.84E-02 | 4.50E-02 | 3.95E-01 |
| Cu | 1.01E-07 | 1.80E-07 | 1.00E-05 | 6.55E-05 | 7.03E-04 | 6.53E-03 |
| Pb | 6.98E-06 | 1.24E-05 | 1.27E-03 | 8.32E-03 | 4.66E-02 | 4.31E-01 |
| Zn | 1.34E-07 | 2.38E-07 | 1.82E-05 | 1.19E-04 | 8.41E-04 | 7.79E-03 |
| Ni | 1.65E-07 | 2.93E-07 | 1.71E-05 | 1.12E-04 | 1.20E-03 | 1.12E-02 |
| Co | 5.23E-04 | 9.27E-04 | 5.06E-06 | 3.32E-05 | 1.55E-03 | 1.05E-02 |
| As | 4.57E-06 | 8.11E-06 | 9.00E-03 | 5.90E-02 | 3.98E-02 | 3.47E-01 |
| Mn | 2.89E-02 | 5.13E-02 | 6.10E-03 | 3.99E-02 | 9.61E-02 | 6.62E-01 |
| Sum | 3.00E-02 | 5.32E-02 | 2.40E-02 | 1.57E-01 | 2.34E-01 | 1.89E+00 |
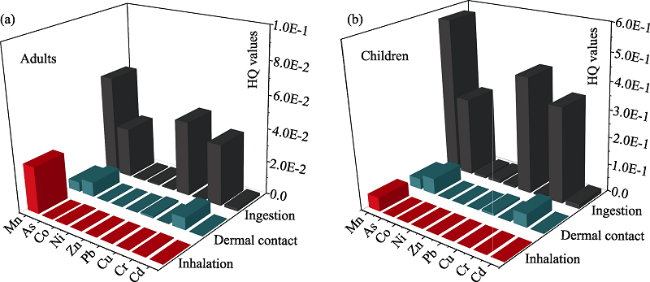
Figure 5 The HQs of each heavy metal in road dust in Bayan Obo for adults (a) and children (b) (April 2014) |
Table 8 Cancer risks for each carcinogenic metal in road dust collected in Bayan Obo (April 2014) |
| Cd | Cr | Ni | Co | As | |
|---|---|---|---|---|---|
| Inhal SF | 6.30E+00 | 4.20E+01 | 8.40E-01 | 9.80E+00 | 1.51E+01 |
| R | 8.37E-10 | 3.40E-07 | 1.45E-09 | 1.45E-08 | 1.02E-08 |
The authors have declared that no competing interests exist.
| 1 |
|
| 2 |
|
| 3 |
|
| 4 |
|
| 5 |
|
| 6 |
|
| 7 |
|
| 8 |
|
| 9 |
|
| 10 |
IARC (International Agency for Research on Cancer), 2014. Agents Classified by the IARC Monographs, Vol. 1-109.
|
| 11 |
|
| 12 |
|
| 13 |
|
| 14 |
|
| 15 |
|
| 16 |
Risk Assessment Guidance for Superfund .Volume I: Human Health Evaluation Manual, Part E: Supplemental Guidance for Dermal Risk Assessment. EPA/540/R/99/005, OSWER9285.7-02EP PB99-963312, 2004. Office of Superfund Remediation and Technology Innovation, U.S. Environmental Protection Agency Washington, D.C.
|
| 17 |
Risk Assessment Guidance for Superfund Volume I Human Health Evaluation Manual (
|
| 18 |
|
| 19 |
|
| 20 |
|
| 21 |
Supplemental Guidance for Developing Soil Screening Level for Superfund Sites. OSWER9355.4-24, 2001. Office of Solid Waste and Emergency Response, Environmental Protection Agency Washington, D.C.
|
| 22 |
Supplemental Guidance to RAGS: Calculating the Concentration Term. PB92-963373, 1992. Office of Solid Waste and Emergency Response, Environmental Protection Agency Washington, D.C.
|
| 23 |
|
| 24 |
|
| 25 |
|
| 26 |
|
| 27 |
|
| 28 |
|
| 29 |
|
| 30 |
|
| 31 |
|
| 32 |
|
| 33 |
|
/
| 〈 |
|
〉 |